1
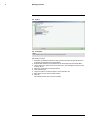
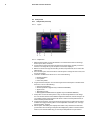
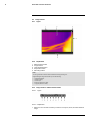
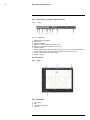
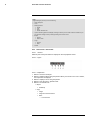
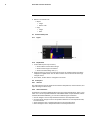
User’s manual
Flir R&D Software 3.3
User’s manual
Flir R&D Software 3.3
#T559132; r.5674/5676; en-US
iii
Table of contents
1
Legal disclaimer ................................................................................1
1.1
Legal disclaimer ....................................................................... 1
1.2
Copyright ................................................................................ 1
1.3
Quality assurance ..................................................................... 1
2
Notice to user....................................................................................2
2.1
User-to-user forums................................................................... 2
2.2
Training................................................................................... 2
2.3
Documentation updates.............................................................. 2
2.4
Software updates ...................................................................... 2
2.5
Important note about this manual .................................................. 2
2.6
Additional license information....................................................... 2
3
Customer help...................................................................................3
3.1
General .................................................................................. 3
3.2
Submitting a question................................................................. 3
3.3
Downloads .............................................................................. 3
4
New features in Flir R&D Software 3.3...................................................4
5
Installation........................................................................................5
5.1
System requirements ................................................................. 5
5.1.1 Required operating system ............................................... 5
5.1.2 Recommended camera models and camera software
releases ....................................................................... 5
5.1.3 Required hardware ......................................................... 5
5.2
Installation of Flir R&D Software 3.3 (Flir QuickPlot, Flir ResearchIR, Flir
ResearchIR Max) ...................................................................... 5
5.2.1 Installing from a DVD-ROM............................................... 5
5.2.2 Installing from a scratchcard ............................................. 6
6
Managing licenses .............................................................................7
6.1
Registering your product............................................................. 7
6.1.1 General........................................................................ 7
6.1.2 Figure .......................................................................... 7
6.1.3 Procedure..................................................................... 7
6.2
Activating your license................................................................ 7
6.2.1 General........................................................................ 7
6.2.2 Figure .......................................................................... 8
6.2.3 Activating Flir R&D Software 3.3 (Flir QuickPlot, Flir ResearchIR,
Flir ResearchIR Max) online.............................................. 8
6.2.4 Activating Flir R&D Software 3.3 (Flir QuickPlot, Flir ResearchIR,
Flir ResearchIR Max) by e-mail .......................................... 8
6.3
Transferring your license ............................................................. 9
6.3.1 General........................................................................ 9
6.3.2 Figure ........................................................................ 10
6.3.3 Procedure................................................................... 10
6.4
Activating additional software modules......................................... 10
6.5
Figure................................................................................... 11
6.6
Procedure ............................................................................. 11
7
Getting started ................................................................................ 12
7.1
Connecting a camera ............................................................... 12
7.1.1 General...................................................................... 12
7.1.2 Recommended camera models ....................................... 12
7.1.3 Procedure................................................................... 12
7.2
Adjusting a real-time image ....................................................... 12
7.2.1 General...................................................................... 12
7.2.2 Adjustment methods ..................................................... 12
7.2.3 Figure ........................................................................ 13
7.2.4 Procedure................................................................... 13
#T559132; r.5674/5676; en-US
v
Table of contents
7.3
7.4
7.5
7.6
Saving a real-time image as an image snapshot ............................. 13
7.3.1 General...................................................................... 13
7.3.2 Procedure................................................................... 13
Recording a real-time image as a sequence file ............................. 13
7.4.1 General...................................................................... 13
7.4.2 Procedure................................................................... 13
Locating sequence files or images .............................................. 13
7.5.1 Procedure................................................................... 13
Viewing sequence files or images ............................................... 14
7.6.1 General...................................................................... 14
7.6.2 Procedure................................................................... 14
8
Overview of screen elements ............................................................ 15
8.1
General ................................................................................ 15
8.2
Organize tab .......................................................................... 15
8.2.1 Figure ........................................................................ 15
8.2.2 Explanation................................................................. 15
8.3
Analyze tab............................................................................ 16
8.3.1 Analyze tab (overview)................................................... 16
8.3.2 Analyze tab > Camera tab .............................................. 17
8.3.3 Analyze tab > Camera tab .............................................. 18
8.3.4 Analyze tab > Camera tab > Settings ................................ 18
8.3.5 Analyze tab > Recording tab ........................................... 19
8.3.6 Analyze tab > Storage tab .............................................. 21
8.4
Image window ........................................................................ 22
8.4.1 Figure ........................................................................ 22
8.4.2 Explanation................................................................. 22
8.4.3 Image window > Measurement toolbar .............................. 22
8.4.4 Image window > Sequence recording toolbar...................... 23
8.4.5 Image window > Sequence playback toolbar....................... 24
8.5
Plot window ........................................................................... 24
8.5.1 Figure ........................................................................ 24
8.5.2 Explanation................................................................. 24
8.5.3 Plot window > Plot toolbar .............................................. 25
8.6
Profile window ........................................................................ 26
8.6.1 Figure ........................................................................ 26
8.6.2 Explanation................................................................. 26
8.6.3 Profile window > Profile toolbar........................................ 26
8.7
Zoom and Pan pane ................................................................ 27
8.7.1 Figure ........................................................................ 27
8.7.2 Explanation................................................................. 27
8.8
Scale pane ............................................................................ 27
8.8.1 General...................................................................... 27
8.8.2 About isotherms........................................................... 27
8.8.3 Figure ........................................................................ 28
8.8.4 Explanation................................................................. 28
8.9
Results pane.......................................................................... 29
8.9.1 General...................................................................... 29
8.9.2 Figure ........................................................................ 29
8.9.3 Explanation................................................................. 29
9
Recording sequence files ................................................................. 30
9.1
How to set the recording speed .................................................. 30
9.1.1 General...................................................................... 30
9.1.2 Procedure................................................................... 30
9.2
How to set a pre-recording ........................................................ 30
9.3
How to set a start trigger ........................................................... 30
#T559132; r.5674/5676; en-US
vi
Table of contents
9.4
9.5
9.3.1 General...................................................................... 30
9.3.2 Procedure................................................................... 31
How to set a stop trigger ........................................................... 31
9.4.1 General...................................................................... 31
9.4.2 Procedure................................................................... 32
How to set a post-recording....................................................... 32
10
Working with plots ........................................................................... 33
10.1
General ................................................................................ 33
10.2
Figure................................................................................... 33
10.3
Procedure ............................................................................. 33
11
Working with profiles ....................................................................... 34
11.1
General ................................................................................ 34
11.2
Figure................................................................................... 34
11.3
Procedure ............................................................................. 34
12
Exporting data................................................................................. 35
12.1
General ................................................................................ 35
12.2
Exporting image data ............................................................... 35
12.3
Exporting sequence data .......................................................... 35
12.4
Exporting plot data .................................................................. 35
12.5
Exporting profile data ............................................................... 35
13
Changing settings ........................................................................... 36
13.1
Changing the program settings................................................... 36
13.1.1 General...................................................................... 36
13.1.2 Procedure................................................................... 36
13.1.3 Explanation................................................................. 36
13.2
Changing object parameters...................................................... 36
13.2.1 Changing object parameters globally ................................ 36
13.2.2 Changing object parameters locally .................................. 37
14
Image processing filters ................................................................... 39
14.1
The Low-pass Filtering group..................................................... 39
14.2
The Noise Reduction group ....................................................... 39
14.3
The Pixel Operators group ........................................................ 39
14.4
The Temporal Filtering group ..................................................... 39
15
About Flir Systems........................................................................... 41
15.1
More than just an infrared camera ............................................... 42
15.2
Sharing our knowledge............................................................. 42
15.3
Supporting our customers ......................................................... 42
15.4
A few images from our facilities .................................................. 43
16
Glossary......................................................................................... 44
17
Thermographic measurement techniques........................................... 47
17.1
Introduction ........................................................................... 47
17.2
Emissivity.............................................................................. 47
17.2.1 Finding the emissivity of a sample .................................... 47
17.3
Reflected apparent temperature ................................................. 50
17.4
Distance ............................................................................... 50
17.5
Relative humidity. .................................................................... 50
17.6
Other parameters.................................................................... 50
18
History of infrared technology ........................................................... 52
19
Theory of thermography ................................................................... 55
19.1
Introduction ........................................................................... 55
19.2
The electromagnetic spectrum ................................................... 55
19.3
Blackbody radiation ................................................................. 55
19.3.1 Planck’s law ................................................................ 56
#T559132; r.5674/5676; en-US
vii
Table of contents
19.4
19.3.2 Wien’s displacement law ................................................ 57
19.3.3 Stefan-Boltzmann's law.................................................. 58
19.3.4 Non-blackbody emitters ................................................. 59
Infrared semi-transparent materials ............................................. 61
20
The measurement formula ................................................................ 62
21
Emissivity tables ............................................................................. 66
21.1
References............................................................................ 66
21.2
Tables .................................................................................. 66
#T559132; r.5674/5676; en-US
viii
1
Legal disclaimer
1.1 Legal disclaimer
All products manufactured by Flir Systems are warranted against defective materials and
workmanship for a period of one (1) year from the delivery date of the original purchase,
provided such products have been under normal storage, use and service, and in accordance with Flir Systems instruction.
Products which are not manufactured by Flir Systems but included in systems delivered
by Flir Systems to the original purchaser, carry the warranty, if any, of the particular supplier only. Flir Systems has no responsibility whatsoever for such products.
The warranty extends only to the original purchaser and is not transferable. It is not applicable to any product which has been subjected to misuse, neglect, accident or abnormal
conditions of operation. Expendable parts are excluded from the warranty.
In the case of a defect in a product covered by this warranty the product must not be further used in order to prevent additional damage. The purchaser shall promptly report any
defect to Flir Systems or this warranty will not apply.
Flir Systems will, at its option, repair or replace any such defective product free of charge
if, upon inspection, it proves to be defective in material or workmanship and provided that
it is returned to Flir Systems within the said one-year period.
Flir Systems has no other obligation or liability for defects than those set forth above.
No other warranty is expressed or implied. Flir Systems specifically disclaims the implied
warranties of merchantability and fitness for a particular purpose.
Flir Systems shall not be liable for any direct, indirect, special, incidental or consequential
loss or damage, whether based on contract, tort or any other legal theory.
This warranty shall be governed by Swedish law.
Any dispute, controversy or claim arising out of or in connection with this warranty, shall
be finally settled by arbitration in accordance with the Rules of the Arbitration Institute of
the Stockholm Chamber of Commerce. The place of arbitration shall be Stockholm. The
language to be used in the arbitral proceedings shall be English.
1.2 Copyright
© 2012, Flir Systems. All rights reserved worldwide. No parts of the software including
source code may be reproduced, transmitted, transcribed or translated into any language
or computer language in any form or by any means, electronic, magnetic, optical, manual
or otherwise, without the prior written permission of Flir Systems.
This documentation must not, in whole or part, be copied, photocopied, reproduced,
translated or transmitted to any electronic medium or machine readable form without prior
consent, in writing, from Flir Systems.
Names and marks appearing on the products herein are either registered trademarks or
trademarks of Flir Systems and/or its subsidiaries. All other trademarks, trade names or
company names referenced herein are used for identification only and are the property of
their respective owners.
1.3 Quality assurance
The Quality Management System under which these products are developed and manufactured has been certified in accordance with the ISO 9001 standard.
Flir Systems is committed to a policy of continuous development; therefore we reserve
the right to make changes and improvements on any of the products described in this
manual without prior notice.
#T559132; r.5674/5676; en-US
1
2
Notice to user
2.1 User-to-user forums
Exchange ideas, problems, and infrared solutions with fellow thermographers around the
world in our user-to-user forums. To go to the forums, visit:
http://www.infraredtraining.com/community/boards/
2.2 Training
To read about infrared training, visit:
• http://www.infraredtraining.com
• http://www.irtraining.com
• http://www.irtraining.eu
2.3 Documentation updates
Our manuals are updated several times per year, and we also issue product-critical notifications of changes on a regular basis.
To access the latest manuals and notifications, go to the Download tab at:
http://support.flir.com
It only takes a few minutes to register online. In the download area you will also find the
latest releases of manuals for our other products, as well as manuals for our historical
and obsolete products.
2.4 Software updates
Flir Systems regularly issues software updates and you can update the software using
this update service. Depending on your software, this update service is located at one or
both of the following locations:
• Start > Flir Systems > Flir R&D Software 3.3 > Check for updates.
• Help > Check for updates.
2.5 Important note about this manual
Flir Systems issues generic manuals that cover several software variants within a software
suite.
This means that this manual may contain descriptions and explanations that do not apply
to your software variant.
2.6 Additional license information
For each purchased software license, the software may be installed, activated, and used
on two devices, e.g., one laptop computer for on-site data acquisition, and one desktop
computer for analysis in the office.
#T559132; r.5674/5676; en-US
2
3
Customer help
3.1 General
For customer help, visit:
http://support.flir.com
3.2 Submitting a question
To submit a question to the customer help team, you must be a registered user. It only
takes a few minutes to register online. If you only want to search the knowledgebase for
existing questions and answers, you do not need to be a registered user.
When you want to submit a question, make sure that you have the following information to
hand:
• The camera model
• The camera serial number
• The communication protocol, or method, between the camera and your device (for example, HDMI, Ethernet, USB, or FireWire)
• Device type (PC/Mac/iPhone/iPad/Android device, etc.)
• Version of any programs from Flir Systems
• Full name, publication number, and revision number of the manual
3.3 Downloads
On the customer help site you can also download the following:
•
•
•
•
•
•
•
•
•
Firmware updates for your infrared camera.
Program updates for your PC/Mac software.
Freeware and evaluation versions of PC/Mac software.
User documentation for current, obsolete, and historical products.
Mechanical drawings (in *.dxf and *.pdf format).
Cad data models (in *.stp format).
Application stories.
Technical datasheets.
Product catalogs.
#T559132; r.5674/5676; en-US
3
4
New features in Flir R&D
Software 3.3
• Support for the Flir Systems HSDR (High Speed Data Recorder) hardware module.
This module makes it possible to record events at a very high speed, or at a lower
speed during a very long period of time. In neither situation are image frames lost (applies to Flir ResearchIR Max only).
• Support for sub-sequence editing. This feature lets you trim sequence files and save
only the portion of interest.
• Two new image-processing filters—Image stabilization and Threshold (applies to Flir
ResearchIR Max only).
• Support for triggering a recording using the serial port.
• Support for using an external frame when using frame subtraction filters.
#T559132; r.5674/5676; en-US
4
5
Installation
5.1 System requirements
5.1.1 Required operating system
One of the following:
•
•
•
•
•
Microsoft Windows XP Pro, with Service Pack 3 (SP3), 32 bit.
Microsoft Windows Vista, with Service Pack 1 (SP1), 32 bit.
Microsoft Windows Vista, with Service Pack 1 (SP1), 64 bit.
Microsoft Windows 7, 32 bit.
Microsoft Windows 7, 64 bit.
5.1.2 Recommended camera models and camera software releases
For a list of recommended and supported cameras, and camera software releases, go to
http://support.flir.com.
5.1.3 Required hardware
• Personal computer with an Intel 2 GHz MHz Pentium processor (dual core) or an AMD
Opteron, AMD Athlon 64, or AMD Athlon XP processor (dual core).
• 1 GB of RAM, or greater.
• 20 GB of available hard disk space.
• DVD-ROM drive.
• Support for DirectX 9 graphics with:
•
•
•
•
•
•
•
•
WDDM driver
128 MB of graphics memory (minimum)
Pixel Shader 2.0 in hardware
32 bits per pixel.
SVGA (1024 × 768) monitor (minimum, 1400 × 900 or higher recommended).
Internet access (fees may apply).
Audio output.
Keyboard and Microsoft mouse, or a compatible pointing device.
5.2 Installation of Flir R&D Software 3.3 (Flir QuickPlot, Flir ResearchIR, Flir
ResearchIR Max)
Note
•
•
•
•
•
You must be an Administrator or a user with Administrative Rights to install the program.
A complete installation consists of several subinstallations, some of which are from third-party vendors. Do not abort these subinstallations, as they are needed for the complete installation.
A complete installation may take up to 30 minutes to complete.
At a certain time during the installation, Microsoft warns repeatedly that the software has not passed
Windows Logo testing. In all cases, select Continue Anyway. There is no risk involved with this.
If you are asked to restart the computer during the installation, do so without removing the DVDROM. The installation will resume after you have restarted.
5.2.1 Installing from a DVD-ROM
If the software is delivered as a DVD-ROM, follow this procedure:
1. Close down all applications.
2. Insert the Flir R&D Software 3.3 (Flir QuickPlot, Flir ResearchIR, Flir ResearchIR Max)
software DVD-ROM into the DVD-ROM drive on the computer. The installation should
start automatically.
3. Should the installation not start automatically, start Windows Explorer and double-click
SETUP.EXE on the DVD-ROM.
4. During installation, follow the on-screen instructions. When asked for the license key,
type the key into the text box. The license key is printed on the back of the DVD-ROM
box.
#T559132; r.5674/5676; en-US
5
5
Installation
5.2.2 Installing from a scratchcard
If the software is delivered as a printed scratchcard, follow this procedure:
1. Point your browser to the website that is indicated on the scratchcard and download
the software. You can choose between two different downloads:
• A *.zip file. This file contains an *.iso image of the software that you can burn to a
DVD-ROM. To see the *.iso file you need to uncompress the *.zip file once it has
been downloaded.
• An *.exe file. This file contains a software installer. To start the installation, doubleclick the *.exe file once it has been downloaded.
2. During installation, follow the on-screen instructions. When asked for the license key,
scratch the license key field on the scratchcard, then type the key into the text box.
#T559132; r.5674/5676; en-US
6
6
Managing licenses
6.1 Registering your product
6.1.1 General
It is important that you register your product. By registering your product you are entitled
to:
• Free program updates.
• Free unlimited technical support at http://support.flir.com.
• Timely information about new releases.
6.1.2 Figure
6.1.3 Procedure
Note
Your computer needs to have Internet access during this procedure.
Follow this procedure:
To register your product, fill in the required fields and click Register.
6.2 Activating your license
6.2.1 General
The first time you start Flir R&D Software 3.3 (Flir QuickPlot, Flir ResearchIR, Flir ResearchIR Max) you will be able to choose one of the following options:
• Activate Flir R&D Software 3.3 (Flir QuickPlot, Flir ResearchIR, Flir ResearchIR Max)
online.
• Activate Flir R&D Software 3.3 (Flir QuickPlot, Flir ResearchIR, Flir ResearchIR Max)
by e-mail.
#T559132; r.5674/5676; en-US
7
6
Managing licenses
• Purchase Flir R&D Software 3.3 (Flir QuickPlot, Flir ResearchIR, Flir ResearchIR Max)
and receive a serial number for activation.
• Use Flir R&D Software 3.3 (Flir QuickPlot, Flir ResearchIR, Flir ResearchIR Max) for
free during an evaluation period.
6.2.2 Figure
6.2.3 Activating Flir R&D Software 3.3 (Flir QuickPlot, Flir ResearchIR, Flir
ResearchIR Max) online
Note
Your computer needs to have Internet access during this procedure.
Follow this procedure:
1. Start Flir R&D Software 3.3 (Flir QuickPlot, Flir ResearchIR, Flir ResearchIR Max).
2. In the web activation dialog box, select I have a Serial Number and I want to activate
Flir R&D Software 3.3 (Flir QuickPlot, Flir ResearchIR, Flir ResearchIR Max).
3. Click Next.
4. Enter your serial number, name, company and e-mail address. The name should be
that of the license holder.
5. Click Next.
6. Click Activate now. This will start the web activation process.
7. When the message Online activation was successful is displayed, click Close.
You have now successfully activated Flir R&D Software 3.3 (Flir QuickPlot, Flir ResearchIR, Flir ResearchIR Max).
6.2.4 Activating Flir R&D Software 3.3 (Flir QuickPlot, Flir ResearchIR, Flir
ResearchIR Max) by e-mail
Note
Your computer needs to have Internet access during this procedure.
Follow this procedure:
1. Start Flir R&D Software 3.3 (Flir QuickPlot, Flir ResearchIR, Flir ResearchIR Max).
2. In the web activation dialog box, click Activate the product by e-mail.
#T559132; r.5674/5676; en-US
8
6
Managing licenses
3. Enter your serial number, name, company and e-mail address. The name should be
that of the license holder.
4. Click Request Unlock Key by E-mail.
5. Your default e-mail client now opens and an unsent e-mail with the license information
is displayed.
Note
Send this e-mail without altering the content.
The main purpose of the e-mail is to send the license information to the activation
center.
6. Click Next. The program will now start and you can continue working while waiting for
the unlock key. You should receive an e-mail with the unlock key within two days.
7. When the e-mail with the unlock key arrives, start the program and enter the unlock
key in the text box. See the figure below.
6.3 Transferring your license
6.3.1 General
You can transfer a license from one computer to another computer, as long as you do not
exceed the number of purchased licenses on one computer at the same time.
This lets you use the software on, for example, a desktop and a laptop computer.
#T559132; r.5674/5676; en-US
9
6
Managing licenses
6.3.2 Figure
6.3.3 Procedure
Note
Your computer needs to have Internet access during this procedure.
Follow this procedure:
1. Start Flir R&D Software 3.3 (Flir QuickPlot, Flir ResearchIR, Flir ResearchIR Max).
2. On the Help menu, select Show license information. This will display the license viewer shown above.
3. In the license viewer, click Transfer license. This will display a deactivation dialog box.
4. In the a deactivation dialog box, click Deactivate.
5. On the computer to which you want to transfer the license, start Flir R&D Software 3.3
(Flir QuickPlot, Flir ResearchIR, Flir ResearchIR Max).
As soon as the computer gets Internet access, the license will be automatically
adopted.
Note
The adoption of licenses is based on a “first-come, first-serve” concept. This means that the first computer that gets Internet access automatically adopts the transferred license.
6.4 Activating additional software modules
6.1 General
For some software, you can purchase additional modules from Flir Systems. Before your
can use the module, you need to activate it.
#T559132; r.5674/5676; en-US
10
6
Managing licenses
6.5 Figure
6.6 Procedure
Note
Your computer needs to have Internet access during this procedure.
Follow this procedure:
1. Download and install the software module. Software modules are typically delivered
as printed scratchcards with a download link.
2. Start Flir R&D Software 3.3 (Flir QuickPlot, Flir ResearchIR, Flir ResearchIR Max).
3. On the Help menu, select Show license information. This will display the license viewer shown above.
4. Select the module that you have purchased.
5. Click Activation Key.
6. On the scratchcard, scratch the field to see the activation key.
7. Enter the key into the Activation Key text box.
8. Click OK.
The software module has now been activated.
#T559132; r.5674/5676; en-US
11
7
Getting started
7.1 Connecting a camera
7.1.1 General
You can connect a camera to your computer or your network using one of the following
methods:
• Ethernet.
• FireWire.
• USB.
Note
•
•
Your firewall may block access to the camera. If so, allow access. There is no risk involved with this.
Flir ResearchIR Max supports having more than one camera connected to the software at the same
time. However, a maximum of only four camera windows can be displayed on one camera tab. If you
want to add more cameras, you need to add them to additional camera tabs.
7.1.2 Recommended camera models
For a list of recommended and supported cameras, and camera software releases, go to
http://support.flir.com.
7.1.3 Procedure
Follow this procedure:
1. Connect the camera to your computer or network using one of the methods described
above.
2. Start Flir R&D Software 3.3 (Flir QuickPlot, Flir ResearchIR, Flir ResearchIR Max).
3. In the top left corner, click Select camera. This will display a list of available cameras.
4. On the list, select the camera that you want to connect.
5. In the top left corner, click Connect.
Note
When you start the program the next time, the most recently connected camera will be displayed in the
top left corner. To connect this camera, click Connect.
7.2 Adjusting a real-time image
7.2.1 General
You can adjust a real-time image using three different adjustment methods, and you may
need to try different methods to see which one suits your application the best.
7.2.2 Adjustment methods
You can choose between the following adjustment methods:
1. Auto: The image or sequence file is automatically adjusted to display the best image
brightness and contrast.
2. Min/max: The upper and lower temperature values are set explicitly, by using sliders
or entering values in text boxes.
3. Level/Span: The temperature level is set explicitly, by using sliders or entering values
in text boxes, and the span is set in the same way.
Note that methods 2 and 3 are identical with regard to what they do to the image or sequence file, but let you enter values in different ways.
#T559132; r.5674/5676; en-US
12
7
Getting started
7.2.3 Figure
7.2.4 Procedure
Follow this procedure:
1. Go to the Scale pane.
2. Do one of the following:
• Click
to auto-adjust the image.
• Double-click the horizontal color bar to auto-adjust the image.
• Manually enter values for Level/Span or Min/max.
7.3 Saving a real-time image as an image snapshot
7.3.1 General
You can save a real-time image as an image snapshot in *.jpg file format. For cameras
from Flir ATS (Flir Advanced Thermal Systems Division), image snapshots are saved as
*.ptw files.
7.3.2 Procedure
Follow this procedure:
1. To save the real-time image as an image snapshot, click the
cording toolbar.
button on the re-
7.4 Recording a real-time image as a sequence file
7.4.1 General
Prior to recording, you need to specify where you want to save your sequence files. You
do this on the Storage tab. When you have specified the path, the recorded sequence
files will be saved in this location.
7.4.2 Procedure
Follow this procedure:
1. Specify the Sequence and snapshot location on the Storage tab.
2. On the recording toolbar, click
.
3. To stop the recording, click
. The sequence file will now appear in the
Quick Collection pane at the bottom of the screen.
7.5 Locating sequence files or images
7.5.1 Procedure
Follow this procedure:
1. Click the Organize tab.
#T559132; r.5674/5676; en-US
13
7
Getting started
2. To locate your sequence file or image, use the file explorer in the same way as you
use Microsoft Windows Explorer. You can expand folders, select external drives, etc.
7.6 Viewing sequence files or images
7.6.1 General
This procedure assumes that sequence files or images have been added to the Quick
Collection pane.
7.6.2 Procedure
Follow this procedure:
1. In the Quick Collection pane, do one of the following:
• Move the sequence file or image to the image window by double-clicking it.
• Move the sequence file or image to the image window by using a drag-and-drop
operation.
• Move the sequence file or image to the image window by right-clicking it and selecting one of the following:
• Open image in the selected tab.
• Open image in a new tab.
You can now view or play the sequence file or image in the image window.
#T559132; r.5674/5676; en-US
14
8
Overview of screen elements
8.1 General
Many functions and tools have tooltips that display basic help information. To display the
tooltips, hold the cursor over the function or tool in question.
8.2 Organize tab
8.2.1 Figure
8.2.2 Explanation
1. Explorer pane: The explorer pane works in the same way as Microsoft Windows Explorer. You can expand folders, select external drives, etc.
2. File pane.
3. Buttons to change the file view:
• Thumbnails.
• Details.
• Filmstrip.
4.
• File information pane: Information about the selected file, such as its filename,
when it was created, and when it was modified.
• Camera information pane: Information about the camera from which the selected
file originates, such as the camera model, its lens, and its serial number.
• Parameters pane: Object parameters and their current values for the selected file.
#T559132; r.5674/5676; en-US
15
8
Overview of screen elements
8.3 Analyze tab
8.3.1 Analyze tab (overview)
8.3.1.1 Figure
8.3.1.2 Explanation
1. Measurement toolbar: You use this toolbar to add measurement tools to the image,
such as spots, lines, and areas.
2. Image window: This image window is where the image from the currently connected
camera, or an image file on your computer or network, is displayed.
3. Buttons to add more image window tabs, plot tabs, and profile tabs, and to select the
different tabs.
4. Zoom and Pan pane: You use the Zoom and Pan pane to change the zoom factor, and
to pan over images.
5. Controls to enable and/or select one or more of the following:
• Pixel interpolation.
• Color palette.
• Invert color palette.
6. Image enhancements pane: You use the Image enhancements pane to enable and/or
select one or more of the following:
•
•
•
•
•
Histogram equalization.
Plateau equalization (applies only to Flir ResearchIR Max).
Signal Linear.
Temperature Linear.
DDE (Digital Detail Enhancement; applies only to Flir ResearchIR Max).
7. Scale pane: You use the Scale pane to carry out various adjustments on the image.
You can choose between several different adjustment methods, and also assign a color to display portions of the image that lie above or below a set temperature level, or
inside a set temperature interval.
8. Image processing pane: You use the Image processing pane to enable and/or select
a number of image-processing filters. For an explanation of the filters, see 14 Image
processing filters, page 39
9. Results pane: The results pane displays the results of any measurement tools that
you have laid out in the image. This pane also displays the position of each measurement tool, and controls which way you want to plot temperatures in a plot window.
#T559132; r.5674/5676; en-US
16
8
Overview of screen elements
10. This pane displays parameters, such as focus, calibration, measurement range, and
image size.
11. Button to change the recording snapshot location.
12. Recording toolbar.
13. Recording snapshot location.
14. Quick Collection pane (also visible on the Organize tab): The Quick Collection pane is
a collection of shortcuts to the original files. Hence, the Quick Collection can contain
files that reside in different locations on your computer or network.
15. Live source control (also visible on the Organize tab): The live source control displays
a thumbnail of the image from the currently connected camera, together with the camera name.
8.3.2 Analyze tab > Camera tab
8.3.2.1 Figure
8.3.2.2 Explanation
1. Log pane: The log pane displays all events that occur during the time a camera is connected. You can clear the log, and also export the log data as an *.xml file (eXtensible
Markup Language: see http://www.w3.org/XML for more information).
2. Performance pane: The Performance pane displays the performance of the currently
connected camera. Here, you can review the frame rate, recording time, number of
stored and lost image frames, etc.
3. Extended information pane: The Extended information displays information about the
currently connected camera such as:
• Software version.
• Serial number.
• HW Article.
4. Measurement settings pane:
• Calibrate: Clicking Calibrate calibrates the camera.
• Autocalibrate: Selecting Autocalibrate regularly calibrates the camera
automatically.
• Measurement range: The various temperature ranges that can be selected.
• Image size: The image size in different pixel resolutions.
• Frame rate: The frame rate in frames per second.
5. Buttons to focus and autofocus the camera.
#T559132; r.5674/5676; en-US
17
8
Overview of screen elements
8.3.3 Analyze tab > Camera tab
Note
This section assumes that the HSDR (High Speed Data Recorder) hardware module has been activated
and connected. Note that each time a new camera is connected to an HSDR hardware module, the two
devices must be paired. Refer to the user documentation for the HSDR hardware module for instructions
on how to do this.
8.3.3.1 General
An HSDR hardware module is available from Flir Systems. This module makes it possible
to record events at a very high speed, or at a lower speed during a very long period of
time. In either situation no image frames will be lost.
When this module is connected to a camera that is connected to Flir ResearchIR Max, an
additional pane will be displayed at the bottom of the Camera tab.
8.3.3.2 Figure
8.3.3.3 Explanation
1. Button to start a recording through the HSDR hardware module.
2. Button to display an HSDR Record settings dialog box. For an explanation, see below.
8.3.4 Analyze tab > Camera tab > Settings
Note
This section assumes that the HSDR hardware module has been activated and connected. Note that
each time a new camera is connected to an HSDR hardware module, the two devices must be paired.
Refer to the user documentation for the HSDR hardware module for instructions on how to do this.
8.3.4.1 Figure
8.3.4.2 Explanation
1. Record Mode pane: In this pane the duration and stop conditions are set.
2. File Naming pane: In this pane the file naming conventions are set.
#T559132; r.5674/5676; en-US
18
8
Overview of screen elements
8.3.5 Analyze tab > Recording tab
8.3.5.1 Figure
8.3.5.2 Explanation
1. (Flir ResearchIR Max only)
Post-recording settings.
A post-recording is a defined number of image frames that are stored after the recording that an event has triggered. The image frames in a post-recording are retrieved
from a looping image buffer.
In many situations, a post-recording is necessary in order to carry out a successful
analysis of the recorded event. A post-recording also provides a full history of the
event that triggers the stop of the recording.
You set the post-recording as a time interval.
2. Controls to set the stop trigger:
• Date & Time.
• Duration.
• Conditional:
•
•
•
•
•
Image.Min.
Image.Average.
Image.StdDev.
Image.Span.
Image.Sum.
• Serial port.
• External trigger.
#T559132; r.5674/5676; en-US
19
8
Overview of screen elements
3. Controls to set the start trigger:
• Date & Time.
• Conditional:
•
•
•
•
•
Image.Min.
Image.Average.
Image.StdDev.
Image.Span.
Image.Sum.
• Serial port.
• External trigger.
4. (Flir ResearchIR Max only)
Pre-recording settings.
A pre-recording is a defined number of image frames that are stored before the actual
event that triggers the recording takes place. The image frames in a pre-recording are
retrieved from a looping image buffer.
In many situations, a pre-recording is necessary in order to carry out a successful
analysis of the recorded event. A pre-recording also provides a full history of the event
that triggers the start of the recording.
You set the pre-recording as a time interval.
5. Automatically rearm trigger: Select Automatically rearm trigger if you want the trigger
to be automatically rearmed after an event has been recorded.
6. Controls to set the recording speed:
• Camera frame rate: According to the camera frame rate.
• Time interval: According to the time interval between saved image frames.
This pane also displays horizontal bars relating to the available space for saved image
frames:
• The horizontal bar indicates the available space on your hard disk drive that you
can use to save image frames.
• The left icon indicates the same information, but as the number of image frames,
assuming that no settings are changed.
• The right icon indicates the same information, but in minutes, assuming that no
settings are changed.
Optimize for high speed: The process thread priority is set to time-critical, and memory buffers are allocated to prevent images being lost while recording is in progress.
#T559132; r.5674/5676; en-US
20
8
Overview of screen elements
8.3.6 Analyze tab > Storage tab
8.3.6.1 Figure
8.3.6.2 Explanation
1. Recording & snapshot location: This is the path to the folder where recordings and
snapshots will be saved. Manually type a path or navigate to the folder by clicking the
icon.
2. Generate folder: If you select Create subfolder and Generate folder, the program automatically generates subfolders according to various date formats.
3. Manually, enter name: If you select Create subfolder and Manually, enter name, you
will need to manually enter a subfolder name.
4. Create subfolder: If you select Create subfolder, a subfolder will be created according
to the settings in items 2 and 3 above.
5. Buttons that control filenaming conventions:
• Autonumbering.
• Date and time.
6. Filename prefix: Here, you can define an alphanumerical prefix that will be added to
all recorded filenames.
7. Save session data.
8. Buttons that control how the recorded files will be saved:
• Single file (*.seq).
• Multiple files (*.fff).
• *.ptw files (only supported for cameras from Flir ATS (Flir Advanced Thermal Systems Division).
#T559132; r.5674/5676; en-US
21
8
Overview of screen elements
8.4 Image window
8.4.1 Figure
8.4.2 Explanation
1.
2.
3.
4.
5.
Measurement toolbar.
Image window.
Close/minimize button.
Temperature scale.
Recording toolbar.
Note
You can go between a normal window and full screen by pressing F11.
Right-clicking the image window lets you do the following:
•
•
•
•
•
Change the palette.
Hide the overlay.
Create a plot.
Export (as pictures or data).
Copy (as pictures or data).
8.4.3 Image window > Measurement toolbar
8.4.3.1 Figure
8.4.3.2 Explanation
1. Select tool: You use this tool when you want to move spots, areas, and lines within an
image.
#T559132; r.5674/5676; en-US
22
8
Overview of screen elements
2. Spotmeter tool: You use this tool to create a spotmeter that you can put anywhere on
the image. The spotmeter and the temperature it displays will be stored with the image
when you save it. To move the spotmeter, use the Select tool to select the spotmeter
tool, then click-drag the tool.
3. Area tool: You use this tool to click-and-drag within the image to create an area. The
minimum and maximum temperatures in the area will be displayed in the measurement results table. To move the area, use the Select tool to select the area tool, then
click-drag the tool.
4. Circle/ellipse tool: You use this tool to click-and-drag within the image to create a
circle. The minimum and maximum temperatures in the area will be displayed in the
measurement results table. To move the circle, use the Select tool to select the circle
tool, then click-drag the tool.
5. Line/polyline tool: You use this tool to create a line within the image. The minimum and
maximum temperatures along the line will be displayed in the measurement results table. To move the line, use the Select tool to select the line tool, then click-drag the
tool.
6. Show/hide overlay graphics tool: You use this tool to display and hide the overlay
graphics that are associated with the image from the infrared camera.
7. Tool to rotate the image and measurement tools.
8. (and 9) Button and drop-down menu to save the image as a picture file or to export it
as a *.csv plain-text data file.
8.4.4 Image window > Sequence recording toolbar
8.4.4.1 Figure
Note
•
•
•
•
Row 1 shows what the toolbar looks like before the recording has started and before the trigger has
been armed.
Row 2 shows what the toolbar looks like before the recording has started and after the trigger has
been armed.
Row 3 shows what the toolbar looks like during recording.
Row 4 shows what the toolbar looks like before the recording has started.
8.4.4.2 Explanation
1. Arm/Disarm/Stop/Rec button.
2. Pause button.
3. Button to save a single snapshot as a *.jpg file (or a *ptw file for cameras from Flir ATS
(Flir Advanced Thermal Systems Division).
#T559132; r.5674/5676; en-US
23
8
Overview of screen elements
8.4.5 Image window > Sequence playback toolbar
8.4.5.1 Figure
8.4.5.2 Explanation
1.
2.
3.
4.
5.
6.
7.
Button to loop the playback.
Stop button.
Play/pause button.
Button to go back one image frame at a time.
Button to go forward one image frame at a time.
Duration counter.
Subsequence sliders. When the playback is paused, you can move these handles to
trim the sequence and save the portion of interest as a new sequence file.
8. Slider to move through the sequence file.
9. Duration counter.
8.5 Plot window
8.5.1 Figure
8.5.2 Explanation
1.
2.
3.
4.
Plot toolbar.
Plot.
Close/Minimize button.
Legend.
#T559132; r.5674/5676; en-US
24
8
Overview of screen elements
Note
Right-clicking the plot lets you do the following:
•
•
•
Show whole plot.
Clear.
Plotting method:
•
•
•
•
•
•
Options: Selecting Options will display a dialog box where you can create a title and subtitle for your
plot, and also change a variety of settings relating to the X and Y axes.
Export:
•
•
•
Picture.
Data to CSV.
Copy:
•
•
•
Points.
Line.
Area.
Points + Best Fit Line.
Picture.
Data.
Delete.
8.5.3 Plot window > Plot toolbar
8.5.3.1 General
Different parts of the plot toolbar are displayed in live and playback modes.
8.5.3.2 Figure
8.5.3.3 Explanation
1. Button to show the whole plot.
2. Button to display markers along the plot line. When you hold the cursor over a marker,
the temperature is displayed.
3. Button to display a cursor along the plot line.
4. Button to save the plot in *.plot file format.
5. Button to access file tools:
• Export:
• IR Bitmap.
• Copy:
• Image.
• Image and measurements.
• Data:
• Current frame.
#T559132; r.5674/5676; en-US
25
8
Overview of screen elements
8.6 Profile window
8.6.1 Figure
8.6.2 Explanation
1.
2.
3.
4.
Profile toolbar.
Profile.
Close/Minimize button.
Legend.
Note
Right-clicking the profile lets you do the following:
•
•
•
Show whole profile.
Options: Selecting Options will display a dialog box where you can create a title and subtitle for your
profile, and also change a variety of settings relating to the X and Y axes.
Export:
•
•
•
Copy:
•
•
•
Picture.
Data to CSV.
Picture.
Data.
Delete.
8.6.3 Profile window > Profile toolbar
8.6.3.1 General
Different parts of the profile toolbar are displayed in live and playback modes.
8.6.3.2 Figure
8.6.3.3 Explanation
1. Button to show the whole profile.
2. Button to display markers along the profile line. When you hold the cursor over a
marker, the temperature is displayed.
#T559132; r.5674/5676; en-US
26
8
Overview of screen elements
3. Button to access file tools:
• Export:
• Image.
• Data to CSV.
• Copy:
• Image.
• Data.
8.7 Zoom and Pan pane
8.7.1 Figure
8.7.2 Explanation
1. Toolbar buttons (from top to bottom):
• Zoom to fill the window with an image.
• Zoom to fit the image in the window.
• Zoom to the actual image size (1:1).
2. Preview window. If you have zoomed into an image, the excluded image area will be
displayed in a lighter shade. You can then move the zoomed-in area over the image
using the cursor.
3. Zoom factor, and the slider to change the zoom factor.
8.8 Scale pane
8.8.1 General
The scale pane lets you set maximum and minimum temperatures, create isotherms, and
adjust the image in various ways.
8.8.2 About isotherms
An isotherm is a function highlighting those parts of an image that fall above, below, or between one or more temperature intervals. In Flir R&D Software 3.3 (Flir QuickPlot, Flir ResearchIR, Flir ResearchIR Max), you can set four different types of isotherm:
• Interval: Assigns a color to temperatures between two set temperature levels.
• Inverted interval: Assigns a color to temperatures between two set temperature levels,
but color inverted.
• Above: Assigns a color to temperatures above a set temperature level.
• Below: Assigns a color to temperatures below a set temperature level.
#T559132; r.5674/5676; en-US
27
8
Overview of screen elements
8.8.3 Figure
8.8.4 Explanation
1. Types of isotherm colorization:
• Solid: A solid color will be applied to the defined temperature span.
• Contrast: A slightly transparent contrast color will be applied to the defined temperature span.
• Palette: A transparent palette color will be applied to the defined temperature
span.
2. Buttons to change the isotherm type (left to right):
•
•
•
•
Assigns a color to temperatures below a set temperature level.
Assigns a color to temperatures above a set temperature level.
Assigns a color to temperatures between two set temperature levels.
Assigns a color to temperatures between two set temperature levels, but color
inverted.
3. Sliders to do the following:
• Automatically adjust the image for the best brightness and contrast.
• Change the level (by dragging the slider).
• Change the span (by SHIFT-dragging the sliders).
The bottom markers indicate the area in the temperature scale where the defined isotherm color is displayed.
4. Text boxes to enter the following:
•
•
•
•
Min: Sets specific minimum temperature levels in the image.
Max: Sets specific maximum temperature levels in the image.
Level: Sets the temperature level of the image.
Span: Sets the temperature span of the image.
Note
These are four mutually exclusive methods to change the same temperature values.
5. Graphical representation of the temperature distribution.
6. Color chart to select a custom color.
#T559132; r.5674/5676; en-US
28
8
Overview of screen elements
8.9 Results pane
8.9.1 General
The Results pane displays results from the measurement tools laid out in the image.
8.9.2 Figure
Note
The figure below shows the results pane when an area has been laid out in the image or sequence file.
The results pane will look different when other measurement tools are laid out.
8.9.3 Explanation
1. Measurement results for the area.
2. General temperature information for the whole image.
3. Button to create a difference calculation (requires at least two measurement tools laid
out in the image).
4. X and Y positions of the measurement tool.
5. Width and height of the measurement tool.
#T559132; r.5674/5676; en-US
29
9
Recording sequence files
9.1 How to set the recording speed
9.1.1 General
Before you start your recording, you need to set the recording speed. The recording
speed is the number of frames per second that are saved in the file when you record a
sequence.
You can set the recording speed using two different methods:
• Changing the camera frame rate.
• Specifying a time interval between saved image frames.
9.1.2 Procedure
Follow this procedure:
1. Go to Analyze > Recording.
2. Do one of the following:
• Select a new frame rate in the drop-down menu.
• Specify a time interval between saved image frames.
In a few seconds you will see how the Actual frame rate under Performance will be updated to match the changed frame rate. Note that discrepancies may occur for higher
frame rates, due to some cameras not being able to deliver those frame rates.
9.2 How to set a pre-recording
A pre-recording is a defined number of image frames that are stored before the actual
event that triggers the recording takes place. The image frames in a pre-recording are retrieved from a looping image buffer.
In many situations, a pre-recording is necessary in order to carry out a successful analysis of the recorded event. A pre-recording also provides a full history of the event that triggers the start of the recording.
You set the pre-recording as a time interval.
9.3 How to set a start trigger
9.3.1 General
A start trigger sets the condition that starts the recording of an event, once the value of
the condition is met. In Flir R&D Software 3.3 (Flir QuickPlot, Flir ResearchIR, Flir ResearchIR Max) you can use the following types of start trigger:
• Date & Time: The recording is started at a set date and time.
• Conditional: The recording is started when a measurement value in the image falls
above or below a set value. This assumes that you have laid out at least one measurement tool in the image.
• Serial port: This trigger source option uses the CTS input line on a free COM port. The
COM port has an RS-232 electrical interface.
Trigger input using the COM port
DSUB-25
Transition low (<–3 V) to high (>+3 V) = trigger.
Pin 5: Trig Input.
Close pins 4 and 5 to trigger.
DSUB-9
Transition low (<–3 V) to high (>+3 V) = trigger.
Pin 8: Trig Input.
Close pins 7 and 8 to trigger.
Note
For a more detailed description of the electrical interface, read the RS-232 specification.
#T559132; r.5674/5676; en-US
30
9
Recording sequence files
• External trigger: Depending on the camera model, a dedicated input signal is available
to set the start trigger.
9.3.2 Procedure
Follow this procedure:
1. Go to Analyze > Recording.
2. Decide whether you want the trigger to be automatically rearmed after an event has
been recorded. If so, select Automatically rearm trigger.
3. In the Start Trigger drop-down menu, select one of the following, and enter values
(where applicable):
• Date & Time.
• Conditional:
•
•
•
•
•
Image.Min.
Image.Average.
Image.StdDev.
Image.Span.
Image.Sum.
• Serial port.
• External trigger.
4. (When all the start and stop trigger parameters are set.)
On the recording toolbar, click Arm. This arms the trigger, and the program is now
ready to start recording the event once the trigger condition is met.
9.4 How to set a stop trigger
9.4.1 General
A stop trigger sets the condition that stops the recording of an event, once the value of the
condition is met. In Flir R&D Software 3.3 (Flir QuickPlot, Flir ResearchIR, Flir ResearchIR
Max) you can use the following types of stop trigger:
• Number of frames: The recording is stopped after a set number of frames has been
recorded.
• Date & Time: The recording is stopped at a set date and time.
• Duration: The recording is stopped after a set time has elapsed since the recording
was started.
• Conditional: The recording is stopped when a measurement value in the image falls
above or below a set value. This assumes that you have laid out at least one measurement tool in the image.
• Serial port: This trigger source option uses the CTS input line on a free COM port. The
COM port has an RS-232 electrical interface.
Trigger input using the COM port
DSUB-25
Transition low (<–3 V) to high (>+3 V) = trigger.
Pin 5: Trig Input.
Close pins 4 and 5 to trigger.
DSUB-9
Transition low (<–3 V) to high (>+3 V) = trigger.
Pin 8: Trig Input.
Close pins 7 and 8 to trigger.
Note
For a more detailed description of the electrical interface, read the RS-232 specification.
• External trigger: Depending on the camera model, a dedicated input signal is available
to set the stop trigger.
#T559132; r.5674/5676; en-US
31
9
Recording sequence files
9.4.2 Procedure
Follow this procedure:
1. Go to Analyze > Recording.
2. In the Stop Trigger drop-down menu, select one of the following, and enter values
(where applicable):
•
•
•
•
Off.
Date & Time.
Duration.
Conditional
•
•
•
•
•
Image.Min.
Image.Average.
Image.StdDev.
Image.Span.
Image.Sum.
• Serial port.
• External trigger.
3. (When all the start and stop trigger parameters are set.)
On the recording toolbar, click Arm. This arms the trigger, and the program is now
ready to stop recording the event once the trigger condition is met.
9.5 How to set a post-recording
A post-recording is a defined number of image frames that are stored after the recording
that an event has triggered. The image frames in a post-recording are retrieved from a
looping image buffer.
In many situations, a post-recording is necessary in order to carry out a successful analysis of the recorded event. A post-recording also provides a full history of the event that
triggers the stop of the recording.
You set the post-recording as a time interval.
#T559132; r.5674/5676; en-US
32
10
Working with plots
10.1 General
A temperature plot is a graph that displays how temperature varies relative to time in a sequence file.
10.2 Figure
10.3 Procedure
Note
This procedure assumes that you have connected to a camera and that a live or recorded image is visible in the image window.
Follow this procedure:
1. Lay out a measurement tool in the image.
2. Right-click the measurement line, and select Plot and the measurement type that you
want to plot (typically the maximum, minimum, or average temperature). A plot will
now be displayed.
3. At this stage, you may want to do one of the following:
•
•
•
•
Copy the plot as a picture and paste it into a technical report, a white paper, etc.
Copy the plot as data.
Export the plot as a picture.
Export the plot as data in the CSV format.
#T559132; r.5674/5676; en-US
33
11
Working with profiles
11.1 General
A profile is a graph that displays how temperature varies relative to a line in an image.
11.2 Figure
11.3 Procedure
Note
This procedure assumes that you have connected to a camera and that a live or recorded image is visible in the image window.
Follow this procedure:
1. Lay out a measurement line in an image.
2. Right-click the measurement tool, and select Profile to create a new profile tab. A profile will now be displayed.
3. At this stage, you may want to do one of the following:
• Copy the profile as a picture and paste it into a technical report, a white paper,
etc.
• Copy the profile as data.
• Export the profile as a picture.
• Export the profile as data in the CSV format.
#T559132; r.5674/5676; en-US
34
12
Exporting data
12.1 General
You can export image, plot, and profile data in various ways. This section describes how.
12.2 Exporting image data
Follow this procedure:
1. Right-click an image and select Export > IR Bitmap. This will export the current image
as a *.bmp file.
12.3 Exporting sequence data
Do one of the following:
• Right-click an image and select Export > IR Bitmap. This will export the current image
as a *.bmp file.
• Right-click an image and select Export > AVI Video file. This will export the current image as an *.avi video file.
12.4 Exporting plot data
Do one of the following:
• Right-click a plot and select Export > Picture. This will export the current plot as a *.
bmp file.
• Right-click a plot and select Export > Data to CSV. This will export the current plot as a
*.csv file with the following columns:
•
•
•
•
•
Date.
Time.
Milliseconds.
Relative time.
Average temperature.
12.5 Exporting profile data
Do one of the following:
• Right-click a profile and select Export > Picture. This will export the current profile as a
*.bmp file.
• Right-click a profile and select Export > Data to CSV. This will export the current profile
as a *.csv file with the following columns:
• Index of markers.
• Temperatures of markers.
#T559132; r.5674/5676; en-US
35
13
Changing settings
13.1 Changing the program settings
13.1.1 General
You can change a variety of program settings that define the output data, temperature
units, language, etc.
13.1.2 Procedure
Follow this procedure:
1. On the main menu bar, click Options.
2. Do one of the following:
• To change the units, click the Units tab and do one of the following:
• To change the output data, select Raw count, Object signal, or Temperature.
• To change the temperature unit, select Celsius, Fahrenheit, or Kelvin.
• To change the start-up behavior, click the Application tab, and select Auto-connect to camera and/or Optimize for high speed.
• To define which serial port should be used when triggering a recording from a
camera, click the Application tab and select the port.
• To change the language, click the Language tab, and select a new language.
13.1.3 Explanation
• Raw count: The pixel value as delivered by the camera on the digital interface or as
saved in radiometric image files. No correction for object parameters is included. Depending on the camera model, drift compensation may also not be included.
• Object signal: A calibrated value proportional to the radiation from the object. This is
the detector signal corrected for drift, gain, and offset, including compensation for object parameters. The correct setting of object parameters (reflected apparent temperature, emissivity, object distance, relative humidity, and atmospheric temperature) is
assumed.
• Temperature: The blackbody temperature of the object when the calibration algorithm
based on Planck’s law is applied to the object signal.
13.2 Changing object parameters
13.2.1 Changing object parameters globally
13.2.1.1 General
For accurate measurements, you must set the object parameters. This procedure describes how to change the object parameters globally.
13.2.1.2 Atmospheric parameters pane.
• Atmospheric temperature: The temperature of the air between the camera and the object of interest.
• Relative humidity: The relative humidity of the air between the camera and the object
of interest.
• Transmission: The computed or fixed transmission through the atmosphere.
13.2.1.3 External optics pane.
• Temperature: The temperature of any protective windows, etc., that are set up between
the camera and the object of interest. If no protective window or protective shield is
used, this value is irrelevant.
• Transmission: The optical transmission of any protective windows, etc., that are set up
between the camera and the object of interest.
#T559132; r.5674/5676; en-US
36
13
Changing settings
13.2.1.4 Image object parameters pane.
• Emissivity: How much radiation an object emits, compared with the radiation of a theoretical reference object of the same temperature (called a ‘blackbody’). The opposite
of emissivity is reflectivity. The emissivity determines how much of the radiation originates from the object as opposed to being reflected by it.
• Distance: The distance between the camera and the object of interest.
• Reflected apparent temperature: Used when compensating for the radiation from the
surroundings reflected by the object into the camera. This property of the object is
called reflectivity.
13.2.1.5 Procedure
Follow this procedure:
1. Go to the Parameters pane.
2. Put the cursor in the white text box to the right of the parameter that you want to
change.
3. Type the new value and press the RETURN key.
13.2.1.6 Related topics
For in-depth information about parameters, and how to correctly set the emissivity and reflected apparent temperature, see 17 Thermographic measurement techniques, page 47.
13.2.2 Changing object parameters locally
13.2.2.1 General
When you change the object parameters, all the object parameters for the whole image
are changed.
However, in some situations you may want to change an object parameter for one measurement tool only. The reason for this could be that the measurement tool is in front of a
significantly more reflective surface than other surfaces in the image, or over an object
that is further away than the rest of the objects in the image, and so on.
13.2.2.2 Procedure
Follow this procedure:
1. Place at least one measurement tool in the image.
2. Right-click the tool and select Parameters. This will display the following dialog box.
3. Select Use local parameters.
#T559132; r.5674/5676; en-US
37
13
Changing settings
4. Do one of the following:
• Let the program calculate the emissivity. This requires knowledge of the temperature of the object in question.
• Enter a known value for the reflected apparent temperature.
• Enter a known value for the distance to the object.
Note
•
•
You can also change an object parameter locally by right-clicking the measurement result in the results pane.
Using the emissivity calculator requires that Data output is set to Kelvin, Celsius, or Fahrenheit under
Options.
13.2.2.3 Related topics
For in-depth information about parameters, and how to correctly set the emissivity and reflected apparent temperature, see 17 Thermographic measurement techniques, page 47.
#T559132; r.5674/5676; en-US
38
14
Image processing filters
In Flir ResearchIR Max, you can enable the following image processing filters.
14.1 The Low-pass Filtering group
Gaussian
Low-pass filtering with a Gaussian filter kernel. Sigma specifies the
shape of the Gaussian, and thereby the amount of smoothening.
Window
Average
Low-pass filtering by averaging the pixel values in a square window.
14.2 The Noise Reduction group
Median Filter
Replaces each pixel with the median pixel value from a surrounding
window.
Wiener Filter
Noise reduction filter based on pixel value statistics, named after
Norbert Wiener. The parameter Noise specifies the estimated noise
level in the image (range [0, 1]).
14.3 The Pixel Operators group
Exponential
The exponential of each pixel value (e to the power of the pixel
value).
Gain
Multiplies each pixel by a constant gain. Both positive and negative
gain values are allowed.
Image
Stabilization
This is a digital image stabilization filter, where the current frame is
stabilized against a reference frame. The algorithm is based on pixel
projection (Radon transform) along the x and y directions of highpass filtered frames. Sub-pixel accuracy is not considered.
Invert
Pixel values are inverted within the interval spanned by the input
image.
Natural
Logarithm
The natural logarithm of each pixel value.
Offset
Adds a constant offset to each pixel. Both positive and negative offset values are allowed.
Power
Each pixel value raised to the power of Pow.
Square root
The square root of each pixel value.
Threshold
The threshold filter changes pixel values depending on whether they
are less than or greater than the specified threshold. Pixel values
less than or greater than the threshold are set to the threshold value.
14.4 The Temporal Filtering group
Max —
Continuous
Each pixel is given the maximum pixel value found within previous
frames. All frames from the beginning of the sequence, or from the
last Reset, are included.
Max — Frame
interval
Each pixel is given the maximum pixel value found within a limited
set of previous frames. The number of frames is specified in Delay.
#T559132; r.5674/5676; en-US
39
14
Image processing filters
Min —
Continuous
Each pixel is given the minimum pixel value found within previous
frames. All frames from the beginning of the sequence, or from the
last Reset, are included.
Min — Frame
interval
Each pixel is given the minimum pixel value found within a limited set
of previous frames. The number of frames is specified in Delay.
Pixel Average
Each pixel is given the average pixel value of a number of previous
frames. The number of frames is specified in Depth.
Fixed
Subtraction
Derives the relative or absolute difference between the current frame
and a fixed reference frame. For the relative difference, the reference
frame is subtracted from the current frame. An external frame located
on, for example, a hard disk drive can be used.
Sliding
Subtraction
Derives the relative or absolute difference between the current frame
and a previous frame, specified by a frame delay. For the relative difference, the reference frame is subtracted from the current frame.
Weighted
Average
Each pixel is given a weighted average of a number of previous
frames. The number of frames is specified in Depth. The weight
curve can be either Gaussian, where the peak is centered over the
frame window, or Exponential, where the current frame has the highest weight, and the weight curve is decreasing towards 0 when approaching the specified Depth.
#T559132; r.5674/5676; en-US
40