1
USER'S GUIDE
Vaisala Observation Display
for AWS330
M211326EN-A
PUBLISHED BY
Vaisala Oyj
P.O. Box 26
FI-00421 Helsinki
Finland
Phone (int.): +358 9 8949 1
Fax:
+358 9 8949 2227
Visit our Internet pages at www.vaisala.com.
© Vaisala 2011
No part of this manual may be reproduced in any form or by any means, electronic or
mechanical (including photocopying), nor may its contents be communicated to a third
party without prior written permission of the copyright holder.
The contents are subject to change without prior notice.
Please observe that this manual does not create any legally binding obligations for
Vaisala towards the customer or end user. All legally binding commitments and
agreements are included exclusively in the applicable supply contract or Conditions of
Sale.
________________________________________________________________________________
Table of Contents
CHAPTER 1
GENERAL INFORMATION............................................................................ 3
About This Manual ................................................................... 3
Contents of This Manual ....................................................... 3
Version Information ............................................................... 4
Related Manuals ................................................................... 4
Documentation Conventions ................................................. 4
Recycling .................................................................................. 5
Trademarks ............................................................................... 5
License Agreement .................................................................. 5
Warranty.................................................................................... 5
CHAPTER 2
PRODUCT OVERVIEW.................................................................................. 7
Introduction .............................................................................. 7
Software Components ............................................................. 7
System Requirements and Restrictions ................................ 8
CHAPTER 3
INSTALLATION.............................................................................................. 9
Recommended Operating System Settings .......................... 9
Windows User Accounts ....................................................... 9
Operating System Updates ................................................... 9
System Time ....................................................................... 10
Power Options..................................................................... 10
Firewall and Virus Checking................................................ 10
Network Options.................................................................. 10
Keyboard ............................................................................. 11
Installation Procedure............................................................ 11
Preparing for Installation ..................................................... 11
Software Setup.................................................................... 11
Verification........................................................................... 12
After Installation ..................................................................... 12
Receiving Data from AWS .................................................. 12
Miscellaneous......................................................................... 14
Uninstallation....................................................................... 14
Command Prompt Setup Procedure................................... 14
CHAPTER 4
BASIC FEATURES ...................................................................................... 15
User Roles............................................................................... 15
General................................................................................ 15
Logging in as Observer ....................................................... 15
Data Collection ....................................................................... 16
VAISALA ________________________________________________________________________ 1
User's Guide ______________________________________________________________________
Observation Time Series .......................................................16
Main User Interface ................................................................17
Text Boxes, Text Labels, and Groups ..................................18
Text Box Settings ................................................................18
Alarms .................................................................................19
Text Label Settings..............................................................20
Graphs .....................................................................................20
Wind Display Element ............................................................22
Status Bar................................................................................23
View Menu Commands ..........................................................24
Settings................................................................................24
Terminal...............................................................................24
History Reports....................................................................25
Data Archive ........................................................................26
Event Log ............................................................................26
CHAPTER 5
ADMINISTRATOR'S GUIDE ........................................................................27
Administrator Role .................................................................27
Logging in as Administrator.................................................27
Changing Administrator Password ......................................27
Automatic Functionality.........................................................28
Background Service ............................................................28
User Interface ......................................................................28
Directory Structure.................................................................29
Installation Directory ............................................................29
Observations Directory........................................................29
Setup Files...............................................................................30
Layout Designer .....................................................................31
Editing Existing Layout ........................................................32
Adding and Deleting Display Elements ...............................33
Element Positions................................................................33
Fonts....................................................................................33
Configuration Settings...........................................................34
General Settings – Station ..................................................34
General Settings – Variables...............................................35
Application Settings – Communications ..............................36
Application Settings – Data Logging ...................................38
Application Settings – Data Transfer...................................39
Application Settings – Miscellaneous ..................................40
CHAPTER 6
TROUBLESHOOTING..................................................................................43
Troubleshooting Procedure ..................................................43
Problem Situations.................................................................44
Technical Support ..................................................................44
APPENDIX A
AWS330 CONFIGURATION ........................................................................45
Report Format .........................................................................45
2 ___________________________________________________________________ M211326EN-A
Chapter 1 ________________________________________________________ General Information
CHAPTER 1
GENERAL INFORMATION
This chapter provides general notes for the manual and the Vaisala
Observation Display software.
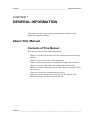
About This Manual
Contents of This Manual
This manual consists of the following chapters:
- Chapter 1 provides general notes for the Vaisala Observation Display
software.
- Chapter 2 gives an overview of the application.
- Chapter 3 gives instructions on setting up the application and the PC.
- Chapter 4 contains information for configuring the application.
- Chapter 5 includes instructions for real-time display, terminal window
and event log.
- Chapter 6 contains basic troubleshooting advice.
- Appendix contains instructions on how to use the software with
Vaisala Automatic Weather Station AWS330.
VAISALA ________________________________________________________________________ 3
User's Guide ______________________________________________________________________
Version Information
Table 1
Manual Code
M211326EN-A
Manual Revisions
Description
First version of this manual.
Related Manuals
Table 2
Manual Code
M211296EN
Related Manuals
Manual Name
Vaisala Automatic Weather Station AWS330
User's Guide
Documentation Conventions
Throughout the manual, important safety considerations are highlighted
as follows:
WARNING
Warning alerts you to a serious hazard. If you do not read and follow
instructions very carefully at this point, there is a risk of injury or even
death.
CAUTION
Caution warns you of a potential hazard. If you do not read and follow
instructions carefully at this point, the product could be damaged or
important data could be lost.
NOTE
Note highlights important information on using the product.
4 ___________________________________________________________________ M211326EN-A
Chapter 1 ________________________________________________________ General Information
Recycling
Recycle all applicable material.
Dispose of batteries and the unit according to statutory regulations. Do
not dispose of with regular household refuse.
Trademarks
Windows is a registered trademark of Microsoft Corporation in the
United States and/or other countries.
License Agreement
All rights to any software are held by Vaisala or third parties. The
customer is allowed to use the software only to the extent that is provided
by the applicable supply contract or Software License Agreement.
Warranty
For certain products Vaisala normally gives a limited one-year warranty.
Please observe that any such warranty may not be valid in case of
damage due to normal wear and tear, exceptional operating conditions,
negligent handling or installation, or unauthorized modifications. Please
see the applicable supply contract or Conditions of Sale for details of the
warranty for each product.
VAISALA ________________________________________________________________________ 5
User's Guide ______________________________________________________________________
This page intentionally left blank.
6 ___________________________________________________________________ M211326EN-A
Chapter 2 __________________________________________________________ Product Overview
CHAPTER 2
PRODUCT OVERVIEW
This chapter gives an overview of the application.
Introduction
Vaisala Observation Display is a PC software application intended for
displaying and storing meteorological and environmental measurement
data. The software can be used as a weather station data display.
Software Components
The software consists of two components:
- Observation Display background service, which starts automatically
whenever the host PC is started.
- User interface application, which can be opened from the Windows
Start menu or desktop icon.
The background service is transparent to the user. It handles all automatic
tasks: communications to the AWS, passing data to the user interface
process, validating and logging incoming data, and so on.
The user interface provides possibilities to monitor and configure data
processing. Having a separate background service process guarantees that
the user does not accidentally terminate data collection process by
closing the user interface.
VAISALA ________________________________________________________________________ 7
User's Guide ______________________________________________________________________
System Requirements and Restrictions
Vaisala Observation Display can be used with any of the following
Windows® operating systems: XP, 2003 Server, 2008 Server, Vista, and
Windows 7.
The PC should have at least 512 MB of free memory, a 2.0 GHz
processor, and a CD drive. The PC should have at least 512 MB of free
memory, a 2.0 GHz processor, and 10 MB of free hard disk space. Hard
disk space requirement depends on the amount of data to be stored in the
system.
Vaisala Observation Display is designed to support data collection from
one weather station only.
8 ___________________________________________________________________ M211326EN-A
Chapter 3 _______________________________________________________________ Installation
CHAPTER 3
INSTALLATION
This chapter helps you to install and configure the software and provides
a checklist for suggested operating system settings.
Recommended Operating System Settings
To guarantee the best operation, check the following settings from the
Control Panel before installing software. Please note that these settings
apply to the Window XP operating system. In other operating systems,
the instructions may be different.
Windows User Accounts
The application must be installed on a user account that has
administrative rights on the computer.
Administrative rights are only required during initial setup. After that, the
application can be operated by users who only have the default Windows
user level rights.
User Account Control (Windows Vista, Windows 7 only) should be set
to the "Never Notify" setting. Change the setting from User Accounts Change User Account Control Settings.
Operating System Updates
The software has been tested with the latest operating system versions at
the time of the shipping. However, future operating system updates might
conflict with the installed software version.
It is advisable to update the PC with the latest service packs before
running the setup procedure. If the computer is dedicated for data
collection only, it may be advisable to turn off automatic operating
system updates.
VAISALA ________________________________________________________________________ 9
User's Guide ______________________________________________________________________
System Time
It is recommended that you adjust the PC and the weather station clocks
to the same time zone. Usually, universal coordinated time (UTC) time is
used instead of local time in all meteorological reports. In this case, the
PC is set to UTC time zone, too.
If you wish to use local time in the PC and UTC time in the weather
station, please see section Graphs on page 20 for separate instructions on
how to adjust real-time graphs on the display.
Adjusting PC time zone:
1.
2.
From Control Panel, select Date and Time.
From the Time Zone tab, verify that the computer clock is set to
UTC time and that the daylight savings option is not selected.
Power Options
Power Options are under Control Panel. Check that the PC never turns
off hard disks, never enters standby state, and never goes to hibernation.
Firewall and Virus Checking
Anti-virus programs may interfere with the application. If this happens,
you should adjust the anti-virus programs so that the installation
directory is not checked.
If data is received via TCP/IP connection, the PC firewall should be
configured to allow communications to and from the weather station.
Network Options
Unless otherwise specified, use the default settings:
1.
2.
3.
4.
Select Network Connections.
Select Internet Protocol.
Click Properties.
In the dialog that opens, make sure that "Obtain IP address
automatically" has been selected. If your network administrator has
provided the PC with a specific IP address, subnet mask, and
default gateway, make sure that they are configured correctly.
10 __________________________________________________________________ M211326EN-A
Chapter 3 _______________________________________________________________ Installation
See also Chapter 5, Administrator's Guide, on page 27 regarding the
configuration and testing of communications with automatic weather
station.
Keyboard
If the computer keyboard contains special characters that do not appear
on the screen, select local keyboard from Control Panel - Regional and
Language Options - Languages - Details.
Installation Procedure
Preparing for Installation
Before you install the software, ensure that the AWS installation has
been completed. You should be able to connect to and receive data
messages from the AWS with terminal software (for example,
HyperTerminal).
Microsoft .Net Framework v. 3.5 should be installed on the computer.
Usually, this module comes with the operating system. If the module is
missing for some reason, installation of Vaisala Observation Display
fails. You can verify that the .Net Framework has been installed from the
Add/Remove Programs dialog in the Control Panel. In case that the
module is missing, the latest version can be set up from the installation
CD.
Check that the operating system uses the settings described in section
Recommended Operating System Settings on page 9.
Software Setup
Insert then Observation Display installation CD into the PC. Using
Windows Explorer, navigate into the setup directory. Double-click file
SetUp.msi to initiate the setup procedure.
The setup wizard guides you during the installation. Follow the
instructions of the wizard to complete the setup.
VAISALA _______________________________________________________________________ 11
User's Guide ______________________________________________________________________
Verification
Select All Programs - Vaisala - Observation Display from the Start
menu. The main application window should open on the screen. You
should also see the startup icon on the desktop.
Vaisala Background Service should be visible in the Control Panel Administrative Tools - Services pane.
After Installation
Receiving Data from AWS
The software is shipped with a default configuration that corresponds to
the generic weather station settings. However, the default configuration
may require setting the station-dependent parameters.
Below is a proposed task list of minimum post-installation configuration
steps.
1.
2.
3.
4.
Log in as administrator. From the main menu, select System - Log
In as Administrator. (See Chapter 5, Administrator's Guide, on
page 27.)
From the main menu, select View - Settings. A configuration
dialog opens. Select the Application tab and select sub-item
Communications from the left.
Depending on your AWS set-up, select either TCP/IP server,
TCP/IP client, or serial line protocol. Make sure that the
communications parameters match with the AWS settings. If the
AWS is sending data using TCP/IP, enable the TCP/IP server
option and enter the local IP address. If AWS is operating as
TCP/IP server, enter its IP address. If serial communications are
used, select serial port and line parameters.
Click the Save button to save the settings.
12 __________________________________________________________________ M211326EN-A
Chapter 3 _______________________________________________________________ Installation
1012-043
Figure 1
5.
6.
Communications Settings
From the left side list, select item "Miscellaneous". In the screen
that opens, select option "Open connection automatically." Click
Save and exit the dialog by clicking the Close button.
AWS data values should now appear on the main display. You
should also see the incoming messages on the terminal window;
select View - Terminal from the main menu. If necessary, adjust
the communications parameters.
VAISALA _______________________________________________________________________ 13
User's Guide ______________________________________________________________________
Miscellaneous
Uninstallation
Observation Display can be uninstalled using the Add or Remove
Programs dialog in the Windows Control Panel. Note that
uninstallation does not delete observation data files or application
configuration files. These are left into the installation directory. To make
a full uninstallation, you have to delete the files manually.
Command Prompt Setup Procedure
Alternatively, Observation Display can be uninstalled and installed using
the Windows command prompt.
The following command installs the application without any dialogs:
MSIEXEC.EXE /I C:\setup\SetUp.msi /QB- /LWAMOE C:\setup\install.log
ALLUSERS=1
The software is installed into the default directory using default settings.
It is assumed that the installation package has been copied into directory
C:\setup. A log of the installation is generated into the same directory.
The following command uninstalls the application silently without any
dialogs:
MSIEXEC.EXE /Q /x {95161421-79E0-4997-B14F-021C9C8A5D26}
The commands can be saved into a batch file, reducing work in mass
installations.
14 __________________________________________________________________ M211326EN-A
Chapter 4 ____________________________________________________________ Basic Features
CHAPTER 4
BASIC FEATURES
This chapter contains information for configuring the application.
User Roles
General
Vaisala Observation Display supports two separate user roles:
administrator and observer.
A user logged in as administrator can change all configuration settings
and use all functions in the application. The administrator role is
password-protected.
When the user is logged in as observer, the configuration settings cannot
be modified. Normally, users log in as observers because configuration
settings do not need to be modified after the initial installation.
Current user role is shown on the status bar at the lower right corner of
the main display.
Note that these user roles are internal to the Observation Display and are
not in any way related to the operating system user accounts.
Logging in as Observer
The observer role is activated by default at startup. To switch back from
administrator into the observer role without restarting the application,
select "Logout as administrator" from the System menu.
VAISALA _______________________________________________________________________ 15
User's Guide ______________________________________________________________________
Data Collection
Data collection is handled by a separate Windows background service
("Vaisala Observation Display Service"). The service starts automatically
whenever the computer is restarted, even if no one logs into Windows.
If the administrator has configured data collection to start automatically,
the background service opens the AWS connection and starts processing
data. When the Observation Display user interface is started, the
background service passes the AWS data to the user interface.
Observation Time Series
Each data message from the AWS contains one or more observation
variable values (for example, 1-minute average air temperature reading).
Observation Display displays the latest variable values and stores them
into ASCII files for later use.
The observation time is saved together with the value of the observation
variable. The observation time is set by the AWS.
The sequence of observation variable values forms an observation time
series. You can visualize the various time series using either the real-time
graph display or the View - History dialog.
Note that the observation values shown are not necessarily direct sensor
readings. Instead, they have been processed by the weather station.
By default, all variables are stored and displayed using the same
engineering unit that AWS uses. However, it is possible to define unit
conversions on the user interface (such as displaying wind speed in
knots).
16 __________________________________________________________________ M211326EN-A
Chapter 4 ____________________________________________________________ Basic Features
Main User Interface
A sample of the main user interface displaying the real-time data is
shown in Figure 2 below.
1012-044
Figure 2
Main User Interface
The following numbers refer to Figure 2 above:
1
2
3
4
5
=
=
=
=
=
Menu bar, which contains operating commands
Text section, which shows the latest measurement values
Graph section, which contains configurable graphs
Wind display component
Status bar, which displays UTC time, current user, and status of
the communications line
The display is highly configurable. An administrator user may
completely change the layout and all settings of display elements. An
observer user can modify some of the display settings.
VAISALA _______________________________________________________________________ 17
User's Guide ______________________________________________________________________
Text Boxes, Text Labels, and Groups
A text box displays the latest value of an observation variable. An empty
text box indicates that no data has been received. If AWS has been
unable to measure or calculate the value, a missing data symbol ('///') is
shown.
If measurement timeouts are being used, text boxes turn gray if no new
data is received within the timeout period.
If an alarm is active, the text box background is shown in yellow.
Text label is a fixed string shown on the screen. Text boxes and labels
have been organized into groups to help navigation within the display.
1012-045
Figure 3
Text Boxes (1), Labels (2), and Enclosing Group (3)
Text Box Settings
All text box configuration settings can be accessed by right-clicking the
mouse on the box. Note that some settings are available to the
administrator only.
1012-046
Figure 4
Text Box Settings
Variables: Selects the variable to display in the text box. Requires
logging in as administrator.
Unit: Configures automatic engineering unit conversion for the displayed
variable. Note that the conversion has only effect within the text box.
18 __________________________________________________________________ M211326EN-A
Chapter 4 ____________________________________________________________ Basic Features
Alarm: Configures a visual and/or audible alarm to take place whenever
the variable value exceeds the reset limits. Alarm configuration is
described in detail in section Alarms below.
Visible: Hides/shows the text box.
Show Date/Time: Configures text box to display either PC time or
observation time.
Alarms
You can enter the alarm configuration dialog by right-clicking a text box.
Alarm configuration dialog can be entered by right-clicking a text box
and selecting Alarm.
1012-047
Figure 5
Alarms Configuration
Up to three separate alarm conditions can be configured. If any of the
conditions set in the alarm is fulfilled, the alarm starts. Once none of the
conditions are met, the alarm stops.
An alarm is indicated in real-time display, by sound or in writing in the
event log.
VAISALA _______________________________________________________________________ 19
User's Guide ______________________________________________________________________
Text Label Settings
You can configure text labels by using the following pop-up menu:
1012-048
Figure 6
Text Label Settings
Enter Text: Changes the text shown in the label.
Visible: Hides/shows the text label.
Graphs
The real-time graph displays up to 48 hours of observation data. Each
graph can contain one to six time series. You can access all graph
settings by right-clicking the mouse. Note that some settings are available
to administrator only.
1012-049
Figure 7
Graph Settings
Variables: Selects the variables to display. The graph supports up to six
different variables.
Line Width: Width of the line that connects the measurement points.
Marker Size: Size of the marker dot on top of each measurement point.
Y-Axis: This setting allows you to adjust the Y-axis settings. The graph
supports both automatic and manual scaling. When automatic scaling is
used, the graph adjusts maximum and minimum values so that all data
values within the graph are visible. When manual scaling is used, you
can set maximum and minimum values.
The left and the right Y-axis can be configured to use different scales.
20 __________________________________________________________________ M211326EN-A
Chapter 4 ____________________________________________________________ Basic Features
1012-050
Figure 8
Example Y-Axis Configuration
X-Axis Length: Allows the user to manually set X-axis length.
Time Settings: Allows shifting of the measurement time (X-coordinate)
by a constant value. This setting can be used to display graph in local
time while having the AWS operate in UTC time. The setting only
affects the graph.
VAISALA _______________________________________________________________________ 21
User's Guide ______________________________________________________________________
Wind Display Element
The wind display module shows minimum, maximum, and average wind
values. The time span of the wind measurement (10 min/2 min/instant) is
user-selectable.
Wind display element may optionally contain a ship image (maritime
systems) or a runway image (airport/heliport systems).
1012-051
Figure 9
Wind Display
The following numbers refer to Figure 9 above:
1 = Average wind speed and direction in the center
2 = Minimum and maximum speed on the top left and right corners
3 = Minimum and maximum directions in the bottom left and right
corners
4 = Variations of 2-minute (inner arc) and 10-minute (outer arc) wind
direction values. Both variation arcs are always shown, regardless
of selected time span
5 = Wind direction arrow, which indicates the direction from which
the wind is blowing
22 __________________________________________________________________ M211326EN-A
Chapter 4 ____________________________________________________________ Basic Features
Status Bar
The status bar is shown at the bottom of the main screen. It contains
various status indicators.
1012-052
Figure 10
Status Bar
In the rightmost corner, the communications line status is shown. The
status turns green if the communications line is open and red if the
connection is closed. Note that the line may be open (the application has
connected to a PC serial port), but data may still be missing (AWS
cannot send data due to a power failure).
Line Protocol
TCP/IP Client
TCP/IP Server
Serial
Meaning of "Line Open"
Application has connected to external TCP/IP
server.
Application has started internal TCP/IP server and
is waiting for an external client to connect.
Application has connected to serial port.
To the left, the status bar indicates the role of the user (observer or
administrator). Next to the status bar, current UTC time is shown.
VAISALA _______________________________________________________________________ 23
User's Guide ______________________________________________________________________
View Menu Commands
Settings
Opens a window for setting configuration. Only available to an
administrator.
Terminal
The terminal window can be opened from the View menu. The window
shows the messages exchanged between the PC and the AWS.
In the bottom of the window, the AWS communications parameters are
shown. Note that these values can only be changed by the administrator,
from the Settings - General Settings - Communications display.
If the communication link to the AWS is closed, you can initiate it by
clicking the Start button. The connection should open within a few
seconds.
The connection remains open as long as you manually close it by
clicking the Stop button. If the connection is temporarily broken (for
example, the communications cable has been disconnected for a while), it
resumes automatically after a few seconds.
The administrator may configure the connection to open automatically
whenever Observation Display is started. Note that the terminal window
does not allow direct user-typed input from the keyboard.
The terminal menu settings are:
Connection - Connect. Opens a connection to the AWS.
Connection - Disconnect. Closes the AWS connection.
Connection - Capture. The submenu commands of Capture can be used
to make a capture log of the terminal window. These menu items only
become visible when the connection has been opened.
Command - Synchronize clocks. Immediately synchronizes AWS clock
with PC clock.
Command - Synchronize parameters. Sets the following AWS
parameters: station name, station altitude, and pressure sensor height.
Command - Reset AWS. Resets the AWS immediately.
24 __________________________________________________________________ M211326EN-A
Chapter 4 ____________________________________________________________ Basic Features
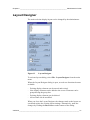
History Reports
Use the History command to make reports of the observation data.
1012-053
Figure 11
Creating History Report
When the History command is selected, a variable selection dialog is
shown. Select one or more variables, start and end time, and click the
Table or Graph button to generate a tabular or graphical report.
1012-054
Figure 12
Selecting Variables for History Report
Note that very large reports (more than 10 000 data points) may take a
long time to complete.
VAISALA _______________________________________________________________________ 25
User's Guide ______________________________________________________________________
Data Archive
Data archive is made of ASCII log files. Each log file contains AWS
variables that have been selected for the logging. Please see Chapter 5,
Administrator's Guide, on page 27 for data archive settings.
Event Log
The event log window displays the following events:
- Application start and stop
- AWS clock synchronization events
- System errors
Note that some special non-printing characters in the messages have been
replaced in the log by visible characters. ASCII 10 (line feed, new line) is
printed as '\r'. ASCII 13 (carriage return) is printed as '\n'.
The event log extends to one month backward in time. Older events are
overwritten.
26 __________________________________________________________________ M211326EN-A
Chapter 5 _______________________________________________________ Administrator's Guide
CHAPTER 5
ADMINISTRATOR'S GUIDE
This chapter provides you with information that is intended to help you
configure all the settings in the software.
Administrator Role
Logging in as Administrator
When the application is started, the user is automatically given the
observer role. From the System menu, select Log in as administrator.
Enter the password in the dialog that opens. Once the password has been
verified, you can access the configuration dialog (View - Settings).
NOTE
After the setup, the administrator password is empty.
NOTE
To always start the application under the administrator role, select Log in
as administrator automatically from View - Settings - Application Miscellaneous.
Changing Administrator Password
Only an administrator can alter the password. Enter a new password can
be entered from the System - Set Password menu item.
NOTE
If you forget the password, the application has to be reinstalled for you to
regain access as administrator.
VAISALA _______________________________________________________________________ 27
User's Guide ______________________________________________________________________
Automatic Functionality
While the background service handles most of the automatic
functionality of the application, the user interface contains some
automatic functions as well.
Background Service
The background service carries out following automated tasks:
-
Opening a connection to the AWS
Polling or listening to the incoming data
Parsing of AWS data messages, detection if valid message format
Usage of a correct AWS message parser
Monitoring of communications timeouts
Logging of AWS data into ASCII files
Transfer of data files to FTP/SFTP servers
Synchronization of AWS clock
Passing of AWS data to the main user interface
Passing of AWS data to the TCP clients (slave user interfaces)
Writing key events into application event log
Alarm management, recording alarms in the event log
User Interface
The user interface takes care of the following automated tasks:
- Display of data in real-time
- Saving screenshots of main display
- Alarm display
28 __________________________________________________________________ M211326EN-A
Chapter 5 _______________________________________________________ Administrator's Guide
Directory Structure
Installation Directory
By default, the application is installed in
C:\Program files\Vaisala\Observation Display. The installation directory
cannot be changed after the setup.
Under the installation directory, there are some subdirectories which may
be useful to the administrator.
Table 3
Installation Directory
Subdirectory
\TimeSeries
Description of Contents
This directory contains original data received
from the weather station. Graphs and text
boxes in the real-time display use data from
these files.
Monthly event log files.
Diagnostic event log files.
Directory of files waiting for transfer via
FTP/SFTP.
Observation Display configuration file.
\EventLog
\Diag
\Transfer
\Conf
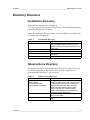
Observations Directory
The application can save observation data in various formats to be used
by external applications. By default, these optional output files are
generated under directory C:\Observations.
Table 4
Observations Directory
Subdirectory
\History
\History\Station
\History\Station\Year
\History\Station\Year\Month
\Latest
\LogGroups
Description of Contents
History subdirectory has subdirectories
named by station name and year and month
of observation. Each monthly subdirectory
contains daily data files. Daily data files
contain all observations saved in table
format. The first row contains variable
names, and the first column contains the
time stamp of the observation.
This directory contains files with only latest
data from the AWS.
This directory contains copies of log group
files.
VAISALA _______________________________________________________________________ 29
User's Guide ______________________________________________________________________
Setup Files
Observation Display uses a single setup file to load and save all of its
operational parameters. The setup file is located in the \Conf
subdirectory.
The administrator may reload the setup at any time by selecting File Load Setup from the main menu. Loading the setup will undo any
unsaved settings changes.
To save current settings into the setup file, you can use any of the
following:
-
Click the Save button in the View - Settings dialog.
Select File - Save or File - Save As from the main menu.
Open the Layout Designer dialog.
Close the application.
30 __________________________________________________________________ M211326EN-A
Chapter 5 _______________________________________________________ Administrator's Guide
Layout Designer
The main real-time display layout can be changed by the administrator.
1012-055
Figure 13
Layout Designer
To activate layout editing, select File - Layout Designer from the main
menu.
When the Layout Designer dialog is open, several new functions become
available:
- Existing display elements can be moved and resized.
- New display elements can be added to the screen. Elements can be
grouped using the group box.
- Existing display elements can be deleted.
- All text fonts can be modified.
When you close the Layout Designer, the changes made to the layout are
saved and replace the existing layout settings. Alternatively, undo the
changes by clicking the Reset button at the bottom of the dialog.
VAISALA _______________________________________________________________________ 31
User's Guide ______________________________________________________________________
Editing Existing Layout
When the Layout Designer is open, you can select any screen element for
editing by clicking. The selected element is shown with small handles
around it as shown in Figure 14 below.
1012-056
Figure 14
Editing Existing Layout
Move the selected element anywhere on the screen by dragging it with
the mouse. Resize the element by clicking on any of the handles and
dragging the mouse.
Select a group box to move all the contained elements at once.
Copying, cutting, and pasting can also be used. These are available in the
pop-up menus and in keyboard shortcuts.
If you press CTRL-C or CTRL-X when an element has been selected, it
can be copied or cut, respectively. CTRL-V pastes the element to a new
location.
When pasting the element, the element is placed in the center of the
screen. To paste an element into a group box, select the target group box
before pasting. The pasted element appears in the center of the group
box.
Elements within a group box cannot be dragged outside the group box.
You must cut or delete elements to move them out from a group box.
32 __________________________________________________________________ M211326EN-A
Chapter 5 _______________________________________________________ Administrator's Guide
Adding and Deleting Display Elements
There are two ways to add new display elements:
1.
2.
You can copy and paste existing elements on the screen.
You can select an element type from the Layout Designer and click
the Add button.
There are two ways to delete existing display elements:
1.
2.
Select the element and press the Delete button on the keyboard.
Select the element, right-click and select Delete from the pop-up
menu.
You can also delete all elements on the screen by clicking the Remove
All button on the Layout Designer.
Element Positions
The position and size of the selected element is shown in the bottom
section of the Layout Designer.
The positioning grid helps to align the elements to rows and columns. It
is possible to configure how elements are positioned and sized by
adjusting the grid size. When the grid is active, the elements "snap" to the
nearest grid position.
Fonts
When the Layout Designer is active, the pop-up menu of each element
allows the user to define the type of font to use with the element.
You can define common fonts for all label and text box elements using
the middle section of the Layout Designer.
VAISALA _______________________________________________________________________ 33
User's Guide ______________________________________________________________________
Configuration Settings
You can access all important configuration settings can be accessed from
the menu by selecting View - Settings. The configuration screen consists
of two main parts:
- General settings
- Application settings
To configure a general setting:
1.
2.
3.
Select the General tab on the left side of the screen.
Select the category (such as station or variables).
Select the setting item from the list on the right side of the screen.
Enter the new value in the box.
Note that all settings are taken into use when you close the dialog.
However, the settings are saved permanently only if you click the Save
button.
CAUTION
The default settings have been tested at factory to match the AWS
configuration. Use caution when changing the settings.
General Settings – Station
These parameters are related to the details of AWS name and location.
Station Name: Unique identifier of the station in the AWS message.
Altitude: Station altitude. This parameter is needed only if Observation
Display is calculating atmospheric pressure reduced to sea level.
Pressure Sensor Height: Vertical distance between the pressure sensor
and the station altitude. This parameter is needed only if Observation
Display is calculating atmospheric pressure reduced to sea level.
Wmo Block Number: WMO block number in the region where AWS is
located. This parameter is needed only if station has been registered to
WMO use.
Wmo Station Number: WMO identifier of the AWS. This parameter is
needed only if station has been registered to WMO use.
34 __________________________________________________________________ M211326EN-A
Chapter 5 _______________________________________________________ Administrator's Guide
Standard Pressure Level Indicator: Standard isobaric surface for
which the geopotential is reported from WMO code table 0264. This
parameter is needed only if station is generating WMO synoptic
messages.
General Settings – Variables
1012-057
Figure 15
General Settings – Variables
This section of parameters shows the data of the AWS variables. For
each variable, following columns are listed:
Name: Unique identifier for the variable in the AWS message.
Unit: Indicates either the unit of the variable or the WMO code table for
the variable (if applicable).
Min value: Minimum value for the AWS variable. This parameter is
used in the real-time display. Variables below this value can still be used
in the message generation.
Max value: Maximum value for the AWS variable. This parameter is
used in the real-time display. Variables above this value can still be used
in the message generation.
Description: Free description of the variable. This text appears in the
real-time display screen.
VAISALA _______________________________________________________________________ 35
User's Guide ______________________________________________________________________
Timeout: Time (in seconds) after which a user interface element (text
box, wind display element) indicates that variable is missing if no new
value has been received from the AWS. Note that the timeout should be
at least as long as is the interval between two AWS messages.
For unit conversions, see section Observation Time Series on page 16.
If data messages are received into the terminal window but values do not
show up in the main display, there may be a conflict between the weather
station and the application variable names. Check that the variable names
used by the system match to the names included in the incoming
message. If necessary, add new variables by clicking the Add button.
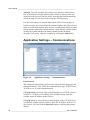
Application Settings – Communications
1012-058
Figure 16
Application Settings – Communications
Line Protocol
The communications dialog can be used to select the data input type and
related parameters. First, select the communications type: TCP/IP client,
TCP/IP server, or serial communications.
If Tcp/Ip client is selected, Observation Display uses a TCP/IP client to
connect to a TCP/IP server running at the weather station. Enter the
weather station IP address in the text box.
If Tcp/Ip server is selected, Observation Display starts a TCP/IP server
to which the weather station connects. Enter the IP address of the PC in
the text box. You can click the Detect IP button to find out the primary
address.
36 __________________________________________________________________ M211326EN-A
Chapter 5 _______________________________________________________ Administrator's Guide
If Serial port is selected, Observation Display connects to the selected
serial port. Note that virtual serial ports can also be used as long as the
operating system treats them as serial interfaces.
If the weather station sends data automatically, any of the three
communications types can be used. If data is to be polled, TCP/IP client
or serial communications should be used.
Next, you can fill in the details of each communication protocol.
Timeouts
In the center of the screen, you can activate two types of timeout
procedures:
- Measurement timeouts (see General Settings - Variables) can be
enabled to indicate missing variable values. The default timeout is 60
seconds for all variables.
- If Connection timeout is enabled, the application automatically
closes and re-opens the connection if no data at all has been received
from the AWS within the specified time. This setting should be
enabled at least in all TCP/IP-type connections.
Polling
Observation Display supports polling with two separate polling
commands. These should only be used if the weather station has been
configured to respond to commands by sending a data report back to the
PC.
Select Enable to activate a polling command. Type the poll command
into the Command box. Select the interval and the synchronization time
from the numeric display controls. Interval indicates the time period
interval in seconds between successive polling commands.
Synchronization time indicates the time after midnight when the first
command is sent.
VAISALA _______________________________________________________________________ 37
User's Guide ______________________________________________________________________
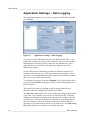
Application Settings – Data Logging
The application supports several ways to generate ASCII files from the
received data.
1012-059
Figure 17
Application Settings – Data Logging
Log groups can be utilized to store received data in ASCII files. A log
group may contain one or more AWS variables. The received variables
automatically saved into log files, under the \log subdirectory. Each
group has its own set of files. The application supports up to five
different log groups.
As the AWS may be transmitting variables at different intervals (for
example, wind message at 3 s intervals and general message at 1 min
interval), it is recommended that each log group only contains variables
that are received in the same message.
To configure log groups, first select Enabled. Next, add variables into a
group by clicking Select in the group table. From the dialog that opens,
select variables.
The log files are named according to the log group identifier and
date/time when the configuration settings were made.
The Interval setting defines how often variables are logged. By default,
every time a new variable is received, it is stored in the file. Choosing
another interval makes the application only store the variables after the
specified time. The interval setting uses 00:00 h as its synchronization
time. For instance, using 6 h interval would store data from the first
messages received after 00:00, 06:00, 12:00, and 18:00. The Span of log
file setting indicates how often a new log file is started.
38 __________________________________________________________________ M211326EN-A
Chapter 5 _______________________________________________________ Administrator's Guide
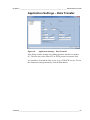
Application Settings – Data Transfer
1012-060
Figure 18
Application Settings – Data Transfer
This dialog contains settings for sending the latest data files to another
PC. The user may select either FTP or SFTP protocol to transfer files.
It is possible to forward the files to one or two FTP/SFTP servers. To test
the connection settings manually, click the Test button.
VAISALA _______________________________________________________________________ 39
User's Guide ______________________________________________________________________
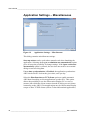
Application Settings – Miscellaneous
1012-061
Figure 19
Application Settings – Miscellaneous
This dialog contains miscellaneous settings.
Start-up actions can be used reduce manual work when launching the
application. Selecting the Log in as administrator automatically option
gives all users the possibility to change settings. If the Open connection
automatically option is selected, the user does not need to use terminal
dialog to start receiving data.
If Aws time synchronization is Enabled, the application synchronizes
AWS clock with PC clock at the given time, once per day.
Select the Distribute data to TCP clients option to enable automatic
AWS data forwarding to client applications on other PCs. This option
allows the possibility to use the Observation Display PC as a server
(master) into which the clients connect instead of having several clients
connecting to the AWS. Client applications may be Observation Display
setups or other TCP/IP clients (such as Telnet and terminal application).
40 __________________________________________________________________ M211326EN-A
Chapter 5 _______________________________________________________ Administrator's Guide
Clients must connect to the Observation Display PC at the port indicated
in the text box. For instance, to test a client Observation Display
connection from a client PC to a master PC:
1.
2.
3.
4.
Make sure that the master Observation Display is running
connected to the AWS and receiving data.
Select Distribute data to TCP clients on the master PC.
On the client PC, open Observation Display and configure master
PC IP address into the Settings - Data Acquisition - Ip Address.
Enter master data distribution port (by default, 42222) in the port
text box.
Save the client settings and select Connect from the terminal
window.
Data should appear on the client immediately after it has been received
on the server PC.
VAISALA _______________________________________________________________________ 41
User's Guide ______________________________________________________________________
This page intentionally left blank.
42 __________________________________________________________________ M211326EN-A
Chapter 6 ___________________________________________________________ Troubleshooting
CHAPTER 6
TROUBLESHOOTING
This chapter describes common problems, their probable causes and
remedies, and contact information for technical support.
Troubleshooting Procedure
When troubleshooting the product, write a problem report consisting of
the following issues:
- What failed (what worked/did not work)?
- Where did it fail (location and environment)?
- When did it fail (date, immediately/after a
while/periodically/randomly)?
- What was connected to the product and to which connectors?
- What was done when the failure was noticed?
VAISALA _______________________________________________________________________ 43
User's Guide ______________________________________________________________________
Problem Situations
Table 5
Some Problem Situations and Their Remedies
Problem
User cannot open
"Settings" menu.
Application cannot
connect to the AWS.
Data does not appear in
Vaisala Observation
Display or the external
terminal.
AWS data messages
can be seen in external
terminal (for example,
HyperTerminal) but no
data is visible in
Observation Display.
AWS data can be seen
in Observation Display
Terminal window but
some text boxes in the
main screen are left
empty.
AWS data is being
received by the
Observation Display but
graphs in the main
screen are left empty.
Probable Cause
Remedy
User has been logged in Log in as administrator
as observer.
(select System - Login
as Administrator).
Communications failure. 1. Check that IP address
and TCP port have been
correctly configured.
2. Close the application
and try to connect to the
AWS using a terminal
program that uses the
same TCP/IP settings.
3. Check that PC firewall
is not blocking the
connection.
Communications failure Check connection to
or AWS configuration
AWS and AWS
failure.
configuration.
Error in Observation
Display communications
settings or invalid AWS
message format.
Check communications
settings, check AWS
message.
TextBox configuration
error.
Select text box variable
from the pop-up menu.
AWS clock has different
time from PC time.
Synchronize AWS and
PC clocks. If AWS is
supposed to use
different time zone than
PC, adjust the graphs
using Time Settings
from the graph pop-up
menu.
Technical Support
For technical questions, contact the Vaisala technical support:
E-mail
[email protected]
Fax
+358 9 8949 2790
44 __________________________________________________________________ M211326EN-A
Appendix A _____________________________________________________ AWS330 Configuration
APPENDIX A
AWS330 CONFIGURATION
Vaisala Automatic Weather Station AWS330 is preconfigured, and there
is no need to make any configuration changes to take Observation
Display software into use.
Report Format
The report format used for communication between Observation Display
and the weather station is called SMSAWS. Lizard Setup Software
provides automated tools for generating reports in the correct format. On
some Lizard versions, you have to use the MetMan message template,
which is identical with SMSAWS format.
The following is an example of the SMSAWS report format:
(S:Station01;D:040607;T:182035;TA:61.12,0;RH:76.40;;DP:21.12;PA:1
008.42;PAA1:1007.35;PAX1:1008.23;PAM1:1005.90)
The format consists of elements having the following structure:
(S:STATIONID;D:YYMMDD;T:HHMMSS;TAG:value;TAG:value; ….
TAG:value)
- Left parenthesis marks the first character in the message.
- Right parenthesis marks the last character.
- Message body consists of pairs of variable identifiers (tags) and
values.
- There is a semicolon (;) between the (tag,value) pairs.
- There is no semicolon between the last (tag,value) pair and the closing
right parenthesis.
- Colon (:) separates tag and its value.
- First three (tag,value) pairs must contain station identifier, date, and
time.
- Remaining (tag,value) pairs may contain any variables in any order.
- Message may not contain the same tag twice.
- Tag "S" is reserved for station identifier.
VAISALA _______________________________________________________________________ 45
User's Guide ______________________________________________________________________
- Tag "D" is reserved for date, which must be in format YYMMDD.
The first two characters identify the year, the next two characters
identify the month, and the last two characters identify the day.
- Tag "T" is reserved for time, which must be in format HHMMSS.
First two characters identify the hour (24-hour format), next two
characters the minute and last two characters the second.
- There may be extra spaces, tab or newline characters anywhere within
the message.
46 __________________________________________________________________ M211326EN-A
www.vaisala.com
*M211326EN*