1
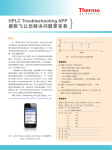
C H R O M ATO G R A P H Y
Cas e Stu dy
HPLC Troubleshooting 2.0—
How the HPLC Troubleshooting
App Saves on Time and Frustration
Holger Franz; Thermo Fisher Scientific, Germering, Germany
During the development of a new HPLC method, there were
unexpected results—all peaks, except for the injection peak,
were negative (Figure 1). Even with advances in chromatography
to eliminate problems, something unexpected is bound to
happen. How would you go about finding out what’s wrong?
Although the web is full of HPLC troubleshooting guides,
many of these are dozens of pages long.1,2,3 They can be
helpful in teaching systematic approaches to troubleshooting,
but when you need an answer fast, digging through these
resources to find what you need can be slow and tedious.
An alternative is using a poster, such as the Thermo Scientific
HPLC Troubleshooting Guide poster,4 where all troubleshooting
suggestions are available at a glance and a useful suggestion
can be found much faster.
An alternative for people with smart phones is the Thermo
Scientific™ HPLC Troubleshooting App for iPhone®, Android™,
and Windows® platforms. This mobile application incorporates
all the information from the HPLC troubleshooting poster, and
expands it to include electrochemical and nano LC solutions.
In combination with solutions for charged aerosol detection,
these additions make the troubleshooting app a comprehensive
tool for various system setups. This mobile application is
available for free at http://info1.thermoscientific.com/forms/
HPLC_Troubleshooting_App.
100
0
mAU
Introduction
-300
0
5
Minutes
Figure 1. Negative peaks during method development experiments.
System
• Thermo Scientific™ Dionex™ UltiMate™
3000 x2 Dual System including:
- SRD-3600 Solvent Rack with six
degasser channels
Conditions
Column:
Thermo Scientific Dionex
Acclaim™ 120, C18,5 μm,
4.6 × 100 mm
Standard:
Caffeine, anthracene,
and phenanthrene
(0.05 mg/mL) in 70% ACN
Eluents:
A: 0.1% Formic acid
in water
B: 0.1% Formic acid
in acetonitrile
Gradient:
Time (min)
%B
0.0
5.0
5.5
6.0
10.0
60%
90%
90%
60%
60%
- DGP-3600RS Dual-Gradient Pump
- WPS-3000TRS Thermostatted Wellplate
Sampler
- TCC-3000RS Thermostatted Column
Compartment
- DAD-3000RS Diode Array UV-Vis
Detector with analytical flow cell
• Thermo Scientific Dionex Chromeleon™
Chromatography Data System (CDS)
software version 7.1 SR1
• All modules were connected using 0.005 in.
(0.13 mm) i.d. Thermo Scientific Dionex
Viper™ Fingertight Fitting System
Flow:
1 mL/min
Column temp.:
30 °C
UV wavelength: 285 nm
UV bandwidth:
Figure 2. Thermo Scientific HPLC Troubleshooting App for iPhone, Android,
and Windows platforms.
10
4 nm
2
a)
b)
c)
d)
Figure 3. Generating probable cause using the Thermo Scientific HPLC Troubleshooting App.
Troubleshooting Case Study
Discussion of Possible Causes and Solutions
A Few Clicks to Find the Probable Cause
Using the problem of negative peaks described above, the HPLC
Troubleshooting App finds a solution as follows:
Negative peaks can be caused by the detector or by how the
detection signal is processed. Consequently, the different causes
are specific to the types of detectors. In this example, different
causes in combination with UV detection (variable wavelength,
VWD) or diode array detection (DAD), analog data acquisition,
fluorescence detection (FLD), charged aerosol detection (CAD) and
electrochemical detection (ECD) are listed, and demonstrate the
unique diversity of the Troubleshooting App.
• From the App’s home screen, select “Begin troubleshooting”
(Figure 3a).
• Because the issue is related to peaks, select “Peaks”
(Figure 3b).
• Choose “Negative peaks” (Figure 3c).
• The App lists five “Possible cause / Solution”
(Figure 3d), shown in Table 1.
Table 1. List of Possible Causes Generated by Troubleshooting App.
Possible Causes
1. Inappropriate reference wavelength setting (DAD)
2. Absorption/fluorescence of analyte is lower than mobile phase
3. Wrong polarization of analog output interface
In this example, results were obtained digitally by DAD. Possible
causes 3, 4, 5, and 6 in Table 1 relate to ECD, CAD, analog data
acquisition, and FLD, therefore, do not apply. This leaves two other
possible causes. Starting with cause 1: Inappropriate reference
wavelength setting (DAD), the Troubleshooting App shows that the
related solution for an inappropriate reference wavelength is (Figure 4),
The sample must not absorb in the range of the reference
wavelength. If possible, use a method without reference
wavelength.
4. Drainage spiking (CAD)
5. Fluorescence of the substance is quenched by matrix or
mobile phase (FLD)
6. Possible reduction occurring at electrode (ECD)
Figure 4. The App showing probable cause “Inappropriate reference wavelength
setting (DAD)”, with the solution. Also note the App has the ability to share the
solution with a colleague and links if you want to learn more.
100
mAU
Did You Know?
0
0
5
Minutes
10
Figure 5. Obtaining the chromatogram without reference (Reference Off)
displays the peaks in a normal way and removes side effects such as baseline
drift and injection peak.
In a UV-Vis DAD, you can select both a reference and a detection
wavelength. When used correctly, the reference signal corrects
for changing conditions such as baseline drift. If the reference
wavelength is not chosen correctly and absorbs in the range of
your analyte, then you may get a negative response. (See the sidebar
Did You Know? for more information.)
How Reference and Detection Wavelengths Work
Reference Wavelength
The reference wavelength is intended to correct for (subtract)
absorption that can occur from changes in conditions during analysis.
Those changes can sometimes be significant, such as if there is a
reduction in the lamp energy (lamp drift). The reference wavelength
selected therefore must be in a quiet area of the spectrum where little
to no absorption of the sample analytes occurs. Because the signal
from the reference wavelength is subtracted from the signal received
from the detection wavelength, it has a direct impact on results.
Reference Bandwidth
Reference bandwidth serves to average several photodiode signals
above and below the reference wavelength. A reference bandwidth
should be selected as wide as possible, for example 30–100 nm, but
narrow enough not to interfere with the absorption spectrum of the
analytes. Figure 6 below visualizes appropriate reference settings for
a butylparabene spectrum.
In this case study, the reference and detection wavelengths for the
analysis of butylparabene were selected incorrectly.
• With a reference wavelength of 240 nm and a bandwidth of 100 nm,
the reference absorption was taken from 190 nm to 290 nm.
• With a detection wavelength of 285 nm and a bandwidth of 4 nm,
detection absorption was taken from 283 nm to 287 nm.
The range of the reference indeed overlaps in the range of analyte
detection, making this the probable cause for negative peaks. To
verify that this is cause, the reference wavelength can be switched
to “off”. “Reference off” is actually the recommended operation of
Thermo Scientific Diode Array Detectors mainly to avoid implications
with incorrect reference settings. The resulting chromatogram
(Figure 5) shows that this change immediately solves the issue of
negative peaks.
Note that the positive injection peak and the baseline drift are now
gone. Both were caused by the absorption of formic acid as part
of the mobile phase, affecting wavelengths below 260 nm. The
injection peak was positive as the sample diluent lacks formic acid
and therefore absorbed less than the mobile phase. With the initial,
improper reference wavelength settings, the negative peak was
inverted and shown as a positive peak.
The next step after finding this resolution would be to optimize
UV-Vis/reference wavelengths and bandwidths.
Conclusion
A solution is just a few taps away; select your problem and the
Troubleshooting App guides you to the answer. Comprehensive in its
inclusion of specific technologies such as fluorescence detection,
charged aerosol detection, electrochemical detection, and nano LC,
this powerful, free tool effectively diagnoses various potential issues
with HPLC analysis. A Share function even lets you send the solution
to your team. Simply check the troubleshooting solution of interest
and select share, and enter the email address from your contacts list.
Figure 6. Butylparabene spectrum with recommended reference
wavelength settings.
UV-Vis Detection Wavelength
In contrast to the reference wavelength, the UV-Vis detection channel
wavelength for recording the analyte absorption should be set to the
absorbance maxima of the analytes of interest.5
Download your Free HPLC Troubleshooting App
The App is available for iPhone, Android, and Windows phones, free
at http://info1.thermoscientific.com/forms/HPLC_Troubleshooting_App
or scan this quick response (QR) code to download the App:
3
References
1. Successful HPLC Operation – A Troubleshooting Guide – Version 1.1, Thermo Electron Corporation, 2004.
2. HPLC Troubleshooting Guide, Bulletin 826E, Sigma-Aldrich, 2009.
4. Thermo Scientific HPLC Troubleshooting Guide Poster (P/N 6040.0050), 2012.
5. Thermo Scientific Dionex UltiMate 3000 Series Diode Array Detectors Operating Instructions, Revision 1.3.
http://www.dionex.com/en-us/webdocs/75683-Man-LC-U3000-DAD-Operation-Nov11-DOC4820-8250-1-3.pdf
For a copy of the troubleshooting poster, please request it from your Thermo Fisher Scientific sales representative with the part number 6040.0050.
www.thermoscientific.com/dionex
©2013 Thermo Fisher Scientific Inc. All rights reserved. ISO is a trademark of the International Standards Organization.
Android is a trademark of Google Inc. iPhone is a registered trademark of Apple Corporation. Windows is a registered
trademark of Microsoft Corporation. All other trademarks are the property of Thermo Fisher Scientific Inc. and its subsidiaries.
Specifications, terms and pricing are subject to change. Not all products are available in all countries. Please consult your local
sales representative for details.
Australia +61 3 9757 4486
Austria +43 1 333 50 34 0
Belgium +32 53 73 42 41
Brazil +55 11 3731 5140
China +852 2428 3282
CS70303_E 03/13S
Denmark +45 70 23 62 60
France +33 1 60 92 48 00
Germany +49 6126 991 0
India +91 22 2764 2735
Italy +39 02 51 62 1267
Japan +81 6 6885 1213
Korea +82 2 3420 8600
Netherlands +31 76 579 55 55
Singapore +65 6289 1190
Sweden +46 8 473 3380
Thermo Fisher Scientific, Sunnyvale, CA
USA is ISO 9001:2008 Certified.
Switzerland +41 62 205 9966
Taiwan +886 2 8751 6655
UK/Ireland +44 1442 233555
USA and Canada +847 295 7500
Cas e Stu dy
3. HPLC Troubleshooting Guide, Phenomenex Inc., 2008.