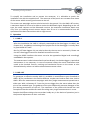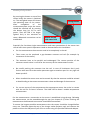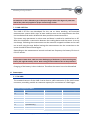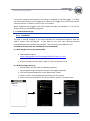
1
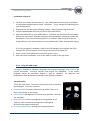
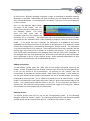
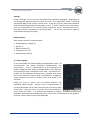
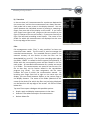
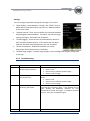
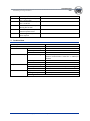
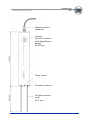
Müncheberg • Freising • Homécourt Operating Instructions Version: 30/10/14 UMP-1 combined soil humidity, conductivity and temperature sensor Umwelt-Geräte-Technik GmbH • Email: [email protected] • Web: www.ugt-online.de Müncheberg • Freising • Homécourt Table of Contents 1. Introduction ....................................................................................................................................... 3 2. Volumetric water content of the soil ................................................................................................ 4 3. Mode of operation ............................................................................................................................ 4 3.1. Water content measurement ............................................................................................. 4 3.2. Electrical conductivity measurement.................................................................................. 5 3.3. Temperature measurement ................................................................................................ 5 4. Installation ......................................................................................................................................... 5 5. Data output........................................................................................................................................ 8 5.1. Via cable .............................................................................................................................. 8 5.2. Via Bluetooth and app......................................................................................................... 9 5.2.1. Installation ...................................................................................................................... 9 5.2.2. Using the UMP-1 app.................................................................................................... 10 5.2.3. Troubleshooting ........................................................................................................... 15 6. Technical data .................................................................................................................................. 16 Umwelt-Geräte-Technik GmbH • Email: [email protected] • Web: www.ugt-online.de Seite 2 von 17 Müncheberg • Freising • Homécourt 1. Introduction The UMP-1 series offers a range of combination sensors supplying high quality measurements at minimum effort. The combination of the three measured variables of volumetric water content, electrical conductivity and temperature in one sensor means that these combination sensors save money spent on procurement and time spent on installation and servicing. In addition disruption to the soil is minimal because only one sensor has to be inserted. Various possibilities are available for storage and transferred data, depending on the planned measurement structure. UMP-1 Connection to the data logger by cable Data storage on the data logger, output via an interface on laptop or remote data transmission Particularly suitable for measurement stations with several sensors for long-term measurements UMP-1 BT The data are transmitted via Bluetooth Data are recorded directly using the corresponding smartphone app Particularly suitable for direct measurement in situ to determine current values in changing measurement stations UMP-1 BT Plus Data storage in the sensor The data are transmitted via Bluetooth on a smartphone or laptop Particularly suitable as single sensor for medium-term measurements Umwelt-Geräte-Technik GmbH • Email: [email protected] • Web: www.ugt-online.de Seite 3 von 17 Müncheberg • Freising • Homécourt 2. Volumetric water content of the soil The water content is one of the most important characteristic variables in soil science. It is used by agriculture as limit value and control variable for irrigation, by construction as limit value for the ability to drive on ground, and in environmental and landscape protection both as a decision criterion for planned measures and as an important indicator. Since a direct determination of the water content by weighing is not possible in the field, indirect procedures are deployed to determine the volumetric water content to obtain nondestructive and continuous measurements in the field. The volumetric water content is the ratio of water volume in the soil to total volume and is calculated according to (1): 𝜃= where 𝜃 𝑉𝜔 𝑉𝑇 … ... … 𝑉𝜔 ∙ 100% 𝑉𝑇 (1) Volumetric water content Volume of water Total volume 3. Mode of operation 3.1. Water content measurement The water content measurement procedure on the UMP-1 sensor is assigned neither to the FDR sensors nor the TDR sensors. The basic mode of operation however corresponds to the FDR process, because the sensor operates with a continuous signal at constant frequency (60 MHz) and not with a pulse. However the phase shift rather than the frequency change is taken into consideration to calculate the measurement reading. The measurement pipe consists of two stainless steel rods (antennae) 10 cm in length and with a diameter of 3 mm. These dimensions and the measurement frequency produce a measurement volume of approx. 1 litre. Faults within the measurement volume such as vessel walls, large air pockets or cables can distort the measurement result. The continuous signal runs along the antennae in the ground. The waves of the signal running back and forth are compared here. The dielectric constant ε of the surrounding soil/water mix is determined from the phase difference of the signals running back and forth. The dielectric constant for pure water at 20°C is ε=80. Dry soil as a ε of 2…5. The dielectric constant of the soil/water mix lies between these two levels, and is higher the more water there is in the soil. Using the calculated dielectric constant, the water content of the soil is then determined in the unit ([m³])/([m³]) according to the Topp/Davis equation. Umwelt-Geräte-Technik GmbH • Email: [email protected] • Web: www.ugt-online.de Seite 4 von 17 Müncheberg • Freising • Homécourt The ε value can also be called up when making independent water content calculations using other models. 3.2. Electrical conductivity measurement The UMP-1 sensor records the electrical conductivity of the soil by means of an additional circuit (IC) independently of the soil moisture measurement. This system offers two great advantages. On the one hand an extremely precise measurement of conductivity is possible using the components and measurement principle. On the other hand the independently measured conductivity can be used to correct the calculated water content. Small electrical conductivity values have no effect on the measurement of the dielectric constant. However the effect on the dielectric constant becomes greater with increased conductivity. Without correction the dielectric constant obtained is too high, so producing a water content that is too high. To measure conductivity, the soil moisture measurement is interrupted for a sort time, and a signal in the kHz range transmitted over the antennae. The corresponding IC measures the impedance of several different frequencies and averages the results. 3.3. Temperature measurement The UMP-1 sensor also measures the soil temperature using a further circuit. A stainless steel bolt recessed between the probes transmits the temperature of the soil from the point of water content and conductivity measurement to the temperature sensor, so that all values originate from the same measurement point. 6 minutes should be allowed as setting time to achieve a reliable temperature measurement. 4. Installation To conduct the measurement, the sensor is placed in the ground so that the probe rods and the metal bolt for temperature measurement have a good contact to the soil. Air-filled hollow spaces between soil and steel lead to distorted measurement results. Caution! The antennae must be completely in the ground because the measurement is always along the entire antenna. Umwelt-Geräte-Technik GmbH • Email: [email protected] • Web: www.ugt-online.de Seite 5 von 17 Müncheberg • Freising • Homécourt To simplify the installation and to protect the antennae, it is advisable to punch the installation site with the supplied tool. The antennae of the punch are narrower than those of the sensor which ensures good contact to the soil. The sensors are watertight and can also be buried in the ground. For the UMP-1-BT version, a maximum depth of 50 cm to be able to receive the Bluetooth signal. Depending on the soil type, the water content and the Bluetooth receiver the maximum installation depth may vary. Prior to installing several sensors deeper than 50 cm it is recommended to test the operation of the data transmission with a single sensor. 5. Operation 5.1. UMP-1 After the installation the UMP-1 is directly connected to the data logger via cable ( see Chapter 6.1). Installation and setting of the project file of the data logger is usually done by specialized UGT staff. But for UGT data loggers this can also be done by the user on its own easily. Please see the UGT-data-logger manual for detailed instructions on that. Using the RS485 interface the sensor can also be approached digital and accordingly embedded in bus systems. The measurement is administrated and read out directly via the data logger. A periodical maintenance is not necessary. In case of unnatural values the actual installation state needs to be checked. Erosion, cracking and mechanical forces on the sensor or also deinstallation by others can lead to altered measurement values. 5.2. UMP-1 BT To guarantee an effective usethe UMP-1 is available in two different types. Standard as UMP-1 BT for installation in the field at different, maybe even hard to reach sites. And as UMP-1 BTim for measurement campaigns with many single measurements spread over a wide area. With a diameter of 5 mm the pins are bigger but also more robust than the pins of the standard type. The guidance of the pins additionally prevents damages of the pins during penetration of the soil. The extension of the probe with handle bar and smartphone bracket enables fast work for taking many single measurements in a row. Despite the different design the two probes hardly vary in the basics of operation just in the practical adjustment to their core tasks. Umwelt-Geräte-Technik GmbH • Email: [email protected] • Web: www.ugt-online.de Seite 6 von 17 Müncheberg • Freising • Homécourt By pressing the button on top of the sensor briefly the sensor is switched on. The red lighted status-LED shows the operating state of the sensor. After completion of the measurement/test series the sensor should be switched off by pressing the button long (ca. 2s) to save power. Then the LED is no longer lighted. Only in the switched on state a Bluetooth connection can be established. Charge Socket Button On/Off with status-LED Especially for fast done single measurements and anew penetration of the sensor into the soil each time special importance needs to be attached to the installation. • For the measurement the antennas need to be completely in the soil. • There must not be produced a gap between antenna and soil (for example by movement of the sensor). • The antennas have to be parallel and undamaged. The correct position of the antennas to each other is crucial for the accuracy of the measurement results. • Be careful pushing the antennas into the soil. In case of hindrances don´t push further with more force but rather penetrate again at another spot. For very rigid soil better pre-drill. • When installed the sensor must not be moved. By that the antennas could be twisted or bend leading to inaccurate measurement values and damage of the antennas. • For correct survey of the temperature the temperature sensor has to be in contact with the soil for at least 6 minutes. The UMP-1 BTim doesn`t enable temperature measurement. For the measurement a connection to the sensor is established using the app. Following the measurement can be startedthrough the app (see chapter 6.2). After finishing the measurement the Bluetooth connection should be disconnected. To ensure the longest possible measurement time the sensor should be charged before every use. Therefore open the cap of the charge socket (bajonet cap) and connect the probe to either the USB-port of your PC or a socket using the provided cable and adapter. Umwelt-Geräte-Technik GmbH • Email: [email protected] • Web: www.ugt-online.de Seite 7 von 17 Müncheberg • Freising • Homécourt Caution! No moisture or dirt is allowed to get in the open charge socket. The degree of protection IP67 of the probe only applies for proper closed charge socket. 5.3. UMP-1 BT Plus The UMP-1 BT Plus was developed for the use as alone standing, self-contained measurement system which stays at least medium term at the measurement site after the installation and works reliable with least possible maintenance effort. This sensor stays permanent in active state and doesn`t need to be switched on or off. After the installation a connection between the reading device and the sensor is set up via the app. Following the measurement can be started or stopped and data can be read out as well using the app. Before leaving the measurement site the connection to the sensor should be disconnected again. Depending on the measurement interval and read out frequency the battery life time is 6 to 15 months. Caution! Temperatures lower than -10°C can cause discharging of the battery. In that case the given battery life might drastically reduce. With underground installation this can be prevented. Charging of the battery is done inductive. Therefore the sensor has to be deinstalled. 6. Data output 6.1. Via cable The standard sensors of the UMP-1 series have a cable connection (1.5m; M12 sensor connector; assembly possible on customer request) for connection to a data logger. Terminal assignment UMP-1 Colour Function rt bl gn ws ge rs gr bn +12V GND RS485 B RS485 A Vol% EC (conductivity) Temp AGND Signal Measurement range 0..1V 0..1V 0..1V 0..100% 0..5mS/cm -40..60°C Umwelt-Geräte-Technik GmbH • Email: [email protected] • Web: www.ugt-online.de Seite 8 von 17 Müncheberg • Freising • Homécourt The sensor measures continuously; the energy is supplied by the data logger. The data are transmitted directly to the logger and stored in the logger from where they can be read out directly via cable or sent to a PC via a modem. When combined with loggers from UGT-GmbH, the data are available as *.txt file for further editing in spreadsheet programs. 6.2. Via Bluetooth and app 6.2.1. Installation The app is already installed if you have acquired the smartphone together with the UMP-1 sensor from UGT-GmbH. If you want to use your own, existing Android smartphone you can install the app yourself. Two versions are available for this. Installation directly from the smartphone (recommended) a) With Google account (recommended): 1. Download the app at: https://play.google.com/store/apps/details?id=ump1_bt.app and install it (internet access/WIFI required) 2. Access the app with the name “UMP-1” from the menu as usual b) Without Google account: 1. download the apk file from the following address: http://appstore.ugt-online.de (internet access/WIFI required) 2. Click on the downloaded file in the “Downloads” folder 3. Select “install” and following the instructions on the screen 4. After successful installation, click on the UMP-1 symbol in the app menu Umwelt-Geräte-Technik GmbH • Email: [email protected] • Web: www.ugt-online.de Seite 9 von 17 Müncheberg • Freising • Homécourt Installation using a PC 1. Connect your mobile device to the PC. Your mobile device should then be available as removable storage medium under “Computer”. If not, change the USB settings on your mobile device. 2. Download the apk file at the following address: “http://appstore.ugt-online.de” 3. Copy the downloaded file from your PC to the mobile device 4. Open the copied file on your mobile device. To display the file system on the mobile device, use a previously installed application where available. Examples include “My documents” in the case of Samsung devices or “Albums” when using HTC devices. Under “Albums” you also have access to the “Downloads” folder among other things. If no such possibility is available, install a free file manager from the App Store (for example the “ES File Explorer“) and use this to click on the copied file. 5. Select “Install” and follow the instructions on the screen 6. After successful installation, click on the UMP-1 symbol in the app menu 6.2.2. Using the UMP-1 app The app is available in different languages and uses the language that is set in the system concerned. Currently German and English are supported. If the system language cannot be translated, English is used as standard. All functions and designations described below are based on the English translation. The main menu This is the main menu. From here you can get to all of the other app dialogues. You have 4 options: • • • • Messwerte/Data: Display of data (only possible if there is at least a connection to one probe) Dateien/Files: Management of records (only possible if records are available) Geräte/Devices: Device management, management of the UMP-1 probes, connection management (adding and disconnecting probe connections) Einstellungen/Settings: Settings for the app behaviour Umwelt-Geräte-Technik GmbH • Email: [email protected] • Web: www.ugt-online.de Seite 10 von 17 Müncheberg • Freising • Homécourt Devices All UMP-1 probes are managed in the “Devices” dialogue. Only connections to probes listed in this view are possible. The use of Bluetooth restricts the maximum number of simultaneous connections to 7, although the actual app can manage more than 7 probes. This dialogue also provides information on the charge status of each probe and on the current connections status. By clicking on a probe (outside the checkbox area), a window opens with the available options. Two options are possible: to change the name of a probe or to delete a probe. Umwelt-Geräte-Technik GmbH • Email: [email protected] • Web: www.ugt-online.de Seite 11 von 17 Müncheberg • Freising • Homécourt As soon as the “Devices” dialogue is opened, a check is conducted to establish whether Bluetooth is available. If Bluetooth has been disabled, you are asked whether the app may activate Bluetooth. You should permit activation if you wish to set up connections or start a search. Box 1 in the adjacent figure shows the name of the probe. You can freely select the name and enter it in the “Rename” option. This name must not have more than 17 characters and may only contain the characters A-Z, a-z, 0-9 and _. Box 2 describes the current connection status of a probe. The probe can be selected in box 3 (box checked) to express a wish to connect to this probe. If no probe has been selected, no connection is established and where applicable the existing connection to this probe is disconnected. If all probes are listed and set, the configuration is accepted by pressing the “Accept” button. The connection is set up to the probes in this moment. These connections are set up in parallel, and the waiting sign only closes once all results of all probes are present. If all settings have been successfully implemented, the dialogue closes and the main menu reappears. If the dialogue does not close automatically, a fault has occurred with at least one probe, and is displayed in Box 2 of the relevant probe. More detailed explanations of fault descriptions can be found in the Troubleshooting section. Adding new devices To add probes, please press the “Add” box on the bottom left-hand corner of the screen. Initially all probes that are already linked to your device will be displayed (there is not yet any search of the environment). By pressing on the “Search” box, the environment is searched for further probes. Now select your probe. If your probe has not yet been linked, at the moment connections are set up to new probes, you will be prompted to enter the PIN. This is “0000” and needs only to be entered once. If your probe is not listed after entering the PIN, press “Search” again at the bottom edge of the screen. Your probe should now be shown in the list. If not, check that the probe is switched on, has sufficient energy supply, and that the range is not too great. Repeat the procedure for each probe that you wish to add. Deleting devices To remove probes from the list, tap on the corresponding probe. In the following dialogue select the “Delete” option. Any existing connection will now be disconnected and the probe will be removed from the list. The device link remains in place. Umwelt-Geräte-Technik GmbH • Email: [email protected] • Web: www.ugt-online.de Seite 12 von 17 Müncheberg • Freising • Homécourt Settings Under “Settings” you can set how the probe data should be displayed. Depending on the setting, the depiction opens as chart or as text. The “Start/Stop” button is found at the bottom edge of the screen in both views. Using this, you can determined whether data should be requested from the probes or not. If “Start” can be seen on the button, then no measurements are currently being requested, and all measurements are 0. Send and receives commences by pressing “Start”. Tap on the same button again to stop the data transmission again. Measurements Each probe transmits 5 measurements: • • • • • Storage battery voltage [V] Epsilon Er Water content [%] Temperature in [°C] Conductivity [mS/cm] a) View as graph In this view mode, the measured data are displayed as chart. 30 measurements are always displayed simultaneously and continuously. From 5 measurements, 4 are displayed; the battery voltage for each probe is already shown in the “Devices” view and will not be considered in this view. A maximum of 7 probes can be displayed simultaneously, whereby each probe has its own colour to make it easier to distinguish. A legend is shown beneath the chart to enable colour and probe to be matched. Using the “Port++” button you can choose between the individual measurements. Which of the 4 measurements is currently displayed can be seen from the title on the top edge of the chart. Using the “Port++” button, there are elements to zoom within the chart. It is furthermore possible to display individual measurements as explanatory text. Tap on the relevant point on the graph to have the X and Y value for this point displayed. Umwelt-Geräte-Technik GmbH • Email: [email protected] • Web: www.ugt-online.de Seite 13 von 17 Müncheberg • Freising • Homécourt b) Text view In the text view, all 5 measurements for a probe are depicted at the same time, and the last measurement can always be seen. Each probe has its own screen in the display element. You can switch between the individual screens by moving or sweeping a finger from one side of the display to the other. If you move your finger from right to left, you get to the next screen on the right (in relation to the current screen). If you move from left to right, the left-hand preceding screen opens. The name of the probe for which the measurements are displayed can be seen on the top edge of the screen. Files File management under “Files” is only possible if at least one record has been made. The file menu is used to manage the recorded measurements. The recorded files are stored in the external memory of the device so that the files can be downloaded (e.g. to a PC). The first time recording takes place, the folder “UMP1” is created in the file system (/mnt/sdcard). A folder with the corresponding name will be created in this for each probe. All recorded measurements for a probe are stored in its folder. The measurements are stored in text form as CSV file so that they can be further edited in the spreadsheet program (e.g. Excel). For clear assignment, the file name includes the time at which the measurement started. By brushing your finger from left to right or vice versa over the display, you can switch between folders or the various flags of the display element. The name of the folder (identical to the name of the device) for which the files are just being displayed can be found on the top edge of the screen. All files are listed below this. Tap on a file to open a dialogue with possible options: • • • Graph: apply and display measurements in the chart Statistics: text advance analysis of measurements Delete: delete file Umwelt-Geräte-Technik GmbH • Email: [email protected] • Web: www.ugt-online.de Seite 14 von 17 Müncheberg • Freising • Homécourt Settings You can change important settings for the app in this menu: • • • • • “Data display”: select between “Graph” and “Table” here to define which view opens when you click on “Measurements” in the main menu. “Update interval”: here you can define the intervals between requesting two measurements. The lower, the more energysaving; the higher, the better the resolution. “Enable logging”: check this box to automatically record as well as display measurements. If this option has not been selected, the data are displayed only, but not recorded. “Screen orientation”: determine whether the screen orientation should be portrait or landscape “Disable large images”: prevent large images, such as background images, being used in the app. 6.2.3. Troubleshooting Error code 1 Description Batterie oder Distanz; Check battery/distance! 2 Verbindung verloren; Connection lost… 3 I/O Datenstromproblem; Accessing I/O stream 4 Fehler beim Datei öffnen! ; Causes/solutions No connection set-up possible; possible cause: • Device is off • Device has no sufficient power supply • Device is out of range Bluetooth connection has been interrupted; possible causes: • Device is off • Device has no sufficient power supply • Device is out of range Internal system problem, disconnect the probe concerned and reconnect again. If the problem occurs again, disable the Bluetooth interface on your smartphone and then start again. If problems continue to occur, start your smartphone again. Umwelt-Geräte-Technik GmbH • Email: [email protected] • Web: www.ugt-online.de Seite 15 von 17 Müncheberg • Freising • Homécourt 5 6 7 8 9 Can´t open file! Kein Zugriff auf Datei! ; Can´t access file! Fehler beim Datei lesen! ; Can´t read file! Falsches Dateiformat! ; Wrong file format! Interner Systemfehler; Internal system error! Zähler abgelaufen; Time expired 7. Technical data Power requirement Power input Water content Electrical conductivity Temperature Interfaces Measurement range Accuracy Resolution Measurement range 6V … 24V DC 60 mA 0 … 100 % vol. water content ± 2% 0.1 % vol. water content 0.001 … 4mS/cm Optional measurement extension to 40mS/cm possible 1% Accuracy Resolution Measurement range -20 … +60°C Accuracy ± 0.2°C (across the entire temperature range) Resolution 0.01°C Digital RS485 Analogue output 3 X 0 …1,5 V Including 1.5 m cable with M12 sensor connector Umwelt-Geräte-Technik GmbH • Email: [email protected] • Web: www.ugt-online.de Seite 16 von 17 Müncheberg • Freising • Homécourt Cable connection (optional) Housing (plastic or stainless steel depending on design) Ø = 40 mm Temp. sensor Thread for antenna Pin (bare stainless steel) Ø = 3 mm Umwelt-Geräte-Technik GmbH • Email: [email protected] • Web: www.ugt-online.de Seite 17 von 17