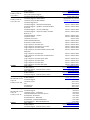
1
vFoglight™ 5.2.4
Getting Started Guide
© 2008 Quest Software, Inc. ALL RIGHTS RESERVED.
This guide contains proprietary information protected by copyright. The software described in this guide is furnished
under a software license or nondisclosure agreement. This software may be used or copied only in accordance with
the terms of the applicable agreement. No part of this guide may be reproduced or transmitted in any form or by any
means, electronic or mechanical, including photocopying and recording for any purpose other than the purchaser's
personal use without the written permission of Quest Software, Inc.
If you have any questions regarding your potential use of this material, contact:
Quest Software World Headquarters
LEGAL Dept
5 Polaris Way
Aliso Viejo, CA 92656
www.quest.com
email: [email protected]
Refer to our Web site for regional and international office information.
Trademarks
Quest, Quest Software, the Quest Software logo, Aelita, Akonix, Akonix L7 Enterprise, Akonix L7 Enforcer,
AppAssure, Benchmark Factory, Big Brother, DataFactory, DeployDirector, ERDisk, Foglight, Funnel Web, I/Watch,
Imceda, InLook, IntelliProfile, InTrust, Invertus, IT Dad, I/Watch, JClass, Jint, JProbe, LeccoTech, LiteSpeed,
LiveReorg, MessageStats, NBSpool, NetBase, Npulse, NetPro, PassGo, PerformaSure, Quest Central, SharePlex,
Sitraka, SmartAlarm, Spotlight, SQL LiteSpeed, SQL Navigator, SQL Watch, SQLab, Stat, StealthCollect, Tag and
Follow, Toad, T.O.A.D., Toad World, vANALYZER, vAUTOMATOR, vCONTROL, vCONVERTER, vEssentials,
vFOGLIGHT, vOPTIMIZER, vRanger Pro, vReplicator, Vintela, Virtual DBA, VizionCore, Xaffire, and XRT are
trademarks and registered trademarks of Quest Software, Inc in the United States of America and other countries.
Other trademarks and registered trademarks used in this guide are property of their respective owners.
Disclaimer
The information in this document is provided in connection with Quest products. No license, express or implied, by
estoppel or otherwise, to any intellectual property right is granted by this document or in connection with the sale of
Quest products. EXCEPT AS SET FORTH IN QUEST'S TERMS AND CONDITIONS AS SPECIFIED IN THE
LICENSE AGREEMENT FOR THIS PRODUCT, QUEST ASSUMES NO LIABILITY WHATSOEVER AND
DISCLAIMS ANY EXPRESS, IMPLIED OR STATUTORY WARRANTY RELATING TO ITS PRODUCTS
INCLUDING, BUT NOT LIMITED TO, THE IMPLIED WARRANTY OF MERCHANTABILITY, FITNESS FOR A
PARTICULAR PURPOSE, OR NON-INFRINGEMENT. IN NO EVENT SHALL QUEST BE LIABLE FOR ANY
DIRECT, INDIRECT, CONSEQUENTIAL, PUNITIVE, SPECIAL OR INCIDENTAL DAMAGES (INCLUDING,
WITHOUT LIMITATION, DAMAGES FOR LOSS OF PROFITS, BUSINESS INTERRUPTION OR LOSS OF
INFORMATION) ARISING OUT OF THE USE OR INABILITY TO USE THIS DOCUMENT, EVEN IF QUEST HAS
BEEN ADVISED OF THE POSSIBILITY OF SUCH DAMAGES. Quest makes no representations or warranties with
respect to the accuracy or completeness of the contents of this document and reserves the right to make changes
to specifications and product descriptions at any time without notice. Quest does not make any commitment to
update the information contained in this document.
License Credits and Third Party Information
To view license credit information, click the License Credits link on the Welcome to vFoglight online help page.
Getting Started Guide
March 2009
Version 5.2.4
Table of Contents
Introduction to this Guide ...................................................................................................................................5
About vFoglight ................................................................................................................................................................ 6
About this Guide............................................................................................................................................................... 6
vFoglight Documentation Suite ........................................................................................................................................ 7
Core Documentation Set ......................................................................................................................................... 8
Cartridge Documentation Sets ................................................................................................................................ 9
Feedback on the Documentation............................................................................................................................. 9
Text Conventions ........................................................................................................................................................... 10
About Vizioncore Inc. ..................................................................................................................................................... 10
Contacting Dell ............................................................................................................................................................... 12
Introducing vFoglight ........................................................................................................................................25
Welcome to vFoglight..................................................................................................................................................... 26
What is vFoglight? ................................................................................................................................................. 26
How vFoglight Organizes and Presents Data........................................................................................................ 26
How vFoglight Helps.............................................................................................................................................. 26
Key Concepts and Terms............................................................................................................................................... 27
How vFoglight Works ..................................................................................................................................................... 27
vFoglight Structure ......................................................................................................................................................... 34
vFoglight Components ................................................................................................................................................... 35
vFoglight Management Server .............................................................................................................................. 35
vFoglight browser interface ................................................................................................................................... 35
vFoglight command-line interface.......................................................................................................................... 36
vFoglight Agent Manager ...................................................................................................................................... 37
Cartridges .............................................................................................................................................................. 37
Agents ................................................................................................................................................................... 38
4
vFoglight
Getting Started Guide
First Steps.......................................................................................................................................................... 39
Downloading vFoglight ................................................................................................................................................... 39
Next Steps ...................................................................................................................................................................... 40
Installation and Setup Overview ...................................................................................................................... 41
Getting Started with the Installation and Setup Process................................................................................................. 42
References to the Installation and Setup Guide Set .............................................................................................. 42
Before You Get Started.......................................................................................................................................... 42
Part 1: Installing or Upgrading the vFoglight Management Server ................................................................................. 43
Part 2: Initializing the Database, Starting the vFoglight Management Server, and Logging In....................................... 44
Part 3: Installing or Upgrading Cartridges....................................................................................................................... 45
Part 4: Installing, Configuring, and Starting the vFoglight Agent Manager ..................................................................... 46
Part 5: Deploying and Creating Agents .......................................................................................................................... 48
Next Steps ...................................................................................................................................................................... 50
Starting Points in vFoglight ............................................................................................................................. 51
Before You Get Started .................................................................................................................................................. 52
Working in a Current or a Diagnostic Time Range ................................................................................................ 52
Services Dashboard ....................................................................................................................................................... 54
Hosts Dashboard ............................................................................................................................................................ 56
Agent Status Dashboard................................................................................................................................................. 58
Next Steps ...................................................................................................................................................................... 60
Index ................................................................................................................................................................... 61
Introduction to this Guide
This chapter provides information about what is contained in the Getting Started Guide.
It also provides information about the vFoglight documentation suite and Vizioncore.
This chapter contains the following sections:
About vFoglight..............................................................................................................................6
About this Guide............................................................................................................................6
vFoglight Documentation Suite......................................................................................................7
Text Conventions .........................................................................................................................10
About Vizioncore Inc....................................................................................................................10
6
vFoglight
Getting Started Guide
About vFoglight
vFoglight helps IT organizations understand the virtual infrastructure by managing the
relationships and interaction between all the components in the environment, including
data centers, data stores, clusters, resource pools, hosts and virtual machines. With
vFoglight, administrators can quickly determine the root-cause of an incident or
problem, track virtual machine (VM) movements and understand their impact, and
identify contention for resources between virtual machines.
About this Guide
The Getting Started Guide introduces you to vFoglight concepts and components. It
provides a high-level overview of the installation and setup procedures and suggests
starting points in the vFoglight browser interface.
In addition, it provides instructions for getting started with SupportLink and
downloading vFoglight.
This guide is intended as an overview for any user getting started with vFoglight. Users
who are new to vFoglight can use this guide as an introduction to the topics and
procedures described above. New users may want to consult this guide prior to
following the procedures described in the Installation and Setup Guide, the
Administration and Configuration Guide, and the Foglight User Guide.
More experienced users can use this guide as a high-level outline of these topics and
procedures or as a supplement to the Installation and Setup Guide, the Administration
and Configuration Guide, and the Foglight User Guide.
The Getting Started Guide is organized as follows:
Chapter 1, Introducing vFoglight—Introduces vFoglight by discussing how
vFoglight works, defining key concepts and terms, and describing vFoglight
components.
Chapter 2, First Steps—Includes instructions on downloading vFoglight software
packages and documentation.
Chapter 3, Installation and Setup Overview—Provides an overview of the vFoglight
installation and setup process and acts as a preface or supplement to the Administration
and Configuration Guide and the appropriate part of the Installation and Setup Guide
set.
Introduction to this Guide
vFoglight Documentation Suite
7
This chapter summarizes the main steps involved in installing (or upgrading) and
configuring vFoglight. As well, this chapter directs you to the appropriate instructions
in the Administration and Configuration Guide and in the Installation and Setup Guide
set.
Chapter 4, Starting Points in vFoglight—Provides an overview of several dashboards
that can be used as starting points in the vFoglight browser interface: two of the
monitoring dashboards listed by default under Homes and three administration
dashboards. This chapter also includes examples of next steps that you can take.
In addition, this chapter provides getting started tips on common elements in the
browser interface and features that can affect how you see data in the monitoring
dashboards.
vFoglight offers a wide range of functionality through its customizable dashboards.
Consult this chapter to learn about some of the starting points, next steps, and
workflows that are available to users with different roles and needs.
Appendix A, vFoglight Client Reference—Contains material drawn from the chapters
Introducing vFoglight, Installation and Setup Overview, and Starting Points in
vFoglight for users who continue to use the vFoglight Client.
vFoglight Documentation Suite
The vFoglight documentation suite is made up of the core documentation set, plus the
documentation set for each vFoglight cartridge that you deploy. Documentation is
provided in a combination of online help, PDF and HTML.
8
vFoglight
Getting Started Guide
• Online Help: You can open the online help by selecting the Help tab from
vFoglight’s action panel.
• PDF: The Getting Started Guide, What’s New Guide, System Requirements and
Platform Support Guide, Installation and Setup Guide set, Administration and
Configuration Guide, vFoglight User Guide, Command-Line Reference Guide,
Web Component Guide, and Web Component Tutorial, are provided as PDF files.
The PDF guides are included in the zip file downloaded from Vizioncore.
Adobe® Reader® is required.
HTML:
Release Notes are provided in HTML.
Core Documentation Set
The core documentation set consists of the following files:
• Release Notes (HTML)
• Getting Started Guide (PDF)
• What’s New Guide (PDF)
• System Requirements and Platform Support Guide (PDF)
• Installation and Setup Guide set (all in PDF format):
• Installation and Setup Guide—Installing on Windows with an Embedded
MySQL Database
• Installation and Setup Guide—Installing on Windows with an External
MySQL Database
Introduction to this Guide
vFoglight Documentation Suite
9
• Installation and Setup Guide—Installing on Windows with an External Oracle
Database
• Administration and Configuration Guide (PDF and online help)
• vFoglight User Guide (PDF and online help)
• Advanced Configuration Guide set
• Command-Line Reference Guide (PDF and online help)
• Web Component Guide (PDF and online help)
• Web Component Tutorial (PDF and online help)
• Web Component Reference (online help)
Cartridge Documentation Sets
When you deploy a cartridge, the documentation set for the cartridge is installed. The
online help for the cartridge is integrated automatically with the core vFoglight help.
When you open the help, the name of the cartridge is displayed in a top level entry
within the table of contents.
Some cartridges include additional PDF guides, which may be one or more of the
following: a Getting Started Guide, an Installation Guide, a User Guide, and a
Reference Guide.
Feedback on the Documentation
We are interested in receiving feedback from you about our documentation. For
example, did you notice any errors in the documentation? Were any features
undocumented? Do you have any suggestions on how we can improve the
documentation? All comments are welcome. Please submit your feedback to the
following email address:
[email protected]
Please do not submit Technical Support related issues to this email address.
10
vFoglight
Getting Started Guide
Text Conventions
The following table summarizes how text styles are used in this guide:
Convention
Description
Code
Monospace text represents code, code objects, and commandline input. This includes:
• Java language source code and examples of file contents
• Classes, objects, methods, properties, constants, and events
• HTML documents, tags, and attributes
Variables
Monospace-plus-italic text represents variable code or
command-line objects that are replaced by an actual value or
parameter.
Interface
Bold text is used for interface options that you select (such as
menu items) as well as keyboard commands.
Files, components,
and documents
Italic text is used to highlight the following items:
• Pathnames, file names, and programs
• The names of other documents referenced in this guide
About Vizioncore Inc.
Vizioncore was formed in July 2002 as a consulting and software-development
company with the mission to create easy-to-use software solutions that performed
reliable and repeatable automation of datacenter functions specifically for the Citrix
platform. A main corporate goal was to enable business partners to offer solutions that
targeted real-world IT issues and provided the best possible installation and automation
for their clients' systems.
Vizioncore's solutions have proved successful in organizations from small to mid-sized
businesses to large enterprises, in a wide variety of vertical industries, including
Financial Services, Government, Healthcare, Manufacturing, and High Tech.
Vizioncore, Inc. can be found in offices around the globe and at www.vizioncore.com.
Introduction to this Guide
About Vizioncore Inc.
11
Contacting Dell
Note: If you do not have an active Internet connection, you can find contact information on your purchase invoice,
packing slip, bill, or Dell product catalog.
Dell provides several online and telephone-based support and service options. Availability varies by country and
product, and some services may not be available in your area. To contact Dell for sales, technical support, or customer
service issues:
1 Visit http://support.dell.com.
2 Verify your country or region in the Choose A Country/Region drop-down menu at the bottom of the page.
3 Click Contact Us on the left side of the page.Note: Toll-free numbers are for use within the country for which
they are listed.
4 Select the appropriate service or support link based on your need.
5 Choose the method of contacting Dell that is convenient for you.
Country (City)
International Access
Code
Country Code
City Code
Anguilla
Service Type
Web Address
E-Mail Address
Technical Support., Customer Service, Sales
Web Address
Antigua and Barbuda
E-Mail Address
Technical Support., Customer Service, Sales
Technical Support
Aomen
Dell™ Dimension™, Dell Inspirion™, Dell
Optiplex™, Dell Lattitude™, and Dell
Precision™Servers and Storage
Argentina (Buenos Aires) Web Address
E-Mail Address for Desktop/ Portable Computers
International Access
E-Mail Address for Servers and EMC® Storage
Code: 00
Products
Country Code: 54
Customer Service
City Code: 11
Technical Support
Technical Support Services
Sales
Web Address
Aruba
E-Mail Address
Technical Support., Customer Service, Sales
Web Address
Australia (Sydney)
Contact Dell Web Address
International Access
Technical Support., Customer Service, Sales
Code: 0011
Country Code: 61
City Code: 2
Area Codes,
Local Numbers, and
Toll-Free Numbers
Web and E-Mail Addresses
www.Dell.com/ai
la‐[email protected]
toll-free: 800-335-0031
www.Dell.com.ag
la‐[email protected]
1-800-805-5924
0800-105
0800-105
www.dell.com.ar
la‐[email protected]
[email protected]
toll-free: 0-800-444-0730
toll-free: 0-800-444-0733
toll-free: 0-800-444-0724
0-800-444-3355
www.Dell.com/aw
la‐[email protected]
toll-free: 800-1578
support.ap.dell.com
support.ap.dell.com/contactus
13DELL-133355
Austria (Vienna)
International Access
Code: 900
Country Code: 43
City Code: 1
Bahamas
Barbados
Belgium (Brussels)
Bolivia
Brazil
International Access
Code: 00
Country Code: 55
City Code: 51
British Virgin Islands
Brunei
Country Code: 673
Canada (North York,
Ontario)
International Access
Code: 011
Support.euro.dell.com
Web Address
[email protected]
E-Mail Address
Home/Small Business Sales
0820 240 530 00
Home/Small Business Fax
0820 240 530 49
Home/Small Business Customer Service
0820 240 530 14
Home/Small Business Support
0820 240 530 17
Preferred Accounts/Corporate Customer
0820 240 530 16
Service Preferred Accounts/Corporate Customer
0820 240 530 17
Switchboard
0820 240 530 00
Web Address
www.dell.com/bs
E-Mail Address
la‐[email protected]
Technical Support., Customer Service, Sales
toll-free: 1-866-874-3038
Web Address
www.dell.com/bb
E-Mail Address
la‐[email protected]
Technical Support., Customer Service, Sales
1-800-534-3142
Support.euro.dell.com
Web Address
02 481 92 88
General Support
02 481 92 95
General Support Fax
02 713 15 65
Customer Service
02 481 91 00
Corporate Sales
02 481 91 99
Fax
02 481 91 00
Switchboard
Web Address
www.dell.com/bo
E-Mail Address
[email protected]
Technical Support., Customer Service, Sales
toll-free: 800-10-0238
www.dell.com/br
Web Address
E-Mail Address
[email protected]
Customer Service and Tech Support
0800 970 3355
Technical Support Fax
51 2104 5470
Customer Service Fax
51 2104 5480
Sales
0800 722 3498
Technical Support, Customer Service, Sales
toll-free: 1-866-278-6820
Technical Support (Penang, Malaysia)
604 633 4966
Customer Service (Penang, Malaysia)
604 633 4888
Transaction Sales (Penang, Malaysia)
604 633 4955
www.dell.ca/ostatus
Online Order Status Web Address
AutoTech (automated Hardware and Warranty
Support)
support.ca.dell.com
Customer Service
toll-free:1-800-247-9362
Home/Home Office
toll-free:1-800-847-4096
Small Business
toll-free:1-800-906-3355
Medium/Large Business, Government, Education
toll-free:1-800-387-5757
Hardware Warranty Phone Support
Cayman Islands
Computers for Home/Home Office
Computers for Small/Medium/Large Business
Government
Printers, Projectors, Televisions, Handheld,
Digital
Jukebox, and Wireless Sales
Home and Home Office Sales
Small Business
Medium/Large Business, Government
Spare Parts and Extended Service
E-Mail Address
Technical Support, Customer Service, Sales
toll-free:1-800-847-4096
toll-free:1-800-387-5757
1-877-335-5767
toll-free:1-800-999-3355
toll-free:1-800-387-5752
toll-free:1-800-387-5755
1 866 440 3355
la‐[email protected]
1-877-262-5415
Chile (Santiago)
Country Code: 56
City Code: 2
China (Xiamen)
Web Address
E-Mail Address
Sales and Customer Support
Technical Support Web Address
Technical Support E-Mail Address
Country Code: 86
Customer Service E-Mail Address
City Code: 592
Technical Support Fax
Technical Support – Dimension and Inspiron
Technical Support – OptiPlex, Lattitude and Dell
Precision
Technical Support – Servers and Storage
Technical Support – Projectors, PDAs, Switches,
Routers, etc
Technical Support – Printers
Customer Service
Customer Service Fax
Home and Small Business
Preferred Accounts Division
Large Corporate Accounts GCP
Large Corporate Accounts Key Accounts
Large Corporate Accounts North
Large Corporate Accounts North Government and
Education
Large Corporate Accounts East
Large Corporate Accounts East Government and
Education
Large Corporate Accounts Queue Team
Large Corporate Accounts South
Large Corporate Accounts West
Large Corporate Accounts Spare Parts
Web Address
Columbia
E-Mail Address
Technical Support, Customer Service, Sales
Web Address
Costa Rica
E-Mail Address
Technical Support, Customer Service, Sales
Czech Republic (Prague) Web Address
E-Mail Address
International Access
Technical Support
Code: 00
Customer Service
Country Code: 420
Fax
Technical Fax
Switchboard
Denmark (Copenhagen) Web Address
Technical Support
International Access
Customer Service – Relational
Code: 00
Home/Small Business Customer Service
Country Code: 45
Switchboard – Relational
Switchboard Fax – Relational
Switchboard – Home/Small Business
Switchboard Fax – Home/Small Business
Web Address
Dominica
E-Mail Address
Technical Support, Customer Service, Sales
www.dell.com/cl
la‐[email protected]
toll-free: 1230-020-4823
support.dell.com.cn
support.dell.com.cn/email
[email protected]
592 818 14350
toll-free: 800 858 2969
toll-free: 800 858 0950
toll-free: 800 858 0960
toll-free: 800 858 2920
toll-free: 800 858 2311
toll-free: 800 858 2060
592 818 1308
toll-free: 800 858 2222
toll-free: 800 858 2557
toll-free: 800 858 2055
toll-free: 800 858 2628
toll-free: 800 858 2999
toll-free: 800 858 2955
toll-free: 800 858 2020
toll-free: 800 858 2669
toll-free: 800 858 2572
toll-free: 800 858 2355
toll-free: 800 858 2811
toll-free: 800 858 2621
www.dell.com/co
la‐[email protected]
01-800-915-4755
www.dell.com/cr
la‐[email protected]
0800-012-0231
support.euro.dell.com
[email protected]
22537 2727
22537 2707
22537 2714
22537 2728
22537 2711
Support.euro.dell.com
7023 0182
7023 0184
3287 5505
3287 1200
3287 1201
3287 5000
3287 5001
www.dell.com/dm
la‐[email protected]
toll-free: 1-866-278-6821
Dominican Republic
Ecuador
El Salvador
Finland (Helsinki)
International Access
Code: 990
Country Code: 358
City Code: 9
France (Paris)
(Montpellier)
International Access
Code: 00
Country Code: 33
City Codes: (1) (4)
Web Address
E-Mail Address
Technical Support, Customer Service, Sales
Web Address
E-Mail Address
Technical Support, Customer Service, Sales
(Calling from Quito)
Technical Support, Customer Service, Sales
(Calling from Guayaquil)
Web Address
E-Mail Address
Technical Support, Customer Service, Sales
Web Address
E-Mail Address
Technical Support
Customer Service
Switchboard
Sales under 500 employees
Fax
Sales over 500 employees
Fax
Web Address
www.dell.com/do
la‐[email protected]
1-800-156-1588
www.dell.com/ec
la‐[email protected]
toll-free: 999-119-877-655-3355
toll-free: 1800-999-119-877-655-3355
www.dell.com/sv
la‐[email protected]
800-6132
[email protected]
[email protected]
0207 533 555
0207 533 538
0207 533 533
0207 533 540
0207 533 530
0207 533 533
0207 533 530
Support.euro.dell.com
Home and Small Business
Technical Support
Customer Service
Switchboard
Switchboard (calls from outside of France)
Sales
Fax
Fax (calls from outside of France)
0825 387 270
0825 832 833
0825 004 700
04 99 75 40 00
0825 004 700
0825 004 701
04 99 75 40 01
Corporate
Germany (Frankfurt)
International Access
Code: 00
Country Code: 49
City Code: 69
Greece
International Access
Code: 00
Country Code: 49
Grenada
Technical Support
Customer Service
Switchboard
Sales
Web Address
E-mail Address
Technical Support
Home/Small Business Customer Service
Global Segment Customer Service
Preferred Accounts Customer Service
Large Accounts Customer Service
Public Accounts Customer Service
Switchboard
Web Address
Technical Support
Gold Service Technical Support
Switchboard
Gold Service Switchboard
Sales
Fax
Web Address
E-Mail Address
Technical Support, Customer Service, Sales
0825 004 719
0825 338 339
55 94 71 00
01 55 94 71 00
support.euro.dell.com
[email protected]
069 9792-7200
0180-5-224400
069 9792-7320
069 9792-7320
069 9792-7320
069 9792-7320
069 9792-7000
Support.euro.dell.com
00800-44 14 95 18
00800-44 14 00 83
2108129810
2108129811
2108129800
2108129812
www.dell.com/gd
la‐[email protected]
toll-free: 1-866-540-3355
Guatemala
Guyana
Hong Kong
International Access
Code: 001
Country Code: 852
India
Web Address
E-Mail Address
Technical Support, Customer Service, Sales
E-Mail Address
Technical Support, Customer Service, Sales
Web Address
Technical Support E-mail Address
Technical Support - Dimension and Inspiron
Technical Support - OptiPlex, Latitude, and Dell
Precision
Technical Support - Servers and Storage
Technical Support - Projectors, PDAs, Switches,
Routers, etc .
Customer Service
Large Corporate Accounts
Global Customer Programs
Medium Business Division
Home and Small Business Division
Dell Support Website
Portable and Desktop Support
Desktop Support E-mail Address
Portable Support E-mail Address
Phone Numbers
Server Support
E-mail Address
Phone Numbers
Gold Support Only
E-mail Address
Phone Numbers
Customer Service
Home and Small Business
Large Corporate Accounts
Sales
Large Corporate Accounts
Home and Small Business
www.dell.com/gt
la‐[email protected]
1-800-999-0136
la‐[email protected]
toll-free: 1-877-270-4609
support.ap.dell.com
support.dell.com.cn/email
00852-2969 3188
00852-2969 3191
00852-2969 3196
00852-3416 0906
00852-3416 0910
00852-3416 0907
00852-3416 0908
00852-3416 0912
00852-2969 3105
support.ap.dell.com
[email protected]
[email protected]
080-25068032 or 080-25068034 or
your city STD code + 60003355 or
toll-free: 1-800-425-8045
[email protected]
080-25068032 or 080-25068034 or
your city STD code + 60003355 or
toll-free: 1-800-425-8045
[email protected]
080-25068033 or your city STD code +
60003355 or
toll-free: 1-800-425-9045
[email protected]
toll-free : 1800-4254051
[email protected]
toll free : 1800-4252067
1600 33 8044
1600 33 8046
Ireland (Cherrywood)
International Access
Code: 00
Country Code: 353
City Code: 1
Italy (Milan)
International Access
Code: 00
Country Code: 39
City Code: 02
Jamaica
Web Address
Technical Support
E-mail Address
Business computers
Home computers
At Home Support
Sales
Home
Small Business
Medium Business
Large Business
E-mail Address
Customer Service
Home and Small Business
Business (greater than 200 employees)
General
Fax/Sales fax
Switchboard
U.K. Customer Service (dealing with U.K.only)
Corporate Customer Service (dial within U.K.
only)
U.K. Sales (dial within U.K. only)
Web Address
Home and Small Business
Technical Support
Customer Service
Fax
Switchboard
Corporate
Technical Support
Customer Service
Fax
Switchboard
E-mail Address
Technical Support, Customer Service, Sales
(dial from within Jamaica only)
Support.euro.dell.com
[email protected]
1850 543 543
1850 543 543
1850 200 889
1850 333 200
1850 664 656
1850 200 646
1850 200 646
[email protected]
204 4014
1850 200 982
204 0103
204 4444
0870 906 0010
0870 907 4499
0870 907 4000
Support.euro.dell.com
02 577 826 90
02 696 821 14
02 696 821 13
02 696 821 12
02 577 826 90
02 577 825 55
02 575 035 30
02 577 821
[email protected]
1-800-440-920
Japan (Kawasaki)
International Access
Code: 001
Country Code: 81
City Code: 44
Korea (Seoul)
International Access
Code: 001
Country Code: 82
City Code: 2
Latin America
Luxemborg
International Access
Code: 00
Country Code: 352
Macao
Country Code: 83
Web Address
Technical Support - Dimension and Inspiron
Technical Support outside of Japan - Dimension
and Inspiron
Technical Support - Dell Precision, OptiPlex, and
Latitude
Technical Support outside of Japan - Dell
Precision, OptiPlex, and Latitude
Technical Support - Dell PowerApp™, Dell
PowerEdge™, Dell PowerConnect™, and Dell
PowerVault™,
Technical Support outside of Japan - PowerApp,
PowerEdge, PowerConnect, and PowerVault
Technical Support - Projectors, PDAs, Printers,
Routers
Technical Support outside of Japan - Projectors,
PDAs, Printers, Routers
Faxbox Service
24-Hour Automated Order Status Service
Customer Service
Business Sales Division - up to 400 employees
Preferred Accounts Division Sales - over 400
employees
Public Sales - government agencies, educational
institutions, and medical institutions
Global Segment Japan
Individual User
Individual User Online Sales
Individual User Real Site Sales
Switchboard
Web Address
Technical Support, Customer Service
Technical Support - Dimension, PDA, Electronics,
and Accessories
Sales
Fax
Switchboard
Customer Technical Support (Austin, Texas,
U.S.A.)
Customer Service (Austin, Texas, U.S.A.)
Fax (Technical Support and Customer Service)
(Austin, Texas, U.S.A.)
Sales (Austin, Texas, U.S.A.)
SalesFax (Austin, Texas, U.S.A.)
Web Address
Support
Home/Small Business Sales
Corporate Sales
Customer Service
Fax
Technical Support
Customer Service (Xiamen, China)
Transaction Sales (Xiamen, China)
support.jp.dell.com
toll-free: 0120-198-26
81-44-520-1435
toll-free: 0120-198-433
81-44-556-3894
toll-free: 0120-198-498
81-44-556-4162
toll-free: 0120-981-690
81-44-556-3468
044-556-3490
044-556-3801
044-556-4240
044-556-1465
044-556-3433
044-556-5963
044-556-3469
044-556-1657
044-556-2203
044-556-4649
044-556-4300
Support.ap.dell.com
toll-free: 080-200-3800
toll-free: 080-200-3801
toll-free: 080-200-3600
2194-6202
2194-6000
512 728-4093
512 728-3619
512 728-3883
512 728-4397
512 728-4600 or 512 728-3772
Support.euro.dell.com
3420808075
+32 (0)2 713 15 96
26 25 77 81
+32 (0)2 481 91 19
26 25 77 82
toll-free: 0800 105
34 160 910
29 693 115
Malaysia (Penang)
International Access
Code: 00
Country Code: 60
City Code: 4
Mexico
International Access
Code: 00
Country Code: 52
Montserrat
Netherlands
Antilles
Netherlands
(Amsterdam)
International Access
Code: 00
Country Code: 31
City Code: 20
New Zealand
International Access
Code: 00
Country Code: 64
Nicaragua
Norway (Lysaker)
International Access
Code: 00
Country Code: 47
Panama
Peru
Support.ap.dell.com
Web Address
toll-free: 1800 880 193
Technical Support - Dell Precision, OptiPlex, and
Latitude
toll-free: 1800 881 306
Technical Support - Dimension, Inspiron, and
Electronics and Accessories
toll-free: 1800 881 386
Technical Support - PowerApp, PowerEdge,
PowerConnect, and PowerVault
toll-free: 1800 881 306 (option 6)
Customer Service
toll-free: 1800 888 202
Transaction Sales
toll-free: 1800 888 213
Corporate Sales
www.dell.com/mx
Web Address
E-mail Address
la‐[email protected]
Customer Technical Support
001-877-384-8979 or 001-877-269-3383
Sales
50-81-8800 or 01-800-888-3355
Customer Service
001-877-384-8979 or 001-877-269-3383
Main
50-81-8800 or 01-800-888-3355
E-mail Address
la‐[email protected]
Technical Support, Customer Service, Sales
Toll-free: 1-866-278-6822
la‐[email protected]
E-mail Address
Web Address
support.euro.dell.com
Technical Support
020 674 45 00
Technical Support Fax
020 674 47 66
Home/Small Business Customer Service
020 674 42 00
Relational Customer Service
020 674 43 25
Home/Small Business Sales
020 674 55 00
Relational Sales
020 674 50 00
Home/Small Business Sales Fax
020 674 47 75
Relational Sales Fax
020 674 47 50
Switchboard
020 674 50 00
Switchboard Fax
020 674 47 50
Web Address
Support.ap.dell.com
E-mail Address
Support.ap.dell.com/contactus
Technical Support, Customer Service, Sales
0800 441 567
Web Address
E-mail Address
Technical Support, Customer Service, Sales
Web Address
Technical Support
Relational Customer Service
Home/Small Business Customer Service
Switchboard
Fax Switchboard
Web Address
E-mail Address
Technical Support, Customer Service, Sales
Web Address
E-mail Address
Technical Support, Customer Service, Sales
www.dell.com/ni
la‐[email protected]
001-800-220-1377
Support.euro.dell.com
671 16882
671 17575
231 62298
671 16800
671 16865
www.dell.com/pa
la‐[email protected]
011-800-507-1264
www.dell.com/pe
la‐[email protected]
0800-50-669
Poland (Warsaw)
International Access
Code: 011
Country Code: 48
City Code: 22
Portugal
International Access
Code: 00
Country Code: 351
Puerto Rico
St. Kitts and Nevis
St. Lucia
St. Vincent and the
Grenadines
Singapore
International Access
Code: 005
Country Code: 65
Slovakia (Prague)
International Access
Code: 00
Country Code: 421
South Africa
(Johannesburg)
International Access
Code: 09/091
Country Code: 27
City Code: 11
Web Address
E-mail Address
Customer Service Phone
Customer Service
Sales
Customer Service Fax
Reception Desk Fax
Switchboard
Web Address
Technical Support
Customer Service
Sales
Fax
Web Address
E-mail Address
Technical Support, Customer Service, Sales
Web Address
E-mail Address
Technical Support, Customer Service, Sales
Web Address
E-mail Address
Technical Support, Customer Service, Sales
Web Address
E-mail Address
Technical Support, Customer Service, Sales
NOTE: The phone numbers in this section should
be called from within Singapore or Malaysia only.
Web Address
Technical Support - Dimension, Inspiron, and
Electronics and Accessories
Technical Support - OptiPlex, Latitude,
and Dell Precision
Technical Support - PowerApp, PowerEdge,
PowerConnect, and PowerVault
Customer Service
Transaction Sales
Corporate Sales
Web Address
E-mail Address
Technical Support
Customer Service
Fax
Tech Fax
Switchboard (Sales)
Web Address
E-mail Address
Gold Queue
Technical Support
Customer Service
Sales
support.euro.dell.com
[email protected]
57 95 700
57 95 999
57 95 999
57 95 806
57 95 998
57 95 999
Support.euro.dell.com
707200149
800 300 413
800-300-410 or 800-300 -411 or
800-300-412 or 21-422-07-10
21-424-01-12
www.dell.com/pr
la‐[email protected]
1-877-537-3355
www.dell.com/kn
la‐[email protected]
toll-free: 1-866-540-3355
www.dell.com/lc
la‐[email protected]
toll-free: 1-866-464-4352
www.dell.com/vc
la‐[email protected]
toll-free: 1-866-464-4353
support.ap.dell.com
toll-free: 1 800 394 7430
toll-free: 1 800 394 7488
toll-free: 1 800 394 7478
toll-free: 1 800 394 7430 (option 6)
toll-free: 1 800 394 7412
toll-free: 1 800 394 7419
support.euro.dell.com
[email protected]
02 5441 5727
420 22537 2707
02 5441 8328
02 5441 8328
02 5441 8328
02 5441 7585
support.euro.dell.com
[email protected]
011 709 7713
011 709 7710
011 709 7707
011 709 7700
Spain (Madrid)
International Access
Code: 00
Country Code: 34
City Code: 91
Sweden (Upplands
Vasby)
International Access
Code: 00
Country Code: 46
City Code: 8
Switzerland (Geneva)
International Access
Code: 00
Country Code: 41
City Code: 22
Web Address
Home and Small Business
Technical Support
Customer Service
Sales
Switchboard
Fax
Corporate
Technical Support
Customer Service
Switchboard
Fax
Web Address
Technical Support
Relational Customer Service
Home/Small Business Customer Service
Employee Purchase Program (EPP) Support
Technical Support Fax
Web Address
E-mail Address
Technical Support – Home and Small Business
Technical Support – Corporate
Customer Service – Home and Small Business
Customer Service – Corporate
Fax
Switchboard
Web Address
Taiwan
E-mail Address
International Access
Technical Support - OptiPlex, Latitude, Inspiron,
Code: 002
Dimension, and Electronics and Accessories
Country Code: 886
Technical Support - Servers and Storage
Customer Service
Transaction Sales
Corporate Sales
Web Address
Thailand
Technical Support (OptiPlex, Latitude, and Dell
International Access
Precision)
Code: 001
Technical Support (PowerApp, PowerEdge,
Country Code: 66
PowerConnect, and PowerVault)
Customer Service
Corporate Sales
Transaction Sales
Web Address
Trinidad/Tobago
E-mail Address
Technical Support, Customer Service, Sales
Turks and Caicos Islands Web Address
E-mail Address
Technical Support, Customer Service, Sales
Support.euro.com
902 100 130
902 118 540
902 118 541
902 118 541
902 118 539
902 100 130
902 115 236
91 722 92 00
91 722 95 83
support.euro.dell.com
08 590 05 199
08 590 05 642
08 587 70 527
020 140 14 44
08 590 05 594
Support.euro.dell.com
[email protected]
0844 811 411
0844 822 844
0848 802 202
0848 821 721
022 799 01 90
022 799 01 01
support.ap.dell.com
support.dell.com.cn/email
toll-free: 0080 186 1011
toll-free: 0080 160 1256
toll-free: 0080 160 1250 (option 5)
toll-free: 0080 165 1228
toll-free: 0080 165 1227
Support.ap.dell.com
toll-free: 1800 0060 07
toll-free: 1800 0600 09
toll-free: 1800 006 007 (option 7)
toll-free: 1800 006 009
toll-free: 1800 006 006
www.dell.com/tt
la‐[email protected]
toll-free: 1-888-799-5908
www.dell.com/tc
la‐[email protected]
toll-free: 1-877-441-4735
U.K.(Bracknell)
International Access
Code: 00
Country Code: 44
City Code: 1344
Uruguay
U.S.A. (Austin, Texas)
International Access
Code: 011
Country Code: 1
Web Address
E-mail Address
Customer Service Website
Sales
Home and Small Business Sales
Corporate/Public Sector Sales
Customer Service
Home and Small Business
Corporate
Preferred Accounts (500-5000 employees)
Global Accounts
Central Government
Local Government & Education
Health
Technical Support
Corporate/Preferred Accounts/PCA (1000+
employees)
Other Dell Products
General
Home and Small Business Fax
Web Address
E-mail Address
Technical Support, Customer Service, Sales
Automated Order-Status Service
AutoTech (portable and desktop computers)
Hardware and Warranty Support (Dell TV,
Printers, and Projectors ) for Relationship
customers
Consumer (Home and Home Office) Support for
Dell products
Customer Service
Employee Purchase Program (EPP) Customers
Financial Services Web Address
Financial Services (lease/loans)
Financial Services (Dell Preferred Accounts
[DPA])
Business
Customer Service
Employee Purchase Program (EPP)
Customer s Support for printers, projectors, PDAs,
and MP3 players
Public (government, education, and healthcare)
Customer Service and Support
Employee Purchase Program (EPP) Customers
Dell Sales
Dell Outlet Store (Dell refurbished computers)
Software and Peripherals Sales
Spare Parts Sales
Extended Service and Warranty Sales
Fax
Dell Services for the Deaf, Hard-of-Hearing, or
Speech-Impaired
upport.euro.dell.com
[email protected]
support.euro.dell.com/uk/en/ECare/
form/home.asp
0870 907 4000
01344 860 456
0870 906 0010
01344 373 185
0870 906 0010
01344 373 186
01344 373 196
01344 373 199
01344 373 194
0870 908 0500
0870 353 0800
0870 907 4006
www.dell.com/uy
la‐[email protected]
toll-free: 000-413-598-2521
toll-free: 1-800-433-9014
toll-free: 1-800-247-9362
toll-free: 1-877-459-7298
toll-free: 1-800-624-9896
toll-free: 1-800-624-9897
toll-free: 1-800-695-8133
www.dellfinancialservices.com
toll-free: 1-877-577-3355
toll-free: 1-800-283-2210
toll-free: 1-800-624-9897
toll-free: 1-800-695-8133
toll-free: 1-877-459-7298
toll-free: 1-800-456-3355
toll-free: 1-800-695-8133
toll-free: 1-800-289-3355 or
toll-free: 1-800-879-3355
toll-free: 1-888-798-7561
toll-free: 1-800-671-3355
toll-free: 1-800-357-3355
toll-free: 1-800-247-4618
toll-free: 1-800-727-8320
toll-free: 1-877-DELLTTY
(1-877-335-5889)
U.S. Virgin Islands
Venezuela
Web Address
E-mail Address
Technical Support, Customer Service, Sales
Web Address
E-mail Address
Technical Support, Customer Service, Sales
www.dell.com/vi
la‐[email protected]
toll‐free: 1‐877‐702‐4360
www.dell.com/ve
la‐[email protected]
0800‐100‐4752
2
Introducing vFoglight
This chapter discusses how vFoglight works, defines key concepts and terms, and
describes vFoglight components.
This chapter contains the following sections:
Welcome to vFoglight ..................................................................................................................26
Key Concepts and Terms ............................................................................................................27
How vFoglight Works...................................................................................................................27
vFoglight Components.................................................................................................................35
26
vFoglight
Getting Started Guide
Welcome to vFoglight
What is vFoglight?
vFoglight is an application management solution that reduces or eliminates service
disruptions to unify IT and the business. Unlike other solutions, it provides a correlated,
360 degree view of your applications from end user to database and from service levels
to infrastructure—to source the root cause of every incident impacting your business
and fix them quickly. vFoglight correlates data from multiple perspectives into a single
version of the truth to provide deep insight into the service relationships that exist
between end users, the business and infrastructure components. Its unique adaptive
technology rapidly adjusts to change for improved application performance and service
levels, reduced operational cost and risk, and enhanced visibility for all stakeholders.
How vFoglight Organizes and Presents Data
One of the key features of vFoglight is its ability to dynamically create unique data
structures based on any data from any source. Rather than store data based on how it is
collected by agents, vFoglight can organize data based on your perception of the data. In
many cases, vFoglight is able to draw pictures of your monitored infrastructure that
match what you would draw. This includes high-level abstractions like applications and
services. All this is accomplished using a dynamic data transformation capability.
How vFoglight Helps
vFoglight helps application and information technology managers understand user
service levels, notify stakeholders when those service levels are violated, and assign
problem resolution tasks.
Introducing vFoglight
Key Concepts and Terms
Key Concepts and Terms
How vFoglight Works
Term
Definition
Monitored
environment
The hosts, server instances, databases, and other systems in
your environment that are monitored by vFoglight agents.
The data collected from your environment is used in the Foglight
Management Server, where it populates model instances, drives
rules, and can be rendered in views.
Topology
A representation of—and a way of understanding—the logical
and physical relationship between items in your monitored
environment. At run-time, vFoglight dynamically builds
topology model instances based on data about your system that
is collected by vFoglight agents. Topology models provide the
context for the metrics sent by the agents to the vFoglight
Management Server.
Model
The organizing principle used by vFoglight for data about your
monitored environment.
At run-time, vFoglight transforms monitoring data into model
instances. A model instance is a set of objects and relationships
designed to represent a monitored resource and its parts. Each
model instance is a representation of that model type. For
example, the HostModel type is a collection of Host objects;
each host object is one representation of the HostModel type.
vFoglight model instances hold collected data and transform it
into nodes, adding configuration data to each node as
properties, and attaching metric data to appropriate nodes as
metrics.
There are different types of models, including collection models
defined in vFoglight cartridges and models that you build, such
as applications and services.
27
28
vFoglight
Getting Started Guide
Term
Definition
Collection model
A model type for which the definitions are included with a
vFoglight cartridge. The cartridge can be one that is installed by
default with the Management Server or can be a cartridge for
monitoring a particular domain. A model instance of this type is
created from the collection of data from your monitored
environment.
Collection model instances include:
• Internal model instances, which represent data that
vFoglight collects about itself.
• Monitoring model instances, which represent data
collected from your monitored environment for a
particular domain.
Collection
Domain
A specific domain you are interested in monitoring and for
which vFoglight collects data and builds model instances.
vFoglight models have been built for domains including
Java, .NET, and custom applications (Siebel, PeopleSoft,
Oracle E-Business).
vFoglight collects data for four categories of domains:
application management, database, end-user, and infrastructure.
For example, you might collect end-user data as well as data for
an application domain such as WebLogic, a database domain
such as Oracle DB, and for an infrastructure domain such as
Windows.
There are vFoglight cartridges available for different collection
domains. See “Cartridges” on page 37 for a list of cartridges.
Monitoring Data
Data that is collected from your monitored environment by the
agents and transformed into a standard format for use by the
vFoglight Management Server.
Monitoring data includes both metrics and topology object
properties.
Topology Object
Property
Monitoring data that describes a topology object, for example, a
host name.
Introducing vFoglight
How vFoglight Works
Term
Definition
Observation
An observation taken over time, for example, a Metric,
StringObservation, or TopNList.
In vFoglight, every observation is linked to a specific part of the
topology model, for example, CPU utilization on a particular
monitored host.
Metric
A simple value observation measured over time, for example, a
count, rate, or percentage.
Service
In vFoglight, a service is defined as any grouping of meaningful
or interesting things in your monitored environment, for
example, a business process or an application. A service is often
governed by a Service Level Agreement (SLA).
Foglight allows you to define a new service and edit existing
services. See “Services” on page 32 for more information.
Service Levels
In vFoglight, service levels are availability measurements on
services. See “Service Levels, Alarms, and State” on page 33
for more information.
Service Level
Agreement
(SLA)
An agreement between information technology managers and
end-users on the availability of system and application
resources.
Application
A set of tiers in which each tier contains a set of monitored
elements, for example, hosts and servers. A tier has a defined
flow that represents data moving from the user to back-end
systems.
Foglight allows you to build models that represent your
monitored applications in a way that makes sense to you. A new
service is automatically created for each new application. See
“Applications” on page 34 for more information.
vFoglight
Management
Server
The central component of vFoglight. The Management Server
receives information from agents, stores and processes data, and
makes it available in the browser interface. See “vFoglight
Management Server” on page 35 for more information.
29
30
vFoglight
Getting Started Guide
Term
Definition
vFoglight Agent
Manager
A component that manages agents installed on monitored hosts.
See “vFoglight Agent Manager” on page 37 for more
information.
Cartridge
A unit that is added to the vFoglight Management Server.
Cartridges contain components that extend the functionality of
vFoglight, such as agents, rules, and views. See “Cartridges” on
page 37 for more information.
Agent
A vFoglight component that monitors a specific part of your
environment, such as an operating system, application, or
server.
Agents collect data from your monitored environment and send
it to the Management Server. See “Agents” on page 38 for more
information.
Rule
A piece of business logic that links a condition with a result.
vFoglight evaluates rule conditions against monitoring data. If a
condition evaluates to true, the results that are configured for
that condition occur, for example, an alarm is fired and an email
is sent.
Registry Variable
A variable stored in the vFoglight registry that can be used in
rule conditions, actions, and expressions. The value of a
vFoglight registry variable can be configured to change over
time.
Traditional monitoring systems collect metrics from agents and present them to you.
The context for these metrics (for example, host from which data is collected or the
name of the database) is gathered at the same time as the metrics and is associated with
them. This is an expensive way to store information: context tends to remain static over
time, but there are often multiple metrics for a single context. In addition, when you
store context this way, it makes it difficult to determine when the context changes—
which in itself may be something you are interested in monitoring. Traditional systems
also do not allow you to correlate metrics from different nodes in a system, or to derive
cluster data from individual server data.
vFoglight monitoring uses a different approach. vFoglight builds model instances from
collected data. A model instance is a set of objects and relationships designed to
represent a monitored resource and its parts. Each model instance is a representation of
Introducing vFoglight
How vFoglight Works
31
that model type. For example, the HostModel type is a collection of Host objects; each
host object is one representation of the HostModel type.
vFoglight models provide context for the metrics collected from your monitored
environment. The model instances are dynamic and can change and expand
automatically as the resources you are monitoring change. This approach allows you to
correlate data from different nodes and to derive cluster data.
vFoglight model instances are similar to organizational charts whose nodes contain
properties: metrics and alarms are attached to the nodes, and a node can be connected to
one or more other nodes.
Creating a vFoglight model establishes a hierarchical relationship among the nodes that
represents information about the collected data. Nodes can represent physical elements
of the system, such as CPU or memory, or logical elements such as EJBs (Enterprise
Java Beans) or JSPs (Java Server Pages).
A simple host model instance is illustrated in the diagram below:
This diagram illustrates a collection model instance created using monitoring data for a
particular domain (for example, an infrastructure domain such as Windows), and which
is a representation of a collection model type.
32
vFoglight
Getting Started Guide
In this collection model instance, a host is represented by a node. It has three child
nodes, which represent the CPU, memory, and disk of the host. The CPU and disk nodes
also have child nodes that represent the individual processors and file systems,
respectively.
The monitoring data that populates this collection model instance is a mix of
configuration data (host name, OS, patch level, CPU brand, clock speed, amount of
memory) and metrics (CPU usage, allocated memory). Each piece of data is stored only
once, but no context is lost. You can know the host name from the CPU or memory
nodes, even though the host name is not stored along with the CPU or memory
information. Metric data is also stored as part of the context. For example, if there are
two hosts, the CPU usage for Host A would be stored with the Host A instance.
What is truly innovative about vFoglight is that these models can be built for any
domain at any time. A model instance can be built at the click of a button in the browser
interface (using the service builder or application builder), or as a result of new data
arriving in the vFoglight Management Server. vFoglight models have been built for
multiple domains, including Java, .NET, database, and custom applications (Siebel,
PeopleSoft, Oracle E-Business). More importantly, models can be built that represent
anything in your monitored environment—your organizational structure, the physical
layout of your server room, or the geographical distribution of your data centers.
Once built, the artifacts that are part of a model are packaged into a cartridge (a .car file)
and installed on the vFoglight Management Server.
Services
In the context of vFoglight, a service can be any component or group of components
that you want to monitor. Typically, a service is a grouping of meaningful or interesting
things. Some services are created automatically—for example, for monitored hosts—
but most services are created by you to reflect what you find interesting and are
responsible for monitoring. Examples of services include:
• An application, including its web servers, application servers, and databases.
• A collection of related systems, such as all Windows machines in your monitored
environment.
• A business process, such as retail banking.
A service is often governed by a Service Level Agreement (SLA).
vFoglight allows you to define a new service; you can also make changes to existing
services, such as renaming a service while preserving the history for that service.
Introducing vFoglight
How vFoglight Works
33
When you define a service, a corresponding service level is automatically created. You
can also use Alarm Filters to decide what alarms are relevant to a given service and can
impact the availability of that service. See Services and availability below for more
information.
Using the Dynamic Managed Components feature, you can define a set of components
that will be automatically included in a service when certain data arrives.
The monitoring dashboards in Foglight are organized around the theme of services.
See the Foglight User Guide for more information about working with services.
Service Levels, Alarms, and State
In vFoglight, service levels are availability measurements on services. Default service
levels measure availability based on the state of individual nodes in a model instance.
A vFoglight rule evaluates a series of conditions designed to create an alarm if a
performance problem—an exception condition—has occurred. The alarm has one of
three severity levels: Warning, Critical, or Fatal. Rules are associated with nodes in the
model. When one of the conditions of a rule evaluates to true, an alarm is attached to the
node in the model instance with which the rule is associated.
A state is set for each node in a model instance. If there have been no exception
conditions, the node’s state is set to the default state Normal. However, if an alarm is
attached to a node, then the state of the node is set to the severity level of the alarm
(Warning, Critical, or Fatal). In general, the state of a node reflects the most severe
alarm attached to that node.
In addition to having an individual state, each node also has an aggregate state. By
default, the aggregate state of a node represents the state of itself and all its children.
Though there are some exceptions, in general, vFoglight calculates a node’s aggregate
state by evaluating the state of each of its child nodes and setting the aggregate state to
be equal to the most severe child node state. In this way, state is propagated up the
model instance.
Services and availability
The availability of a service is, by default, established based on a rollup of all the alarms
fired for the monitored components added to that service.
However, there can be cases in which you do not want this type of alarm rollup to be
performed. Often, only a subset of the alarms fired for a monitored component are
relevant to a given service.
34
vFoglight
Getting Started Guide
For example, an alarm fired by a rule called CPU Trending (which monitors the CPU
usage over the last 12 months) may be relevant to your Management Planning service,
but not to your Billing Application service. In this case, you would not want Fatal
alarms fired by this rule for a component of the Billing Application service to signal a
service outage.
vFoglight allows you to specify the alarms that are relevant to a given service by means
of Alarm Filters. See “Filtering Alarms” in the Foglight User Guide for more
information.
Applications
An application is a set of tiers. Each tier contains a set of monitored elements, such as
hosts and servers. A tier has a defined flow that represents the data moving from the
user to the back-end systems.
vFoglight allows you to build application models using components from existing
collection models. Application models represent data in a way that makes sense to you
by defining a business process, including user transactions, application tiers, and
locations of servers and hosts.
Application models summarize the relationship between your experience of your
monitored applications and the information technology infrastructure. vFoglight builds
this type of model by gathering data from the perspective of business functions rather
than from isolated pieces of the infrastructure.
A new service is automatically created for a new application. See the Foglight User
Guide for more information.
vFoglight Structure
vFoglight is offered in two editions - vFoglight Standard (SE) and vFoglight Pro.
• vFoglight SE is designed to help organizations monitor the performance of their
virtual infrastructures.
• vFoglight Pro includes all the features of vFoglight SE and adds advanced
capabilities for Chargeback, Physical Operating System (OS) Monitoring, ThirdParty Integration and more.
The table below illustrates the different features included in both versions. For more
information, contact a Vizioncore Sales representative ([email protected]).
Introducing vFoglight
vFoglight Components
35
vFoglight Components
vFoglight Management Server
The vFoglight Management Server is the central component of vFoglight. The
Management Server receives information from agents and makes it available in the
browser interface.
The vFoglight database stores all system, application, and performance data. Over time,
it becomes an invaluable source of historical information for planning future system
capacity requirements and for doing point-in-time analysis. The information in the
database can also be made available for use in external systems.
The Management Server performs continuous internal monitoring on itself and other
vFoglight components, as well as on the Java Virtual Machine (JVM) and the database.
vFoglight browser interface
vFoglight has a browser interface that displays data collected by vFoglight agents in
your monitored environment. It allows you to view this data in various formats and
levels of detail.
You can also use this interface to perform administrative tasks such as managing agents,
users, security, data, rules, and cartridges.
36
vFoglight
Getting Started Guide
The browser interface also includes the Administration home page, which allows you to
navigate to all Administration dashboards and presents a summary of information about
vFoglight from an administrative perspective.
The browser interface consists of three areas:
• A navigation panel that:
• Lists all of the dashboards that are available for viewing in the display area by
the current user.
• Provides access to the Administration home page and to the pages where you
perform administrative tasks.
• A display area in which you can view and create dashboards and reports.
• An action panel that:
• Lists the various actions that you can perform on the dashboard that is
currently displayed.
• Contains views and data that can be added to a dashboard or report that you
are creating.
• Provides access to the online help.
Note
The action panel is referred to as the page panel in the Web Component Framework
documentation, for example in the Web Component Reference.
See the Foglight User Guide and the Administration and Configuration Guide for more
information.
Customizable Dashboards
vFoglight also includes the Web Component Framework, which allows you to create
and populate your own custom interface views on top of the dynamic data schemas
generated by the Foglight Management Server. See the Web Component Guide and the
Web Component Tutorial for more information.
vFoglight command-line interface
vFoglight provides commands that allow you to manage and work with vFoglight
components without having to use the browser interface. These commands allow you to
perform tasks such as managing the vFoglight Management Server, the vFoglight Agent
Manager, agents, cartridges, and licences, as well as work with entities such as metrics,
monitoring policies, and schedules.
Introducing vFoglight
vFoglight Components
37
For example, this interface allows you to automate component-management tasks using
scripts or to use regular expressions to select multiple entities.
See the Command-Line Reference Guide for more information.
vFoglight Agent Manager
New in the 5.2.4 release of vFoglight, the vFoglight Agent Manager is the next
generation vFoglight component for managing and communicating with agents.
The vFoglight Agent Manager manages certain types of agents installed on monitored
hosts. It provides a centralized communications link between the vFoglight
Management Server and these agents and manages the agents’ life cycles. The
vFoglight Agent Manager also provides a number of support services such as
deployment, upgrade, and the ability to configure agents.
See the Administration and Configuration Guide for more information.
Cartridges
Cartridges extend the functionality of vFoglight and are installed on the vFoglight
Management Server. A cartridge contains one or more components, such as agents for
deployment, communication capabilities, and modifications to the way that data is
transformed or handled, as well as rules, reports, and views.
The following vFoglight cartridges are available for vFoglight Pro:
• vFoglight Cartridge for VMWare
• vFoglight Cartridge for Chargeback
• vFoglight Cartridge for Guest Process Investigation
• vFoglight Cartridge for Operating Systems
• vFoglight Cartridge for Integration
The following vFoglight cartridges are available for vFoglight SE:
• vFoglight Cartridge for VMWare
• vFoglight Cartridge for Guest Process Investigation
38
vFoglight
Getting Started Guide
When a cartridge is installed and enabled, all of its components become part of the
Management Server.
Adding cartridges to the vFoglight Management Server allows you to monitor
additional operating systems, processes, databases, applications, and servers in your
environment.
See the Administration and Configuration Guide for more information about managing
cartridges. See the cartridge documentation for information about each cartridge.
Agents
Agents are deployed on machines in your monitored environment and send data to the
vFoglight Management Server. Agents can monitor the availability and performance of
many aspects of your environment, including network services, operating systems,
databases, virtual hosts, log files, file systems, disk space and utilization, top
processes, custom applications, application servers, and Web servers.
There are several types of agents. One or more instances of each type of agent managed
by the vFoglight Agent Manager can be deployed per host. For example, there is an
agent that collects metrics from the operating system of the host machine. vFoglight
also includes internal agents that monitor vFoglight components and services.
See the Administration and Configuration Guide for more information about managing
and configuring agents. See the documentation for the cartridge in which the agent was
included for details about each agent.
3
First Steps
This chapter includes instructions on downloading vFoglight documentation and
software packages. Follow these instructions if you want to download vFoglight 5.2.4.
This chapter contains the following sections:
Downloading vFoglight ................................................................................................................39
Next Steps...................................................................................................................................40
Downloading vFoglight
The vFoglight application and documentation can be easily downloaded from the
Downloads page at www.vizioncore.com..
To download vFoglight:
1 Access the Vizioncore web page at http://www.vizioncore.com/.
2 On the navigation bar, click Downloads.
The Downloads page appears.
3 Select vFoglight from the list of available software.
Note
If you have purchased or are evaluating vFoglight Pro, the components for the
Cartridge for Operating Systems must also be downloaded from the Vizioncore
Downloads page.
4 Under Download Queue, in the upper right, click Download Now.
5 In the E-mail field, enter a valid e-mail address. Click Continue.
If you have previously downloaded software with this e-mail address, you will
receive a “Success . . .” message.
40
vFoglight
Getting Started Guide
If you have not previously downloaded software, or are using a different e-mail
address than used previously, you will be prompted to provide some basic
information before downloading. Complete the information, and click Continue.
6 Access your e-mail client and open the mail from “downloads”.
7 Click the link for the software package (a .zip file) that you want to download.
A file download dialog appears.
8 Click Save to proceed with downloading the documentation or software package.
Next Steps
Once you have downloaded the vFoglight v.5.2.4 documentation and software package,
you can get started with the installation and setup process. See Installation and Setup
Overview for summaries of the main steps involved in installing (or upgrading) and
configuring vFoglight.
4
Installation and Setup Overview
This chapter contains the following sections:
Getting Started with the Installation and Setup Process .............................................................42
Part 1: Installing or Upgrading the vFoglight Management Server..............................................43
Part 2: Initializing the Database, Starting the vFoglight Management Server, and Logging In....44
Part 3: Installing or Upgrading Cartridges ...................................................................................45
Part 4: Installing, Configuring, and Starting the vFoglight Agent Manager..................................46
Part 5: Deploying and Creating Agents .......................................................................................48
Next Steps...................................................................................................................................50
42
vFoglight
Getting Started Guide
Getting Started with the Installation and Setup Process
This chapter provides an overview of the vFoglight installation and setup process. It
summarizes the main steps involved in installing (or upgrading) and configuring
vFoglight and contains directions to the appropriate instructions in the Administration
and Configuration Guide and in the Installation and Setup Guide set. This chapter is
intended as a preface or supplement to these guides.
References to the Installation and Setup Guide Set
The vFoglight documentation suite comprises a multi-guide Installation and Setup
Guide set. The database- and platform-specific guides included in this set are listed in
“vFoglight Documentation Suite” on page 7.
Throughout this guide, instructions direct you to the Installation and Setup Guide where
the same type of chapter or section exists in all guides in the set. In these cases, refer to
the Installation and Setup Guide for the database and platform you are running.
Where a chapter or section exists only in a subset of the guides, those guides are referred
to specifically, either by name or type.
Before You Get Started
Before you install or upgrade vFoglight, review the components you plan to install (or
upgrade) and ensure that you have the necessary information, such as port numbers and
server names or the target installation locations. In addition, before you begin, you need
to:
• Determine if you are going to set up and run the vFoglight Management Server in
High Availability (HA) mode or as a standalone server.
Note
HA mode is only available in vFoglight Pro.
• Decide whether to use an embedded or external database.
The System Requirements and Platform Support Guide contains information you should
review prior to installation, such as:
• Supported platforms and Web browsers.
• Installation recommendations.
• Hardware requirements for the vFoglight Management Server and database.
• JRE requirements.
Installation and Setup Overview
Part 1: Installing or Upgrading the vFoglight Management Server
43
The Installation and Setup Guide also contains a brief overview of hardware
requirements and installation recommendations.
Prior to installing vFoglight, review the System Requirements and Platform Support
Guide as well as “Before Installing vFoglight” and “Preparing to Install” in the
Installation and Setup Guide.
Part 1: Installing or Upgrading the vFoglight Management
Server
The vFoglight 5.2.4 installer allows you either to install a new instance of the vFoglight
Management Server or upgrade an existing installation of the Management Server.
1 Before you begin: Review the sections of the System Requirements and Platform
Support Guide and the Installation and Setup Guide described in “Before You Get
Started” on page 42.
2 Install or upgrade the vFoglight Management Server:
If you are performing a new installation: Run the installer by following the
appropriate set of instructions in “Installing vFoglight” in the Installation and
Setup Guide.
If you are upgrading an existing installation: Consult the vFoglight 5.2.4
Upgrade Field Guide for detailed upgrade instructions.
3 Configure the vFoglight Management Server and database:
Configuring the vFoglight Management Server: Once you install the
Management Server, you may need to configure it, change its settings, or perform
other additional setup steps.
In addition, if you want to set up vFoglight Management Server Federation, postinstallation changes to configuration files are necessary.
Note
vFoglight Federation is an advanced feature, which requires separate dedicated
vFoglight Management Servers. Contact Vizioncore Sales for implementation
guidance. This feature is only available with the Pro edition of vFoglight.
For more information, see “vFoglight Settings” in the Installation and Setup
Guide for the platform and database you are running.
Configuring the database: Depending on the type of database you are running,
you may need to configure it or change its settings. For example:
44
vFoglight
Getting Started Guide
• If you are using an external database and chose the installer option to manually
set up the database later, see “Manual Database Configuration” in the
Installation and Setup Guide for your platform and external database.
• If you are using an external MySQL database, see “External MySQL Database
Access for Remote Users” in the Installation and Setup Guide for using an
external MySQL database on your platform.
• If you are using an external MySQL database and want to set up an encrypted
database connection, see “Setting Up an Encrypted Database Connection with
SSL” in the Installation and Setup Guide for using an external MySQL
database on your platform.
For more information, see “vFoglight Settings” in the Installation and Setup
Guide for the platform and database you are running.
Consult the “Installation Troubleshooting” section in the vFoglight Release Notes if you
encounter problems when performing the steps listed above.
Part 2: Initializing the Database, Starting the vFoglight
Management Server, and Logging In
The steps outlined in this section assume that you have already installed the vFoglight
Management Server. If you have not, refer to Part 1: Installing or Upgrading the
vFoglight Management Server for more information before proceeding.
1 Before you begin: If you are running a MySQL database (either embedded or
external) and want to migrate data to it from an existing MySQL database, follow
the instructions in “Migrating Data from an Existing Database” in the Installation
and Setup Guide for your platform and type of MySQL database (embedded or
external).
2 Initialize the Database:
• If you are using an external database, the database must be initialized
successfully before you can run vFoglight.
• If you are using the embedded database, the initialization is performed when
you start the vFoglight Management Server.
3 Start the vFoglight Management Server: The vFoglight Management Server
can be run in stand-alone mode, in High Availability (HA) mode (if you are using
an external database), or as a Windows service.
Installation and Setup Overview
Part 3: Installing or Upgrading Cartridges
45
See “Starting and Stopping the vFoglight Management Server” in the Installation
and Setup Guide for information about starting and stopping the Management
Server.
For information about running the Management Server as a Windows service, see
“Starting the vFoglight Management Server as a Windows Service” in the version
of Installation and Setup Guide — Installing on Windows for the database you are
using.
For information about running the Management Server in HA mode, see “High
Availability Mode” and “Starting and Stopping the Server in High Availability
Mode” in the version of the Installation and Setup Guide for the external database
and platform you are using.
See “Running the vFoglight Management Server” in the Command-Line
Reference Guide for the full set of options available for starting the Management
Server from the command line in either stand-alone or HA mode.
4 Log in to vFoglight: See “Logging in to vFoglight” in the vFoglight User Guide
for more information.
Part 3: Installing or Upgrading Cartridges
In addition to cartridges that contain components for monitoring additional parts of your
environment, vFoglight also comes with a cartridge that contains the vFoglight Agent
Manager installers for all supported platforms. The cartridge is called FglAM-all5_2_4.car. In addition, FglAM-<platform>-5_2_4.car files that contain platformspecific vFoglight Agent Manager installers.
Once the cartridge for the vFoglight Agent Manager is installed, you can download or
retrieve the installer for your platform and install the vFoglight Agent Manager as
described below in Part 4: Installing, Configuring, and Starting the vFoglight Agent
Manager.
You can install and manage cartridges using either the command-line interface or the
browser interface. In addition, you can download agent installers using the browser
interface. The instructions below assume that you are using the browser interface. See
“Managing Cartridges” in the Command-Line Reference Guide for information about
performing cartridge-management tasks from the command line.
1 Before you begin:
• Review the cartridge documentation for information about cartridge
installation prerequisites.
46
vFoglight
Getting Started Guide
• Ensure that the vFoglight Management Server is running and that you have
logged in to vFoglight.
• Ensure that you are granted the required permissions by your vFoglight
administrator to access the dashboards under the Administration module.
2 Install or upgrade the cartridge:
If you are installing a new cartridge: Install the cartridge by following the
instructions in “Installing and Managing Cartridges” in the Administration and
Configuration Guide.
If you are upgrading a cartridge: Install the cartridge by following the
instructions for that cartridge in the vFoglight 5.2.4 Upgrade Field Guide.
Caution
Do not disable the older cartridge before installing the new one. vFoglight
automatically disables the older cartridge as part of the upgrade process.
Once the new cartridge is enabled, you can then uninstall the older cartridge if
you choose.
Part 4: Installing, Configuring, and Starting the vFoglight
Agent Manager
The steps outlined in this section assume that you have already installed the cartridge
that contains the vFoglight Agent Manager installers. If you have not, refer to Part 3:
Installing or Upgrading Cartridges for more information before proceeding.
You can download vFoglight Agent Manager installers from the Components for
Download dashboard using your browser. Additionally, in situations where
unauthenticated or headless access to the installers is required, you can access a URL
for direct download using a browser or a file retrieval tool (for example, Wget).
1 Before you begin:
• Ensure that the vFoglight Management Server is running and that you have
logged in to vFoglight.
• Ensure that you have the required permissions from your vFoglight
administrator for the dashboards under the Administration module.
• Identify the host name and Management Server port of each vFoglight
Management Server with which the vFoglight Agent Manager is supposed to
communicate.
Installation and Setup Overview
Part 4: Installing, Configuring, and Starting the vFoglight Agent Manager
47
2 Download or retrieve the vFoglight Agent Manager installer: The different
ways to obtain the installer for your platform (fglam-<platform>.[bin|exe]) are
described below. See the table in “vFoglight Agent Manager Platform Support
Matrix” in the Installation and Setup Guide for the name of the installer for your
platform.
• Download the installer from the Components for Download dashboard in
vFoglight to each machine where you want to install the vFoglight Agent
Manager: For instructions on navigating to and downloading installers from
this dashboard, see “Using the Components for Download Dashboard” in the
Installation and Setup Guide for your platform.
• Download or retrieve the installer from a URL to each machine where
you want to install the vFoglight Agent Manager: In situations where
unauthenticated or headless access to the installers is required, you can access
a URL for direct download using a browser or a file retrieval tool (for
example, Wget). No login to vFoglight is required. For instructions on
navigating to and downloading installers from this URL, see “Using the
vFoglight Agent Manager Installer Servlet” in the Installation and Setup
Guide for your platform.
3 Install the vFoglight Agent Manager:
If you are installing a new vFoglight Agent Manager: There are different ways
to install the vFoglight Agent Manager: using the installer GUI, from the
command-line, or using the silent (non-interactive) installer. Follow the
appropriate set of instructions in “Installing the vFoglight Agent Manager” in the
Installation and Setup Guide for your platform.
If you are upgrading from the vFoglight Client to the vFoglight Agent
Manager: Consult the vFoglight 5.2.4 Upgrade Field Guide for detailed upgrade
instructions.
4 Configure the vFoglight Agent Manager: Some configuration of the vFoglight
Agent Manager can be performed during installation. In addition, the vFoglight
Agent Manager can be configured after installation, for example to set items such
as:
• The host display name (the host name reported by the vFoglight Agent
Manager instance). This setting can be used in situations where the host name
is not sufficient, such as when a host machine is configured with multiple IP
addresses or hostnames.
• HTTP proxy server URL and authentication information.
• A special SSL override option (for using a self-signed server SSL certificate).
48
vFoglight
Getting Started Guide
See the file fglam.config.xml in the directory in which the vFoglight Agent
Manager is installed for details about these and other configuration options. See
also “Configuring the vFoglight Agent Manager” in the Installation and Setup
Guide for information about a vFoglight Agent Manager configuration interface
that you can run after installation.
The vFoglight Agent Manager automatically detects HA-enabled Management
Servers and configures itself for them. However, you might need to perform some
additional configuration if, for example, a Management Server in the HA cluster
has special SSL certificate requirements or if it is using a proxy.
Depending on the platform on which the vFoglight Agent Manager is installed
and the mode in which vFoglight is running, you may need to perform additional
configuration steps. For example:
• If you are running vFoglight in HA mode, see “Getting Started with Server
Commands” (in the chapter “Managing the vFoglight Management Server”) in
the Command-Line Reference Guide for information about configuring the
Remote Monitor utility.
5 Start the vFoglight Agent Manager: See “Running the vFoglight Agent
Manager” in the Installation and Setup Guide for information about starting the
vFoglight Agent Manager.
See “Running the vFoglight Agent Manager” in the Command-Line Reference
Guide for information about starting the vFoglight Agent Manager using the
command-line interface.
Part 5: Deploying and Creating Agents
You must install and configure the vFoglight Agent Manager before deploying agents
that are installed on a monitored host. The steps outlined in this section assume that you
are deploying agents managed by the vFoglight Agent Manager. In addition, they
assume that you have already installed and (if necessary) configured the vFoglight
Agent Manager on each host where you want to deploy agents. If you have not, refer to
Part 4: Installing, Configuring, and Starting the vFoglight Agent Manager before
proceeding.
Note
This is only necessary with vFoglight Pro. vFoglight SE does not require additional agents.
Installation and Setup Overview
Part 5: Deploying and Creating Agents
49
1 Before you begin:
• Review the documentation for the cartridge in which the agent is included for
information about agent installation prerequisites.
• Ensure that the vFoglight Management Server is running and that you have
logged on to vFoglight.
• Ensure that you are granted the required permissions by your vFoglight
administrator to access the dashboards under the Administration module.
• Ensure that the vFoglight Agent Manager is running on the machine(s) where
you want to deploy agents.
2 Deploy agents and create agent instances:
First, agent packages need to be deployed to the vFoglight Agent Manager
running on the host that you want to monitor. Once you have deployed agents,
you can create agent instances on that host.
There are two ways to deploy and create agents: from the browser interface or
from the command line:
• See “Deploying Agent Packages to a Monitored Host” and “Creating Agent
Instances on a Monitored Host” in the Administration and Configuration
Guide for instructions on deploying and creating agents from the Agent Status
dashboard.
See “Deploying Agent Packages to Multiple Hosts” and “Creating Agent
Instances on Multiple Hosts” in the Administration and Configuration Guide
for instructions on deploying agents to multiple hosts and creating agents on
multiple hosts from the Agent Hosts dashboard.
• See “Using the command line to deploy agent packages” and “Using the
command line to create agent instances” in the Administration and
Configuration Guide for instructions on deploying and creating agents from
the command-line.
See “Managing Agents” in the Command-Line Reference Guide for details
about the commands available for deploying and creating agents from the
command-line.
3 Configure agents: After you deploy and create agents, you may need to edit the
agents’ properties. See “Managing Agent Properties by Type” in the
Administration and Configuration Guide for information about agent properties.
See the documentation for the cartridge in which the agent is included for
information about the specific configuration options that are available for each
agent.
50
vFoglight
Getting Started Guide
4 Manage agents: You can perform agent-management tasks like starting,
stopping, activating, deactivating, deleting, and setting blackout periods for
agents from the browser interface and from the command line. See “Accessing
the Agent Status Dashboard” and “Assigning Blackouts to Agent Instances” in
the Administration and Configuration Guide for instructions on managing agents
from the browser interface. See “Managing Agents” in the Command-Line
Reference Guide for details about the commands available for managing agents
from the command line.
Next Steps
Once you have completed the installation and setup process, you can get started using
vFoglight. See Starting Points in vFoglight for descriptions of default views and
dashboards where you may want to begin.
5
Starting Points in vFoglight
vFoglight offers a wide range of functionality through its customizable dashboards. This
means that there are multiple starting points and workflows available for users with
different roles and needs—administrators in charge of managing vFoglight, operational
users interested in troubleshooting problems throughout their monitored environment,
users focused on monitoring a specific domain or system, or users interested in services
management.
When you log in to vFoglight, several monitoring dashboards are initially selected as
starting points and listed under Homes in the navigation panel. This chapter provides an
overview of dashboards that can be used as starting points in vFoglight: two monitoring
dashboards listed by default under Homes and one administration dashboard in the
Administration module (Dashboards > Administration), which can be accessed from
the Administration home page (Homes > Administration > Navigation > Explore).
Terminology specific to the vFoglight browser interface is used throughout this chapter;
see “Introducing the Browser Interface” in the vFoglight User Guide for more
information about these terms.
Note
This chapter uses a facing page layout: details about the numbered items shown in the
images are provided on the following page. Select one of the facing page layout options in
your PDF viewer before proceeding.
This chapter contains the following sections:
Before You Get Started ...............................................................................................................52
Services Dashboard ....................................................................................................................54
Hosts Dashboard.........................................................................................................................56
Agent Status Dashboard .............................................................................................................58
Next Steps...................................................................................................................................60
52
vFoglight
Getting Started Guide
Before You Get Started
The section below provides getting started tips on common elements in the browser
interface and features that can affect how you see data in the monitoring dashboards.
Working in a Current or a Diagnostic Time Range
This getting started tip helps you understand whether you are working in a real time
range or a diagnostic time range and how to switch from one to the other.
Note
Some pages do not take a time range input and so do not display a time range.
By default, the time range at the top of a dashboard is in real time. When the time range
is in real time, the
icon and the word Now are shown in the time range display.
Figure 1
Hovering over the real time range icon displays a message that identifies the time range
as real and informs you how to freeze the time range.
Figure 2
If you drill down on an alarm, vFoglight disconnects from real time and enters a
diagnostic time range. The diagnostic time range spans the same length of time as the
current time range did prior to the drill down.
Within a diagnostic time range, vFoglight typically sets three-quarters of this span to
occur prior to the alarm being fired and one-quarter to occur after. For example, if the
current time range spans four hours, when you drill down on an alarm, the diagnostic
time range also covers a four-hour interval, from three hours prior to when the alarm
fired to one hour after it fired (as shown in the image below).
Starting Points in vFoglight
Before You Get Started
53
Figure 3
In some cases, however, the alarm might have occurred close enough to the current
moment that the last quarter of the diagnostic time range would cover a span of time that
is in the future. If that is the case, vFoglight sets the diagnostic time range to end at the
current moment (shown as Now in the time range display).
When you are working in a diagnostic time range, no new data is displayed in the views
on the dashboard. vFoglight indicates that you have frozen the time range and entered a
diagnostic time range by presenting a frozen time range
display.
icon in the time range
Figure 4
Hovering over the icon displays a message that identifies the time range as frozen and
informs you how to switch to real time.
Figure 5
Until you unfreeze the time range, all drilldowns and navigation to views that use the
global time range are frozen in this diagnostic time range.
Unfreezing the time range causes it to revert to the last monitoring time range that you
used. For more information on current and diagnostic time ranges, see “Time Range” in
the vFoglight User Guide.
54
vFoglight
Getting Started Guide
Services Dashboard
This section provides an introduction to the Services dashboard. For details about this
dashboard, see “Monitoring Services” in the vFoglight User Guide. For more
information about services, see “Services” on page 32.
A service can be any grouping of monitored components. vFoglight creates default
services and allows you to create custom services structured around what you want to
monitor, enabling you to tailor the way data is presented to suit your specific needs.
You can use the Services dashboard to view the state of your services. From this
dashboard, you can drill down to find out more information about a service and its
monitored components.
If you are monitoring services, this dashboard is a good one to use: you can filter the list
of services to show only the ones of greatest interest to you, and see the state of the
SLAs for each of those services. You can also use this dashboard as the starting point in
a service-oriented workflow. See the vFoglight User Guide for details about the
drilldowns available from the Services dashboard.
Figure 6
Starting Points in vFoglight
Services Dashboard
55
1 — Categories and Services view: lists monitored services by category. For example,
the screen on page 54 shows two categories of monitored services, Hosts and
Applications. The services in these categories were created automatically for the
monitored host Host01 and for the user-created application model AppGroup1. You can
filter the categories displayed in this view using the Category Selector dialog (General
> Actions > Category Selector from the action panel); see “Filtering the Categories
and Services List” in the vFoglight User Guide for details.
Tip
Click the name of a category or service to display a popup with details about that item and
links to more detailed views. See the table in “Viewing Details about a Service” in the
vFoglight User Guide for more information about these links.
2 — Service Level Compliance column: shows the service level for the category or for
a specific service. vFoglight automatically creates a service level for each service. The
level of compliance is determined by the component in the most severe state. See
“Service Levels, Alarms, and State” on page 33 for more information.
Tip
Click an icon in this column to display a popup with more information about the Service Level
Agreement for the category or service. Follow the Explore > Service Level Agreement(s)
link in the popup to navigate to the Service Levels dashboard populated with information
specific to that category or service. See “Viewing Service Levels” in the vFoglight User Guide
for more information about the Service Levels dashboard.
3 — Alarms column: shows the number of alarms for the category or service. Clicking
one of the icons in this column causes an Outstanding Alarm(s) view to appear with a
list of alarms specific to that category or service.
4 — Outstanding Alarm(s) for Selected Categories view: lists all outstanding alarms
and alarms cleared within the time range displayed at the top of the dashboard for the
categories shown in the Categories and Services view. You can filter the alarms
displayed in this view using the Alarm Filter Applied/Not Set dialog (click Alarm
Filter Applied or Alarm Filter Not Set in the title bar to launch this dialog); see
“Filtering the Alarms View” in the vFoglight User Guide for details. In addition, you
can change the perspective on alarms by selecting one of the tabs at the top of the table;
see “Alarm List” in the vFoglight User Guide for details.
Tip
Click anywhere in the row for an alarm to display a popup with details about that alarm and
links to drilldowns. See “Alarm Details” in the vFoglight User Guide for details.
56
vFoglight
Getting Started Guide
Hosts Dashboard
This section provides an introduction to the Hosts dashboard and the views and
dashboards to which you can drill down from it.
You can use the Hosts dashboard to monitor problems in your environment by focusing
on a set of hosts. From this dashboard, you can drill down to different dashboards and
views, depending on the host type (physical or virtual). The icons in the Host > Type
column identify the host as physical or virtual: physical hosts are identified by the icon
, VMWare images by the icon , and ESX servers by the icon .
You can drill down on a physical host (monitored by Cartridge for Operating Systems
agents) to see a real-time monitor for a particular host, details about its alarms, or details
about its CPU, memory, disk, or network-related performance.
You can drill down on a virtual host (monitored by Cartridge for VMWare agents) to see
a vmMonitor Virtual Machine dashboard (if the host is a VMWare image); a vmMonitor
ESX Server dashboard (if the host is an ESX server); details about its alarms or details
about its CPU, memory, disk, or network-related performance. Note that this
functionality will be available as of the 5.2.4 release of the Cartridge for VMWare.
If you are responsible for the availability of a set of hosts and prefer to think in terms of
systems, this dashboard can be helpful as it allows you to view a summary of the state
and performance of those hosts.
In addition, you can filter the list of hosts to show all hosts, only active hosts, or only the
hosts associated with a particular service (General > Actions > Host Filter from the
action panel). You can also use this dashboard as the starting point in a host-oriented
workflow.
Figure 7
Starting Points in vFoglight
Hosts Dashboard
57
1 — State indicators: allow you to see at a glance the state of the listed hosts. Each
indicator shows the aggregate alarm state of the host, which is determined by the most
severe alarm for the host. In this dashboard, the indicator represents a state rollup from
the host and its children, excluding the state of agents on that host.
2 — Host name: clicking the host name allows you to drill down to a real-time monitor
that provides you with an overview of that host’s health. Drill down to this monitor if
you want to see detailed information about how a host is functioning for the time range
displayed at the top of the dashboard. A different monitor appears depending on
whether the host is physical (identified by the Host Type indicator ) or virtual
(identified by the Host Type indicator
for an ESX server or
for a VMWare
image). For example, drilling down on a physical host displays a monitor with
information such as the number of processes running on it and the top consumers of
various metrics.
Tip
You can drill down on items in the monitor. For example, if you are interested in investigating
memory consumption on a physical host and drill down the monitor for that host, click the
Memory button to view memory-related metric charts and tables, such as charts for the top
memory consumers on that host.
3 — Alarms column: shows the number of alarms for each host. If you are
investigating alarms for a host, click one of the icons in this column to cause an
Outstanding Alarm(s) view to appear with a list of alarms specific to that host. You can
filter the alarms displayed in this view using the Alarm Filter Applied/Not Set dialog
(click Alarm Filter Applied or Alarm Filter Not Set in the title bar to launch this
dialog); see “Filtering the Alarms View” in the vFoglight User Guide for details. In
addition, you can change the perspective on alarms by selecting one of the tabs at the
top of the table; see “Alarm List” in the vFoglight User Guide for details. In the
Outstanding Alarm(s) view, click anywhere in the row for an alarm to display a popup
with details about that alarm and links to drilldowns. See “Alarm Details” in the
vFoglight User Guide for details.
4 — CPU, Memory, Disk, and Network columns: each column displays recent and
current values for that category of metrics. These columns allow you to obtain a concise
overview of CPU-, memory-, disk-, and network-related performance for each host. The
values displayed in the sparkline change in accordance with the time range selected at
the top right of the dashboard.
Tip
If you want to perform further investigation on CPU-, memory-, disk-, and network-related
performance for a host, click either the sparkline or current value to drill down to a dashboard
with more detailed information for that metric category.
58
vFoglight
Getting Started Guide
Agent Status Dashboard
This section introduces the Agent Status dashboard, which can be accessed from the
Administration module (Dashboards > Administration > Agents > Agent Status) and
from the Administration home page (Homes > Administration > Navigation >
Explore > Agents > Status). For details about this dashboard see “Accessing the Agent
Status Dashboard” in the Administration and Configuration Guide.
An agent monitors a specific part of your environment, such as an operating system,
application, or server. Agents collect data from your monitored environment and send
that data to the vFoglight Management Server.
If you are assigned the Administrator role, you can use this dashboard to activate and
deactivate vFoglight agents, cause agents to start and stop collecting data, and view
information about agents. If you are responsible for monitoring a large number of
agents, you can tag agents using the Edit Tags dialog accessible from this page. The
agent tagging feature allows you to form logical groups of agents (for example, subsets
of agents of the same type) by applying tags and then editing and managing the agents’
properties based on their tag(s).
The Agent Status dashboard lets you see whether agents are deployed, activated, and
collecting data, or take the appropriate action if this is not the case. It can also be used as
the starting point in a workflow focused on agent administration.
Starting Points in vFoglight
Agent Status Dashboard
59
1 — Filter by <parameter> boxes: allow you to filter the list of agents by one or more
of the following parameters: Host Name, Agent Name, Namespace, Type, Version,
Build, Tags, Status, and Properties.
Tip
The agent list can be filtered by whole or partial parameters. Simply start typing the parameter
in the appropriate Filter by field to cause vFoglight to filter the list.
2 — List of agents: displays the created agents, listing for each instance details such as
its name, version, type, and the name of the host on which it is running. The Activated
, Data Collection Started , and Data Collection Stopped icons indicate the status
of each agent. Any tags applied to the agents are also listed in this table. See “Editing
Agent Tags” in the Administration and Configuration Guide for more information.
Tip
In the list of agents, click a column header to sort the table by that parameter.
3 — Deploy Agent Package and Create Agent buttons: allow you to deploy agents to
a host where the vFoglight Agent Manager is running and create new agent instances.
See “Using the Agent Status dashboard to deploy an agent package” and “Using the
Agent Status Dashboard to create agent instances” in the Administration and
Configuration Guide for more information.
Tip
If you want to deploy and create agents on multiple hosts, use the Deploy Agent Package and
Create Agent dialogs accessible from the Agent Hosts dashboard (Administration > Agents
> Agent Hosts > Deploy Agent Package and Create Agent). See “Deploying agent
packages to multiple hosts” and “Creating agent instances on multiple hosts” in the
Administration and Configuration Guide for more information.
4 — Button array: allows you to perform various actions related to the selected agent.
The set of buttons that are enabled depends on the state of the selected agent. This set
also varies if you have selected more than one agent. See “Accessing the Agent Status
Dashboard” in the Administration and Configuration Guide for more information about
the actions you can perform after clicking these buttons.
60
vFoglight
Getting Started Guide
Next Steps
Your next steps depend on how you are using this guide and the way you want to use
vFoglight. Some examples are provided below.
• If you read this guide prior to installing vFoglight: select the appropriate
platform- and database-specific Installation and Setup Guide and follow the
instructions for installing and configuring vFoglight.
• If you are an operator responsible for monitoring a large environment: you
can follow a service- or host-oriented workflow. For example, if you are
responsible for ensuring the availability of all Windows hosts in your monitored
environment, you can follow a service-oriented workflow based around the Hosts
> Windows service that begins in the Services dashboard.
Alternatively, if you prefer a less abstract approach, you can follow a hostoriented workflow that begins in the Hosts dashboard.
• If you are a technical expert interested in monitoring a specific domain: start
with the documentation included with the vFoglight cartridge for monitoring that
domain.
• If you are interested in monitoring services: you can follow a service-oriented
workflow. See the vFoglight User Guide for details about the drilldowns
available from the Services dashboard.
• If you want to customize aspects of the vFoglight browser interface: begin by
following the instructions in “Customizing vFoglight” in the vFoglight User
Guide.
• If you are a vFoglight administrator: consult the Administration and
Configuration Guide and the Command-Line Reference Guide for information
about performing administrative tasks (in addition to those described above) from
the vFoglight browser interface and from the command line.
• If you want to create custom dashboards: review the information in “Creating
a Custom Dashboard” in the vFoglight User Guide. You could then learn more
about creating dashboards by following “Tutorial 1: Creating a Dashboard” in the
Web Component Tutorial.
• If you want to create custom views: begin by following “Tutorial 3: Adding
Views” in the Web Component Tutorial. After this tutorial, consult the Web
Component Guide and the HTML Web Component Reference pages. These
resources can help you create new views using the Web Component Framework
technology.
Index
Index
A
about vFoglight 6
Administration home page 36, 51
navigation to the Agent Status dashboard 58
Administrator role
Agent Status dashboard 58
after reading this guide
next steps 60
agent 30
defined 58
Agent Hosts dashboard
creating/deploying multiple hosts agents 59
agent management component 30
Agent Status dashboard
Administrator role 58
agent tagging 58
Button array 59
Create Agent button 59
Deploy Agent Package button 59
filtering fields 59
List of agents 59
starting agent-oriented workflows 58
starting points 58
agent status icons
List of agents 59
agent tagging
Agent Status dashboard 58
List of agents 59
alarm rollup
for services 33
Alarms column
Hosts dashboard 57
Outstanding Alarm(s) for Selected Categories
view 55
Outstanding Alarm(s) view 57
Services dashboard 55
application 29
availability measurement on services 29
availability of services 33
B
business processes 29
Button array
Agent Status dashboard 59
C
cartridge 30
supported in vFoglight Pro 37
Supported in vFoglight SE 37
Categories and Services view
details popup 55
Services dashboard 55
Category Selector dialog
filtering categories 55
changing alarm perspective
Outstanding Alarm(s) for Selected Categories
view 55
Outstanding Alarm(s) view 57
changing information categories
Outstanding Alarm(s) for Selected Categories
view 55
Outstanding Alarm(s) view 57
collection domain 28
collection model 28
component
vFoglight Agent Manager 30
configuring
vFoglight Agent Manager 46
configuring browser interface
next steps 60
61
62
vFoglight
Getting Started Guide
contacting
Vizioncore 10
CPU, Memory, Disk, Network columns
details dashboard 57
Hosts dashboard 57
sparkline values 57
Create Agent button
Agent Status dashboard 59
Create/Deploy Agent buttons
creating new agent instances 59
creating custom dashboards
next steps 60
creating custom views
next steps 60
creating new agent instances
Create/Deploy Agent buttons 59
creating/deploying multiple hosts agents
Agent Hosts dashboard 59
current time range 52
custom
services 54
customizable dashboards
defined 51
starting points 51
D
data
collected from your monitoring environment 28
Deploy Agent Package button
Agent Status dashboard 59
details dashboard
CPU, Memory, Disk, Network columns 57
Host name 57
details popup
Categories and Services view 55
Outstanding Alarm(s) for Selected Categories
view 55
Outstanding Alarm(s) view 57
Service Level Compliance column 55
determining compliance levels
severe state components 55
diagnostic time range 52
documentation 7
cartridge 9
core 8
feedback 9
suite 7
downloading vFoglight 39
E
environment
monitored by vFoglight 27
F
filtering alarms
Outstanding Alarm(s) for Selected Categories
view 55
Outstanding Alarm(s) view 57
filtering by whole/partial parameters
filtering fields 59
filtering categories
Category Selector dialog 55
filtering fields
Agent Status dashboard 59
filtering by whole/partial parameters 59
freezing the time range 52
Fvoglight Agent Manager
starting 46
H
Homes
navigation panel 51
Host name
details dashboard 57
Hosts dashboard 57
real-time details monitoring 57
Hosts dashboard
Alarms column 57
CPU, Memory, Disk, Network columns 57
Index
Host name 57
monitoring hosts 56
starting host-oriented workflows 56
starting points 56
State indicators 57
after reading this guide 60
configuring browser interface 60
creating custom dashboards 60
creating custom views 60
large environment monitoring 60
performing administrative tasks 60
services monitoring 60
specific domain monitoring 60
I
installing
vFoglight Agent Manager 46
L
large environment monitoring
next steps 60
List of agents
Agent Status dashboard 59
agent status icons 59
agent tagging 59
parameter sorting 59
M
Management Server 29
measuring availability on services 29
metric 29
model 27
models
topology 27
monitored environment 27
organizing principle for data from 27
relationship between items 27
monitoring data 28
monitoring hosts
Hosts dashboard 56
monitoring services
Services dashboard 54
N
navigation panel
Homes 51
next steps
O
observation 29
Outstanding Alarm(s) for Selected Categories view
Alarms column 55
changing alarm perspective 55
changing information categories 55
details popup 55
filtering alarms 55
Outstanding Alarm(s) view
Alarms column 57
changing alarm perspective 57
changing information categories 57
details popup 57
filtering alarms 57
P
parameter sorting
List of agents 59
performing administrative tasks
next steps 60
R
real time range 52
real-time details monitoring 57
registry variable 30
Remote Monitor 48
rollup of alarms
for services 33
rule 30
63
64
vFoglight
Getting Started Guide
S
service 29
defined 54
service level 29
service level agreement 29
Service Level Compliance column
details popup 55
Services dashboard 55
services
availability 33
custom 54
Services dashboard
Alarms column 55
Categories and Services view 55
monitoring services 54
Service Level Compliance column 55
starting service-oriented workflows 54
viewing services state 54
services monitoring
next steps 60
severe state components
determining compliance levels 55
SLA 29
sparkline values
CPU, Memory, Disk, Network columns 57
specific domain monitoring
next steps 60
starting
vFoglight Agent Manager 46
starting agent-oriented workflows
Agent Status dashboard 58
starting host-oriented workflows
Hosts dashboard 56
starting points
Agent Status dashboard 58
customizable dashboards 51
Hosts dashboard 56
starting service-oriented workflows
Services dashboard 54
State indicators
Hosts dashboard 57
suite 7
T
text conventions 10
time range
current (real time) 52
diagnostic (frozen) 52
topology 27
topology object property 28
U
unfreezing the time range 52
V
vFoglight
downloading 39
vFoglight Agent Manager 30
configuring 46
installing 46
vFoglight component
agent 30
cartridge 30
Management Server 29
vFoglight Editions
vFoglight Pro 34
vFoglight SE 34
vFoglight Management Server 29
vFoglight registry 30
viewing services state
Services dashboard 54