1
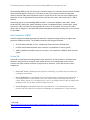
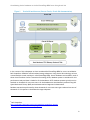
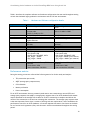
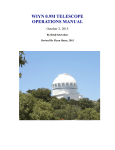
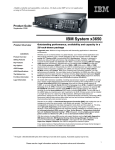
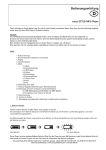
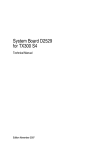
Consolidating Oracle Databases on the Dell PowerEdge R820 Server Using Oracle VM Consolidating Oracle Databases on the Dell PowerEdge R820 Server Using Oracle VM This technical whitepaper describes how the Dell PowerEdge R820 server can be used for consolidating Oracle databases. The Dell PowerEdge 12th generation R820 is a 2U server supporting 4 sockets and 1.5 TB of memory which makes it a best fit for virtualization environments. This paper further details how R820 together with Oracle VM can be used for consolidation. e Note: See page 5 for template instructions. Delete this note from the final document. Phani MV Ramamohan Reddy K Dell Oracle Database Solutions Engineering April 2013 1 Consolidating Oracle Databases on the Dell PowerEdge R820 Server Using Oracle VM This document is for informational purposes only and may contain typographical errors and technical inaccuracies. The content is provided as is, without express or implied warranties of any kind. © 2013 Dell Inc. All rights reserved. Dell and its affiliates cannot be responsible for errors or omissions in typography or photography. Dell, the Dell logo, and PowerEdge are trademarks of Dell Inc. Intel and Xeon are registered trademarks of Intel Corporation in the U.S. and other countries. Microsoft, Windows, and Windows Server are either trademarks or registered trademarks of Microsoft Corporation in the United States and/or other countries. Other trademarks and trade names may be used in this document to refer to either the entities claiming the marks and names or their products. Dell disclaims proprietary interest in the marks and names of others. March 2013 | Rev 1.0 2 Consolidating Oracle Databases on the Dell PowerEdge R820 Server Using Oracle VM Contents Executive summary ..................................................................................................... 5 Introduction ............................................................................................................. 5 Technology overview ................................................................................................... 6 Dell PowerEdge R820 architecture................................................................................ 6 Dell Compellent SC8000 ............................................................................................ 7 Oracle VM ............................................................................................................. 7 Test configuration ...................................................................................................... 9 Performance metrics .............................................................................................. 10 Performance testing utility ...................................................................................... 11 Scale factor ......................................................................................................... 11 Test methodology..................................................................................................... 11 Performance results and analysis .................................................................................. 13 Legacy Power Edge 2950 results ................................................................................ 13 PowerEdge R820 results .......................................................................................... 15 Comparison ......................................................................................................... 17 Consolidation factor ............................................................................................... 19 Summary ............................................................................................................... 20 References ............................................................................................................. 20 Appendix ............................................................................................................... 20 A. Database management software ............................................................................ 20 Tables Table 1. Hardware and Software configuration details ...................................................... 10 Figures Figure 1. Oracle VM architecture (Source: Oracle, Oracle VM documentation) ............................ 8 Figure 2. Test environment architectural diagram .............................................................. 9 Figure 3. AQRT of legacy production environment at saturation ........................................... 13 Figure 4. CPU utilization of legacy production environment at saturation ............................... 13 Figure 5. TPS of legacy production environment at saturation ............................................. 14 Figure 6. AQRT of R820 test environment ....................................................................... 15 Figure 7. CPU Utilization of R820 test environment ........................................................... 15 Figure 8. TPS of R820 test environment ......................................................................... 16 Figure 9. Userload supported on R820 at 70% utilization ..................................................... 16 Figure 10. Consolidated userload on R820 at 70% utilization .................................................. 17 3 Consolidating Oracle Databases on the Dell PowerEdge R820 Server Using Oracle VM Figure 11. TPS Comparison of legacy vs R820 .................................................................... 17 Figure 12. Supported Userload comparison of legacy vs R820 ................................................. 18 Figure 13. CPU utilization comparison of legacy vs R820 ...................................................... 18 Figure 14. Power Consumption vs Userload ....................................................................... 19 4 Consolidating Oracle Databases on the Dell PowerEdge R820 Server Using Oracle VM Executive summary The Dell™ enterprise portfolio is evolving to incorporate better-performing, more energy-efficient, and more highly-available products. With the introduction of Dell’s 12th generation server product line, customers have an opportunity to improve their total cost of ownership by consolidating distributed legacy environments. With the advent of virtualization technology, datacenter resources can be better utilized. Virtualization enables you to create multiple virtual servers within a single physical server. The latest Dell PowerEdge 12th generation servers are equipped with greater CPU, memory, and network resources. Coupling virtualization with the latest and powerful Dell PowerEdge 12th generation 12G servers delivers benefits far beyond simple physical server consolidation: using Oracle VM virtualization, multiple databases can now be consolidated into a single R820. Dell strives to simplify IT infrastructure by consolidating legacy production environments to reduce data center complexity while still meeting customers’ needs. The tools and procedures described in this whitepaper can help administrators test, compare, validate, and implement the latest hardware and database solution bundles. This whitepaper explains how to: Consolidate multiple legacy servers to PowerEdge R820 Servers. Consolidate and run multiple oracle databases on a single PowerEdge R820 server using Oracle VM virtualization. Optimize the TCO of Dell solutions. Achieve the benefits of consolidation and virtualization. Key findings include: 10:1 to 12:1 consolidation possibility 50% Power Consumption Savings Introduction Server consolidation can be defined as maximizing the efficiency of server resources, thereby minimizing the infrastructure, associated power and cooling, rack footprint, and licensing costs. Consolidation essentially solves a fundamental problem—often referred to as server sprawl—in which multiple, underutilized servers take up more space and consume more power resources than the workload requirement indicates. Server consolidation can be done in both physical and virtual infrastructures. This whitepaper discusses the use of virtual consolidation using Oracle VM virtualization. Consolidation in a virtual environment offers more flexibility to the customer. Resources can be used more flexible manner—add CPU, memory and network resources as and when needed based on requirements 5 Consolidating Oracle Databases on the Dell PowerEdge R820 Server Using Oracle VM Add more database servers by deploying more virtual machines (VM) Virtualization offers better high availability with the help of VM migration Thus Oracle VM virtualization technology brings more value add in terms of server consolidation. Storage infrastructure is equally important when compared to server infrastructure. An intelligent, feature rich storage solution compliments server infrastructure. Dell Compellent storage is based on innovative Dell fluid data architecture that dynamically moves the data based on access patterns and adapts to the usage scenario. Dell Compellent virtual storage helps to meet both performance and capacity requirements through automated intelligent data placement. Along with intelligent block architecture Dell Compellent has several others features which help to cut down the TCO (Total Cost of Ownership) and improve the ROI (Return on Investment). Below are some of the key features: Built in virtualization Automated storage tiering True Thin Provisioning Data Placement Optimization (Fast Track) Dynamic Data Progression Data Instant Replay All the above features and much more make Dell Compellent storage a best fit for virtual environments and cloud infrastructure. Summary of goals To determine how many two-node Oracle RAC clusters can be consolidated or replaced with Oracle VMs running Oracle in a PowerEdge R820 server. To determine the consolidation factor. To highlight the power savings that can be realized through consolidation. Technology overview Dell PowerEdge R820 architecture The PowerEdge R8201 is a 12th generation rack server product. It is a datacenter optimized server, designed with improved performance in areas such as virtualization, power consumption, systems management, and usability. Dell PowerEdge Servers 1 http://www.dell.com/us/enterprise/p/poweredge-rack-servers 6 Consolidating Oracle Databases on the Dell PowerEdge R820 Server Using Oracle VM The PowerEdge R820 is a 2U rack mount server includes support for the Intel® Xeon® Processor E5-2600 family (Sandy Bridge-EP architecture). This family of 6/8 core processors includes an integrated memory controller (IMC) and integrated IO (IIO) on a single silicon die. This new server supports PCIe generation 7 slots for peripherals and two internal raid controller cards, and can host up to 1.5TB of memory. Networking support on the PowerEdge R820 includes a rack network daughter card (rNDC). Unlike traditional LOM, rNDC offers greater flexibility in terms of expanded features, network types, speed, and vendors. rNDC also offers an easy upgrade path from 1G to 10G speeds. This server also offers options such as support for the latest Dell systems management software including Life Cycle Controller 2.0 and iDRAC. Dell Compellent SC8000 The Dell Compellent SC8000 represents the latest Dell Compellent storage offering to support next generation SC8000 controllers. The SC8000 includes the following specifications: 2U rack chassis with dual six-core, 2.5GHz (with Turbo) Intel Xeon E5-2640 CPUs Six PCIe Gen3-enabled expansion slots to extend I/O capabilities for future growth 16GB to 64GB total available cache per controller, with a maximum 128GB per dual controller system Oracle VM Oracle VM is virtualization technology based on Xen hypervisor. Oracle VM helps to virtualize server hardware. Using Oracle VM, multiple virtual machines which act as independent servers can be created. This helps in better utilization of physical server resources. Oracle VM consists of three components: Oracle VM2 Server is based upon Xen hypervisor technology. It provides the environment for running virtual machines. Oracle VM Manager is a web-based user interface application to manage Oracle VM servers. It can manage whole of virtual machine life cycle which includes several operations such as create, delete, power off, live migration etc. also it can manage resources such as repositories, templates, ISOs, Virtual disks, network infrastructure etc. Oracle VM agent is embedded within the Oracle VM Server. It is communication channel between the Oracle VM Server and Oracle VM Manager for management of virtual machines. 2 Oracle VM http://www.oracle.com/us/technologies/virtualization/oraclevm/overview/index.html?origref=http:/ /www.oracle.com/index.html 7 Consolidating Oracle Databases on the Dell PowerEdge R820 Server Using Oracle VM Figure 1. Oracle VM architecture (Source: Oracle, Oracle VM documentation) In the context of this whitepaper we have considered Dell PowerEdge R820 for server consolidation. Dell Compellent3 SC8000 is used as backend storage subsystem. Using Oracle VM technology we have created multiple virtual machines in a Dell PowerEdge R820. Oracle databases are installed in each of these virtual machines. Online Transaction Processing (OLTP) database system is considered for this performance study and data is loaded in all the databases. OLTP database systems typically service hundreds or thousands of concurrent users. All the databases are simultaneously stressed using Dell Quest Benchmark Factory (BMF) and maximum userload supported is determined. Database transactions performed by these thousands of concurrent users get translated into tens of thousands of I/O requests to the backend storage subsystem. 3 Dell Compellent http://www.dell.com/Learn/us/en/04/campaigns/compellent-storagecenter?c=us&l=en&s=bsd&cs=04&delphi:gr=true 8 Consolidating Oracle Databases on the Dell PowerEdge R820 Server Using Oracle VM Once the data was populated, we started testing with 200 concurrent users and increased the user load to 5000 in increments of 200 users, randomly running transactions against the legacy database while making sure that the average query response time always stayed below 2 seconds. Throughout the lab performance testing we made sure that storage disks were not a bottleneck at any time. Whenever it was observed that there was disk latency we added disk enclosures to the storage system. Test configuration Figure 2. Test environment architectural diagram 9 Consolidating Oracle Databases on the Dell PowerEdge R820 Server Using Oracle VM Table 1 describes the complete software and hardware configuration that was used throughout testing on both the simulated legacy production environment and the 12G test environment. Table 1. Hardware and Software configuration details Component Systems Legacy Production Environment Two PowerEdge 2950 III,2U servers Processors Two Intel Xeon X5460, 3.16 GHz quad core per node Cache: L2=2x4M per CPU 32 GB DDR2 per node (64 GB total) Two 73 GB 2.5” SAS per node Two Broadcom® NetXtreme II BCM5708 Gigabit Ethernet Dell PowerVault M3620f with 300GB SAS disks One QLE2462 per node Enterprise Linux® 4.6 Not Applicable • Oracle 10g R2 10.2.0.4 • File System: ASM • Disk groups: DATABASE, DATA • sga_target = 4000M • pga_target = 2000M Memory Internal disks Network External storage HBA OS Hypervisor Oracle software Workload • Quest Benchmark Factory TPCC workload • Scale factor: 3000 • User connections: 200-5000 12G R820 Test Environment One PowerEdge R820 2U 4 socket server Four Intel Xeon 2.70 GHz eight core Cache: L2=2MB L3=20MB 428 GB DDR3 Two 73 GB 3.5” SAS Four Intel® 10 Gigabit X540-AT2 Dell Compellent SC8000 with 300GB SAS disks Two QLE2562 Enterprise Linux 6.2 Oracle VM 3.1.1 • Oracle 11g R2 11.2.0.3.0 • File System: ASM • Disk groups: DATABASE, DATA • sga_target = 8000M (per instance) • pga_target = 4000M (per instance) • Quest Benchmark Factory TPCC workload • Scale factor: 3000 • User connections: 200-5000 Performance metrics During the testing process we collected the following metrics for further study and analysis: TPS (transaction per second) AQRT (average query response time) CPU utilization Memory utilization Power consumption For an OLTP environment the most commonly used metrics are transaction per second (TPS) and average query response time (AQRT). Average query response time of an OLTP database environment may be described as the average time it takes for an OLTP transaction to complete and deliver the results of the transaction to the end user initiating that transaction. The average query response time is the most important factor when it comes to fulfilling end-user requirements, and it establishes the performance criteria for an OLTP database. A 2-second response time metric was chosen as the basis for our Service Level Agreement (SLA), and this metric which was maintained throughout the testing period. 10 Consolidating Oracle Databases on the Dell PowerEdge R820 Server Using Oracle VM Along with TPS and AQRT, CPU and memory utilization data were also collected during the testing. CPU utilization data is used to understand the saturation levels of the database server, and indicates how the server is scaling and delivering for an increasing load. This data is useful when monitoring a system for performance bottlenecks from a server point of view. Lastly, power consumption data indicates the level of savings one can achieve by consolidating PowerEdge 2950 servers to PowerEdge R820. Performance testing utility We used Dell Quest Software Benchmark Factory4, a load-generating utility that simulates an OLTP environment and transactions on a database for a given number of users. This tool can be used to create database tables, load data into the schema, and stress test the database server. This utility provides options to simulate standard workloads such as TPC-C, TPC-H, and TPC-E. Based on need, a user can select the type of workload he wishes to simulate. We chose TPCC which simulates an OLTP workload. The TPCC workload provided by the Benchmark Factory schema simulates an order entry system consisting of multiple warehouses. After choosing the workload type, benchmark utility loads data based on scale factor. Scale factor Quest Benchmark Factory2 provides an option to load data based on the need. For this the tool offers a unit called scale factor. When setting up a load test, Benchmark Factory allows changing the scale factor. This unit determines how many rows of data have to be inserted into the schema. Ultimately the number of rows contributes to the overall database size. An increase in scale factor allows for increases in the database size, allowing larger userloads to be used to place a greater stress on the system under test. Hence scale factor plays a major role in simulating workloads. For example, a scale factor of 3000 contributes to a database size of ~290GB. Throughout the testing process we have used 3000 scale factor. Test methodology Our consolidation study implemented a four-step process: 1. Find the maximum performance delivered by the legacy PowerEdge 2950 III. 2. Find the system behavior of the PowerEdge R820 by simulating a legacy saturated workload on virtual machine. 3. Find the scalable performance of the PowerEdge R820 by simulating legacy workloads on multiple VMs. 4. Conduct a comparative analysis of performance between the legacy PowerEdge 2950 III and that of the PowerEdge R820. 4 Benchmark Factory for Databases is a database performance testing tool. http://www.quest.com/benchmark-factory/ 11 Consolidating Oracle Databases on the Dell PowerEdge R820 Server Using Oracle VM The test methodology for the legacy production environment used was as follows: 1. To simulate the legacy production environment, we configured a two node Oracle 10g R2 RAC cluster comprising of a PowerEdge 2950 III with quad-core, dual socket 3.16 GHz CPU, connected to a Dell PowerVault 3620f configured with a 100 GB LUN for the database SYSTEM and a 400 GB LUN for DATA ASM disk groups and a 2 GB LUN for the voting and Oracle Cluster Registry (OCR) partitions. 2. Using the Dell Quest Benchmark Factory TPCC workload profile, we populated the data with a scale factor of 3000 into the simulated legacy server production environment. 3. To find out the saturation point of the legacy production environment, we started test iterations with a 200 item userload. The userload was then increased in 200 user increments while constantly monitoring the average query response time (AQRT) and CPU time. Once the average query response time crossed 2 seconds, the test was stopped. 4. To determine host performance limiting factor, the host CPU time analysis was carried out for all test iterations. For experimental purposes we have considered 90% or more CPU utilization as the saturation point or performance limiting factor point. If CPU utilization is below this limiting factor we tried to find if there was any saturation bottleneck from storage. If there is any storage bottleneck we added more drives to the storage. This test iteration is continued until system reaches saturation point. The test methodology for the R820 virtualized test environment used was as follows: 1. To simulate a test environment, we deployed Oracle VM server on a PowerEdge R820 and OVM manager on a R610 for management role. For more details on how to deploy OVM please visit Dell Oracle VM Getting Start Guide. 2. Once the OVM server is deployed, we created VMs. 3. To match the legacy production system each VM is configured with 16 vCPUs (which is equivalent to two PE 2950), 64GB of memory, and 2 Virtual NICs. Given that the test environment PowerEdge R820 has 64 vCPUs, a total 4 VMs were possible. 4. Oracle VM was created and the Oracle 11g R2 database was deployed. Click here for Step by Step installation of OVM and Oracle. 5. Using the Dell Quest Benchmark Factory, we populated the test data with a scale factor of 3000. (This is same as TPCC scale factor used for the legacy production environment). 6. The next step was to simulate a legacy workload and stress the VM. In order to simulate a legacy workload we started the test iteration with a 200 userload. The userload was then increased in 200 user increments while constantly monitoring the average query response time. Once the average query response time crossed 2 seconds, the test was stopped. 7. To determine host performance limiting factor, the host CPU time analysis was carried out for all test iterations. For experimental purposes we have considered 90% or more CPU utilization as the performance limiting factor point. If CPU utilization is below this limiting factor we tried to find if there was any saturation bottleneck from storage. 8. Similar to 1st VM we deployed 2nd, 3rd and 4th VMs and carried out similar tests that were performed on the first VM. 12 Consolidating Oracle Databases on the Dell PowerEdge R820 Server Using Oracle VM 9. As explained during the tests we collected multiple performance metrics. Following the completion of tests on all virtual machines we analyzed the results in terms of – AQRT, CPU utilization, TPS. Based on the analysis userload supported is determined. Results of the R820 VM infrastructure are compared against the results of legacy production environment. 10. Based on the comparison analysis between PowerEdge 2950 and R820 we derived the consolidation factor, power savings etc. Performance results and analysis Legacy Power Edge 2950 results Figure 3. AQRT of legacy production environment at saturation Legacy PE 2950 III - AQRT vs Userload 2.5 A 2 Q R 1.5 T 1 PE 2950 AQRT ( s 0.5 e 0 c SLA ) Userload Figure 4. CPU utilization of legacy production environment at saturation Legacy PE 2950 III CPU Utilization at 4800 userload 100 80 60 40 20 0 average user time average system time average idle time average iowait time 13 Consolidating Oracle Databases on the Dell PowerEdge R820 Server Using Oracle VM Figure 3 gives the snapshot of average query response time of the legacy production environment for different userloads. It can be observed that 4800 is the max userload supported within 2 sec SLA. Figure 4 is the CPU utilization of legacy production system at 4800 userload. As explained earlier, CPU utilization >= 90% is considered as saturation. from Figure 3 it is evident that average CPU utilization is ~93%, and iowait is ~0.13. Based on the server CPU utilization levels it can be considered that legacy production system is almost saturated. Hence figures 3 and 4 allow us to conclude that max userload supported by the legacy PowerEdge 2950 III was 4800. Figure 5. TPS of legacy production environment at saturation Legacy PE 2950 III - TPS vs Userload 250 200 T 150 P S 100 50 5000 4800 4600 4400 4200 4000 3800 3600 3400 3200 3000 2800 2600 2400 2200 2000 1800 1600 1400 1200 1000 800 600 400 200 0 Userload 14 Consolidating Oracle Databases on the Dell PowerEdge R820 Server Using Oracle VM PowerEdge R820 results Figure 6. AQRT of R820 test environment AQRT vs Userload of all VMs 5 4.5 4 3.5 3 2.5 2 1.5 1 0.5 0 VM1 VM2 VM3 VM4 400 800 1200 1600 2000 2400 2800 3200 3600 4000 4400 4800 5200 5600 Figure 7. CPU Utilization of R820 test environment Avg. CPU Utilization at 5200 load on all VMs 80 60 40 20 0 average user time average system time average idle time average iowait time Figure 6demonstrates that all VM are scaling up to 5200 userload simultaneously with SLA below 2 sec. Figure 7 shows that average CPU utilization across all VMs is ~70% while they are supporting 5200 users. Also it can be noted that there is roughly ~24% IO wait time, means that VM CPU resources are waiting for the storage system to provide the data and there is storage bottleneck. We may conclude from Figures 6 and 7 that all four VMs support 5200 userload with 70% CPU utilization. 15 Consolidating Oracle Databases on the Dell PowerEdge R820 Server Using Oracle VM Figure 8. TPS of R820 test environment TPS vs Userload of all VMs 300 250 200 VM1 150 VM2 VM3 100 VM4 50 0 400 800 1200 1600 2000 2400 2800 3200 3600 4000 4400 4800 5200 5600 Figure 8 gives a snapshot of the TPS across all four VMs for various userloads. It can be clearly seen that TPS delivered by all the VMs has been increasing continuously, this means that there is improved performance across all VMs. Once 5200 userload is reached TPS started to dip. As explained earlier this is because of storage backend limitation. Figure 9. Userload supported on R820 at 70% utilization Userload supported across all VMs 6000 5000 VM1 4000 VM2 3000 VM3 2000 VM4 1000 0 VM1 VM2 VM3 VM4 16 Consolidating Oracle Databases on the Dell PowerEdge R820 Server Using Oracle VM Figure 10. Consolidated userload on R820 at 70% utilization Consolidated Userload at 70% utilization VM1 + VM2 + VM3 + VM4 VM1 VM1 + VM2 + VM3 VM1 + VM2 VM1 + VM2 + VM3 VM1 + VM2 VM1 + VM2 + VM3 + VM4 VM1 0 5000 10000150002000025000 Figure 9 show that all the VMs are supporting 5200 userloads. As the user stress tests on VMs are done in parallel, total consolidated userload supported by R820 at ~70% utilization is 20800. Figure 10 gives the snapshot of the scalable userload supported by multiple VMs deployed om PowerEdge R820. Comparison Figure 11. TPS Comparison of legacy vs R820 TPS Comparison 973.4 1000 800 TPS 600 400 235.59 200 0 2 x 2950 R820 Max TPS delivered by R820 at 70% utilization = 973.4 Max TPS delivered by legacy Production system (2 x 2950) = 235.59 Percentage gain = ~313% 17 Consolidating Oracle Databases on the Dell PowerEdge R820 Server Using Oracle VM Performance of 70% of R820 vs 2 x 2950 = ~4X Figure 12. Supported Userload comparison of legacy vs R820 R820 vs legacy saturated Userload 25000 20000 Userload 15000 10000 5000 0 2 x 2950 R820 Max userload supported by R820 at 70% utilization = 20800 Max userload supported by legacy Production system (2 x 2950) = 4800 Percentage gain = ~316% Performance of 70% of R820 vs 2 x 2950 = ~4X Based on the above figures, it is evident that both in terms of maximum TPS and userload supported R820 is delivering 4X performance when compared to legacy Production Oracle RAC. Figure 13. CPU utilization comparison of legacy vs R820 CPU Utilization @ legacy saturated Userload 100 80 60 R820 40 2 x 2950 20 0 average user time average system time average idle time average iowait time 18 Consolidating Oracle Databases on the Dell PowerEdge R820 Server Using Oracle VM Consolidation factor 8:1 Consolidation at 70% Utilization. Based on the preceding consolidation study, a PowerEdge R820 populated with 4 sockets can consolidate the workload of 8 Oracle RAC nodes running on 9th generation PowerEdge 2950 III servers. 10:1 to 12:1 Consolidation at full Utilization. Based on the preceding consolidation, a PowerEdge R820 populated with 4 sockets can consolidate the workload of 10 to 12 Oracle RAC nodes running on 9th generation PowerEdge 2950 III servers given that there are no other bottlenecks from memory, network, storage etc. Figure 14. Power Consumption vs Userload Power Consumption vs Userload 700 600 500 ( P o w e r Legacy 2950 III PE R820 200 400 600 800 1000 1400 1600 1800 2000 2400 2600 2800 3000 3400 3600 3800 4000 4200 4600 4800 ) W 400 a 300 C t o t 200 n s s 100 u m 0 e d Userload The Dell PowerEdge 12th generation servers are the most efficient ever in the PowerEdge lineup. Because of their special design, you will enjoy huge power savings by consolidating from legacy servers to the PowerEdge R820. As Figure 14 illustrates, there is a dramatic difference in the power consumption between a PowerEdge R820 and a 2 node legacy 2950 production environment at various userload levels. Let’s look at the average power savings that can be achieved: Average power consumption by PowerEdge R820 - 265 watts Average power consumption by the legacy 2950 environment - 540 watts Power savings % = (540-265)*100 / 540 = ~50% Hence on average 50% power savings can be achieved. 19 Consolidating Oracle Databases on the Dell PowerEdge R820 Server Using Oracle VM Summary Any server consolidation project must be preceded by a well-planned effort to predict the energy consumption and performance capacity of the new platform as compared to the legacy environment. In this study, we showed that the new PowerEdge R820 is an ideal platform for consolidation from legacy PowerEdge 2950 environments. This is apt as the server supports the latest Intel Sandy Bridge processor architecture, and comes with the latest features such as PCIe gen 3 supports, enhanced memory support, and flexible network card support. We also showed the performance gains and power savings that can be achieved with consolidation. Customers running Oracle 9i or 10g RAC environments on legacy servers and storage can follow the guidelines and procedures outlined in this whitepaper to consolidate power-hungry RAC nodes into fewer, faster, and more energy-efficient nodes. The resulting legacy RAC node consolidation can also drive down Oracle licensing costs, resulting in savings that you can use to fund additional backend storage resources to improve average query response time, implement disaster recovery sites and additional RAC testbed sites for application development and testing. The reduced number of nodes does not compromise performance when paired with PowerEdge R820 servers. Instead, the result is less cluster overhead, simplified management, and positive movement toward an objective of simplifying IT and reducing complexity in data centers. Specific TCO possibilities include: 10:1 to 12:1 consolidation possibility 50% Power Consumption Savings License fee savings from server consolidations References 1. Dell PowerEdge R820 http://www.dell.com/us/enterprise/p/poweredge-r820/pd 2. Dell Compellent http://www.dell.com/Learn/us/en/555/campaigns/compellent-storagecenter?c=us&l=en&s=biz&cs=555&delphi:gr=true 3. Dell Oracle tested and validated configurations http://en.community.dell.com/techcenter/enterprise-solutions/w/oracle_solutions/1429.currentrelease.aspx Appendix A. Database management software Quest Database Management Software Quest’s award-winning database management software strengthens Dell’s end-to-end solution capabilities. Our database management solutions for Oracle 20 Consolidating Oracle Databases on the Dell PowerEdge R820 Server Using Oracle VM databases are designed to meet the challenges faced by IT professionals of all skill levels - working with multiple database servers, complex data environments, and reporting needs. Dell’s software tools bring greater operational efficiencies by combining automation of administrative and management tasks, performance optimization, boosting productivity for database and data professionals. Our solutions of different database management tools allow you to achieve the highest levels of database quality, performance, maintainability, and availability. Toad® for Oracle is unrivaled for ensuring the greatest possible productivity in development and administration of Oracle databases. Only Toad combines the deepest functionality available with extensive automation and intuitive workflows. With Toad, database professionals of all skill and experience levels can collaborate and work efficiently and accurately. Foglight® for Oracle is a scalable, web-based, 24x7 database monitoring tool. It provides constant remote database monitoring and correlates performance data from across your technology stack. And it makes your job easier by extending the capabilities of native tools. It guides you through response-time and wait-event analyses, so you instantly understand existing and developing database performance conditions. Plus, our IntelliProfile™ technology ensures your post-change database environment is thriving to help eliminate deployment risks. Foglight for Oracle empowers you to take action immediately and maximize your Oracle database resources. SharePlex® for Oracle is a simple, affordable, impact-free Oracle database replication solution. SharePlex is a mature, high-performance, high availability technology that offers a low-cost alternative to other Oracle replication tools. Unlike other solutions, SharePlex provides data compare and repair, in-flight data integrity, plus monitoring and alerting functionalities – all in one package. It ensures business continuity while meeting your database operational goals, providing a real-time copy of production data – without impacting your OLTP system’s performance and availability. NetVault LiteSpeed® for Oracle reduces Oracle backup and recovery times by 50 percent or more and decreases backup size by up to 90 percent. Tailored to the unique needs of an Oracle DBA, NetVault LiteSpeed for Oracle significantly lowers storage costs and delivers a solid return on investment – within minutes of installation. Plus, it secures your critical data with Oracle backup data-compression technology and up to four levels of encryption. It integrates with RMAN via Oracle’s Media Manager architecture and seamlessly integrates with Tivoli Storage Manager (TSM) and Symantec NetBackup. 21