1
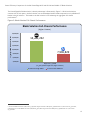
Power Efficiency Comparison of the Dell™ PowerEdge™ M915 and HP ProLiant BL680c G7 Blade Solutions A Dell Technical White Paper Brian Bassett and Chris Christian Solutions Performance Analysis Dell | Enterprise Solutions Group Power Efficiency Comparison of the Dell PowerEdge M915 and HP ProLiant BL680c G7 Blade Solutions THIS WHITE PAPER IS FOR INFORMATIONAL PURPOSES ONLY, AND MAY CONTAIN TYPOGRAPHICAL ERRORS AND TECHNICAL INACCURACIES. THE CONTENT IS PROVIDED AS IS, WITHOUT EXPRESS OR IMPLIED WARRANTIES OF ANY KIND. © 2011 Dell Inc. All rights reserved. Reproduction of this material in any manner whatsoever without the express written permission of Dell Inc. is strictly forbidden. For more information, contact Dell. Dell, the DELL logo, and the DELL badge, and PowerEdge are trademarks of Dell Inc. Microsoft, Windows, and Windows Server are either trademarks or registered trademarks of Microsoft Corporation in the United States and/or other countries. Intel and Xeon are registered trademarks of Intel Corporation in the U.S. and/or other countries. SPEC and the benchmark names SPECpower_ssj and SPECjbb are trademarks of the Standard Performance Evaluation Corporation. Other trademarks and trade names may be used in this document to refer to either the entities claiming the marks and names or their products. Dell Inc. disclaims any proprietary interest in trademarks and trade names other than its own. August 2011 Revision 1.0 2 Power Efficiency Comparison of the Dell PowerEdge M915 and HP ProLiant BL680c G7 Blade Solutions 3 Power Efficiency Comparison of the Dell PowerEdge M915 and HP ProLiant BL680c G7 Blade Solutions Contents Executive Summary ................................................................................................................ 6 Introduction ....................................................................................................................... 6 Key Findings ....................................................................................................................... 6 Performance/Watt ............................................................................................................. 6 Performance .................................................................................................................... 6 Power ............................................................................................................................ 6 Methodology ......................................................................................................................... 8 Configurations ....................................................................................................................... 8 Results .............................................................................................................................. 10 Price as Tested .................................................................................................................... 15 Price to Power Efficiency Ratio ............................................................................................... 16 Performance per Dollar ......................................................................................................... 17 Industry Leading 4-Socket Server Power Efficiency ...................................................................... 18 Future Platform Updates ....................................................................................................... 18 Summary............................................................................................................................ 18 Appendix A—Test Methodology ................................................................................................ 19 SPECpower_ssj2008 Standard .................................................................................................. 19 BIOS Settings ..................................................................................................................... 19 OS Tuning ......................................................................................................................... 20 SPECpower_ssj2008 Configuration ............................................................................................ 20 Appendix B—Blade Server Hardware Configuration ...................................................................... 22 Appendix C—Server Firmware and Drivers ................................................................................. 23 Appendix D—Results ............................................................................................................. 24 4 Power Efficiency Comparison of the Dell PowerEdge M915 and HP ProLiant BL680c G7 Blade Solutions Table Table Table Table Table 1: 2: 3: 4: 5: Figure 1: Figure 2: Figure 3: Figure 4: Figure 5: Figure 6: Figure 7: Figure 8: Figure 9: Detailed Blade Solution Configurations ................................................................ 9 Dell Blade Solution Cost Breakdown .................................................................. 16 HP Blade Solution Cost Breakdown ................................................................... 16 Blade Server Hardware Configuration ................................................................ 22 Server Firmware and Drivers .......................................................................... 23 Blade Solution Comparison (Normalized Values) .................................................. Blade Solution Power Efficiency ..................................................................... Blade Solution Full-Chassis Performance ........................................................... Blade Solution Power Consumption at 100% Target Load ........................................ Blade Solution Power Consumption at Idle ......................................................... Price as Tested ......................................................................................... Blade Solution Performance per Dollar ............................................................. Dell Blade Solution Benchmark Results ............................................................. HP Blade Solution Benchmark Results ............................................................... 10 11 12 13 14 15 17 24 25 5 Power Efficiency Comparison of the Dell PowerEdge M915 and HP ProLiant BL680c G7 Blade Solutions Executive Summary Introduction Dell commissioned its Solutions Performance Analysis team to compare the power efficiency of full-chassis blade solutions using 4-socket blades from Dell and Hewlett-Packard (HP). In July 2011, the Dell PowerEdge M915 blade server achieved the highest SPECpower_ssj2008 score of any 4socket server on the market1, so eight of these blades and a PowerEdge M1000e enclosure were used as the PowerEdge solution. For the ProLiant solution, HP’s similar BL685c G7 could have been chosen for this study. However, the BL680c G7 is HP’s top-selling 4-socket blade2, so it was chosen to allow examination of HP’s claims of that server’s unique 4P blade performance and improved power efficiency 3. Due to its full-height, double-wide form factor, only four of these blades can fit in a 10U BladeSystem c7000 blade enclosure. Using the industry-standard SPECpower_ssj2008 benchmark, the performance, power draw, and performance/watt of full-chassis configurations of both blade solutions were tested. The blade servers were compared configured as similarly as possible given their architectural differences, with identical memory and hard drive selections, and best known CPU choices for highest performance/watt ratio. To ensure the lowest power draw, both blade chassis were equipped with six of their Platinum-rated power supplies for all tests. The results showed the Dell solution using 8 PowerEdge M915 costs less than the HP solution consisting of just 4 BL680c G7 blades (the maximum that can fit in the BladeSystem c7000 enclosure). The Dell solution also consumed less power at idle, provided higher raw performance, and achieved a better performance / watt ratio. The Dell solution also fits twice as many servers in a 10U blade enclosure. Key Findings Performance/Watt The Dell solution with 8 PowerEdge M915 blades achieved a 92% higher performance / watt ratio across all load levels than the HP solution using 4 ProLiant BL680c G7 blades. Performance The chassis full of 8 PowerEdge M915 blades achieved 87% higher raw performance at 100% utilization than the chassis full of 4 HP ProLiant BL680c G7 blades. Power Despite having 87% greater performance, the Dell solution with 8 PowerEdge M915 blades consumes only 14% more power at 100% utilization compared to the HP solution with just 4 ProLiant BL680c G7 blades. Despite having twice as many servers, the Dell blade solution consumes 35% less power at idle than the HP blade solution. 1 In the published result, the 8-node M915 achieved 14,793,524 ssj_ops@100% target load and a SPECpower_ssj2008 result of 2,716 overall ssj_ops/Watt. Benchmark results based on results published at www.spec.org as of July 2011. For the latest SPECpower_ssj2008 benchmark results, visit http://www.spec.org/power_ssj2008/results/power_ssj2008.html. 2 According to IDC Q1 2011 Server Tracker, May 22, 2011 3 http://h10010.www1.hp.com/wwpc/us/en/sm/WF05a/3709945-3709945-3328410-241641-3722793-4268690.html 6 Power Efficiency Comparison of the Dell PowerEdge M915 and HP ProLiant BL680c G7 Blade Solutions Price Priced as configured, the Dell PowerEdge solution, including 8 M915 blades and the M1000e Blade Chassis, costs 21% less overall than the HP ProLiant solution which includes 4 BL680c G7 blades and the BladeSystem C7000 enclosure. The Dell solution’s lower cost and greater power efficiency lead to a 59% better price / performance / watt ratio. Rack Density The Dell solution provides 8 servers per 10U chassis, compared to the HP solution which provides only 4 servers per 10U chassis. Test methodology and detailed results are documented in this paper. The comparison presented here is based on the respective enterprise-class servers configured as similarly as possible and currently shipping by Dell and HP. Results based on SPECpower_ssj2008 performance testing by Dell Labs in June 2011. For the latest SPECpower_ssj2008 benchmark results, visit http://www.spec.org/power_ssj2008/results/power_ssj2008.html. For latest SPECjbb2005 benchmark results, visit http://www.spec.org/osg/jbb2005. 7 Power Efficiency Comparison of the Dell PowerEdge M915 and HP ProLiant BL680c G7 Blade Solutions Methodology SPECpower_ssj2008 is an industry standard benchmark created by the Standard Performance Evaluation Corporation (SPEC) to measure a server’s power and performance across multiple utilization levels. Appendix A details the test methodology used by Dell, Appendices B and C provide detailed configurations for the tests, and Appendix D provides detailed report data that supports the results in this paper. Full disclosure reports from the valid SPECpower_ssj2008 runs used in this comparison are attached to this whitepaper for reference. Configurations The blade servers in both solutions were configured for their best known SPECpower_ssj2008 configurations, and were matched as closely as possible given the differences between the architectures. Both solutions used the maximum number of DIMMs and CPUs the blades could accommodate. The configuration used is summarized in Table 1. 8 Power Efficiency Comparison of the Dell PowerEdge M915 and HP ProLiant BL680c G7 Blade Solutions Table 1: Detailed Blade Solution Configurations Blade Component Dell PowerEdge M915 HP Proliant BL680c G7 4S/Full Height, Single-Width 4S/Full-Height, Double-Width 8 4 4 x AMD Opteron 6176 @ 2.3 GHz, 12 Cores each 4 x Intel Xeon X7560 @ 2.26 GHz, 8 Cores / 16 Threads each Processors Per Solution 32 16 Physical Processor Cores Per Solution 384 128 Logical Processor Cores Per Solution 384 256 Memory Slots Per Blade 32 64 32 x 4GB Dual Ranked PC3L-10600R LV RDIMMs running at 1066MHz 64 x 2GB Dual Ranked PC3-10600R RDIMMs running at 1066MHz 256 256 2 x 146GB 15k 6Gb (RAID 1) 2 x 146GB 15k 6Gb (RAID 1+04) 16 8 Dell PERC H200 (No Cache) HP Smart Array P410i (No Cache) Dell PowerEdge M1000e Modular Blade Enclosure HP BladeSystem c7000 Enclosure 1 x Dell CMC Module 1 x HP Onboard Administrator Module 1 x Dell Ethernet Pass-Through Module 1 x 1Gb Ethernet Pass-Thru Module for c-Class BladeSystem 6 x 2700W Platinum Rated 6 x 2450W Platinum Rated Sockets/Form Factor Blades Per Solution Processors Per Blade DIMMs Per Blade DIMMs Per Solution Hard Drives Per Blade Hard Drives Per Solution Storage Controller Chassis Components Management I/O Power Supply Quantity/Rating In order to compare the two solutions as closely as possible, each blade server had the same amount of system memory, and each blade was fully populated with memory: the M915 blades each had 32 4GB RDIMMs for a total of 128GB system memory, and the BL680c G7 blades each had 64 2GB RDIMMs, also for a total of 128GB system memory. This configuration also meant that the total number of DIMMs across all blades was 256 per solution. Dell only sells low power LV-DIMMs in the PowerEdge M915 blades, so 4GB LV-DIMMs were used for the comparison. The HP ProLiant BL680c G7 blades only offer LV-DIMMs on their Intel® Xeon® E7-4800 series 4 On the HP Smart Array P410i, RAID 1+0 is the only option available in a 2 hard drive configuration 9 Power Efficiency Comparison of the Dell PowerEdge M915 and HP ProLiant BL680c G7 Blade Solutions models, which were not available at the time the solutions were purchased, so standard voltage 2GB RDIMMs from HP were used for the HP blade solution. Results The Dell blade solution with PowerEdge M915 blades delivered 87% higher raw performance than the HP solution with ProLiant BL680c G7 blades. The Dell solution also has 92% higher power efficiency, and even with 8 blades (compared to 4 blades for the HP solution) consumes 35% less power at idle. Figure 1: Blade Solution Comparison (Normalized Values) Normalized Blade Solution Comparison Power Efficiency, Performance and Power Draw 1.54 1.00 1.00 0.53 0.52 Power Efficiency (higher is better) 1.00 Raw Performance (higher is better) 8 x Dell PowerEdge M915 Power Draw @ Idle (lower is better) 4 x HP ProLiant BL680c G7 10 Power Efficiency Comparison of the Dell PowerEdge M915 and HP ProLiant BL680c G7 Blade Solutions The Dell solution’s greater power efficiency is illustrated in Figure 2. The SPECpower_ssj2008 overall ssj_ops/watt for the 8-node Dell solution is 2,425, 92% higher than the 4-node HP solution’s 1,260 ssj_ops/watt. Figure 2: Blade Solution Power Efficiency Blade Solution Power Efficiency Performance / watt (higher is better) 3,000 2,500 2,425 2,000 1,260 1,500 1,000 500 0 SPECpower_ssj2008 (overall ssj_ops/watt, higher is better) 8 x Dell PowerEdge M915 4 x HP ProLiant BL680c G7 11 Power Efficiency Comparison of the Dell PowerEdge M915 and HP ProLiant BL680c G7 Blade Solutions The PowerEdge M915 blade solution’s density advantage is illustrated in Figure 3. While both solutions consume 10U of rack space, the Dell solution can accommodate 8 M915 blades compared to only 4 BL680c G7 blades in the HP solution. This leads to the Dell solution’s 87% advantage in aggregate full-chassis performance5. Figure 3: Blade Solution Full-Chassis Performance Blade Solution Full-Chassis Performance (Higher is better) ssj_ops @ 100% submeasurement 18,000,000 16,000,000 14,982,232 14,000,000 12,000,000 10,000,000 7,996,829 8,000,000 6,000,000 4,000,000 SPECpower_ssj2008 (ssj_ops @ 100% target load, higher is better) 8 x Dell PowerEdge M915 4 x HP ProLiant BL680c G7 5 The 8-node M915 achieved 14,982,232 ssj_ops@100% target load and a SPECpower_ssj2008 result of 2,425 overall ssj_ops/Watt, compared to the 4-node BL680c G7 with 7,996,829 ssj_ops@100% target load and a SPECpower_ssj2008 result of 1,260 overall ssj_ops/Watt. 12 Power Efficiency Comparison of the Dell PowerEdge M915 and HP ProLiant BL680c G7 Blade Solutions SPECpower_ssj2008 includes a measurement of power while the servers are at 100% target utilization. The Dell blade solution has twice as many servers as the HP solution, but as Figure 4 shows, the Dell solution consumes just 14% more power6 at full utilization. Figure 4: Blade Solution Power Consumption at 100% Target Load Blade Solution Power Consumption at 100% Target Load 6,000 5,000 4,573 4,020 Watts 4,000 3,000 2,000 Despite providing twice as many servers and three times as many physical processor cores, the Dell blade solution consumes just 14% more power at 100% utilization than the HP blade solution. 1,000 0 SPECpower_ssj2008 (power draw @ 100% target load, lower is better) 8 x Dell PowerEdge M915 4 x HP ProLiant BL680c G7 6 The 8-node M915 consumed just 4,573 W at 100% target utilization, compared to 4,020 W for the 4-node BL680c G7. The 8-node M915 achieved 14,982,232 ssj_ops@100% target load and a SPECpower_ssj2008 result of 2,425 overall ssj_ops/Watt, compared to the 4-node BL680c G7 with 7,996,829 ssj_ops@100% target load and a SPECpower_ssj2008 result of 1,260 overall ssj_ops/Watt. 13 Power Efficiency Comparison of the Dell PowerEdge M915 and HP ProLiant BL680c G7 Blade Solutions SPECpower_ssj2008 also includes a measurement of power while the servers are at 0% target utilization (Active 7 Idle). Despite having twice as many blade servers, the Dell solution consumes 799 W less power at idle than the HP blade solution, as seen in Figure 5. Figure 5: Blade Solution Power Consumption at Idle Blade Solution Power Consumption at Idle (Lower is better) 3,000 2,500 2,291 Watts 2,000 1,500 1,492 1,000 500 0 SPECpower_ssj2008 (power draw @ Active Idle, lower is better) 8 x Dell PowerEdge M915 4 x HP ProLiant BL680c G7 7 The 8-node M915 consumed only 1,492W at the Active Idle Point, compared to 2,291W for the 4-node BL680c G7. The 8-node M915 achieved 14,982,232 ssj_ops@100% target load and a SPECpower_ssj2008 result of 2,425 overall ssj_ops/Watt, compared to the 4-node BL680c G7 with 7,996,829 ssj_ops@100% target load and a SPECpower_ssj2008 result of 1,260 overall ssj_ops/Watt. 14 Power Efficiency Comparison of the Dell PowerEdge M915 and HP ProLiant BL680c G7 Blade Solutions Price as Tested Data in the previous section shows that the PowerEdge blade solution with M915 blades is more power efficient and higher performing that the ProLiant blade solution with BL680c G7 blades. Despite having twice as many blade servers, the Dell solution costs 21% less as tested (Figure 6). Figure 6: Price as Tested8 Blade Solution Price as Tested U.S. Dollars (lower is better) $160,000.00 $150,000.00 $137,980.00 $140,000.00 $130,000.00 $120,000.00 $110,000.00 $106,704.00 $100,000.00 $90,000.00 $80,000.00 Dell Blade Solution HP Blade Solution 8 M915 and M1000e prices in U.S. dollars from Dell.com, June 14, 2011. BL680c G7 and C7000 prices in U.S. dollars from HP authorized reseller, June 14, 2011. 15 Power Efficiency Comparison of the Dell PowerEdge M915 and HP ProLiant BL680c G7 Blade Solutions Price to Power Efficiency Ratio Table 2 and Table 3Table 3 detail the price for both solutions including the blades, blade enclosures, chassis controller modules, I/O modules, and power supplies necessary for the testing. Table 2: Dell Blade Solution Cost Breakdown9 Dell Blade Solution Qty Each Total PowerEdge M915 blades 8 $13,338.00 $106,704.00 M1000e Modular Blade Enclosure 1 $9,701.00 $9,701.00 Dell Total Cost $116,405.00 Percent less cost for the Dell Solution 21% 2,425 SPECpower_ssj2008 Overall ssj_ops / watt Dell Solution $ / ssj_ops / watt $48.00 Dell Percent less $ / ssj_ops / watt 59% Table 3: HP Blade Solution Cost Breakdown10 HP Blade Solution Qty Each Total ProLiant BL680c G7 blades 4 $34,495.00 $137,980.00 BladeSystem c7000 Enclosure 1 $10,123.00 $10,123.00 HP Total Cost $148,103.00 SPECpower_ssj2008 Overall ssj_ops / watt HP Solution $ / ssj_ops / watt 1,260 $117.54 The lower cost and higher power efficiency of the Dell solution lead to a cost of just $48.00 for each point of overall SPECpower_ssj2008 score, 59% less than the $117.54 per point of overall SPECpower_ssj2008 score with the HP solution.11 9 M915 and M1000e prices in U.S. dollars from Dell.com, June 14, 2011 BL680c G7 and C7000 prices in U.S. dollars from HP authorized reseller, June 14, 2011 11 The 8-node M915 achieved 14,982,232 ssj_ops@100% target load and a SPECpower_ssj2008 result of 2,425 overall ssj_ops/Watt, compared to the 4-node BL680c G7 with 7,996,829 ssj_ops@100% target load and a SPECpower_ssj2008 result of 1,260 overall ssj_ops/Watt. 10 16 Power Efficiency Comparison of the Dell PowerEdge M915 and HP ProLiant BL680c G7 Blade Solutions Performance per Dollar The lower price and higher overall performance of the Dell solution allow it to provide 129 ssj_ops at 100% target load for each U.S. dollar spent on the solution, compared to just 54 ssj_ops at 100% target load 12 for each dollar spent on the HP solution, as seen in Figure 7. Figure 7: Blade Solution Performance per Dollar Blade Solution Performance per Dollar ssj_ops @ 100% submeasurement / U.S. dollar (higher is better) 160 140 129 120 100 80 60 54 40 20 0 Dell Blade Solution HP Blade Solution 12 The 8-node M915 achieved 14,982,232 ssj_ops@100% target load and a SPECpower_ssj2008 result of 2,425 overall ssj_ops/Watt, compared to the 4-node BL680c G7 with 7,996,829 ssj_ops@100% target load and a SPECpower_ssj2008 result of 1,260 overall ssj_ops/Watt. 17 Power Efficiency Comparison of the Dell PowerEdge M915 and HP ProLiant BL680c G7 Blade Solutions Industry Leading 4-Socket Server Power Efficiency The 8-node Dell M915 blade solution in this comparison achieved an overall SPEC score of 2,425 even when configured as it would in a typical datacenter, with redundant hard drives and all DIMM slots filled. With minor changes to the configuration, using hardware which can be ordered standard from www.dell.com, the 8-blade M915 solution achieved an overall SPECpower score of 2,716, which is the highest score of any 4-socket rack or blade server published at www.spec.org as of July, 201113. Future Platform Updates The PowerEdge M915 blades in the Dell solution were equipped with AMD Opteron™ model 6176 processors, the most power efficient processors available for the M915 blades at the time equipment for this study was purchased. Likewise, the ProLiant BL680c G7 blades in the HP solution were equipped with Intel Xeon X7560 processors, the most power efficient processors available for that platform at the time equipment for the testing was purchased. When AMD Opteron 6200-series processors are available for the Dell solution, and Intel Xeon E7-series processors are available for the HP solution, Dell plans to update this study to show what changes, if any, these next generation processors bring to the relative performance of the two blade solutions. Summary The focus of this study was to examine the overall performance and power efficiency of full-chassis solutions utilizing the latest blades released by Dell (M915) and HP (BL680c G7). The Dell solution with eight PowerEdge M915 blades was shown to provide 92% greater overall performance, with 87% greater power efficiency, for 21% less cost than the HP solution, which could only accommodate four BL680c G7 blades. An HP solution comprised of eight BL685c G7 blades could also have been used for the comparison. Given the PowerEdge M915 blade’s 6% performance advantage over the BL685c G7 in the SPECjbb2005 benchmark 14, the Dell PowerEdge M915 blade solution would be expected to have an overall performance advantage in such a comparison. 13 Based on results for the 8-node M915 as published at www.spec.org as of 15 July 2011. For more information about SPECpower, see www.spec.org/power_ssj2008/. 14 Source: Dell PowerEdge M915 (4 chips, 48 cores, 48 threads) 1,949,160 SPECjbb2005 bops, 8 JVMs, 243,645 SPECjbb2005 bops/JVM; HP ProLiant BL685c G7 (4 chips, 48 cores, 48 threads) 1,832,929 SPECjbb2005 bops, 8 JVMs, 229,116 SPECjbb2005 bops/JVM. Based on best SPECjbb2005 results published on http://www.spec.org as of July 7, 2011. For latest SPECjbb2005 benchmark results, visit www.spec.org/osg/jbb2005. 18 Power Efficiency Comparison of the Dell PowerEdge M915 and HP ProLiant BL680c G7 Blade Solutions Appendix A—Test Methodology SPECpower_ssj2008 Standard SPECpower_ssj2008 is an industry standard benchmark created by the Standard Performance Evaluation Corporation (SPEC) to measure a server’s power and performance across multiple utilization levels. SPECpower_ssj2008 consists of a Server Side Java (SSJ) workload along with data collection and control services. SPECpower_ssj2008 results portray the server’s performance in ssj_ops (server side Java operations per second) divided by the power used in watts (ssj_ops/watt). SPEC created SPEcpower_ssj2008 for those who want to accurately measure the power consumption of their server in relation to the performance that the server is capable of achieving with ssj2008 workload. SPECpower_ssj2008 consists of three main software components: Server Side Java (SSJ) Workload—Java database that stresses the processors, caches and memory of the system, as well as software elements such as OS elements and the Java implementation chosen to run the benchmark. Power and Temperature Daemon (PTDaemon)—Program that controls and reports the power analyzer and temperature sensor data. Control and Collect System (CCS)—Java program that coordinates the collection of all the data. For more information on how SPECpower_ssj008 works, see http://www.spec.org/power_ssj2008/. All results discussed in this whitepaper are from “compliant runs” in SPEC terminology, which means that although they have not been submitted to SPEC for review, Dell is allowed to disclose them for the purpose of this study. All configuration details required to reproduce these results are listed in Appendices A, B, and C and all result files from the runs compared are included in Appendix D. Both servers were configured by installing a fresh copy of Microsoft® Windows Server® 2008 Enterprise R2 (Service Pack 1) with the operating system installed on a two-hard drive RAID 1, choosing the “full installation” option for each. The latest driver and firmware update packages available to both servers were installed at the beginning of this study. Refer to Appendix B for details. The Dell System Performance Analysis Team ran SPECpower_ssj2008 ten times per configuration across both servers and chose the run with the highest overall ssj_ops/watt for each configuration to compare. BIOS Settings BIOS settings differed between the two manufacturers, so we tuned for best-known SPECpower_ssj2008 performance results. To improve power efficiency, we changed the memory speed of the M915 blades to 1066MHz from the default of 1333MHz, and changed their HyperTransport frequency to HT1. Virtualization was not used in these tests, so AMD Virtualization support was disabled on both servers. For the Dell PowerEdge M915 blades, the following settings were used: DRAM Prefetcher Disabled. Hardware Prefetch Training on Software Prefetch Disabled. Hardware Prefetcher Disabled. HT mode set to HT1. Memory Speed set to 1066MHz in BIOS. AMD Virtualization was disabled. 19 Power Efficiency Comparison of the Dell PowerEdge M915 and HP ProLiant BL680c G7 Blade Solutions For the HP ProLiant BL680c G7 blades, the following settings were used: Disabled Intel Turbo Boost Technology. Dynamic Power Savings Mode Response set to Slow. Enabled DIMM Idle Power Saving Mode. Disabled HP NC553i 10Gb 2-Port FlexFabric Adapter 2 in BIOS. Disabled HP NC553i 10Gb 2-Port FlexFabric Adapter 3 in BIOS. Disabled Intel SATA Controller #1 in BIOS. Disabled Hardware Prefetcher in BIOS. Disabled Adjacent Sector Prefetch in BIOS. The HP ProLiant BL680c G7 blades provide an option called Collaborative Power Control in its ROMBased Setup Utility (RBSU) which is Enabled by default. Disabling this option on all blades did not improve overall SPECpower_ssj2008 results, and resulted in Invalid runs, so this setting was left at the default Enabled setting for the runs which produced the data used in the comparison. OS Tuning To improve Java performance, large pages were enabled by entering Control Panel->Administrative Tools>Local Security Policy->Local Policies->User Rights Assignment->Lock Pages in Memory. An option was changed to add Administrator. Operating System Power Management mode for both solutions was left at Balanced (the default) and Balanced mode was edited to turn off the Hard Drive after 1 minute. On the HP ProLiant BL680c G7 blades, the Minimum Processor State was changed to 0%. Some platforms produce better overall SPECpower_ssj2008 scores using the Windows 2008 Power option “Power saver” with Maximum Processor set to 100%, but on both blade solutions, this did not significantly change the overall score, so this setting was left at the default Balanced setting for the runs which produced the data used in the comparison. We configured all servers with a separate IP address on the same subnet as our SPECpower_ssj2008 controller system where the Director, CCS, and PTDaemon components were located, and connected all servers and the controller system to an external PowerConnect Gigabit Ethernet switch through NIC 1 for their respective runs. SPECpower_ssj2008 Configuration IBM® J9 Java Virtual Machine (JVM)15 was used for both solutions, as this JVM provided the best performance for SPECpower_ssj2008 of any of the available choices at the time that this study was undertaken. The following JVM options were used on both servers, as they are the best-known JVM tunings for SPECpower_ssj2008 for the IBM J9 JVM when running with larger memory configurations: -Xms1875m -Xmx1875m -Xmn1400m -Xaggressive -Xcompressedrefs -Xgcpolicy:gencon XlockReservation -Xnloa -XtlhPrefetch -Xlp On the PowerEdge M915 blades, the following bindings were used to ensure that each of the eight JVMs ran on six logical processors: start /affinity [3F,FC0,3F000,FC0000,3F000000,FC0000000,3F000000000,FC0000000000] 15 JVM build 2.4, J2RE 1.6.0 IBM J9 2.4 Windows Server 2008 amd64-64 jvmwa64 60sr5-20090519_35743 20 Power Efficiency Comparison of the Dell PowerEdge M915 and HP ProLiant BL680c G7 Blade Solutions On the ProLiant BL680c G7 blades, the following bindings were used to ensure that each of the 16 JVMs ran on 4 logical processors: start /affinity [F, F0, F00, F000, F0000, F00000, F000000, F0000000, F00000000, F000000000, F0000000000, F00000000000, F000000000000, F0000000000000, F00000000000000, F000000000000000] Power Meter Configuration Power consumption for each blade chassis under test was monitored by two Yokogawa WT210 Digital Power Meters. Both chassis under test had a total of 6 PSUs, so each Yokogawa WT210 monitored power for 3 PSUs. 21 Power Efficiency Comparison of the Dell PowerEdge M915 and HP ProLiant BL680c G7 Blade Solutions Appendix B—Blade Server Hardware Configuration Table 4: Blade Server Hardware Configuration Dell PowerEdge M915 HP ProLiant BL680c G7 Memory Modules Total RAM in each blade (GB) 128 128 Samsung M393B523CH0-YH9 Samsung M393B5673FH0-CH9Q5 PC3L-10600R PC3-10600R Speed (MHz) 1333 1333 Speed in system as tested 1066 1066 Timing/latency CAS 9 CAS 9 Number of RAM modules 32 x 4 GB 64 x 2 GB Rank organization Dual Rank Dual Rank Vendor and model number Dell P/N 0J084N HP 518216-002 Number of disks in system 2 2 146 146 RPM 15,000 15,000 Type SAS 6 Gbps SAS 6 Gbps RAID Type RAID 1 RAID 1 + 016 Controller Dell PERC H200 HP Smart Array P410i Microsoft Windows Server 2008 R2 Enterprise SP1 Microsoft Windows Server 2008 R2 Enterprise SP1 Build number 7601 7601 File system NTFS NTFS English English 2 x Broadcom BCM57712-k Dual Port 10Gb 6 HP NC553i 10Gb FlexFabric adapter ports Integrated Integrated Vendor and model number Type Hard Disk Size (GB) Operating System Name Language Network Adapter Vendor and model number Type 16 On the HP Smart Array P410i, RAID 1+0 is the only option available in a 2 hard drive configuration. 22 Power Efficiency Comparison of the Dell PowerEdge M915 and HP ProLiant BL680c G7 Blade Solutions Appendix C—Server Firmware and Drivers Table 5: Server Firmware and Drivers Driver/Firmware Dell PowerEdge M915 Versions HP ProLiant BL680c G7 System BIOS 1.0.3 2011.02.19 (Released 3/21/2011) Network Firmware 6.2.16 3.102.517.7 Network Drivers 16.2.1 2.104.277.3 07.02.42.00 3.52 HBA Drivers 4.31.1.64 6.20.2.64 Video Driver 1.1.3.0 OS Native Integrated Management Controller Firmware 3.21 build 48 1.20 Management Controller Driver N/A 3.3.0.0 HBA Firmware 23 Power Efficiency Comparison of the Dell PowerEdge M915 and HP ProLiant BL680c G7 Blade Solutions Appendix D—Results The full reports from the SPECpower_ssj2008 runs used in this comparison are attached to this whitepaper for reference. The first page of each is shown here for convenience. Figure 8: Dell Blade Solution Benchmark Results 24 Power Efficiency Comparison of the Dell PowerEdge M915 and HP ProLiant BL680c G7 Blade Solutions Figure 9: HP Blade Solution Benchmark Results 25