1
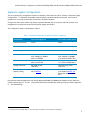
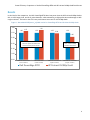
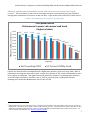
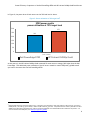
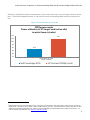
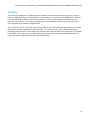
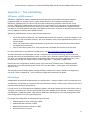
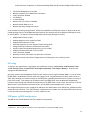
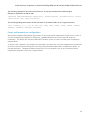
Comparing Power Efficiency of the Dell PowerEdge R720 and HP ProLiant DL380p Gen8 Rack Servers This white paper compares the power efficiency of the Intel Xeon processor E5-2600 based Dell and HP 2U rack servers Brian Bassett Solutions Performance Analysis Dell | Enterprise Solutions Group Power Efficiency Comparison of the Dell PowerEdge R720 and HP ProLiant DL380p Gen8 Rack Servers This document is for informational purposes only and may contain typographical errors and technical inaccuracies. The content is provided as is, without express or implied warranties of any kind. © 2012 Dell Inc. All rights reserved. Dell and its affiliates cannot be responsible for errors or omissions in typography or photography. Dell, the Dell logo, and PowerEdge are trademarks of Dell Inc. Intel and Xeon are registered trademarks of Intel Corporation in the U.S. and other countries. Microsoft, Windows, and Windows Server are either trademarks or registered trademarks of Microsoft Corporation in the United States and/or other countries. Other trademarks and trade names may be used in this document to refer to either the entities claiming the marks and names or their products. Dell disclaims proprietary interest in the marks and names of others. SPEC® and the benchmark name SPECpower_ssj® are registered trademarks of the Standard Performance Evaluation Corporation. For more information about SPECpower, see www.spec.org/power_ssj2008/ July 2012 Revision 1.01 ii Power Efficiency Comparison of the Dell PowerEdge R720 and HP ProLiant DL380p Gen8 Rack Servers Contents Executive summary ..................................................................................................... 4 Introduction ............................................................................................................ 4 Key findings ............................................................................................................. 4 Performance/watt ................................................................................................... 4 Performance .......................................................................................................... 4 Power .................................................................................................................. 4 Methodology ............................................................................................................. 4 Apples-to-apples configuration ....................................................................................... 5 Results .................................................................................................................... 6 Summary ................................................................................................................ 10 Appendix A — Test methodology ................................................................................... 11 SPECpower_ssj2008 standard ...................................................................................... 11 BIOS settings .......................................................................................................... 11 OS tuning .............................................................................................................. 12 SPECpower_ssj2008 configuration ................................................................................ 12 Power and temperature configuration ........................................................................... 13 Appendix B — Server hardware configuration information .................................................... 14 Appendix C — Server firmware and drivers ....................................................................... 15 Appendix D — SPECpower_ssj2008 results ........................................................................ 16 Tables Table 1: Detailed configuration for power efficiency comparison ............................................... 5 Table 2: Server hardware configuration information ............................................................. 14 Table 3: Server firmware and drivers ................................................................................ 15 Figures Figure 1: Normalized SPECpower_ssj2008 results for PowerEdge R720 and ProLiant DL380p Gen8 ........ 6 Figure 2: Performance per watt ratios for all target loads ........................................................ 7 Figure 3: Power utilization at 70% target load ....................................................................... 8 Figure 4: Power utilization at active idle ............................................................................. 9 Figure 5: SPECpower_ssj2008 results for PowerEdge R720 ...................................................... 16 Figure 6: SPECpower_ssj2008 results for ProLiant DL380p Gen8 ............................................... 17 iii Power Efficiency Comparison of the Dell PowerEdge R720 and HP ProLiant DL380p Gen8 Rack Servers Executive summary With power and cooling costs accounting for increasingly large portions of IT budgets, IT departments looking to minimize total cost of ownership (TCO) are making power efficiency a priority when choosing server hardware. In this white paper, we examine the power efficiency of two rack servers in the two-processor, 2U form factor, a form factor that is one of the most popular in many data centers because of the balance it strikes between density and expandability. Introduction Dell™ commissioned its Solutions Performance Analysis team to compare the Dell PowerEdge R720 and the HP® ProLiant™ DL380p Gen8, both of which support the Intel® Xeon® processor E5-2600 product family. Using the industry-standard SPECpower_ssj2008® benchmark, the two servers were tested for performance, power draw, and performance/watt, with the hardware configured as similarly as possible to ensure an apples-to-apples comparison. The results showed the Dell PowerEdge™ R720 consumed less power in the tested configuration, while delivering better raw performance and greater power efficiency. Key findings Performance/watt The HP ProLiant DL380p Gen8 achieved a 15% lower performance to power ratio overall than in the Dell PowerEdge R720 in the tested configuration. At a 70% target load, the R720 had a 28% higher performance to power ratio. Performance Despite drawing less power, the PowerEdge R720 provided slightly higher raw performance than the ProLiant DL380p Gen8. Power In this apples-to-apples configuration, the ProLiant DL380p Gen8 consumed 7% more power at 100% target load and 10% more power at idle compared to the PowerEdge R720. Test methodology and detailed results are documented in this paper. Methodology SPECpower_ssj2008 is an industry standard benchmark created by the Standard Performance Evaluation Corporation (SPEC®) to measure a server’s power and performance across multiple utilization levels. Appendix A — Test methodology details the test methodology used by Dell; Appendix B — Server hardware configuration information and Appendix C — Server firmware and drivers provide detailed configurations for the tests; and Appendix D — SPECpower_ssj2008 results provides detailed report data that supports the results in this paper. 4 Power Efficiency Comparison of the Dell PowerEdge R720 and HP ProLiant DL380p Gen8 Rack Servers Apples-to-apples configuration The two systems were configured as similarly as possible, with similar hard drive, memory, and power supply configurations. To eliminate any possible power efficiency variations between processors, tests on both systems were run using the same pair of Intel Xeon E5-2660 processors. Storage controllers were matched as closely as possible between the two systems, and both systems were equipped with two platinum-rated 750 watt power supply units (PSUs). The configuration used is summarized in Table 1. Table 1: Detailed configuration for power efficiency comparison Configuration Dell PowerEdge R720 HP Proliant DL380p Gen8 Sockets/form factor 2S/2U 2S/2U Processors 2 x Intel Xeon E5-2660 2 x Intel Xeon E5-2660 Physical/logical cores 16/32 16/32 Memory 4 x 8GB Dual Ranked PC3L-10600R, LV RDIMMs (Dell P/N 0P9RN2) 4 x 8GB Dual Ranked PC3L-10600R, LV RDIMMs (Part number 647897-B21) Hard drives 2 x 73GB 15k 6Gb, RAID 1 (Dell P/N 0XT764) 2 x 73GB 15k 6Gb, RAID 1+01 (HP P/N 652597-B21) Storage controller Dell PERC H710P 1GB cache HP Smart Array P420i 1GB cache Power supply quantity/rating 2 x 750 W (DP/N 05NF18) 2 x 750 W (part number 643955-101 Option Kit number 656363B21) Both systems were equipped with Low Voltage Registered DIMMs (LV RDIMMs) purchased with the respective systems and running at 1.35 volts. The systems used factory default BIOS settings except as noted in Appendix A — Test methodology. 1 On the HP Smart Array P420i, RAID 1+0 is the only option available in a two-hard drive configuration. 5 Power Efficiency Comparison of the Dell PowerEdge R720 and HP ProLiant DL380p Gen8 Rack Servers Results In this like-for-like comparison, the Dell PowerEdge R720 drew less power than the HP ProLiant DL380p Gen8 at idle, at 100% target load, and at all points between, while maintaining a slight performance advantage at 100% target workload. This lead to the 15% lower performance/watt ratio for the DL380p Gen8. Figure 1: Normalized SPECpower_ssj2008 results for PowerEdge R720 and ProLiant DL380p Gen8 1.20 1.10 1.07 1.00 1.00 1.00 1.00 0.99 1.00 0.85 0.80 0.60 The DL380p Gen8 consumes 7% more power at 100% load and 10% more power at idle Performance/Watt ratio of the DL380p Gen8 is 15% worse 0.40 0.20 0.00 Maximum Power Draw (lower is better) Idle Power Draw (lower is better) Dell PowerEdge R720 Maximum Performance (higher is better) Performance / Watt ratio (higher is better) HP ProLiant DL380p Gen8 6 Power Efficiency Comparison of the Dell PowerEdge R720 and HP ProLiant DL380p Gen8 Rack Servers SPECpower_ssj2008 includes a measurement of power while the servers are at varying levels of target utilization. The performance-to-watt ratio at each target load level is total operations (ssj_ops) divided by average power consumption of the server at that load level. Figure 2 shows power efficiency at each interval. Figure 2: Performance per watt ratios for all target loads2 SPECpower results Performance to power ratio across load levels (higher is better) SPECpower_ssj2008 ssj_ops per watt 4,500 4,000 3,500 3,000 2,500 4,214 4,210 4,072 3,975 3,787 3,752 3,491 3,539 3,319 3,108 3,010 3,0263,009 2,797 2,601 2,415 1,947 1,784 2,000 1,500 1,080 949 1,000 500 0 100% 90% 80% 70% 60% 50% 40% 30% 20% 10% Target Load Dell PowerEdge R720 HP ProLiant DL380p Gen8 Figure 2 also shows that the PowerEdge R720 has a higher power efficiency ratio at all target loads. When IT professionals are sizing their data center needs, a target CPU utilization of 70% is often recommended to allow extra capacity for load peaks. This makes that interval particularly relevant for evaluating power efficiency. At the 70% target load interval, the R720’s ratio of 3,975 ssj_ops/watt gives it a 28% power efficiency advantage over the ProLiant DL380p Gen8, with its ratio of 3,108. 2 Required SPEC disclosure information: R720 scores: (1,235,223 ssj_ops and 303W) @ 100% target load and 3,352 overall ssj_ops/watt vs. DL380p Gen8: (1,217,238 ssj_ops and 324W) @ 100% and 2,861 overall ssj_ops/watt. Comparison based on results by Dell Labs June 2012. SPEC® and the benchmark name SPECpower_ssj® are registered trademarks of the Standard Performance Evaluation Corporation. For more information about SPECpower, see www.spec.org/power_ssj2008/. 7 Power Efficiency Comparison of the Dell PowerEdge R720 and HP ProLiant DL380p Gen8 Rack Servers In Figure 3, the power draw of both servers at the 70% load level is shown. Figure 3: Power utilization at 70% target load 3 SPECpower results power utilization at 70% target load 300 250 275 222 200 150 100 50 0 Power draw in watts (lower is better) Dell PowerEdge R720 HP ProLiant DL380p Gen8 At this interval, the HP ProLiant DL380p Gen8 consumed 53 watts more on average, 28% higher than the Dell PowerEdge. This additional power utilization of the HP server caused its overall SPECpower_ssj2008 overall ops/watt to be worse than the Dell PowerEdge R720. 3 Required SPEC disclosure information: R720 scores: (1,235,223 ssj_ops and 303W) @ 100% target load and 3,352 overall ssj_ops/watt vs. DL380p Gen8: (1,217,238 ssj_ops and 324W) @ 100% and 2,861 overall ssj_ops/watt. Comparison based on results by Dell Labs June 2012. SPEC® and the benchmark name SPECpower_ssj® are registered trademarks of the Standard Performance Evaluation Corporation. For more information about SPECpower, see www.spec.org/power_ssj2008/. 8 Power Efficiency Comparison of the Dell PowerEdge R720 and HP ProLiant DL380p Gen8 Rack Servers SPECpower_ssj2008 also includes a measurement of power while the servers are at 0% target utilization (Active Idle). The ProLiant DL380p Gen8 drew 17.5W (10%) more than the PowerEdge R720 when both systems were idle. Figure 4: Power utilization at active idle4 SPECpower results Power utilization at 0% target load (active idle) in watts (lower is better) 110 105 105 100 95 90 87.5 85 80 75 Power draw in watts (lower is better) Dell PowerEdge R720 4 HP ProLiant DL380p Gen8 Required SPEC disclosure information: R720 scores: (1,235,223 ssj_ops and 303W) @ 100% target load and 3,352 overall ssj_ops/watt vs. DL380p Gen8: (1,217,238 ssj_ops and 324W) @ 100% and 2,861 overall ssj_ops/watt. Comparison based on results by Dell Labs June 2012. SPEC® and the benchmark name SPECpower_ssj® are registered trademarks of the Standard Performance Evaluation Corporation. For more information about SPECpower, see www.spec.org/power_ssj2008/. 9 Power Efficiency Comparison of the Dell PowerEdge R720 and HP ProLiant DL380p Gen8 Rack Servers Summary The results of the SPECpower_ssj2008 testing show similar performance between the two systems, with the Dell PowerEdge R720 having a 1% advantage in raw performance over the HP ProLiant DL380p Gen8. However, the ProLiant DL380p Gen8 has 15% lower power efficiency overall, and 28% lower power efficiency at the important 70% load level. This lower power efficiency led to the DL380p Gen8 drawing as much as 53 watts more compared to the similarly configured R720. The two-socket 2U server form factor has become a staple in many data centers because these servers strike a good balance between expandability and rack density. As energy costs rise, power efficiency becomes an increasingly important factor in the decision to purchase these important data center components. The greater performance, lower power draw, and higher performance/watt ratio of the Dell PowerEdge R720 make it a compelling solution compared to the HP ProLiant DL380p Gen8. 10 Power Efficiency Comparison of the Dell PowerEdge R720 and HP ProLiant DL380p Gen8 Rack Servers Appendix A — Test methodology SPECpower_ssj2008 standard SPECpower_ssj2008 is an industry standard benchmark created by the Standard Performance Evaluation Corporation (SPEC) to measure a server’s power and performance across multiple utilization levels. SPECpower_ssj2008 consists of a Server Side Java (SSJ) workload along with data collection and control services. SPECpower_ssj2008 results portray the server’s performance in ssj_ops (server side Java operations per second) divided by the power used in watts (ssj_ops/watt). SPEC created SPEcpower_ssj2008 for those who want to accurately measure the power consumption of their server in relation to the performance that the server is capable of achieving with ssj2008 workload. SPECpower_ssj2008 consists of three main software components: Server Side Java (SSJ) Workload—Java database that stresses the processors, caches and memory of the system, as well as software elements, such as OS elements and the Java implementation chosen to run the benchmark. Power and Temperature Daemon (PTDaemon)—Program that controls and reports the power analyzer and temperature sensor data. Control and Collect System (CCS)—Java program that coordinates the collection of all the data. For more information on how SPECpower_ssj008 works, see http://www.spec.org/power_ssj2008/. All results discussed in this whitepaper are from “compliant runs” in SPEC terminology, which means that although they have not been submitted to SPEC for review, Dell is allowed to disclose them for the purpose of this study. All configuration details required to reproduce these results are listed in Appendices A, B, and C; all result files from the runs compared are included in Appendix D — SPECpower_ssj2008 results. Both servers were configured by installing a fresh copy of Microsoft® Windows Server® 2008 Enterprise R2 (Service Pack 1) and the operating system install with a two drive RAID 1, choosing the “full installation” option for each. The latest driver and firmware update packages available to both servers were installed at the beginning of this study. Refer to Appendix B — Server hardware configuration information for details. BIOS settings Available BIOS settings differed between the two manufacturers. Settings common to the two platforms were set identically, and settings not common to the two platforms but known to affect power efficiency were set to the best known setting for each platform. For both servers, Intel Turbo Boost was enabled by default, and memory speed was left at the default value of 1333 MHz. Prefetchers built into the Xeon E5-2660 chips were disabled on both systems, a common tuning for the SPECpower_ssj2008 benchmark. Both systems defaulted to handling their own power management rather than leaving that function to the operating system. For the Dell PowerEdge R720 the following settings were used: Disabled Adjacent Sector Prefetcher in BIOS. Disabled Hardware Prefetch in BIOS. Disabled DCU Streamer Prefetcher in BIOS. System Profile set to Custom 11 Power Efficiency Comparison of the Dell PowerEdge R720 and HP ProLiant DL380p Gen8 Rack Servers CPU Power Management set to DAPC Memory Frequency set to Maximum Performance Intel Turbo Boost Enabled C1E Enabled C States Enabled Memory Patrol Scrub set to Disabled. Memory Refresh Rate set to 1x Memory Operating Voltage set to Auto As of the date the testing was performed, HP had not published any SPECpower results for their Gen8 servers, so BIOS settings used for the DL380p Gen8 were based on the settings used in the published SPECpower result for the DL380 G7. For the HP ProLiant DL380p Gen8 the following settings were used: Disabled HW Prefetch in BIOS Disabled Adjacent Sector Prefetch in BIOS Disabled DCU Prefetcher in BIOS HP Power Regulator set to HP Dynamic Power Savings Mode Energy/Performance Bias set to Balanced Performance Dynamic Power Savings Mode Response set to Slow in BIOS Disabled Collaborative Power Control in BIOS Intel Turbo Boost enabled Minimum Processor Idle Power Core State set to C6 State Minimum Processor Idle Power Package State set to Package C6 (non-retention) State OS tuning To improve Java performance, large pages were enabled by entering Control Panel->Administrative Tools>Local Security Policy->Local Policies->User Rights Assignment->Lock Pages in Memory. An option was changed to add Administrator. Operating System Power Management mode for both solutions was changed to Power Saver. For the ProLiant DL380p Gen8, the Minimum Processor state was changed to 0%, and the Maximum Processor State was set to 100%; these settings are common tunings for the SPECpower_ssj2008 benchmark when the system is running in Power Saver mode. This change was not made on the PowerEdge R720, since the Minimum and Maximum Processor State settings not available for adjustment on the R720 when it is set to Dell Active Power Controller (DAPC) mode. Both solutions were edited to turn off the Hard Drive and display after 1 minute. We configured both servers with a separate IP address on the same subnet as our SPECpower_ssj2008 controller system where the Director, CCS, and PTDaemon components were located, and connected both servers directly to the controller system through NIC 1 for their respective runs. SPECpower_ssj2008 configuration The IBM J9 Java Virtual Machine (JVM)5 was used for both solutions. 5 JVM build 2.4, J2RE 1.6.0 IBM J9 2.4 Windows Server® 2008 amd64-64 jvmwa64 60sr5-20090519_35743 12 Power Efficiency Comparison of the Dell PowerEdge R720 and HP ProLiant DL380p Gen8 Rack Servers The following JVM options were used on both servers, as they are the best-known JVM tunings for SPECpower_ssj2008 for the IBM J9 JVM: -Xms1024m -Xmx1024m-Xmn853m -Xaggressive -Xcompressedrefs -XlockReservation -Xnoloa -XtlhPrefetch -Xlp -Xgcpolicy:gencon The following bindings were used to ensure that each of the sixteen JVMs ran on 2 logical processors: start /affinity [3, C, 30, C0, 300, C00, 3000, C000, 30000, C0000, 300000, C00000, 3000000, C0000000, 30000000, C0000000] Power and temperature configuration We used the Yokogawa WT210 Digital Power Meter for the actual power measurement of the servers, as this is the most commonly used analyzer for SPECpower_ssj2008 publications at the time that this study was undertaken. The WT210 unit used was calibrated in October of 2011 to ensure accurate power consumption measurements. To ensure a fair comparison, the systems were mounted in the same rack, and inlet temperature was measured at the front of both systems during their runs using a Digi International Watchport/H temperature probe. As the attached Power _Temperature Details reports show, the two systems were run in environments with a temperature difference of less than 1 degree Celsius. 13 Power Efficiency Comparison of the Dell PowerEdge R720 and HP ProLiant DL380p Gen8 Rack Servers Appendix B — Server hardware configuration information Table 2: Server hardware configuration information Server hardware PowerEdge R720 Proliant DL380p Gen8 32 32 Samsung Samsung 2Rx8 PC3L-10600R 2Rx8 PC3L-10600R Speed (MHz) 1333 1333 Timing/latency CAS 9 CAS 9 4 x 8 GB 4 x 8 GB Memory modules Total RAM in system (GB) Vendor Type Number of RAM modules Hard disk Number of disks in system 2 2 Size (GB) 73 73 RPM 15,000 15,000 Type SAS 6 Gbps SAS 6 Gbps RAID type RAID 1 RAID 1 + 06 Controller Dell PERC H710P 1GB HP Smart Array P420i 1GB Operating system Name Microsoft Windows Server 2008 R2 Enterprise SP1 Microsoft Windows Server 2008 R2 Enterprise SP1 Build number 7601 7601 File system NTFS NTFS English English Language Network adapter Vendor and model number Type 6 Intel I350-t Quad Port Gigabit Broadcom 331FLR Quad Port Gigabit Integrated Integrated On the HP Smart Array P400i, RAID 1+0 is the only option available in a two-hard drive configuration. 14 Power Efficiency Comparison of the Dell PowerEdge R720 and HP ProLiant DL380p Gen8 Rack Servers Appendix C — Server firmware and drivers Table 3: Server firmware and drivers Driver/firmware versions PowerEdge R720 Proliant DL380p Gen8 1.1.2 2012.02.25 11.14.44 7.0.6.0 HBA firmware 21.0.2-0001 2.14 HBA drivers 5.1.112.64 6.22.0.64 Video driver 2.4.1.0 6.12.1.1020 Integrated management controller firmware 1.06.06 1.05 N/A 3.5.0.0 System BIOS Network drivers Management controller driver 15 Power Efficiency Comparison of the Dell PowerEdge R720 and HP ProLiant DL380p Gen8 Rack Servers Appendix D — SPECpower_ssj2008 results Figure 5: SPECpower_ssj2008 results for PowerEdge R720 16 Power Efficiency Comparison of the Dell PowerEdge R720 and HP ProLiant DL380p Gen8 Rack Servers Figure 6: SPECpower_ssj2008 results for ProLiant DL380p Gen8 17