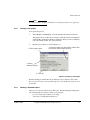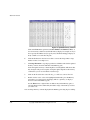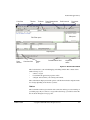
1
RealView Debugger
™
Version 1.6
Essentials Guide
Copyright © 2002 ARM Limited. All rights reserved.
ARM DUI 0181B
RealView Debugger
Essentials Guide
Copyright © 2002 ARM Limited. All rights reserved.
Release Information
The following changes have been made to this document.
Change History
Date
Issue
Change
April 2002
A
RealView Debugger 1.5 release.
September 2002
B
RealView Debugger v1.6 release.
Proprietary Notice
Words and logos marked with ® or ™ are registered trademarks or trademarks owned by ARM Limited. Other
brands and names mentioned herein may be the trademarks of their respective owners.
Neither the whole nor any part of the information contained in, or the product described in, this document
may be adapted or reproduced in any material form except with the prior written permission of the copyright
holder.
The product described in this document is subject to continuous developments and improvements. All
particulars of the product and its use contained in this document are given by ARM in good faith. However,
all warranties implied or expressed, including but not limited to implied warranties of merchantability, or
fitness for purpose, are excluded.
This document is intended only to assist the reader in the use of the product. ARM Limited shall not be liable
for any loss or damage arising from the use of any information in this document, or any error or omission in
such information, or any incorrect use of the product.
ii
Copyright © 2002 ARM Limited. All rights reserved.
ARM DUI 0181B
Contents
RealView Debugger Essentials Guide
Preface
About this book .............................................................................................. vi
Feedback ....................................................................................................... xi
Chapter 1
About RealView Debugger
1.1
1.2
1.3
1.4
Chapter 2
RealView Debugger v1.6 ............................................................................ 2-2
Getting more information online .................................................................. 2-5
Getting Started with RealView Debugger
3.1
3.2
3.3
3.4
3.5
ARM DUI 0181B
1-2
1-4
1-6
1-7
Features of RealView Debugger
2.1
2.2
Chapter 3
RealView Debugger ....................................................................................
About the debugging environment ..............................................................
Debugging mode .........................................................................................
Using the documentation suite ....................................................................
Starting RealView Debugger ....................................................................... 3-2
Connecting to a target ................................................................................. 3-4
Working with memory .................................................................................. 3-7
Loading an image ..................................................................................... 3-10
Debugging an image ................................................................................. 3-14
Copyright © 2002 ARM Limited. All rights reserved.
iii
Contents
Chapter 4
Quick-start Tutorial
4.1
4.2
4.3
4.4
4.5
4.6
Chapter 5
Ending your RealView Debugger Session
5.1
5.2
5.3
Chapter 6
Saving the session ..................................................................................... 5-2
Disconnecting from a target ........................................................................ 5-5
Exiting RealView Debugger ........................................................................ 5-7
RealView Debugger Desktop
6.1
6.2
6.3
6.4
6.5
6.6
6.7
Appendix A
How to use the tutorial ................................................................................ 4-2
Setting up your first project ......................................................................... 4-3
Debugging with RealView Debugger ........................................................ 4-13
Working with custom panes ...................................................................... 4-27
More about projects .................................................................................. 4-29
Completing the tutorial .............................................................................. 4-35
About the desktop ....................................................................................... 6-2
Finding options on the main menu ........................................................... 6-11
Working with button toolbars .................................................................... 6-15
Working in the Code window .................................................................... 6-19
Editor window ........................................................................................... 6-22
Resource Viewer window ......................................................................... 6-23
Analysis window ....................................................................................... 6-26
Configuration Files Reference
A.1
A.2
A.3
Overview ..................................................................................................... A-2
Files in the etc directory .............................................................................. A-3
Files in the home directory ......................................................................... A-5
Glossary
iv
Copyright © 2002 ARM Limited. All rights reserved.
ARM DUI 0181B
Preface
This preface introduces the RealView Debugger Essentials Guide. This guide shows
you how to start using RealView Debugger to manage software projects and to debug
your application programs. It contains the following sections:
•
About this book on page vi
•
Feedback on page xi.
ARM DUI 0181B
Copyright © 2002 ARM Limited. All rights reserved.
v
Preface
About this book
RealView Debugger provides a powerful tool for debugging and managing software
projects. This book contains:
•
an introduction to the software components that make up RealView Debugger
•
a tutorial to create a project and build an executable image
•
a step-by-step guide to getting started, making a connection to a target, and
loading an image to start a debugging session
•
details about ending a debugging session
•
a description of the RealView Debugger desktop
•
a glossary of terms for users new to RealView Debugger.
Intended audience
This book is written for developers who are using RealView Debugger to manage
ARM-targeted development projects. It assumes that you are an experienced software
developer, and that you are familiar with the ARM development tools. It does not
assume that you are familiar with RealView Debugger.
Using this book
This book is organized into the following chapters:
Chapter 1 About RealView Debugger
Read this chapter for an introduction to RealView Debugger. This chapter
describes the underlying debugger concepts and explains terminology
used in the rest of this book and the documentation suite.
Chapter 2 Features of RealView Debugger
Read this chapter for a description of the features of RealView Debugger,
including details about those that are new in RealView Debugger v1.6.
Chapter 3 Getting Started with RealView Debugger
This chapter explains how to begin using RealView Debugger for the first
time. This describes how to start RealView Debugger, make a connection,
and load an image ready to start debugging.
vi
Copyright © 2002 ARM Limited. All rights reserved.
ARM DUI 0181B
Preface
Chapter 4 Quick-start Tutorial
Read this chapter when you have access to a workstation. Follow the
step-by-step instructions to gain some experience of using RealView
Debugger to manage a project and to debug software.
Chapter 5 Ending your RealView Debugger Session
This chapter describes how to end your RealView Debugger session and
exit the debugger.
Chapter 6 RealView Debugger Desktop
Read this chapter for a detailed description of the contents of the
RealView Debugger desktop.
Glossary
An alphabetically arranged glossary defines the special terms used.
Typographical conventions
The following typographical conventions are used in this book:
italic
Highlights important notes, introduces special terminology,
denotes internal cross-references, and citations.
bold
Highlights interface elements, such as menu names. Denotes
ARM processor signal names. Also used for terms in descriptive
lists, where appropriate.
monospace
Denotes text that can be entered at the keyboard, such as
commands, file and program names, and source code.
monospace
Denotes a permitted abbreviation for a command or option. The
underlined text can be entered instead of the full command or
option name.
monospace italic
Denotes arguments to commands and functions where the
argument is to be replaced by a specific value.
monospace bold
Denotes language keywords when used outside example code.
Further reading
This section lists publications from both ARM Limited and third parties that provide
additional information.
ARM periodically provides updates and corrections to its documentation. See
http://www.arm.com for current errata, addenda, and Frequently Asked Questions.
ARM DUI 0181B
Copyright © 2002 ARM Limited. All rights reserved.
vii
Preface
ARM publications
This book is part of the RealView Debugger documentation suite. Other books in this
suite include:
•
RealView Debugger v1.6 User Guide (ARM DUI 0153)
•
RealView Debugger v1.6 Target Configuration Guide (ARM DUI 0182)
•
RealView Debugger v1.6 Command Line Reference Guide (ARM DUI 0175)
•
RealView Debugger v1.6 Extensions User Guide (ARM DUI 0174).
If you are using RealView Debugger with the ARM Developer Suite (ADS) v1.2, refer
to the following books in the ADS document suite for more information:
•
Getting Started (ARM DUI 0064)
•
ADS Compilers and Libraries Guide (ARM DUI 0067)
•
ADS Linker and Utilities Guide (ARM DUI 0151)
•
CodeWarrior IDE Guide (ARM DUI 0065)
•
AXD and armsd Debuggers Guide (ARM DUI 0066)
•
ADS Assembler Guide (ARM DUI 0068)
•
ADS Debug Target Guide (ARM DUI 0058)
•
ADS Developer Guide (ARM DUI 0056).
If you are using RealView Debugger with the RealView Compilation Tools (RVCT)
v1.2, refer to the following books in the RVCT document suite for more information:
•
RealView Compilation Tools v1.2 Getting Started Guide (ARM DUI 0202)
•
RealView Compilation Tools v1.2 Compilers and Libraries Guide (ARM DUI
0205)
•
RealView Compilation Tools v1.2 Linker and Utilities Guide (ARM DUI 0206)
•
RealView Compilation Tools v1.2 Assembler Guide (ARM DUI 0204)
•
RealView Compilation Tools v1.2 Developer Guide (ARM DUI 0203).
The following documentation provides general information on the ARM architecture,
processors, associated devices, and software interfaces:
•
ARM Architecture Reference Manual (ARM DUI 0100). This is provided in
electronic form with ADS and is also available as a printed book:
David Seal, ARM Architecture Reference Manual, Second Edition, 2001, Addison
Wesley. ISBN 0-201-73719-1
•
viii
ARM Reference Peripheral Specification (ARM DDI 0062)
Copyright © 2002 ARM Limited. All rights reserved.
ARM DUI 0181B
Preface
•
ARM-Thumb® Procedure Call Standard (ATPCS) Specification (SWS ESPC
0002).
Refer to the following documentation for information relating to the ARM debug
interfaces suitable for use with RealView Debugger:
•
ARM Agilent Debug Interface v1.0 User Guide (ARM DUI 0158)
•
Multi-ICE version 2.2.2 User Guide (ARM DUI 0048).
Refer to the following documentation for information relating to specific ARM Limited
processors:
•
ARM7TDMI (Rev 4) Technical Reference Manual (ARM DDI 0210)
•
ARM7EJ-S (Rev 1) Technical Reference Manual (ARM DDI 0214)
•
ARM9TDMI (Rev 3) Technical Reference Manual (ARM DDI 0180)
•
ARM920T (Rev 1) Technical Reference Manual (ARM DDI 0151)
•
ARM922T (Rev 0) Technical Reference Manual (ARM DDI 0184)
•
ARM9EJ-S (Rev 1) Technical Reference Manual (ARM DDI 0222)
•
ARM926EJ-S (Rev 0) Technical Reference Manual (ARM DDI 0198)
•
ARM940T (Rev 2) Technical Reference Manual (ARM DDI 0144)
•
ARM946E-S (Rev 1) Technical Reference Manual (ARM DDI 0201)
•
ARM966E-S (Rev 2) Technical Reference Manual (ARM DDI 0213)
•
ARM1020E Technical Reference Manual (ARM DDI 0177)
•
ARM1022E Technical Reference Manual (ARM DDI 0237).
Refer to the following documentation for details on the FLEXlm® license management
system, supplied by GLOBEtrotter Inc., that controls the use of ARM applications:
•
ARM FLEXlm License Management Guide (ARM DUI 0209).
Other publications
For a comprehensive introduction to ARM architecture see:
Steve Furber, ARM system-on-chip architecture (2nd edition, 2000). Addison Wesley,
ISBN 0-201-67519-6.
For the definitive guide to the C programming language, on which the RealView
Debugger macro and expression language is based, see:
Brian W. Kernighan, Dennis M. Ritchie, The C Programming Language (2nd edition,
1989). Prentice-Hall, ISBN 0-13-110362-8.
For more information about Oak and TeakLite processors from the DSP Group see:
http://www.dspg.com.
ARM DUI 0181B
Copyright © 2002 ARM Limited. All rights reserved.
ix
Preface
Contact information for MaxCore from AXYS is available at:
http://www.axysdesign.com.
x
Copyright © 2002 ARM Limited. All rights reserved.
ARM DUI 0181B
Preface
Feedback
ARM Limited welcomes feedback on both RealView Debugger and its documentation.
Feedback on RealView Debugger
If you have any problems with RealView Debugger, please submit a Software Problem
Report:
1.
Select Help → Send a Problem Report... from the RealView Debugger main
menu.
2.
Complete all sections of the Software Problem Report.
3.
To get a rapid and useful response, please give:
4.
•
a small standalone sample of code that reproduces the problem, if
applicable
•
a clear explanation of what you expected to happen, and what actually
happened
•
the commands you used, including any command-line options
•
sample output illustrating the problem.
Email the report to your supplier.
Feedback on this book
If you have any comments on this book, please send email to [email protected] giving:
•
the document title
•
the document number
•
the page number(s) to which your comments apply
•
a concise explanation of your comments.
General suggestions for additions and improvements are also welcome.
ARM DUI 0181B
Copyright © 2002 ARM Limited. All rights reserved.
xi
Preface
xii
Copyright © 2002 ARM Limited. All rights reserved.
ARM DUI 0181B
Chapter 1
About RealView Debugger
This chapter introduces RealView Debugger. It explains how the debugger provides a
development environment for embedded systems applications using the ARM family of
processors.
This chapter contains the following sections:
•
RealView Debugger on page 1-2
•
About the debugging environment on page 1-4
•
Debugging mode on page 1-6
•
Using the documentation suite on page 1-7.
ARM DUI 0181B
Copyright © 2002 ARM Limited. All rights reserved.
1-1
About RealView Debugger
1.1
RealView Debugger
RealView Debugger enables you to debug your embedded application programs and
have complete control over the flow of the program execution so that you can quickly
isolate and correct errors.
1.1.1
RealView Debugger concepts and terminology
The following terminology is used throughout the RealView Debugger documentation
suite to describe debugging concepts:
Debug target
A piece of hardware or simulator that runs your application program. A
hardware debug target might be a single processor, or a development
board containing a number of processors.
Connection The link between the debugger program and the debug target.
Single connection access
The base installation of RealView Debugger enables you to carry out
debugging tasks in single-processor debugging mode, that is where there
is only one target connection.
Multiprocessor access
RealView Debugger has been developed as a fully-featured debugger for
working with multiprocessor debug target systems. Multiprocessor
access enables you to maintain one or more connections to debug targets.
Multiprocessor access is a separately licensed feature of RealView
Debugger.
1-2
DSP
RealView Debugger has been developed to provide full debugging
functions when working with a range of debug target systems including
Digital Signal Processors (DSPs). DSP-based debugging is a separately
licensed feature of RealView Debugger.
RTOS
Operating systems provide software support for application programs
running on a target. Real Time Operating Systems (RTOSs) are operating
systems that are designed for systems that interact with real-world
activities where time is critical.
Copyright © 2002 ARM Limited. All rights reserved.
ARM DUI 0181B
About RealView Debugger
Multithreaded operation
RTOS processes can share the memory of the processor so that each can
share all the data and code of the others. These are called threads.
RealView Debugger enables you to:
ARM DUI 0181B
•
attach Code windows to threads to monitor one or more threads
•
select individual threads to display the registers, variables, and
code related to that thread
•
change the register and variable values for individual threads.
Copyright © 2002 ARM Limited. All rights reserved.
1-3
About RealView Debugger
1.2
About the debugging environment
RealView Debugger uses a three-tier environment to debug application programs:
•
the debugger software
•
the debug interface layer, incorporating the execution vehicles
•
the debug target.
RealView Debugger uses connection information to describe:
•
how the debugger connects to the debug target
•
information required to use that connection
•
what kind of processor the target is using.
It might also include cached copies of processor registers or memory.
This approach means that you can switch between debug targets without having to start
a second or third instance of the debugger program.
This section describes the RealView Debugger debugging environment:
•
Components of RealView Debugger
•
Debug target interface on page 1-5
•
Persistence information on page 1-5.
1.2.1
Components of RealView Debugger
RealView Debugger comprises:
GUI
The Graphical User Interface (GUI) gives access to the main features of
the debugger, command processing, and the Code windows.
Target Vehicle Server (TVS)
RealView Debugger maintains connections through the TVS and plugins
that support each combination of target processor and execution vehicle.
Using plugins, for example a board file (*.brd), and board-chip definition
files (*.bcd), enables RealView Debugger to enumerate advanced
information about your target hardware or processor.
The TVS contains the basic debugging functionality and forms most of
the software making up RealView Debugger. If you have the appropriate
licenses, the TVS provides multiprocessor debugging, supports
multithreaded operation under an RTOS, and enables tracing and
performance profiling.
1-4
Copyright © 2002 ARM Limited. All rights reserved.
ARM DUI 0181B
About RealView Debugger
RealView Connection Broker
RealView Connection Broker operates in two modes:
Local
Operating as RealView Connection Broker, this runs on your
local workstation and enables you to access local targets.
Remote Operating as RealView Network Broker, this runs on a remote
workstation and makes specified targets on that workstation
available to other workstations connected to the same network.
1.2.2
Debug target interface
RealView Debugger works with either a hardware or a software debug target. An ARM
development board communicating through Multi-ICE® is an example of a hardware
debug target system. ARMulator is an example of a software debug target system.
The debug target interface contains the execution vehicles that process requests from the
client tools to the target. A debug interface might be a JTAG interface unit such as
Multi-ICE, a simulator, or a ROM monitor.
1.2.3
Persistence information
RealView Debugger maintains persistence information to enable you to halt a
debugging session and resume at a later date. This means that RealView Debugger can
remember your working environment including:
•
current target connections
•
loaded images
•
open projects
•
desktop settings, for example pane selections and window positions.
ARM DUI 0181B
Copyright © 2002 ARM Limited. All rights reserved.
1-5
About RealView Debugger
1.3
Debugging mode
The base installation of RealView Debugger enables you to debug your images in single
connection mode, that is, where there is only one connection.
If you have the appropriate license, you can also debug multiprocessor applications.
RealView Debugger supports such multiprocessor debugging by maintaining
connections to multiple debug targets through one or more Code windows. When
working in multiprocessor debugging mode, you can use one Code window to cycle
through the connected targets, or multiple Code windows to view different targets.
Multiprocessor debugging mode is a separately licensed feature of RealView Debugger
and is described in detail in RealView Debugger v1.6 Extensions User Guide.
1-6
Copyright © 2002 ARM Limited. All rights reserved.
ARM DUI 0181B
About RealView Debugger
1.4
Using the documentation suite
The RealView Debugger documentation suite consists of five books:
•
RealView Debugger v1.6 Essentials Guide
•
RealView Debugger v1.6 User Guide
•
RealView Debugger v1.6 Target Configuration Guide
•
RealView Debugger v1.6 Command Line Reference Guide
•
RealView Debugger v1.6 Extensions User Guide.
At the front of each book is a Preface describing how the contents are organized and
how information is presented in the chapters. The following description explains how
you might use the books:
1.
You are recommended to read the chapters in this book, RealView Debugger v1.6
Essentials Guide, to start debugging your images and to learn how to use
RealView Debugger quickly. This book describes the minimum needed for the
new user.
2.
For a comprehensive description of the features available in RealView Debugger,
see RealView Debugger v1.6 User Guide. This describes, in detail, how to debug
your images, how to work with projects, and how to configure RealView
Debugger to customize your working environment. This book also contains
examples of debugging software and details shortcuts, and tips, for the developer.
3.
RealView Debugger v1.6 Target Configuration Guide describes how to connect to
targets, how to amend existing targets that are set up in the base installation, and
how to customize your own targets.
4.
If you want to use the RealView Debugger Command Line Interface (CLI) to
control your debugging tasks, RealView Debugger v1.6 Command Line Reference
Guide provides a detailed description of every CLI command and includes
examples of their use.
5.
If you have the appropriate licenses, you can access RealView Debugger
extensions, for example multiprocessor debugging mode and Trace. These
features are described in RealView Debugger v1.6 Extensions User Guide.
Refer to ARM FLEXlm License Management Guide for details on the license
management system that controls the use of ARM applications.
See the installation notes delivered with your product for details on installing RealView
Debugger.
ARM DUI 0181B
Copyright © 2002 ARM Limited. All rights reserved.
1-7
About RealView Debugger
1-8
Copyright © 2002 ARM Limited. All rights reserved.
ARM DUI 0181B
Chapter 2
Features of RealView Debugger
This chapter describes the features of RealView Debugger and highlights new
functionality in RealView Debugger v1.6. It contains the following sections:
•
RealView Debugger v1.6 on page 2-2
•
Getting more information online on page 2-5.
ARM DUI 0181B
Copyright © 2002 ARM Limited. All rights reserved.
2-1
Features of RealView Debugger
2.1
RealView Debugger v1.6
RealView Debugger v1.6 provides a range of features for the developer:
•
Multi-core debugging
•
OS awareness
•
Extended Target Visibility (ETV)
•
Advanced debugging facilities
•
Trace, Analysis, and Profiling on page 2-3
•
Project manager on page 2-4
•
RealView Debugger downloads on page 2-4.
2.1.1
Multi-core debugging
RealView Debugger v1.6 provides a single debug kernel for mixed ARM and DSP
debugging. The debugger provides full support for synchronized start and stop,
stepping, and cross triggering of breakpoints.
2.1.2
OS awareness
RealView Debugger v1.6 enables you to:
•
use RTOS debug including Halted System Debug (HSD)
•
interrogate and display resources after execution has halted
•
access semaphores and queues
•
view the status of the current thread or other threads
•
customize views of application threads.
2.1.3
Extended Target Visibility (ETV)
RealView Debugger v1.6 provides visibility of targets such as boards and SoC. Users
can configure targets using board-chip definition files and preconfigured files are
available:
•
ARM family files provided as part of the installation
•
customer/partner board files provided through ARM DevZone®.
2.1.4
Advanced debugging facilities
RealView Debugger v1.6 provides standard debug views and advanced debugging
features:
•
2-2
RealView Debugger supports variables of 64-bit type ‘long long’ throughout the
user interface (new in v1.6).
Copyright © 2002 ARM Limited. All rights reserved.
ARM DUI 0181B
Features of RealView Debugger
2.1.5
•
There is now support for module statics, that is static variables of non-local scope,
in the Call Stack pane (new in v1.6).
•
RealView Debugger offers a powerful command-line interface and scripting
capability that includes macros support, conversion from ARM AXD and armsd,
and history lists to record previous actions.
•
Users can access a console (headless debugger) driven from the command line or
from scripts (new in v1.6).
•
RealView Debugger includes an editing control called Tooltip Evaluation that
provides hover-style evaluation in different code views (new in v1.6).
•
RealView Debugger enables you to position a Memory pane to display a memory
region based on the contents of a variable or register in the Register or Watch
panes, or in the Src tab (new in v1.6).
•
Users now have greater control over panes in the Code window and the debug
views displayed. RealView Debugger provides the option of using a single Code
window to display a wide range of data views during debugging (new in v1.6).
•
Programming Flash modules are available as standard.
•
Memory mapping is enabled if required.
•
Colored memory views indicate the type of memory according to memory map
settings.
Trace, Analysis, and Profiling
New in RealView Debugger v1.6, Trace, Analysis, and Profiling is enabled by a Trace
debug license. Trace support is available for:
•
ARM ETM v1.0 (ETM7 and ETM9), including On-Chip Trace
•
ARM ETM v2.0 (ETM10) (beta)
•
ARMulator ETM simulator
•
AXYS Oak and TeakLite MaxSim simulators
•
DSP Group On-Chip Trace (Oak and TeakLite)
•
Motorola 56600 On-Chip Trace
•
Intel XScale On-Chip Trace.
Trace and Profiling provides full trace support including simple and complex
tracepoints and data filtering:
•
viewing raw trace
•
viewing code trace
•
viewing data trace
ARM DUI 0181B
Copyright © 2002 ARM Limited. All rights reserved.
2-3
Features of RealView Debugger
•
•
•
•
•
viewing disassembly trace
tracing of function calls
the profiling of time spent in each function
the ability to filter captured trace data by field
the ability to sort captured trace data by field.
You can set tracepoints directly in the source-level view and/or the disassembly-level
view. The same functionality is available in the Memory pane so that you can select
regions in memory to trace, or trace a specific memory value when it changes.
2.1.6
Project manager
RealView Debugger v1.6 is a fully-featured Integrated Development Environment
(IDE) including a project manager and build system.
New in v1.6, the project manager includes a Configuration Summary window to display
the switch string passed to the compiler tools for build target configurations in the
current project.
2.1.7
RealView Debugger downloads
ARM provides a range of services to support developers using RealView Debugger.
Among the downloads available are OS awareness modules to support RTOS
developers and enhanced support for different hardware platforms through technical
information and board description files. See http://www.arm.com to access these
resources from ARM DevZone.
2-4
Copyright © 2002 ARM Limited. All rights reserved.
ARM DUI 0181B
Features of RealView Debugger
2.2
Getting more information online
The full documentation suite is available online as DynaText, XML, and PDF files.
Select Start → Programs → RealView Debugger v1.6 from the Windows Start
menu. From here:
•
select Online Books to view the DynaText files
•
select XML Documentation to see the XML version.
You can also access the DynaText files from the Help menu when RealView Debugger
is running.
For a Typical installation, the DynaText and XML files are installed in:
C:\Program Files\ARM\Documentation
To access the XML documentation, you must use either:
•
Netscape 6.2
•
Mozilla 1.0.
The PDF files are installed, as part of the base installation, in install_directory\PDF.
Note
The DynaText, XML, and PDF files contain the same information.
ARM DUI 0181B
Copyright © 2002 ARM Limited. All rights reserved.
2-5
Features of RealView Debugger
2-6
Copyright © 2002 ARM Limited. All rights reserved.
ARM DUI 0181B
Chapter 3
Getting Started with RealView Debugger
This chapter gives step-by-step instructions to get started with RealView Debugger,
including making a connection and loading an image for debugging. It also covers the
main tasks that you might carry out in a debugging session.
It contains the following sections:
•
Starting RealView Debugger on page 3-2
•
Connecting to a target on page 3-4
•
Working with memory on page 3-7
•
Loading an image on page 3-10
•
Debugging an image on page 3-14.
ARM DUI 0181B
Copyright © 2002 ARM Limited. All rights reserved.
3-1
Getting Started with RealView Debugger
3.1
Starting RealView Debugger
To start your debugging session, you must complete the following steps:
1.
Start RealView Debugger.
2.
Connect to your chosen debug target.
3.
Load an image for debugging.
This section describes how to start RealView Debugger and display the default Code
window. It contains the following sections:
•
Starting RealView Debugger
•
The Code window.
3.1.1
Starting RealView Debugger
To start RealView Debugger:
1.
Select Start → Programs → RealView Debugger v1.6 from the Windows Start
menu.
2.
Select RealView Debugger from the menu.
The first time you run RealView Debugger after installation, it creates a unique working
directory, in your RealView Debugger home directory, for you to store your personal
files, debugger settings, and target configuration files. RealView Debugger then creates
or copies files into this directory ready for your first debugging session.
If a user ID is not specified then RealView Debugger creates a general-purpose working
directory called install_directory\home\owner.
3.1.2
The Code window
Starting RealView Debugger immediately after installation displays the default Code
window to provide a starting point for all debugging tasks. The Code window is your
main debugging and editing window. This is shown in Figure 3-1 on page 3-3.
3-2
Copyright © 2002 ARM Limited. All rights reserved.
ARM DUI 0181B
Getting Started with RealView Debugger
Color Box
Title bar
Toolbars
Pane Management
controls
Build controls
Processor
State
Side pane
File Editor pane
Output pane
Pane
title bar
Command line
Status
line
Cursor location field
Keyboard
status
Figure 3-1 Code window
The appearance of the Code window depends on your licenses. For example, the base
installation enables you to debug your images in single connection mode, that is where
there is only one connection. If you are working in this mode, the title bar does not show
[Unattached].
For a full description of the contents of this window, see Chapter 6 RealView Debugger
Desktop.
ARM DUI 0181B
Copyright © 2002 ARM Limited. All rights reserved.
3-3
Getting Started with RealView Debugger
3.2
Connecting to a target
The next stage in your debugging session is to connect to your debug target. The base
installation of RealView Debugger includes built-in configuration files to enable you to
make a connection without having to modify any configuration details.
This section introduces target configuration and how to make a connection:
•
Target configuration
•
Working with connections
•
Making a connection on page 3-5
•
Setting connect mode on page 3-6.
3.2.1
Target configuration
RealView Debugger uses a board file to access information about the debugging
environment and the debug targets available to you, for example how memory is
mapped. See RealView Debugger v1.6 Target Configuration Guide for details of how to
customize your targets.
You can start to use RealView Debugger with the default board file installed as part of
the base installation without making any further changes.
3.2.2
Working with connections
RealView Debugger makes a distinction between target configuration, and how a target
is accessed, that is the connection.
Select File → Connection → Connect to Target... from the main menu to display the
Connection Control window ready to make your first connection. This is shown in
Figure 3-2 on page 3-5.
3-4
Copyright © 2002 ARM Limited. All rights reserved.
ARM DUI 0181B
Getting Started with RealView Debugger
Check box to make
a connection
RDI execution vehicle
Connections
available
for this vehicle
Execution vehicles
Figure 3-2 Connection Control window
This window dynamically details all your connections during a debugging session.
Note
If you are licensed to use RealView Debugger extensions, the Connection Control
window includes tabs, not shown here. For example, in multiprocessor debugging
mode, the window includes a Connect tab and a Synch tab.
3.2.3
Making a connection
If you have ADS 1.2 or RVCT 1.2 installed the top-level entry ARM-A-RR is the execution
vehicle that supports connections to ARM RDI targets, as shown in Figure 3-2. Expand
this to show the ARMulator connection that uses the ARMulator instruction set simulator.
The default configuration files installed as part of the base installation enable you to
connect to an ARM7TDMI core using ARMulator on your local workstation. The
Connection Control window shows this default target connection.
Select the ARM7TDMI check box so that it is checked to make the connection.
With the connection established, your Code window is updated:
ARM DUI 0181B
•
the Code window title bar is updated with the name of the current connection
•
the hyperlink in the File Editor pane changes to enable you to load an image
•
the Output pane displays details of the connection
Copyright © 2002 ARM Limited. All rights reserved.
3-5
Getting Started with RealView Debugger
•
panes are updated with debug information, for example the Register pane shows
the core registers for the connected target.
Where you are always debugging code on the same target you can configure RealView
Debugger to make the same connection automatically each time it starts. See the chapter
describing connecting to targets in RealView Debugger v1.6 Target Configuration
Guide for details of how to set this option.
RDI connection details
RealView Debugger displays RDI connection details in different tabs depending on the
startup conditions and the Code windows you are using. Because this is the first time
you connected to an RDI target from the default Code window, the startup connection
details are displayed in the Log tab and the Cmd tab of the Output pane. In future
debugging sessions, this information is displayed in the Cmd tab.
3.2.4
Setting connect mode
You can control the way a target processor starts when you connect. This is particularly
useful when debugging multiprocessor debug targets and working with multiple
threads. In single processor debugging mode, you might want to leave an image
executing while RealView Debugger closes down and then restart at a later date.
If you are not connected, you can set connect mode when you make a new connection:
1.
Select File → Connection → Connect to Target... to display the Connection
Control window.
2.
Right-click on the connection entry and select Connect (Defining Mode)... from
the Connection context menu.
3.
Select the required state from the selection box.
The options listed depend on your execution vehicle.
4.
Click OK to make the connection with the processor in the required state.
If you set connect mode from the Connection Control window, this temporarily
overrides any setting in your target configuration file. See the chapter describing
connecting in RealView Debugger v1.6 Target Configuration Guide for full details on
setting connect mode for your debug target.
3-6
Copyright © 2002 ARM Limited. All rights reserved.
ARM DUI 0181B
Getting Started with RealView Debugger
3.3
Working with memory
Before you load an image, you might have to define memory settings. This depends on
the debug target you are using to run your image. For example, if you are using the
default ARMulator to simulate an ARM processor, setting the value of top of memory
is not appropriate.
Where appropriate, defining memory gives you full access to all the memory on your
debug target. RealView Debugger enables you to do this in different ways, for example
using an include file, or defining the memory map as part of your target configuration
settings. These options are described in detail in RealView Debugger v1.6 User Guide.
Note
In the example in this section, you set up memory manually for the current session.
Target memory settings defined in this way are only temporary and are lost when you
exit RealView Debugger.
This section describes how to set up memory:
•
Setting top of memory and stack values
•
Setting top of memory for a session on page 3-8.
3.3.1
Setting top of memory and stack values
The top of memory variable is used to enable the semihosting mechanism to return the
top of stack and heap. If you are not using an ARM-based target, or if your target does
not use semihosting, this is ignored.
If you do not set these values, RealView Debugger uses default settings that are
dependent on the debug target. For ARM processors the default value used for top of
memory is 0x20000.
When you first connect to an ARM-based target, RealView Debugger displays a
warning message in the Cmd tab:
Warning: No stack/heap or top of memory defined - using defaults.
You can set permanent values for top of memory, stack, and heap, using the Connection
Properties window. Configure your debug target and define these settings so that they
are used whenever you connect. See the chapter describing configuring custom targets
in RealView Debugger v1.6 Target Configuration Guide for an example of how to do
this.
ARM DUI 0181B
Copyright © 2002 ARM Limited. All rights reserved.
3-7
Getting Started with RealView Debugger
3.3.2
Setting top of memory for a session
If you are working with an appropriate debug target, you can set the value of top of
memory on a temporary basis, that is for the current session, using the @top_of_memory
register.
Note
If you are using the default ARMulator to simulate an ARM processor, this is not a
suitable target for setting top of memory in this way because top of memory is set from
an ARMulator configuration file rather than from within RealView Debugger.
To set the value of top of memory for an ARM Integrator/AP board and ARM940T core,
using Multi-ICE:
1.
Select Debug → Memory/Register Operations → Set Register... to display the
Interactive Register Setting dialog box.
2.
Specify the register to be changed, @top_of_memory, and enter the required value,
for example 0x40000, as shown in Figure 3-3.
Figure 3-3 Setting top of memory for session
3.
Click Set to update the register contents. The Log display is updated to record the
change.
4.
Click Close to close the dialog box.
The Debug tab, in the Register pane, displays the updated value, as shown in the
example in Figure 3-4 on page 3-9.
3-8
Copyright © 2002 ARM Limited. All rights reserved.
ARM DUI 0181B
Getting Started with RealView Debugger
Figure 3-4 Changed settings in the Register pane
The value of top of memory might be displayed in dark blue to show that it has changed
since the last update.
If you set this value too low, loading an image to your target might generate a warning
message in the Cmd tab:
Warning: No room for heap - could cause unpredictable behavior.
For full details on setting top of memory for an ARM-based target, see the chapter
describing memory mapping in RealView Debugger v1.6 User Guide.
ARM DUI 0181B
Copyright © 2002 ARM Limited. All rights reserved.
3-9
Getting Started with RealView Debugger
3.4
Loading an image
When you have connected to a suitably configured debug target you are ready to load
your image for debugging:
•
Loading an image
•
What is shown in the title bar? on page 3-12
•
Reloading an image on page 3-12
•
Unloading an image on page 3-13.
3.4.1
Loading an image
In this example, you load the image dhrystone.axf installed as part of the base
installation. By default this is located in the ARM examples directory in
install_directory\examples\demo_ARM\dhrystone\Debug.
Select File → Load Image... to load your image. This displays the Load File to Target
dialog box where you can locate the required image and specify the way in which it is
loaded.
Note
Do not change any default settings in the Load File to Target dialog box.
Your Code window looks like Figure 3-5 on page 3-11.
3-10
Copyright © 2002 ARM Limited. All rights reserved.
ARM DUI 0181B
Getting Started with RealView Debugger
Figure 3-5 Code window with an image loaded
In this Code window Text Coloring is enabled by default and line numbering is turned
on by selecting Edit → Editing Controls → Show Line Numbers.
When you load an image, the debugger:
ARM DUI 0181B
•
inserts the source filename, for the current context, in the File field at the top of
the File Editor pane
•
highlights the location of the Program Counter (PC) at the entry point with a red
box
•
moves the text insertion point to the current location of the PC
•
updates the Code window panes as appropriate
•
updates the Code window title bar to show the name of the project associated with
the image
•
displays the load line in the Cmd tab in the Output pane.
Copyright © 2002 ARM Limited. All rights reserved.
3-11
Getting Started with RealView Debugger
3.4.2
What is shown in the title bar?
The Code window title bar gives details of the connection and any processes running on
your debug target. If you connect to a target and load an image, your title bar looks like
the one shown in Figure 3-6.
Figure 3-6 Code window title bar
In addition to the application icon, you can see (from left to right):
RVDEBUG Identifies the Code window. This changes to identify each new Code
window that you open, for example RVDEBUG_1, or RVDEBUG_2.
(dhrystone) The project associated with the loaded image.
@ARM...
The connection, including the target processor, the connection number,
and the execution vehicle.
[Unattached]
If you are working in multiprocessor debugging mode, this shows the
attachment of the window to a specified connection. A Code window is
unattached by default, shown by [Unattached].
If you float a pane, the pane title bar reflects the title bar of the calling Code window.
Note
The contents of your title bar might be different from the one shown in Figure 3-6
depending on your licenses, the current connection (if any), open projects and windows
attachment. For a full description of the contents, see Chapter 6 RealView Debugger
Desktop.
3.4.3
Reloading an image
During your debugging session you might have to amend your source code and then
recompile. Select File → Reload Image to Target from the Code window to reload an
image following these changes.
Reloading an image refreshes any window displays and updates debugger resources.
3-12
Copyright © 2002 ARM Limited. All rights reserved.
ARM DUI 0181B
Getting Started with RealView Debugger
3.4.4
Unloading an image
You do not have to unload an image from a debug target before loading a new image for
execution. Display the Load File to Target dialog box and ensure that the Replace
Existing File(s) check box is selected ready to load the next image.
However, you might want to unload an image explicitly as part of your debugging
session, for example if you correct coding errors and then rebuild outside RealView
Debugger. You can do this using the Process Control pane:
1.
Select View → Pane Views → Process Control Pane from the default Code
window main menu.
2.
Right-click on the Image entry, for example dhrystone.axf, or on the Load entry,
Image+Symbols, to display the Image context menu.
3.
Select Unload.
You can also unload an image by clicking on the check box associated with the Load
entry so that it is unselected.
Unloading an image does not affect target memory. It unloads the symbols and removes
most of the image details from RealView Debugger. However, the image name is
retained.
Note
To remove image details completely, right-click on the Image entry in the Process
Control pane and select Delete Entry.
ARM DUI 0181B
Copyright © 2002 ARM Limited. All rights reserved.
3-13
Getting Started with RealView Debugger
3.5
Debugging an image
Chapter 4 Quick-start Tutorial provides details on using the features of RealView
Debugger with your images. This section summarizes how to start debugging with
RealView Debugger:
•
Getting started
•
Code views on page 3-15
•
Viewing target status on page 3-15.
3.5.1
Getting started
You can start debugging your image when you have completed the following steps:
1.
Start RealView Debugger, see Starting RealView Debugger on page 3-2.
2.
Connect to your target, see Making a connection on page 3-5.
3.
Set top of memory, if appropriate, see Setting top of memory for a session on
page 3-8.
4.
Load your image, see Loading an image on page 3-10.
To start your debugging session:
1.
Select Edit → Editing Controls → Show Line Numbers to display line
numbers.
This is not necessary but might help you to follow the examples.
2.
Right-click in the first entry in the Memory pane, <NoAddr>, and select Set New
Start Address... from the context menu.
3.
Enter a value as the start address for the area of interest, for example 0x8008.
4.
Click Set to confirm the setting and close the dialog box.
5.
Click on the Src tab in the File Editor pane.
6.
Set a simple, unconditional breakpoint at line 149 in dhry_1.c, Proc_5();, by
double-clicking on the line number.
If the line number is not visible, then double-click inside the gray area at the left
of the required statement in the File Editor pane to set the breakpoint.
7.
3-14
Set a watch by right-clicking on the variable Int_1_Loc at line 152 in dhry_1.c so
that it is underlined in red. Select Watch from the context menu.
Copyright © 2002 ARM Limited. All rights reserved.
ARM DUI 0181B
Getting Started with RealView Debugger
8.
3.5.2
To start execution either:
•
Select Debug → Execution Control → Go (Start Execution) from the
main menu.
•
Click the Go button on the Actions toolbar.
9.
Enter the required number of runs, for example 50000.
10.
Monitor execution until the breakpoint is reached.
11.
Click Go again and monitor the programas execution continues.
Code views
Use the File Editor pane to view source code during your debugging session. In the
example shown in Figure 3-5 on page 3-11, the File Editor pane contains three tabs:
•
the Dsm tab enables you to track program execution in the disassembly-level
view
•
the Src tab enables you to track program execution in the source-level view
•
the file tab dhry_1.c shows the name of the current source file in the editing, or
non-execution, view.
Click on the relevant tab to toggle between the different code views.
3.5.3
Viewing target status
The State group, on the Actions toolbar, shown in Figure 3-5 on page 3-11, enables you
to see the current state of your debug target:
ARM DUI 0181B
Unknown
Shows that the current state of the target is unknown to the debugger. For
example it might have been running when the connection was established
or it might be disconnected.
Stopped
Shows that the target is connected but any image loaded is not executing.
Running
Shows that an image is executing. In this case, a running progress
indicator is also included.
Copyright © 2002 ARM Limited. All rights reserved.
3-15
Getting Started with RealView Debugger
3-16
Copyright © 2002 ARM Limited. All rights reserved.
ARM DUI 0181B
Chapter 4
Quick-start Tutorial
This chapter provides a step-by-step tutorial using RealView Debugger to debug your
images. All the tasks introduced in this chapter, and the RealView Debugger options
used, are described in full in RealView Debugger v1.6 User Guide.
This tutorial contains the following sections:
•
How to use the tutorial on page 4-2
•
Setting up your first project on page 4-3
•
Debugging with RealView Debugger on page 4-13
•
Working with custom panes on page 4-27
•
More about projects on page 4-29
•
Completing the tutorial on page 4-35.
ARM DUI 0181B
Copyright © 2002 ARM Limited. All rights reserved.
4-1
Quick-start Tutorial
4.1
How to use the tutorial
The tutorial starts by setting up a user-defined project to build an image for debugging.
A user-defined project in RealView Debugger is not required for debugging, but it can
provide a powerful aid to development. A project enables RealView Debugger to save
your list of files, understand your build model, and maintain a record of your
project-level preferences. In this tutorial, you build source files installed as part of the
base installation and then debug the executable.
If you do not set up your own project, you can follow the tutorial using the supplied
project, named dhrystone.prj, installed in the ARM examples directory. This sample
project comes with a ready-built image, named dhrystone.axf, installed in the directory
install_directory\examples\demo_ARM\dhrystone\Debug.
4.1.1
Getting started
Begin by making a copy of the source files provided so that the tutorial is self-contained
and the installed example files are untouched:
1.
Create a new directory called install_directory\Tutorial. This is the tutorial
project base directory.
2.
Copy the required files, dhry.h, dhry_1.c, and dhry_2.c, from the examples
directory, that is install_directory\examples\demo_ARM\dhrystone, into the new
tutorial directory.
Start your session so that you can follow the tutorial:
1.
Start RealView Debugger, as described in Starting RealView Debugger on
page 3-2.
2.
Connect to the ARM7TDMI core processor using ARMulator, as described in Making
a connection on page 3-5.
You can complete the tutorial using the default files provided in the base installation. It
is not necessary to change any of these files or to amend any configuration files.
4-2
Copyright © 2002 ARM Limited. All rights reserved.
ARM DUI 0181B
Quick-start Tutorial
4.2
Setting up your first project
RealView Debugger enables you to set up different types of user-defined projects:
•
Standard project, including Compile/Assemble/Link
•
Library project, including Compile/Assemble/Add to library
•
Custom project, using your makefile or defining a no-build project to hold only
image and properties
•
Container project, composed of existing projects
•
Copy, created by copying existing projects.
When you create a new project, you can also merge a saved auto-project to create a
user-defined project.
For full details on creating different types of project, merging project settings, and
accessing the project management features of RealView Debugger, see the chapter
describing managing projects in RealView Debugger v1.6 User Guide.
This section takes you through the basic steps to set up a Standard user-defined project
based on a set of example source files in the base installation. Follow this section to
specify the default behavior for your C, C++, or assembly language programs, and build
an image. This section describes:
•
Defining your build tools on page 4-4
•
Creating a new project on page 4-5
•
Defining a Standard Project on page 4-5
•
Viewing the project settings on page 4-7
•
Setting up compiler options on page 4-7
•
Project base directory on page 4-9
•
Building the application on page 4-9
•
Project files on page 4-10
•
Closing the project on page 4-11.
Note
This section introduces the Build-Tool Properties window and the Project Properties
window to set up your first development project. There are full descriptions of the
general layout and controls of these Settings windows in the RealView Debugger online
help topic Changing Settings.
ARM DUI 0181B
Copyright © 2002 ARM Limited. All rights reserved.
4-3
Quick-start Tutorial
4.2.1
Defining your build tools
RealView Debugger provides support for multiple toolchains. The debugger can locate
your build tools automatically based on your environment variables or Registry entries.
You can use the default build tools in every project you create or to build source files
outside a project. However, you can override these settings for specific projects if
required.
To see the default toolchain:
1.
Select Project → Build-Tool Properties... from the Code window main menu.
This displays the Build-Tool Properties window shown in Figure 4-1.
Figure 4-1 Build-Tool Properties for a Typical installation
This shows a Typical installation where the ADS 1.2 toolchain is installed. If you
have installed a Custom configuration your window looks different.
When you are working with the Build-Tool Properties window, click on an entry
in the left or right pane to see a one-line text explanation in the Description field
at the top of the window. Right-click on an entry and select Detailed
Description... to see extended online help.
2.
Select File → Close window to close the Build-Tool Properties window.
The first time you open the Build-Tool Properties window, RealView Debugger copies
the file install_directory\etc\genmake.loc into your home directory ready for building
operations during your debugging sessions. This is updated each time you amend your
Build-Tool Properties window settings. You are warned before changes are saved in this
file, but you can restore all entries to the installation defaults if required.
This is all that is required to start your first project.
4-4
Copyright © 2002 ARM Limited. All rights reserved.
ARM DUI 0181B
Quick-start Tutorial
Note
For details on how to change your build tools see Changing build tools on page 4-29.
4.2.2
Creating a new project
To set up the new project:
1.
Select Project → New Project... from the default Code window main menu.
This displays the Create New Project dialog box. The Project Base field might be
prefilled with your RealView Debugger installation directory name as defined by
your environment variable. You can override this.
2.
Enter the project details as shown in Figure 4-2.
1. Enter project name
2. Click the folder icon and choose <Select Dir>
to locate the project base directory
3. Select
Standard Project
4. Click OK
Figure 4-2 Creating a new project
RealView Debugger confirms that the specified project base directory exists. If the
directory does not exist, you are given the option to create the directory ready for your
project files.
4.2.3
Defining a Standard Project
When you close the Create New Project dialog box, RealView Debugger displays the
Create Standard Project dialog box where you specify the:
•
processor family and toolchain you are using
•
source files to include in the build process
ARM DUI 0181B
Copyright © 2002 ARM Limited. All rights reserved.
4-5
Quick-start Tutorial
•
image name.
To define the project:
1.
Click on the down arrow to specify the Processor Type that you are using to run
your images and the toolchain. In this example, that is ARM-ADS.
2.
Click the folder icon to open the project base directory, defined previously, and
specify the source files to use in the build process. This displays the Select source
files for Project dialog box where you can highlight one or more files. Use the
Shift or Ctrl keys to select the files dhry_1.c and dhry_2.c.
3.
Click Open and add the required source files to your project.
The Create Standard Project dialog box looks like Figure 4-3.
Figure 4-3 Create Standard Project dialog box
The Executable field contains the image name, that is tutorial.axf. Do not
change this so that you can follow the rest of the tutorial.
You do not have to change the project Description field.
4.
Click OK to confirm your entries and close the Create Standard Project dialog
box.
Closing the dialog box creates the project settings file in the project base directory and
opens the project into the debugger, shown in the Code window title bar.
4-6
Copyright © 2002 ARM Limited. All rights reserved.
ARM DUI 0181B
Quick-start Tutorial
4.2.4
Viewing the project settings
When you close the Create Standard Project dialog box, RealView Debugger displays
the Project Properties window, shown in Figure 4-4.
Figure 4-4 Project Properties window
The Project Properties window enables you to view project settings as defined in the
project file. Click on the entry ...\tutorial.prj at the top of the list of entries in the left
pane of the window. This displays the full path of the project settings file in the
Description field at the top of the window. In this new standard project this is identified
as install_directory\Tutorial\tutorial.prj.
Most entries in the Project Properties window are filled automatically from the Create
Standard Project dialog box. You do not have to change any entries. Select File → Close
Window from the menu to close the Project Properties window.
When you examine your project settings and then close the Project Properties window,
RealView Debugger regenerates the makefiles. The Build tab in the Output pane
displays information about the generation process. You must wait for this to complete
before making the next change. See Generated makefiles on page 4-32 for more details.
4.2.5
Setting up compiler options
For this tutorial, you must specify a preprocessor macro that is included as part of the
build model. You have to set the -D compiler switch to specify how the compiler
processes #if directives. You must set this to MSC_CLOCK to specify the C function library
to control how timing measurements are made.
ARM DUI 0181B
Copyright © 2002 ARM Limited. All rights reserved.
4-7
Quick-start Tutorial
To do this you must change a project setting:
1.
Select Project → Project Properties... from the default Code window main
menu to display the Project Properties window.
2.
Click on *COMPILE=arm in the left pane to see the contents.
3.
Double-click on Preprocessor in the right pane to see the contents.
4.
Right-click on Define in the right pane and select Edit Value from the context
menu.
5.
Type MSC_CLOCK and press Enter.
An asterisk is placed at the front of the setting to show that it has changed from
the default.
6.
Select File → Save and Close from the menu to close the Project Properties
window.
RealView Debugger regenerates the makefiles, as shown in the Build tab in the Output
pane. You must wait for this to complete before making more changes.
Customizing your project
You can also make other changes to the project to specify the build model, for example
to suppress compiler warning messages. To do this you must change a project setting:
1.
Select Project → Project Properties... from the default Code window main
menu to display the Project Properties window.
2.
Click on *COMPILE=arm in the left pane to see the contents.
3.
Double-click on Messages in the right pane to see the contents.
4.
Double-click on Warning in the right pane to see the contents.
5.
Right-click on Suppress_warnings in the right pane and select enabled from the
context menu.
6.
Select File → Save and Close from the menu to close the Project Properties
window.
RealView Debugger regenerates the makefiles, as shown in the Build tab in the Output
pane. You must wait for this to complete before making more changes.
4-8
Copyright © 2002 ARM Limited. All rights reserved.
ARM DUI 0181B
Quick-start Tutorial
4.2.6
Project base directory
When the new project setup is complete, your project base directory is updated with the
files required to manage your new project. These are the:
•
project file tutorial.prj
•
build target configuration directories Debug, Release, and DebugRel
•
generated makefiles for each build target configuration, for example
tutorial_Debug.mk.
Note
The project source files do not have to be in the project base directory, although this is
recommended for single-user, self-contained projects.
4.2.7
Building the application
If you have the ARM C compiler installed on your workstation, you can now build the
application defined by the example project tutorial.prj. If you do not have the
compiler installed, you can follow the steps to complete the tutorial but you cannot build
an executable.
To build the executable for the example project:
1.
Select Tools → Build... from the default Code window main menu.
2.
If you have made any changes to the Project Properties, or to the Build-Tool
Properties, you are prompted to rebuild all project files.
Click Yes to confirm the rebuild.
The build, or rebuild, completes and RealView Debugger displays the Build tab, in the
Output pane, to report successful completion. The Build tab also displays any errors or
warnings generated during the build.
ARM DUI 0181B
Copyright © 2002 ARM Limited. All rights reserved.
4-9
Quick-start Tutorial
4.2.8
Project files
The project you have just created is a single-user, self-contained project. This means
that the project base directory now contains all the files associated with the tutorial
project, as described in Table 4-1.
Table 4-1 Tutorial project files
Project
contains
Directory/filename
Description
Debug
directory
Debug
This area contains the object files and the
executable ready for debugging or execution.
By default, Debug is specified as the active
configuration for this project. This means that
this is the build target configuration that is built
and loaded. Change this using the Project
Properties window to view, and amend, the
CONFIGURATION group, shown in Figure 4-4 on
page 4-7.
DebugRel
directory
DebugRel
This area is empty.
Release
directory
Release
This area is empty.
Source files
dhry_1.c
The original source files and headers for the
project. If any files have been edited, this area
also includes the backup files (see Backup files
on page 4-11).
dhry_2.c
dhry.h
Project file
tutorial.prj
The project settings file, using the project name
specified when the project was created. This is
identified as the first entry in the project settings,
shown in Figure 4-4 on page 4-7.
If the project settings have been edited, this area
also includes the backup file (see Backup files on
page 4-11).
makefiles
tutorial_Debug.mk
The makefiles generated by RealView Debugger
for each build target configuration (see
Generated makefiles on page 4-32).
The filenames and the rules can be changed in
the project settings using the Project Properties
window to view, and amend, the BUILD group,
shown in Figure 4-4 on page 4-7.
tutorial_DebugRel.mk
tutorial_Release.mk
4-10
Copyright © 2002 ARM Limited. All rights reserved.
ARM DUI 0181B
Quick-start Tutorial
Executable files
By default, the executable image created in this project is saved in
install_directory\Tutorial\Debug\tutorial.axf. You can copy this file to another
location or share it with others in your development team. You can load the image to a
target processor without opening the project first. However, where you have created a
user-defined project, it is recommended that you open the project first to load and debug
the associated image. Opening the project enables you to access the project properties,
save new settings, or make changes to the build model.
Backup files
If you make any changes to the project during your current session, a backup file is
automatically created to enable you to recover from any accidental editing or to restore
previous settings. Similarly, changing a source file in the File Editor pane also creates a
backup file for safety. These files are given the .bak extension by default, for example
dhry_1.c.bak, and tutorial.prj.bak, and are located in the project base directory.
4.2.9
Closing the project
The default Code window title bar shows the name of your new project:
RVDEBUG(tutorial) = @ARM7TDMI_0:ARM-A-RR [Unattached]
The project is automatically associated with the connection. This is called project
binding. The project name, tutorial, is enclosed in round brackets to show that it is
bound to the connection.
Note
If several projects are open, the title bar shows the name of the active project. See the
chapter describing managing projects in RealView Debugger v1.6 User Guide for
details on controlling projects.
You can keep projects open while you are debugging. This might be useful to add new
files to the project or if source files change. It is not necessary to keep the project open
to debug the executable you just created.
To close the project, select Project → Close Project... from the Code window main
menu. Because there is only one open project, it closes immediately.
ARM DUI 0181B
Copyright © 2002 ARM Limited. All rights reserved.
4-11
Quick-start Tutorial
Note
If you have loaded the image created by your project, RealView Debugger gives you the
option to unload the image. Unload the image associated with the project to avoid the
creation of an auto-project (see Working with images on page 4-16 for more details).
The Code window title bar shows that the project is no longer open.
Any files displayed in the File Editor pane remain after the parent project closes. To
close the file shown on the top tab, either:
•
select File → Close from the Code window main menu
•
right-click on the file tab and select Close from the context menu.
If any file has been edited, you are warned and given the option to save the file before
it closes. A backup copy of the previous version is saved by default, unless you have
changed this in your workspace.
If you have several files displayed in the File Editor pane, the next tab is brought to the
top and you can then close this one in the same way.
In the next part of the tutorial you use the debugging features of RealView Debugger to
load an executable image and monitor execution. It is not necessary to exit RealView
Debugger at this stage.
4-12
Copyright © 2002 ARM Limited. All rights reserved.
ARM DUI 0181B
Quick-start Tutorial
4.3
Debugging with RealView Debugger
This section gives you step-by-step instructions to carry out some basic debugging
tasks. These examples use the sample project dhrystone.prj, supplied as part of the
RealView Debugger base installation. If you prefer, you can use the executable built in
Setting up your first project on page 4-3 and saved in the tutorial project, tutorial.prj.
If you are not licensed to use RealView Debugger extensions, your Code window might
look different to the one shown in the rest of this tutorial. This does not affect the
tutorial.
This section contains the following subsections:
•
Getting started
•
Basic debugging tasks on page 4-14
•
Using breakpoints on page 4-22.
4.3.1
Getting started
Complete these steps so that you can follow the rest of the tutorial:
1.
Start RealView Debugger, as described in Starting RealView Debugger on
page 3-2.
2.
Connect to the ARM7TDMI core processor using ARMulator, as described in Making
a connection on page 3-5.
3.
Select Project → Open Project... to open the required project, for example
install_directory\examples\demo_ARM\dhrystone\dhrystone.prj.
4.
Click on the hyperlink in the File Editor pane to load the associated image, for
example install_directory\examples\demo_ARM\dhrystone\Debug\dhrystone.axf.
This location has been derived automatically from the project information.
The default Code window title bar shows the name of your open project:
RVDEBUG(dhrystone) = @ARM7TDMI_0:ARM-A-RR [Unattached]
Note
If you are using the supplied source files, RealView Debugger might warn that the
source is more recent than the executable. This message can be ignored.
ARM DUI 0181B
Copyright © 2002 ARM Limited. All rights reserved.
4-13
Quick-start Tutorial
4.3.2
Basic debugging tasks
In your debugging session RealView Debugger enables you to examine registers,
memory contents, and variables:
•
Displaying register contents
•
Changing register contents on page 4-15
•
Process control on page 4-16
•
Displaying memory contents on page 4-17
•
Displaying variables on page 4-19
•
Tooltip evaluation on page 4-19
•
Using the call stack on page 4-20
•
Using browsers and lists on page 4-21
•
Setting watches on page 4-21.
Displaying register contents
To display register contents for the loaded image:
1.
Select View → Pane Views → Registers from the default Code window to
display the Register pane. It looks like the example in Figure 4-5.
Pane Menu,
click here to work with pane data
Pane Content menu,
click here to change the pane view
Select a tab to view target details
Figure 4-5 Register pane
4-14
Copyright © 2002 ARM Limited. All rights reserved.
ARM DUI 0181B
Quick-start Tutorial
The Register pane displays tabs appropriate to the target processor running your
image and the target vehicle used to make the connection. For the ARM7TDMI core
using ARMulator, the pane includes the Core tab, showing the base registers for
the connected target processor, and the Debug tab, showing internal debugger
variables. For full details on the contents of this tab see the chapter describing
monitoring execution in RealView Debugger v1.6 User Guide.
2.
Click the Pane menu and select Show Enumerations as Values from the
available options. This displays the register contents as values rather than
enumerated strings. The Register pane is refreshed.
3.
Click the Pane menu and unselect Show Enumerations as Values.
Changing register contents
To change the contents of registers:
1.
Click on the Core tab in the Register pane.
2.
Right-click in the Mode field of the Current Program Status Register (CPSR)
register (SVC) to display the context menu shown in Figure 4-6.
Figure 4-6 Changing register contents
ARM DUI 0181B
3.
Select Set Enumeration.... This opens a selection box where you can specify the
context-sensitive value to modify the selected register entry.
4.
Select FIQ from the list of available options and click OK to change the Mode
field of the CPSR from SVC (0013) to FIQ (0011). This updates the contents of the
ARM banked registers, R8 to R14, shown in the pane. Similarly, if you are in SVC
mode and you change the contents of R13 in the SVC bank (SP), the contents of R13
(SP) change to match.
Copyright © 2002 ARM Limited. All rights reserved.
4-15
Quick-start Tutorial
In this example, the value can also be changed by selecting FIQ from the list of
values from the context menu shown in Figure 4-6 on page 4-15.
Process control
To display the Process Control pane:
1.
Select View → Pane Views → Process Control Pane from the default Code
window. It looks like the example in Figure 4-7.
Figure 4-7 Process Control pane
The Process tab shows details about your current process. If you are debugging a
single process application, this is the same as viewing the processor details. In this
example, you can identify the target processor and see details about your project
and the loaded image.
2.
Right-click on an entry in this pane, for example dhrystone.axf, and select
Properties from the context menu. This displays a text box giving more
information on the chosen item.
Working with images
Where you have created a user-defined project, it is recommended that you open this
first to load and debug the associated image, or images. This enables you to access the
project properties, save new settings, or make changes to the build model. In this
example, the user-defined project is open so project settings have been used to populate
entries in the Process tab.
When an image is loaded directly to a debug target, RealView Debugger checks to see
if an auto-project exists for that image in the same location. Where no auto-project
exists, RealView Debugger creates an in-memory project to use in the current session.
4-16
Copyright © 2002 ARM Limited. All rights reserved.
ARM DUI 0181B
Quick-start Tutorial
An auto-project is a custom, image control, project that holds project settings where the
build model is unknown. You can view these settings using the Project Properties
window. Using an auto-project enables you to amend and save image load parameters
where you do not have a user-defined project or where you have no control over the
build model. You also have the option to use the saved auto-project as the basis of a
user-defined project.
Note
If you load an image built as part of a user-defined project without opening the project
you cannot access all the project properties because these are unknown to RealView
Debugger. In this case, RealView Debugger creates an in-memory project, or uses the
saved auto-project file.
See the chapter on working with images in RealView Debugger v1.6 User Guide for
details on using auto-projects in RealView Debugger.
Displaying memory contents
To display an area of memory:
1.
Select View → Pane Views → Memory from the default Code window to
display the Memory pane.
2.
Right-click on an entry <NoAddr> to display the context menu shown in Figure 4-8.
Figure 4-8 Memory address menu
ARM DUI 0181B
3.
Select Set New Start Address... to display the address prompt box.
4.
Enter 0x8000 as the new start address and click Set to confirm your choice and
close the prompt.
5.
Click on the Memory pane Pane menu and select Show ASCII to display the
updated memory contents, shown in Figure 4-9 on page 4-18.
Copyright © 2002 ARM Limited. All rights reserved.
4-17
Quick-start Tutorial
Figure 4-9 Updated memory contents
Click on the Pane menu again and select Set Number of Columns to show... to
choose how many columns are used in the memory display, for example 12. If you
do not specify the number used (or specify zero), RealView Debugger displays as
many columns as it can fit into the pane.
6.
Click the Go button on the Actions toolbar to execute the image. Enter a large
number of runs, for example 50000.
7.
Click Stop Execution to stop the program before it finishes and view the updated
memory contents, shown in dark blue in the Memory pane.
At the next update, memory contents might be colored light blue. This shows that
they changed at the previous update. Seeing the update depends on the memory
contents that you can see and where execution stops.
8.
Click on the file tab for the source file dhry_1.c and locate scanf at line 124.
9.
Double-click on scanf so that it is highlighted and then drag it to the Memory
pane where you can drop it into the display. This is a quick way to display a
chosen location in the Memory pane,
Use the Pane menu, or right-click in an address entry in the Memory pane, to
select the display format and modify the address range of the memory area that
you want to see.
You can change memory contents displayed in the Memory pane using in-place editing.
4-18
Copyright © 2002 ARM Limited. All rights reserved.
ARM DUI 0181B
Quick-start Tutorial
Displaying variables
To display the value of a variable from your source code:
1.
Select File → Reload Image to Target to reload the image.
2.
Click the Go button on the toolbar to execute the image for a number of runs, for
example 5000.
3.
Select the required variable in the current context, for example click on the file
tab for the source file dhry_1.c and move to line 301. Highlight the variable
Ptr_Glob in the expression:
structassign (*Ptr_Val_Par->Ptr_Comp, *Ptr_Glob);
4.
Right-click to display the Source Variable Name menu, shown in Figure 4-10.
Figure 4-10 Source Variable Name menu
5.
Select Print to view the value of the chosen variable in the current context. This
is displayed in the Cmd tab of the Output pane.
6.
Select View Memory At Value to display the memory view at this location.
Tooltip evaluation
Use Tooltip Evaluation to see hover-style evaluation when you hold your mouse
pointer, for two seconds, over a variable in the Src tab, or a register in the Dsm tab.
This option is enabled by default. Select Edit → Editing Controls → Tooltip
Evaluation to disable this for the current Code window.
ARM DUI 0181B
Copyright © 2002 ARM Limited. All rights reserved.
4-19
Quick-start Tutorial
Using the call stack
The Call Stack pane enables you to follow the flow of your program by examining the
current status of functions and variables. This pane shows you the path that leads from
the main entry point to the currently executing function.
To monitor your execution path:
1.
Select View → Pane Views → Call Stack from the default Code window to
display the Call Stack pane.
2.
Select File → Reload Image to Target to reload the image.
3.
Click the Go button on the Actions toolbar to execute the image. Enter a large
number of runs, for example 50000.
4.
Click Stop Execution to stop the program before it finishes.
The Call Stack tab, in the Call Stack pane, displays details of the functions
currently on the stack and awaiting execution.
5.
Right-click on an entry in the Call Stack pane, to see the Function context menu.
This menu enables you to carry out operations on the chosen function in the stack,
for example to scope to that function.
6.
Click on the Locals tab in the Call Stack pane. This displays a list of the variables
that are local to the current function, shown in the example in Figure 4-11.
Figure 4-11 Local variables in the Call Stack pane
If a variable is a structure or an array, a plus sign is added to the entry in the Call
Stack pane. You can click on this to expand the variable to see all elements of the
structure or array.
4-20
7.
Right-click on an entry in the Locals tab, to see the Variables context menu.
8.
Click on the Statics tab, to see non-local variables, that is module statics.
Copyright © 2002 ARM Limited. All rights reserved.
ARM DUI 0181B
Quick-start Tutorial
Using browsers and lists
RealView Debugger provides lists browsers and lists to help with debugging tasks.
These enable you to search through your source files to look for specific structures and
to monitor their status during program execution. Browsers are available for:
•
project modules and files
•
functions
•
variables
•
C++ classes.
To access the browsers:
1.
Select Find from the default Code window main menu to display the Find menu.
The list of available lists is at the bottom of the menu.
2.
Select Function List... to display the Function List.
3.
Highlight the required function in the list.
4.
Use the controls in the dialog box to:
•
view details about the function
•
perform actions, for example scoping to the function or setting a breakpoint
•
display the source-level view or the disassembly-level view.
5.
Click Close to close the Function List.
See the chapter describing working with browsers in RealView Debugger v1.6 User
Guide for full details on using browsers and lists.
Setting watches
Watches monitor variables during execution of your image.
To set a series of watches and to monitor their value during execution of the image:
ARM DUI 0181B
1.
Select File → Reload Image to Target to reload the image.
2.
Click the Go button on the Actions toolbar to execute the image. Enter a large
number of runs, for example 50000.
3.
Click Stop Execution to stop the program before it finishes.
4.
Select View → Pane Views → Watch from the default Code window to display
the Watch pane.
5.
Highlight the required variable in the current context.
Copyright © 2002 ARM Limited. All rights reserved.
4-21
Quick-start Tutorial
6.
Right-click to display the Source Variable Name menu, shown in Figure 4-10 on
page 4-19.
7.
Select Watch from the menu. This adds the chosen variable to the Watch pane and
displays the current value, if known.
8.
Click the Go button on the toolbar to execute the image.
9.
Click the Stop Execution button to stop the program before it finishes.
With the processor halted, monitor changes in the variables in the Watch pane.
Depending on where you halted execution, values that changed at the last pane
update are displayed in dark blue. Values that changed at a previous pane update
are displayed in light blue.
You can remove variables from the Watch pane. Highlight the entry and press
Delete. The values list is refreshed after the entry has been removed.
4.3.3
Using breakpoints
Breakpoints are specified locations where execution should stop. The breakpoint is
triggered either by:
•
execution reaching the specified address
•
data values at the specified location, in the current context, changing or becoming
equal to a particular value.
Breakpoints let you suspend program execution when the program accesses specific
memory locations, variables, or functions. You can define conditions that are tested or
qualify the breakpoint to define when execution stops. This section describes:
•
Breakpoint types
•
Actions and qualifiers on page 4-23
•
Managing breakpoints on page 4-25.
Breakpoint types
RealView Debugger enables you to use different types of breakpoint when you are
debugging your image. Breakpoint types are dependent on the hardware support
provided by your debug target:
Simple
These breakpoints enable you to test address-specific data values. These
breakpoints can be either hardware or software breakpoints.
Simple breakpoints are supported by all ARM processors.
4-22
Copyright © 2002 ARM Limited. All rights reserved.
ARM DUI 0181B
Quick-start Tutorial
Complex
These breakpoints use advanced hardware support on your target
processor, or as implemented by your simulator software.
Check your hardware characteristics, and your vendor-supplied
documentation, to determine the level of support for complex
breakpoints.
RealView Debugger provides the Set Address/Data Break/Tracepoint dialog box that
enables you to specify your breakpoint details and to define how execution continues
after the breakpoint triggers. This is described in full in the chapter describing working
with breakpoints in RealView Debugger v1.6 User Guide.
Viewing your hardware characteristics
To see your hardware support for complex breakpoints select Debug → Complex
Breakpoints → Show Break Capabilities of HW... from the default Code window
main menu. This displays an information box describing the support available for your
target processor.
Note
If you are using the default ARMulator to simulate an ARM processor, this does not
support the use of complex breakpoints.
Actions and qualifiers
Breakpoints are also classified depending on the action taken by RealView Debugger to
trigger the breakpoint:
Unconditional
The program stops if execution reaches the specified location.
Conditional The program stops if execution reaches the specified location and one or
more predefined conditions are met. The conditions that must be satisfied
can be defined based on data values or on counters.
Setting conditional breakpoints
Use the Set Address/Data Break/Tracepoint dialog box to set a simple, conditional
breakpoint:
ARM DUI 0181B
1.
Select File → Reload Image to Target to reload the image.
2.
Select File → Open... and open the source file dhry_2.c so that it is displayed in
the File Editor pane.
3.
Scroll through the source file dhry_2.c and locate the line:
Copyright © 2002 ARM Limited. All rights reserved.
4-23
Quick-start Tutorial
81 }/* Proc_7 */
4.
Right-click on the line number and select Set Break... from the context menu to
display the Set Address/Data Break/Tracepoint dialog box shown in Figure 4-12.
If the line number is not visible, then right-click inside the gray area at the left of
the required statement or on the line of code to display the context menu.
Figure 4-12 Set Address/Data Break/Tracepoint dialog box
Because you are using ARMulator to simulate an ARM7TDMI processor, the
breakpoint types available are limited. A software instruction breakpoint is
highlighted and the Location field is prefilled.
Depending on the Break/Tracepoint Type you select, the Location or the Value
Match field might be unavailable. In this case, the field is grayed out.
5.
Click New to specify the Qualifiers or conditions for the new breakpoint. This
displays the New Qualifiers menu.
6.
Select When Expression True... from the menu.
7.
Enter the condition Int_Glob==5 in the prompt.
8.
Click Set to confirm the entry and close the prompt box.
The breakpoint condition is shown in the Qualifiers group display.
4-24
Copyright © 2002 ARM Limited. All rights reserved.
ARM DUI 0181B
Quick-start Tutorial
9.
Click OK to close the Set Address/Data Break/Tracepoint dialog box. The code
view is updated and a yellow disc appears to show that a conditional breakpoint
has been set. The Cmd tab, in the Output pane, shows the RealView Debugger
command used to set the breakpoint.
10.
Click the Go button on the toolbar to execute the image. When the breakpoint is
reached, execution stops and RealView Debugger displays a message in the Cmd
tab of the Output pane to identify the point in the source code where the program
stopped.
11.
Click Go again to complete execution.
If you try to set a breakpoint on a non-executable line, RealView Debugger looks for the
first executable line immediately following and places the breakpoint there. If the lines
preceding the breakpointed instruction are comments, declarations, or other
non-executable code, they are marked with black, downward pointing arrows. Lines
marked in this way are regarded as part of the breakpoint. You cannot place two
unconditional breakpoints on the same line, or on lines marked by the downward
pointing arrows.
Managing breakpoints
To display the current breakpoint details:
1.
Select View → Pane Views → Break/Tracepoints Pane from the default Code
window to display the Break/Tracepoints pane, shown in Figure 4-13.
Figure 4-13 Break/Tracepoints pane
This shows the conditional breakpoint you set previously, the address, and the
RealView Debugger command used to create it. The check box is selected to show
that the breakpoint is enabled.
2.
Right-click anywhere on the breakpoint entry, in the Break/Tracepoints pane, to
display the Break/Tracepoints menu.
From here, you can examine the breakpoint, edit or copy it, or disable it so that it
is ignored the next time the program runs.
ARM DUI 0181B
Copyright © 2002 ARM Limited. All rights reserved.
4-25
Quick-start Tutorial
You can remove entries from the Break/Tracepoints pane. Highlight the entry and
select Clear from the Break/Tracepoint menu. The breakpoints list is refreshed
after the entry has been removed.
4-26
Copyright © 2002 ARM Limited. All rights reserved.
ARM DUI 0181B
Quick-start Tutorial
4.4
Working with custom panes
If you are working in single-processor debugging mode, the default Code window gives
you full access to your code views and all debugging operations. However, you might
want to display multiple memory views for your debug target, or to view multiple panes
at the same time. You can customize your desktop to get the views you want.
See Chapter 6 RealView Debugger Desktop for:
•
details on the contents of the Code window
•
full details on working with panes
•
a description of the controls used in the rest of this section.
This section describes:
•
Customizing your debug views
•
Hiding panes on page 4-28.
4.4.1
Customizing your debug views
To set up the default Code window and customize the panes:
1.
Select View → Pane Views → Registers to view the Register pane, Core tab.
2.
Click the Pane Content menu in the Register pane and select Switch Side to
reposition the pane.
3.
Select View → Pane Views → Call Stack to view the Call Stack pane, Call
Stack tab.
4.
Click the Pane Content menu in the Call Stack pane and select Process Control
to change the debug view.
Your default Code window looks like the example shown in Figure 4-14 on page 4-28.
ARM DUI 0181B
Copyright © 2002 ARM Limited. All rights reserved.
4-27
Quick-start Tutorial
Figure 4-14 Example Code window
In Figure 4-14, line numbering is turned on by selecting Edit → Editing Controls →
Show Line Numbers.
4.4.2
Hiding panes
You can use the Pane Management controls, on the Actions toolbar, to define which
panes are visible in your Code windows, for example click Hide Bottom Pane from the
Pane Management controls to hide the Output pane in the Code window shown in
Figure 4-14.
4-28
Copyright © 2002 ARM Limited. All rights reserved.
ARM DUI 0181B
Quick-start Tutorial
4.5
More about projects
This section gives more detail on how to manage your projects in RealView Debugger
and enables you to make more changes to the tutorial project, if required. It contains the
following sections:
•
Changing build tools
•
Viewing build settings on page 4-30
•
Adding files to your project on page 4-31
•
Generated makefiles on page 4-32
•
Building an application on page 4-33
•
Finding build errors on page 4-33.
4.5.1
Changing build tools
You can specify the location of a default toolchain to use when building applications and
images. You can set up a tools location at any time but it is recommended that you do
this before creating your first project.
To set up a different build tools location:
1.
Select Project → Build-Tool Properties... from the Code window main menu.
This displays the Build-Tool Properties window shown in Figure 4-15.
Figure 4-15 Setting the build tools location for a Custom installation
2.
ARM DUI 0181B
Double-click on a group, in the left pane, to specify the toolchain to use. This
displays the contents in the right pane. This is shown in the example in
Figure 4-15.
Copyright © 2002 ARM Limited. All rights reserved.
4-29
Quick-start Tutorial
3.
Right-click on the Tool_dir entry and select Edit as Directory Name from the
context menu. This displays the Enter New Directory dialog box where you can
specify the location of the toolchain you want to use. This forms the base
directory for the executable tools for this family of processors.
4.
Select File → Save and Close to save your changes and close the Build-Tool
Properties window.
If you have a common linker command file or your own runtime libraries, for example
kernel, ASIC (Application Specific Integrated Circuit), and peripheral drivers, you can
specify them for all projects at this stage. To make the changes:
4.5.2
1.
Select Project → Build-Tool Properties... from the Code window main menu.
2.
Double-click on the *PROC=ARM_ADS group in the left pane to expand the tree.
3.
Double-click on C_code in the right pane.
4.
Right-click on Def_cmd_file and select Edit as Filename from the context menu.
This displays the Enter New Filename dialog box where you can specify the
location of the linker command file.
5.
Right-click on Def_lib_cmd_file and select Edit as Filename from the context
menu. This displays the Enter New Filename dialog box where you can specify
the location of the librarian command file.
6.
Select File → Save and Close to save your changes and close the Build-Tool
Properties window.
Viewing build settings
The Project Properties window includes another window that enables you to see a
summary of the compiler, assembler, and linker command lines generated by the current
project settings. This window provides a read-only display of the command-line
switches for each of the current build target configurations.
To view your current compiler settings:
4-30
1.
Select Project → Open Project... to open the required project, for example
install_directory\examples\demo_ARM\dhrystone\dhrystone.prj.
2.
Select Project → Project Properties... to display the Project Properties window.
3.
Click on *COMPILE=arm in the left pane of the Project Properties window to see the
ARM C compiler (armcc) command line.
4.
Select View → Configuration Summary to display the Configuration Summary
window, shown in Figure 4-16 on page 4-31.
Copyright © 2002 ARM Limited. All rights reserved.
ARM DUI 0181B
Quick-start Tutorial
Figure 4-16 Configuration Summary window
This window contains one tab for each of the build target configurations specified
for the chosen group, that is Debug, Release, and DebugRel.
If you change a compiler setting, the Configuration Summary window updates
automatically.
5.
Click on *ASSEMBLE=arm in the left pane of the Project Properties window to see the
ARM assembler (armasm) command line in the Configuration Summary window.
6.
Select File → Close Window from the menu to close the Project Properties
window without making any changes.
If you select an entry in the left pane that does not contain compiler, assembler, or linker
settings, for example *CONFIGURATION, the Configuration Summary window displays the
message:
NO COMPILE, ASSEMBLE or BUILD group is selected.
If you close the Project Properties window without closing the Configuration Summary
window first, RealView Debugger displays both windows automatically when you next
open the Project Properties window in this session.
4.5.3
Adding files to your project
You can change your project properties at any time after creation, for example you can
add source files, add object files, delete files, or exclude files from the build.
Adding source files to a project
With a project open, you can add source files and so update the project properties
automatically. There are two ways to do this, depending on the location of the file you
want to add:
ARM DUI 0181B
•
Select Project → Add This File to Project to add the file currently displayed in
the topmost tab in the File Editor pane to the list of project sources.
•
Select Project → Add Files to Project... to display the Select File(s) to Add
dialog box where one or more files can be added to the project.
Copyright © 2002 ARM Limited. All rights reserved.
4-31
Quick-start Tutorial
Note
Make sure that the Project Properties window is not open when adding source files from
the Project menu. Also ensure that any rebuild is complete.
Adding object files to a project
If you want to add object files to your project you must use the Project Properties
window, shown in Figure 4-4 on page 4-7. For full details of how to do this, see the
chapter describing managing projects in RealView Debugger v1.6 User Guide.
4.5.4
Generated makefiles
RealView Debugger uses the template gen_***.mk to generate makefiles for all projects.
The *** is replaced depending on your default processor family and toolchain. In this
tutorial project, RealView Debugger uses the template gen_arx.mk located in the
directory install_directory\etc.
The makefiles are generated when you do any of the following:
•
create a new project
•
edit and save an existing project
•
edit and close the Build-Tool Properties window
•
update the Project Properties window, for example doing an edit and save.
Details about the makefile generation process are given in the Build tab of the Output
pane.
Note
You can also force the makefiles to be regenerated if necessary. This is explained in the
chapter describing managing projects in RealView Debugger v1.6 User Guide.
Viewing the makefile
You can view the makefile that is generated using RealView Debugger, for example
either:
4-32
•
Select File → Open... from the default Code window main menu to display the
Select File to Open dialog box where you can locate the makefile and open it in
the File Editor pane for viewing.
•
Open Windows Explorer and navigate to the project base directory. Drag the
makefile and drop it into the File Editor pane where it opens for viewing.
Copyright © 2002 ARM Limited. All rights reserved.
ARM DUI 0181B
Quick-start Tutorial
Do not make any changes to the generated makefiles as these are overridden when the
files are next generated. It is recommended that you always use the Project Properties
window to set up your preferences.
4.5.5
Building an application
To build the executable for a project:
1.
Select Project → Open Project... to open the required project.
2.
Select Tools → Build... from the default Code window main menu.
3.
If you have made any changes to the Project Properties, or to the Build-Tool
Properties, you are prompted to rebuild all project files.
Click Yes to confirm the rebuild.
The build, or rebuild, completes and RealView Debugger displays the Build tab, in the
Output pane, to report successful completion. If the build process fails, the Build tab
reports any errors.
In the build process:
•
RealView Debugger builds the executable as a background task. This is shown by
an exclamation mark in the Build tab. You can still submit commands or use
RealView Debugger during the build.
•
The Debug build target configuration is built by default.
•
The -f flag forces the make utility to read the specified file, tutorial_Debug.mk, as
a makefile.
•
The all flag forces a rebuild of all project files.
You can click the Stop Build button on the Actions toolbar to halt a build.
4.5.6
Finding build errors
Errors in your source code always result in a failed build and the executable is not built.
In these cases, you must locate and correct these errors. RealView Debugger includes
features to help locate errors in the source files when the build process fails.
Build error reporting
The error reporting system:
•
highlights the error text in the Output pane Build tab
•
scrolls the file in the File Editor pane to the location of the error
ARM DUI 0181B
Copyright © 2002 ARM Limited. All rights reserved.
4-33
Quick-start Tutorial
•
•
places a blue pointer at the error
places the flashing text cursor in the source file after the error.
If RealView Debugger finds more than one error, it highlights the first error. Select
Tools → Next Line/Error to move through the error list after correcting an error.
Alternatively, you can go directly to an error by double-clicking on the line number,
shown in the Output pane Build tab.
4-34
Copyright © 2002 ARM Limited. All rights reserved.
ARM DUI 0181B
Quick-start Tutorial
4.6
Completing the tutorial
Because the tutorial project is self-contained, follow these steps if you want to tidy up
the install_directory\Tutorial directory after you close down RealView Debugger.
4.6.1
Removing tutorial project files
To remove the files associated with the project:
1.
Delete the project file install_directory\Tutorial\tutorial.prj.
2.
Delete the build target configuration directories, for example:
install_directory\Tutorial\Debug
3.
Delete the target generated makefiles, for example:
install_directory\Tutorial\tutorial_Debug.mk
4.
Delete any backup files with the .bak extension.
The project is now deleted from your workstation.
4.6.2
Removing the tutorial project
If you do not want to keep the files copied at the start, or the executable image, you can
delete the entire tutorial project base directory, that is install_directory\Tutorial.
ARM DUI 0181B
Copyright © 2002 ARM Limited. All rights reserved.
4-35
Quick-start Tutorial
4-36
Copyright © 2002 ARM Limited. All rights reserved.
ARM DUI 0181B
Chapter 5
Ending your RealView Debugger Session
This chapter describes how to end your debugging session and how to exit RealView
Debugger. It contains the following sections:
•
Saving the session on page 5-2
•
Disconnecting from a target on page 5-5
•
Exiting RealView Debugger on page 5-7.
ARM DUI 0181B
Copyright © 2002 ARM Limited. All rights reserved.
5-1
Ending your RealView Debugger Session
5.1
Saving the session
RealView Debugger stores session details by default when you end your debugging
session. Saving the session enables you to start your next session using the same
working environment, connecting automatically to a specified target, and opening
projects.
RealView Debugger stores session details using your:
•
Workspace
•
Startup file on page 5-3
•
History file on page 5-3
•
Settings options on page 5-4.
5.1.1
Workspace
The RealView Debugger workspace is used for visualization and control of default
values, and storing persistence information. It includes:
•
user-defined options and settings
•
connection details
•
details about open windows and, in some cases, their contents
•
user-defined projects or auto-projects to open on startup.
The first time that you run RealView Debugger, the default workspace settings file
rvdebug.aws is created in your home directory. Each time you start RealView Debugger
after this, it loads this workspace automatically, but you can change the defaults or
create a new workspace of your own.
To change your workspace, select File → Workspace from the main menu to display
the Workspace menu shown in Figure 5-1.
Figure 5-1 Workspace menu
Alternatively, you can run RealView Debugger from the command line without loading
a workspace, for example:
"C:\Program Files\ARM\RealView Debugger v1_6\bin\rvdebug.exe" -aws=-
5-2
Copyright © 2002 ARM Limited. All rights reserved.
ARM DUI 0181B
Ending your RealView Debugger Session
For full details on amending your workspace settings to define how session details are
saved and where, see the chapter describing configuring workspaces in RealView
Debugger v1.6 User Guide.
5.1.2
Startup file
The startup file contains a record of your last debugging session including:
•
images and files loaded into RealView Debugger
•
the list of all recently loaded files, for example source files
•
the recent workspaces list
•
the workspace to be used on startup, if specified
•
workspace save and restart settings
•
user-defined menu settings, for example pane format options
•
the recent projects list.
By default, this file is called rvdebug.sav. The first time you close down RealView
Debugger after performing an operation in the default Code window a startup file is
created in your home directory. From this point on, every time you close down
RealView Debugger and exit, this startup file is updated. You can specify a different
startup file, or none at all, by changing your workspace settings.
5.1.3
History file
The history file contains a record of:
•
commands submitted during a debugging session, for example, changing
directory, loading source files, loading an image for execution, or setting
breakpoints
•
data entries examined in the Code window during debugging
•
the Set Directory and Set File lists used in Open dialog boxes, for example Select
File to Open, or Select File to Include Commands from
•
personal favorites such as variables, data values, watches, and breakpoints.
The first time you run RealView Debugger, carry out an operation, and then exit, a
history file is created in your home directory. By default, this is called exphist.sav and
is updated at the end of all subsequent debugging sessions.
ARM DUI 0181B
Copyright © 2002 ARM Limited. All rights reserved.
5-3
Ending your RealView Debugger Session
5.1.4
Settings options
By default, RealView Debugger writes your current settings to your startup file ready
for re-use, saves your current workspace, and reloads this workspace at the next
start-up.
To change these defaults, select File → Workspace from the main menu to display the
Workspace menu shown in Figure 5-1 on page 5-2.
At the bottom of this menu are your current settings options. Enable or disable the
required options to decide how your next RealView Debugger session starts. For
example, if Same Workspace on Startup is unselected, RealView Debugger does not
use the current workspace at the next start-up. This means that, unless another
workspace is specified on the command line, RealView Debugger opens the default
workspace.
These options are saved in your startup file when you exit RealView Debugger.
5-4
Copyright © 2002 ARM Limited. All rights reserved.
ARM DUI 0181B
Ending your RealView Debugger Session
5.2
Disconnecting from a target
You can disconnect from the current target quickly, depending on your current
debugging mode. Either:
•
Select File → Connection → Disconnect from the Code window main menu.
This immediately disconnects the connection.
•
Select File → Connection → Connect to Target... from the Code window main
menu to display the Connection Control window, and unselect the check box to
disconnect the connection.
RealView Debugger Code windows do not close when you disconnect from a target.
However, if you have an image loaded, disconnecting removes all the debug
information from RealView Debugger and this clears pane contents.
Disconnecting does not close any open projects.
Note
It is not necessary to disconnect from a target before you close down RealView
Debugger, see Exiting RealView Debugger on page 5-7 for more details.
5.2.1
Setting disconnect mode
You can control the way a target processor is left after you disconnect. This is
particularly useful when debugging multiprocessor debug targets and working with
multiple threads. In single processor debugging mode, you might want to leave an
image executing but close down RealView Debugger.
If you are connected, you can set disconnect mode:
1.
Select File → Connection → Connect to Target... to display the Connection
Control window.
2.
Right-click on the connection entry and select Disconnect (Defining Mode)...
from the Connection context menu.
3.
Select the required state from the selection box.
The options listed depend on your execution vehicle.
4.
ARM DUI 0181B
Click OK to disconnect and leave the processor in the required state.
Copyright © 2002 ARM Limited. All rights reserved.
5-5
Ending your RealView Debugger Session
If you set disconnect mode from the Connection Control window, this temporarily
overrides any setting in your target configuration file. See the chapter describing
connecting (and disconnecting) in RealView Debugger v1.6 Target Configuration Guide
for full details on setting disconnect mode for your debug target.
5-6
Copyright © 2002 ARM Limited. All rights reserved.
ARM DUI 0181B
Ending your RealView Debugger Session
5.3
Exiting RealView Debugger
This section describes the options available when you exit RealView Debugger:
•
Closing down without a connection
•
Closing down with a connection
•
Reconnecting to a target on page 5-8.
5.3.1
Closing down without a connection
Disconnect from your target, as described in Disconnecting from a target on page 5-5,
and select File → Exit to display the Exit dialog box.
Click Yes to close the Exit dialog box and close down RealView Debugger.
5.3.2
Closing down with a connection
If you are connected to your target and you select File → Exit, the Exit dialog box
includes the Disconnect Connection check box, shown in Figure 5-2.
Figure 5-2 Exit dialog box, connected
Use the check box to specify your disconnect options:
•
Maintaining the connection
•
Terminating the connection on page 5-8.
Maintaining the connection
To close down and maintain the connection:
1.
Unselect the Disconnect Connection check box shown in Figure 5-2.
2.
Click Yes to close the Exit dialog box and close down RealView Debugger.
RealView Debugger exits but the connection is maintained for future sessions, that is
the Target Vehicle Server (TVS) is left running. If you are connected to a remote debug
target and you close down this way, the remote RealView Debugger Connection Broker
is also left running.
ARM DUI 0181B
Copyright © 2002 ARM Limited. All rights reserved.
5-7
Ending your RealView Debugger Session
Terminating the connection
To close down and terminate the connection:
1.
Leave the Disconnect Connection check box, shown in Figure 5-2 on page 5-7,
so that it is selected.
2.
Click Yes to close the Exit dialog box and close down RealView Debugger.
RealView Debugger exits and terminates any connections to debug targets, that is TVS
stops. If you are connected to a remote debug target and you close down this way, you
must stop the remote RealView Debugger Connection Broker manually.
Note
See Components of RealView Debugger on page 1-4 for details on TVS and RealView
Debugger Connection Broker.
5.3.3
Reconnecting to a target
RealView Debugger saves all open connections in the current workspace if you close
down without disconnecting first. This default behavior is independent of the status of
the Disconnect Connection check box shown in Figure 5-2 on page 5-7.
If you exit a session when still connected to a debug target, RealView Debugger tries to
reconnect when you next open the workspace. However, this might fail if the connection
or vehicle status has changed, for example if your Multi-ICE server has stopped.
If RealView Debugger reconnects successfully, the connection mode specified in the
target configuration file is used by default. See the chapter describing connecting in
RealView Debugger v1.6 Target Configuration Guide for full details on defining the
connect mode for your debug target.
Note
Use your settings options to change the way RealView Debugger closes down, see
Settings options on page 5-4 for details.
5-8
Copyright © 2002 ARM Limited. All rights reserved.
ARM DUI 0181B
Chapter 6
RealView Debugger Desktop
This chapter describes, in detail, the RealView Debugger desktop. It describes the
contents of the default Code window, and explains how to change them. This chapter
describes items and options available from the main menu and the toolbars.
It contains the following sections:
•
About the desktop on page 6-2
•
Finding options on the main menu on page 6-11
•
Working with button toolbars on page 6-15
•
Working in the Code window on page 6-19
•
Editor window on page 6-22
•
Resource Viewer window on page 6-23
•
Analysis window on page 6-26.
ARM DUI 0181B
Copyright © 2002 ARM Limited. All rights reserved.
6-1
RealView Debugger Desktop
6.1
About the desktop
This section describes the default Windows desktop that you see when you run
RealView Debugger for the first time after installation and highlights any key features
that might be different. It contains the following sections:
•
Splash screen
•
Code window
•
Default windows and panes on page 6-5
•
Pane controls on page 6-8
•
Button toolbars on page 6-8
•
Color Box on page 6-9
•
Other window elements on page 6-10.
6.1.1
Splash screen
Run the debugger from the Windows Start menu to display the RealView Debugger
splash screen. During this time, the debugger is checking your environment and creating
(or updating) configuration files and a working directory.
Use the -nologo flag to run RealView Debugger from the command line without a
splash screen.
6.1.2
Code window
The Windows splash screen is replaced by the default Code window when you run
RealView Debugger for the first time after installation, shown in Figure 6-1 on
page 6-3.
6-2
Copyright © 2002 ARM Limited. All rights reserved.
ARM DUI 0181B
RealView Debugger Desktop
Color Box
Title bar
Toolbars
Pane Management
controls
Build controls
Processor
State
Side pane
File Editor pane
Output pane
Pane
title bar
Status
line
Command line
Cursor location field
Keyboard
status
Figure 6-1 Default Code window
The Code window is your main debugging and editing window. The contents of this
window change as you:
•
connect to targets
•
load and unload application programs or files
•
configure and customize your working environment.
The toolbar buttons displayed, and the options available from window and pane menus
also change depending on the licenses you have.
Title bar
The Code window title bar gives details of the connection and any processes running on
your debug target. If you connect to a target and load an image, your title bar looks like
the one shown in Figure 6-2 on page 6-4.
ARM DUI 0181B
Copyright © 2002 ARM Limited. All rights reserved.
6-3
RealView Debugger Desktop
Figure 6-2 Title bar
In addition to the application icon, the title bar contains (from left to right):
RVDEBUG Identifies the Code window. This changes as you open new windows, for
example RVDEBUG_1, or RVDEBUG_2.
(dhrystone) The project associated with the image that you loaded.
In RealView Debugger, a project can be associated with a connection,
that is it is bound to that connection, shown in Figure 6-2.
Where a project is not associated with a particular connection, it is
unbound. In this case, the project name is enclosed in angled brackets, for
example <my_project>.
See the chapter describing managing projects in RealView Debugger v1.6
User Guide for details on project binding.
@ARM...
The connection, including the target processor, the connection number,
and the execution vehicle.
[Unattached]
The attachment of the window to a specified connection.
If you are working in multiprocessor mode, the default Code window is
unattached. You can attach a Code window to a specified connection,
shown by [Board]. See the chapter describing working with multiple
targets in RealView Debugger v1.6 Extensions User Guide for details.
If you are using an RTOS, you can attach a Code window to a thread to
display debug information for that thread. This is shown by [Thread]. See
the chapter describing RTOS support in RealView Debugger v1.6
Extensions User Guide for details.
If you are working in single processor debugging mode, the option to
attach windows to your connection is not available.
If you float a pane, the pane title bar reflects the title bar of the calling Code window.
Note
The contents of your title bar might be different from the one shown in Figure 6-2
depending on your connection (if any), open projects, and windows attachment.
6-4
Copyright © 2002 ARM Limited. All rights reserved.
ARM DUI 0181B
RealView Debugger Desktop
6.1.3
Default windows and panes
RealView Debugger provides a range of debug views:
•
Registers
•
Stack
•
Process Control
•
Symbol Browser
•
Watch
•
Call Stack and Locals
•
Memory and Memory Map
•
Threads (with the appropriate RTOS support package)
•
Break/Tracepoints.
The default Code window, shown in Figure 6-1 on page 6-3, contains:
File Editor pane
The File Editor pane is always visible when working with RealView
Debugger.
Use this area of the Code window to:
•
use a shortcut to connect to a target or load an image
•
enter text to create project files
•
open source files for editing and resaving
•
view disassembly
•
set breakpoints to control execution
•
use the available menu options to search for specific text as part of
debugging
•
follow execution through a sequence of source-level and
disassembly-level views.
The File Editor pane contains a hyperlink to make your first connection
to a debug target. When a connection is made, this link changes to give
you a quick way to load an image.
When RealView Debugger first starts, the File Editor pane contains tabs
to track program execution:
ARM DUI 0181B
•
the Src tab shows the current context in the source view
•
the Dsm tab displays disassembled code with intermixed C/C++
source lines.
Copyright © 2002 ARM Limited. All rights reserved.
6-5
RealView Debugger Desktop
If you load an image, or when you are working with source files, more
tabs are displayed, for example dhry_1.c. In this case, click on the Src tab
to see the location of the PC.
Side pane
By default, this contains the Register pane view that displays grouped
processor registers for the current target processor. When you first run
RealView Debugger, this pane is positioned to the right of the File Editor
pane but you can switch this pane to the left, using the Switch Side option
from the Pane Content menu.
The Register pane displays different tabs depending on the target
processor and the connection mechanism. For example, if you are using
ARMulator to simulate an ARM processor, the Debug tab displays
debugger internals. However, if the target processor is a DSP, a Status tab
is available displaying details of the status flags.
Middle pane row
The middle pane row can contain one, two, or three pane views, but you
can specify which panes are visible. By default this row contains:
Call Stack pane
Use this pane to:
•
display the procedure calling chain from the entry point
to the current procedure
•
monitor local variables.
The Call Stack pane contains tabs:
Call Stack
Displays the stack functions call chain.
Locals
Shows variables local to the current function.
Statics
Displays a list of static variables local to the current
module.
This
Shows objects located by the C++ specific this
pointer.
Watch pane
Use this pane to:
•
set up variables or expressions to watch
•
display current watches
•
modify watches already set
•
delete existing watches.
The Watch pane contains tabs to display sets of watched
values. The first tab, Watch1, is selected by default.
6-6
Copyright © 2002 ARM Limited. All rights reserved.
ARM DUI 0181B
RealView Debugger Desktop
Memory pane
Use this pane to:
•
display the contents of a range of memory locations on
the target
•
edit the values stored by the application.
Bottom pane
The bottom pane of the Code window always contains the Output pane.
Select the different tabs to:
•
enter commands during a debugging session (Cmd)
•
handle I/O with your application (StdIO)
•
see the progress of builds (Build)
•
see the results of Find in Files operations (FileFind)
•
see the results of operations using your version control tool
(SrcCtrl)
•
view the results of commands and track events during debugging
(Log).
The command line is located at the bottom of the Output pane. This
shows the status of the current process, for example, Stop, Run, or None (no
process). You can also enter debugger commands at the > prompt.
During your debugging session, you can use the Pane Content menu to define which
view is displayed in a chosen pane (see Pane controls on page 6-8 for details). At the
end of your first session, you can configure RealView Debugger to start next time with
a different set of panes or views if required by saving the customized setup in your
workspace.
Changing panes
Select View → Pane Views to change what is displayed in a pane view or to restore the
default views. You can also use this menu to display any window or pane that is hidden,
without changing the view it displays. If a pane is hidden and you use the Pane Views
menu to change the pane contents, it is automatically displayed to show the new view.
Formatting pane views
The contents of the File Editor pane and the Output pane cannot be changed. However,
you can define how the view is formatted, for example change the size of text displayed
in the File Editor pane or the number of lines displayed in the Output pane. See the
chapter describing configuring workspaces in RealView Debugger v1.6 User Guide for
details of how to do this.
ARM DUI 0181B
Copyright © 2002 ARM Limited. All rights reserved.
6-7
RealView Debugger Desktop
6.1.4
Pane controls
Each configurable pane in the Code window, shown in Figure 6-1 on page 6-3, includes
a title bar and pane controls. In the side pane, the pane title bar is displayed horizontally
at the top of the pane. In the middle and bottom panes, the title bar is displayed vertically
at the left side of the pane.
If you float a pane, the title bar is displayed horizontally at the top of the window.
A pane contains the controls:
Pane Content
Click this button to display the Pane Content menu where you can
change the debug view in the pane.
The selected option in the menu indicates the current view.
Visual controls
The visual controls are at the bottom of the Pane Content
menu. Use these to float or hide the pane.
In the side pane, use the option Switch Side to move the pane
from the right side of the Code window so that it is positioned
to the left of the code view.
Expand/Collapse Pane
Click this button to collapse the currently selected view. Other panes are
expanded to fill the empty area.
Click the Expand Pane button to restore the view.
There is no option to collapse, or expand, a floating pane.
Pane Menu Click this button to display the Pane menu.
Use this to:
•
change the display format
•
change how pane contents are updated
•
extract data from the pane.
The options available from this menu depend on the pane.
6.1.5
Button toolbars
There are two toolbars, below the Code window main menu, that provide quick access
to many of the features available from menu options:
•
Actions toolbar, shown in Figure 6-3 on page 6-9
•
Editing toolbar, shown in Figure 6-4 on page 6-9.
6-8
Copyright © 2002 ARM Limited. All rights reserved.
ARM DUI 0181B
RealView Debugger Desktop
Figure 6-3 Actions toolbar
Figure 6-4 Editing toolbar
To disable a toolbar, select View → Toolbars from the main menu. This displays the
Toolbars menu where you can specify which toolbars are visible.
You can move a toolbar from the default position in the Code window so that it floats
on your desktop. To restore the floating toolbar, double-click anywhere on the toolbar
title bar.
Note
Repositioning a toolbar in this way applies only to the calling Code window. If you
create a new Code window the toolbars are in the default positions on opening.
See Working with button toolbars on page 6-15 for details on the buttons available from
the Actions toolbar and the Editing toolbar, and how to customize toolbar groups.
6.1.6
Color Box
Code windows in RealView Debugger are color-coded to help with navigation. This is
particularly useful when debugging multiprocessor debug targets and working with
multiple threads.
When connected to a single target processor, the Color Box identifies the connection
associated with the window. This is located on the main menu toolbar next to File,
shown in Figure 6-5.
Color Box
Figure 6-5 Color Box
ARM DUI 0181B
Copyright © 2002 ARM Limited. All rights reserved.
6-9
RealView Debugger Desktop
When you first start RealView Debugger the Code window is not associated with any
target or process. The Color Box changes when you make your first connection. As you
create new Code windows, these are also color-coded. Closing your connection changes
the Color Box to show that there is no connection associated with the window. Any
other Code windows attached to that connection are also updated to match. Notice that:
•
connection-independent windows, or controls, do not contain a Color Box
•
floating panes contain a Color Box that matches the calling window.
6.1.7
Other window elements
There are status display areas at the bottom of the Code window:
Status line
As you move through menu options, or when you view button tooltips,
this line shows a more detailed explanation of the option or button under
the cursor.
Cursor location field
As you move through files within the File Editor pane, the current
location of the text insertion point is displayed in the Cursor location field
at the bottom right of the Code window.
6-10
LOG
Shows that output is being written to a log file.
JOU
Shows that output is being written to a journal file.
STDIOlog
Shows that output is being written to an STDIOlog file.
NUM
Shows that you can use the numeric keypad to enter numbers.
CAP
Shows that Caps Lock is selected.
Copyright © 2002 ARM Limited. All rights reserved.
ARM DUI 0181B
RealView Debugger Desktop
6.2
Finding options on the main menu
This section provides a summary of the main menu options available from the Code
window that enable you to:
•
open and close files within the File Editor pane
•
manage target images, projects, and workspaces
•
navigate, search, and edit source files
•
manage new windows and change pane contents
•
work with projects and build images
•
debug your images
•
access the online help system.
The submenus available from the main menu bar are:
File
Displays the File menu shown in Figure 6-6.
Figure 6-6 File menu
Note
The menu option Close Window is not enabled when the default Code
window is the only window. This is the main debugging and editing
window, and it must be open throughout your debugging session. Close
the Code window to close down RealView Debugger.
ARM DUI 0181B
Copyright © 2002 ARM Limited. All rights reserved.
6-11
RealView Debugger Desktop
Edit
Displays the Edit menu shown in Figure 6-7. This menu enables you to
work with source files as you develop your application. It includes
options to define how source code is displayed in the File Editor pane.
Figure 6-7 Edit menu
Find
Displays the Find menu shown in Figure 6-8. This menu enables you to
work with source files and to perform searches on those files as you
debug your image. This also gives access to the browsers in RealView
Debugger.
Figure 6-8 Find menu
View
Displays the View menu shown in Figure 6-9. This menu enables you to
set up new windows and panes as you are working with target
connections. It also includes options to customize toolbar groups.
Figure 6-9 View menu
6-12
Copyright © 2002 ARM Limited. All rights reserved.
ARM DUI 0181B
RealView Debugger Desktop
Note
Custom windows are not available in this release.
Project
Displays the Project menu shown in Figure 6-10. This menu enables you
to work with projects so that you can organize your source files, model
your build process, and share files with other developers. This can be
used in conjunction with the Tools menu to rebuild images.
Figure 6-10 Project menu
Tools
Displays the Tools menu shown in Figure 6-11.
Figure 6-11 Tools menu
This menu enables you to build files, or groups of files, to create your
image ready for loading to a target. It also enables you to examine, and
change, your workspace settings and global configuration options.
If you have the appropriate licenses, you can access RealView Debugger
extensions for Trace, Analysis, and Profiling. These features are
described fully in RealView Debugger v1.6 Extensions User Guide.
Note
Supported by selected simulators from the DSP Group, the Simulation
Control option is not available in this release.
ARM DUI 0181B
Copyright © 2002 ARM Limited. All rights reserved.
6-13
RealView Debugger Desktop
Debug
Displays the Debug menu shown in Figure 6-12.
Figure 6-12 Debug menu
This menu includes the main facilities you use during a debugging
session.
Help
Displays the Help menu shown in Figure 6-13.
Figure 6-13 Help menu
This menu gives you access to the RealView Debugger online help, to
web downloads pages, and displays details of your version of RealView
Debugger. You can also use this menu to create and submit a Software
Problem Report (SPR).
6-14
Copyright © 2002 ARM Limited. All rights reserved.
ARM DUI 0181B
RealView Debugger Desktop
6.3
Working with button toolbars
The Code window toolbars give access to many of the features available from the main
menu and to additional debugging controls. By default, the Code window shows both
toolbars but you can customize which controls are available. This section describes:
•
Actions toolbar
•
Editing toolbar on page 6-16
•
Customizing the Actions toolbar on page 6-17.
6.3.1
Actions toolbar
The Actions toolbar, see Figure 6-3 on page 6-9, contains buttons used during
debugging sessions and when working with source code:
File group
Use these buttons when developing applications to open files and to save
changed files in the File Editor pane. They replicate selected options from
the File menu.
Edit group
Use these buttons to edit source files in the File Editor pane. They
replicate selected options from the Edit menu.
Execution group
Use these buttons to control program execution, for example starting and
stopping execution, and stepping.
These buttons are enabled when an image has been loaded. They replicate
selected options from the Debug menu.
Context controls
Use these buttons to move up and down the stack levels during program
execution. These buttons are enabled when an image has been loaded.
Command cancel
Commands submitted to RealView Debugger are queued for execution.
Click this button to cancel the last command entered onto the queue.
This does not take effect until the previous command has completed.
Image load group
Use these buttons to control images. They replicate selected options from
the File menu.
Connection button
This button is disabled unless you have the appropriate license.
ARM DUI 0181B
Copyright © 2002 ARM Limited. All rights reserved.
6-15
RealView Debugger Desktop
Used during a multiprocessor debugging session, click this button to
connect to the next available active connection. Click on the drop-down
arrow to display the list of active connections with the current connection
marked with an asterisk.
The list also shows if the Code window is attached by adding a check
mark.
Threads button
Used during a multithreading debugging session, click this button to
change to the next active thread. Click on the drop-down arrow to display
the list of active threads where you can identify the current thread.
This button is only enabled when an underlying operating system is
supported.
Pane Management controls
Use these buttons to control the panes displayed in the Code window.
Build group Use these buttons to control the build process during your debugging
session. They replicate selected options from the Tools menu.
Processor State group
This field indicates the runtime state of the debug target. This contains:
Unknown
Shows that the target state is not known to the debugger.
Stopped Shows that the target is connected but not active.
Running Shows that an image is currently running. In this case, a
running progress indicator is also included.
6.3.2
Editing toolbar
The Editing toolbar, see Figure 6-4 on page 6-9, contains:
File:
This read-only field shows the name of the file currently displayed in the
File Editor pane. If you have changed the file since loading or saving, an
asterisk, * , is appended to the end of the filename. Hold your mouse
pointer over the field to see the full pathname.
If you are working on several files in the File Editor pane, the File field
shows the name displayed on the topmost file tab.
6-16
Copyright © 2002 ARM Limited. All rights reserved.
ARM DUI 0181B
RealView Debugger Desktop
Find:
This field enables you to perform a quick text search on the file currently
displayed in the File Editor pane. Type the required string into the Find
field and then press Enter. If you are working on several files in the File
Editor pane, the search examines only the file in the topmost file tab.
Click on the drop-down arrow to display a list of recently-used search
strings.
Line:
Use the Line number field to enter the number of the line where the text
insertion point is to be moved.
If the Line number field is empty, click inside this field and press Enter
to display the line number where the text insertion point is currently
located. Click inside the field again and press Enter to scroll to this
location.
Source control button
This button indicates the read/write status of the current file. Click this
button to change the status of a file.
You can edit a file only if the Read-Write icon is displayed.
Click on the drop-down arrow to access the source control commands (if
enabled).
6.3.3
Customizing the Actions toolbar
To customize your Actions toolbar, select View → Toolbars → Customize... from the
Code window main menu to display the selection box shown in Figure 6-14.
Figure 6-14 Toolbar groups selection box
Check boxes show which toolbar groups are currently enabled on the Actions toolbar.
Click a selected check box to disable the associated group. Click OK to close the
selection box and return to the Code window where the disabled groups have been
removed from the button toolbar. To re-enable button groups, display the selection box
and click on the check boxes so that they are selected.
ARM DUI 0181B
Copyright © 2002 ARM Limited. All rights reserved.
6-17
RealView Debugger Desktop
If you customize a toolbar, this persists to any new Code windows that you open from
this calling window. However, you cannot customize the toolbars shown in a standalone
Editor window (see Editor window on page 6-22).
Note
Custom toolbar groups are not available in this release.
6-18
Copyright © 2002 ARM Limited. All rights reserved.
ARM DUI 0181B
RealView Debugger Desktop
6.4
Working in the Code window
This section describes how to work with the Code window:
•
Floating, docking, and resizing windows and panes
•
Changing the focus
•
In-place editing on page 6-20
•
Working with tabs on page 6-21.
6.4.1
Floating, docking, and resizing windows and panes
Panes are docked to default positions in the Code window when RealView Debugger
starts in the default state. You can resize the middle pane row by dragging the upper
boundary to the required height. Similarly, drag the left boundary to a new position to
enlarge the side pane. You can enlarge the Output pane by dragging the upper boundary.
A pane is floating when it is displayed separately from the calling window and can be
moved around the desktop. To float a pane either:
•
select Float from the Pane Content menu
•
double-click on the pane title bar.
A floating pane is still tied to the calling window. If, for example, you float a pane from
the middle pane row and then click the Show/Hide Middle Pane control in the Code
window, the floating pane is also hidden. To restore the pane, click the Show/Hide
Middle Pane control again.
To dock a floating pane, select Dock from the Pane Content menu or double-click on
the pane title bar.
6.4.2
Changing the focus
In RealView Debugger, the focus indicates the window, or pane, where the next
keyboard input takes effect. Use a single left-click on the title bar to move the focus to
the Code window, or the pane, where you want to work. You can also move between the
File Editor pane and the Output pane using Ctrl+Tab or Shift+Ctrl+Tab.
When working with several Code windows, left-click inside a pane entry to change the
focus. The pane title bar changes color to show that it now has the focus, and the title
bar of the calling Code window is also highlighted.
If you switch to another Code window by clicking on the title bar, the focus moves to
that window and the text insertion point is located inside the File Editor pane. If the
context of the Code window is unknown, the text insertion point is located at the
command-line prompt.
ARM DUI 0181B
Copyright © 2002 ARM Limited. All rights reserved.
6-19
RealView Debugger Desktop
If you double left-click in a pane entry, for example on the contents of a register in the
Register pane, this moves the focus to this pane and highlights the entry ready for
editing.
If you right-click in a pane that does not have the focus, the focus does not move to this
pane. This action does, however, highlight the chosen entry in the new pane. In this case,
use the Code window title bar to see where the focus is currently located.
6.4.3
In-place editing
In-place editing enables you to change a stored value and to see the results of that
change instantly. RealView Debugger offers in-pace editing whenever possible. For
example, if you are displaying the contents of memory or registers, and you want to
change a stored value:
1.
Double-click in the value you want to change, or press Enter if the item is already
selected. The value is enclosed in a box with the characters highlighted to show
they are selected (pending deletion).
2.
Either:
3.
•
enter data to overwrite the highlighted content
•
press the left or right arrow keys to deselect the existing data and position
the insertion point where you want to make a change.
Press Enter to store the new value in the selected location.
If you press Escape before you press Enter, any changes you have made in the
highlighted field are ignored.
In-place editing is not suitable for:
•
editing complex data where some prompting is helpful
•
editing groups of related items
•
selecting values from predefined lists.
In these cases, an appropriate dialog box is displayed.
Note
When using in-place editing, you must either complete the entry and press Enter, or
press Escape to cancel the operation. If you move the focus to another pane, RealView
Debugger suspends the current editing operation so that you can complete it when focus
returns. Similarly, if you click inside another pane, or change the current view,
RealView Debugger cancels the current editing operation.
6-20
Copyright © 2002 ARM Limited. All rights reserved.
ARM DUI 0181B
RealView Debugger Desktop
6.4.4
Working with tabs
You can access RealView Debugger debugging features using tabbed pages or tabs. In
the Watch pane, for example, there are multiple tabs and each shows a different set of
watched variables. The Output pane contains tabs enabling you to select the view that
suits your debugging task.
Right-click on a tab to display text that explains the function of the tab or the content.
If you are using the default Windows display settings and you right-click on a tab that
is not at the front, the tab name being referenced is colored red for easy identification.
If you right-click over a blank area of the tab bar at the bottom of a window or pane, a
context menu enables you to select a tab from a list. You can also display this menu by
right-clicking on the left, or right, scroll arrow on the left-hand side of the tab bar.
ARM DUI 0181B
Copyright © 2002 ARM Limited. All rights reserved.
6-21
RealView Debugger Desktop
6.5
Editor window
RealView Debugger includes a range of editing features to help you work with source
code and projects. Use a standalone Editor window to access these editing features so
that you can edit files independently of the debugging session or to include these files
within your project.
To display a standalone Editor window, select View → Editor Window from the Code
window main menu. This displays a floating Editor window shown in Figure 6-15.
Figure 6-15 Editor Window
In this example, the window is already loaded with the file displayed in the topmost tab
in the parent File Editor pane.
A quick way to display an empty Editor window is to click on the Dsm tab and then
select View → Editor Window from the Code window main menu.
Note
You can also display standalone Editor windows from the Tools menu.
6-22
Copyright © 2002 ARM Limited. All rights reserved.
ARM DUI 0181B
RealView Debugger Desktop
6.6
Resource Viewer window
The Resource Viewer gives access to all the debugger resources as your debugging
session progresses. With the appropriate OS support package, the Resource Viewer
window also gives access to RTOS resources including lists of timers, threads, queues,
event flags, and memory in byte and block pools. In this mode, additional tabs are
displayed.
To display the Resource Viewer window shown in Figure 6-16, start RealView
Debugger in the usual way and select View → Resource Viewer Window from the
Code window main menu.
Figure 6-16 Resource Viewer window
Because RealView Debugger is running, this window displays the starting state of the
debugger. The contents of this window change as you establish new target connections,
start applications, and debug your images.
The title bar shows the connection, and the Color Box at the left of the window menu
bar shows the attachment status of the calling window.
The Resource Viewer window includes:
•
File menu on page 6-24
•
Help menu on page 6-24
•
Resources list on page 6-25
•
Details area on page 6-25.
ARM DUI 0181B
Copyright © 2002 ARM Limited. All rights reserved.
6-23
RealView Debugger Desktop
6.6.1
File menu
This menu contains:
Update List Rereads the board file and updates the items displayed in the Resources
list. This might be necessary if you change your connection without
closing the Resource Viewer window.
Display Details
Displays details about a selected entry in the Resources list. A short
description is shown in the Details area in the window. You can also
display details about an item by double-clicking on the entry in the
Resources list.
This is the default display format when you open the Resource Viewer
window.
Display Details as Property
Select this option to display details information in a properties box.
Select this option to change the default display format while the window
is open. Close the Resource Viewer window to restore the default, that is
a description is shown in the Details area.
Clear Log
Clears messages and information displayed in the Details area.
Auto Update Details on Stop
Automatically updates the Details area when any image running on the
connection stops. This gives you information about the state of the
connection when the process terminated. In multiprocessor debugging
mode, this applies across all connections.
Auto Update Automatically updates the Resources list as you change debugger
resources. Selected by default.
Close Window
Closes the Resource Viewer window.
6.6.2
Help menu
Select Help from the Resource Viewer window menu bar to display the Help menu.
This menu gives you access to the RealView Debugger online help and displays details
of your version of RealView Debugger. You can also use this menu to create and submit
a problem report.
6-24
Copyright © 2002 ARM Limited. All rights reserved.
ARM DUI 0181B
RealView Debugger Desktop
6.6.3
Resources list
The Resources list box displays all the resources available to RealView Debugger. In
single-processor debugging mode, it contains only the Conn tab showing the
connection.
In multiprocessor debugging mode, the Conn tab shows all active connections. An
asterisk (*) indicates the current connection.
If you are debugging a multithreaded application, the Resources list box displays a
series of tabs, see the chapter describing RTOS support in RealView Debugger v1.6
Extensions User Guide for details.
6.6.4
Details area
The bottom half of the Resource Viewer window displays information about a chosen
entry.
ARM DUI 0181B
Copyright © 2002 ARM Limited. All rights reserved.
6-25
RealView Debugger Desktop
6.7
Analysis window
RealView Debugger includes Trace, Analysis and Profiling for use when debugging
either single targets or multiple processes. If you have a Trace license, the Analysis
window gives you access to these features.
You can set tracepoints for a trace capture from the Code window and then use the
Analysis window to view and analyze the results of the capture. The Analysis window
provides access to most of the tracing functionality and enables you to view the captured
trace information using the available tabs.
If you are connected to an appropriate debug target, for example an ETM-enabled
ARM966 core, select View → Analysis Window from the Code window main menu. This
displays the Analysis window shown in Figure 6-17.
Figure 6-17 Analysis window
This example shows the results of a trace capture between two tracepoints during
execution of the dhrystone.axf image. The Profile tab shows execution times for
functions along with a graphical representation in the Histogram column.
To see this display, you must first configure the ETM, set up your trace options and then
execute your image. For full details on accessing Trace, Analysis and Profiling options,
and using the Analysis window, see the chapter describing tracing in RealView
Debugger v1.6 Extensions User Guide.
6-26
Copyright © 2002 ARM Limited. All rights reserved.
ARM DUI 0181B
Appendix A
Configuration Files Reference
This appendix describes the files set up for a new installation of RealView Debugger
v1.6, where they are stored, and what information each file holds. This appendix
assumes that you have chosen a Typical installation. It contains the following sections:
•
Overview on page A-2
•
Files in the etc directory on page A-3
•
Files in the home directory on page A-5.
ARM DUI 0181B
Copyright © 2002 ARM Limited. All rights reserved.
A-1
Configuration Files Reference
A.1
Overview
RealView Debugger v1.6 creates files containing default settings and target
configuration information when you first install. The files created (or modified) depend
on whether you have chosen a Typical installation or a Custom installation. If you are
upgrading from an earlier version of RealView Debugger, some files are modified so
that previous configuration information is not lost.
When you run the debugger for the first time, some of this information is copied into
the RealView Debugger v1.6 default home directory. This is an empty directory created
by the installation process. If you are upgrading from an earlier version of RealView
Debugger, the installer creates the home directory and copies your existing
configuration details into it. This means that this area is not empty when you run the
debugger for the first time.
A-2
Copyright © 2002 ARM Limited. All rights reserved.
ARM DUI 0181B
Configuration Files Reference
A.2
Files in the etc directory
When you install RealView Debugger v1.6, files containing default settings and target
configuration details are installed in install_directory\etc. What files are installed,
and their contents, depend on what other software is detected during the installation, for
example ADS 1.2:
armul.var
A list of ARMulator variants used by RealView Debugger.
You can edit this file to add hand-made variants.
Processor-specific target configuration settings used in the default board
file.
arm.brd
Do not edit this file manually.
genmake.loc
Specifies the location of the development toolchain used when working
with projects. RealView Debugger copies this file into the default home
directory (when you first create a project) or merges project details (when
you first work with an existing project).
Do not edit this file manually.
gen_arx.mk
Toolchain-specific template used by the genmake program to generate
makefiles.
You can edit this file to modify the input/output of the genmake program.
genmake_ARM_ADS.loc
Toolchain-specific makefile template used to define the location of
development tools.
Do not edit these files manually.
pARM.prc
Processor-specific information files used to define support for emulators
and simulators, and for project information.
Do not edit these files manually.
rvdebug.brd
The default board file containing target configuration settings. This file
references .bcd and .jtg files.
rvdebug.tpl
Template file containing standard templates for editing and using in
source files.
startup.mk
MSDOS DMAKE startup file.
You can edit this file if required.
targ_ARM.aco Processor-specific instruction format files used by RealView Debugger to
color assembler code in the File Editor.
ARM DUI 0181B
Copyright © 2002 ARM Limited. All rights reserved.
A-3
Configuration Files Reference
Do not edit this file manually.
template.spr SPR template used by RealView Debugger.
Do not edit this file manually.
*.bcd
Board/chip definition files supplied by hardware manufacturers.
If you want to make changes to these files, copy them into your default
home directory and edit them using the Connection Properties window.
*.jtg
JTAG configuration files for non-RDI targets.
*.stp
RealView Debugger internal template files containing debugger defaults.
These are used as internal support files or as template files for settings.
For example, to support project properties and define options such as
workspace settings.
Do not edit these files manually.
For a new installation, some of these files are copied into your RealView Debugger
default home directory when the debugger runs for the first time.
A-4
Copyright © 2002 ARM Limited. All rights reserved.
ARM DUI 0181B
Configuration Files Reference
A.3
Files in the home directory
When you install and run RealView Debugger v1.6 for the first time, files containing
default settings and target configuration details are copied into your RealView
Debugger default home directory where they can be maintained.
If you are upgrading from an earlier version of RealView Debugger, the installer creates
the home directory and copies your existing configuration details into it. This means
that this area is not empty when you run the debugger for the first time:
armreg.sig
An internal settings file that is created or updated each time you run
RealView Debugger.
Do not edit this file manually.
exphist.sav
Your personal history file. This file keeps a record of each session and
stores your personal favorites, for example breakpoints. This file is
updated at the end of each debugging session.
genmake.loc
Specifies the location of the development toolchain used when working
with projects. RealView Debugger copies this file into the default home
directory when you first create a project.
rvdebug.aws
Your default workspace settings file. For a new installation, RealView
Debugger creates this file when it runs for the first time. By default, this
file is updated at the end of each debugging session.
rvdebug.brd
Your board file containing target configuration settings. For a new
installation, this is a duplicate of the file installed in
install_directory\etc.
This file references .rbe files and .bcd files.
rvdebug.ini
Specifies global configuration settings used across all workspaces or
when working without a workspace. For a new installation, RealView
Debugger creates this file when it runs for the first time.
rvdebug.sav
This file specifies how each RealView Debugger session starts. For a new
installation, RealView Debugger creates this file the first time you close
down after performing an operation. By default, this file is updated at the
end of each debugging session.
*.auc
These are default target configuration settings files that are created when
you first run RealView Debugger, for example default.auc.
These files are referenced by the .rbe files.
ARM DUI 0181B
Copyright © 2002 ARM Limited. All rights reserved.
A-5
Configuration Files Reference
*.bcd
Board/chip definition files that you might have copied into your home
directory, from install_directory\etc, to make changes. Making copies
means that the installation files are not changed.
*.cnf
These are default target configuration settings files that are created when
you first run RealView Debugger, for example armulator.cnf.
These files are referenced by the .rbe files.
*.rbe
A.3.1
There is one .rbe configuration file for each available RDI target, for
example armulator.rbe. This file is updated when you make changes to
the RDI settings.
Backup files
When you change a configuration file, RealView Debugger makes a backup copy of the
current version to enable you to restore your previous settings, for example
rvdebug.aws.bak and rvdebug.brd.bak. By default, backup files are given the .bak
extension and are stored in the same location as the original file. You can change this
behavior in your workspace.
A-6
Copyright © 2002 ARM Limited. All rights reserved.
ARM DUI 0181B
Glossary
The items in this glossary are listed in alphabetical order, with any symbols and
numerics appearing at the end.
Address breakpoint
A type of breakpoint.
See also Breakpoint.
ADS
See ARM Developer Suite.
Angel
Angel is a software debug monitor that runs on the target and enables you to debug
applications running on ARM-based hardware. Angel is commonly used where a JTAG
emulator is not available.
ARM Developer Suite (ADS)
A suite of software development applications, together with supporting documentation
and examples, that enable you to write and debug applications for the ARM family of
RISC processors.
ARMulator
ARMulator is an instruction set simulator. It is a collection of modules that simulate the
instruction sets and architecture of various ARM processors.
ATPCS
ARM-Thumb Procedure Call Standard.
ARM DUI 0181B
Copyright © 2002 ARM Limited. All rights reserved.
Glossary-1
Glossary
AXYS Oak simulator
The AXYS Oak MaxSim simulator provides a high-end hardware/software model for
the Oak DSP Core from the DSP Group Inc. It is available from the RealView Debugger
Connection Control window if an Oak DSP license has been obtained.
Backtracing
See Stack Traceback.
Big-endian
Memory organization where the least significant byte of a word is at the highest address
and the most significant byte is at the lowest address in the word.
See also Little-endian.
Board
RealView Debugger uses the term board to refer to a target processor, memory,
peripherals, and debugger connection method.
Board file
The board file is the top-level configuration file, normally called rvdebug.brd, that
references one or more other files.
Breakpoint
A user defined point at which execution stops in order that a debugger can examine the
state of memory and registers.
See also Hardware breakpoint and Software breakpoint.
Conditional breakpoint
A breakpoint that halts execution when a particular condition becomes true. The
condition normally references the values of program variables that are in scope at the
breakpoint location.
Context menu
See Pop-up menu.
Core module
In the context of Integrator, an add-on development board that contains an ARM
processor and local memory. Core modules can run stand-alone, or can be stacked onto
Integrator motherboards.
See also Integrator.
Deprecated
A deprecated option or feature is one that you are strongly discouraged from using.
Deprecated options and features will not be supported in future versions of the product.
Doubleword
A 64-bit unit of information.
Embedded Trace Macrocell (ETM)
A block of logic, embedded in the hardware, that is connected to the address, data, and
status signals of the processor. It broadcasts branch addresses, and data and status
information in a compressed protocol through the trace port. It contains the resources
used to trigger and filter the trace output.
ETM
See Embedded Trace Macrocell.
Halfword
A 16-bit unit of information.
Glossary-2
Copyright © 2002 ARM Limited. All rights reserved.
ARM DUI 0181B
Glossary
Hardware breakpoint
A breakpoint that is implemented using non-intrusive additional hardware. Hardware
breakpoints are the only method of halting execution when the location is in Read Only
Memory (ROM). Using a hardware breakpoint often results in the processor halting
completely. This is usually undesirable for a real-time system.
See also Breakpoint and Software breakpoint.
IEEE 1149.1
The IEEE Standard that defines TAP. Commonly (but incorrectly) referred to as JTAG.
See also Test Access Port
Integrator
A range of ARM hardware development platforms. Core modules are available that
contain the processor and local memory.
Joint Test Action Group (JTAG)
An IEEE group focussed on silicon chip testing methods. Many debug and
programming tools use a Joint Test Action Group (JTAG) interface port to communicate
with processors. For further information refer to IEEE Standard, Test Access Port and
Boundary-Scan Architecture specification 1149.1 (JTAG).
JTAG
See Joint Test Action Group.
JTAG interface unit
A protocol converter that converts low-level commands from RealView Debugger into
JTAG signals to the EmbeddedICE logic and the ETM.
Little-endian
Memory organization where the least significant byte of a word is at the lowest address
and the most significant byte is at the highest address of the word.
See also Big-endian.
Multi-ICE
A JTAG-based tool for debugging embedded systems.
Pop-up menu
Also known as Context menu. A menu that is displayed temporarily, offering options
relevant to your current situation. Obtainable in most RealView Debugger windows or
panes by right-clicking with the mouse pointer inside the window. In some windows the
pop-up menu can vary according to the line the mouse pointer is on and the tabbed page
that is currently selected.
Processor core
The part of a microprocessor that reads instructions from memory and executes them,
including the instruction fetch unit, arithmetic and logic unit and the register bank. It
excludes optional coprocessors, caches, and the memory management unit.
Profiling
Accumulation of statistics during execution of a program being debugged, to measure
performance or to determine critical areas of code.
RDI
See Remote Debug Interface.
ARM DUI 0181B
Copyright © 2002 ARM Limited. All rights reserved.
Glossary-3
Glossary
RealView Compilation Tools
RealView Compilation Tools is a suite of tools, together with supporting documentation
and examples, that enables you to write and build applications for the ARM family of
RISC processors.
RealView Debugger Trace
A software product add-on to RealView Debugger that extends the debugging capability
with the addition of real-time program and data tracing.
Remote Debug Interface (RDI)
The Remote Debug Interface (RDI) is an ARM standard procedural interface between
a debugger and the debug agent. RDI gives the debugger a uniform way to communicate
with:
•
a simulator running on the host (for example, ARMulator)
•
a debug monitor running on ARM-based hardware accessed through a
communication link (for example, Angel)
•
a debug agent controlling an ARM processor through hardware debug support
(for example, Multi-ICE).
Remote_A
Remote_A is a software protocol converter and configuration interface. It converts
between the RDI 1.5 software interface of a debugger and the Angel Debug Protocol
used by Angel targets. It can communicate over a serial or Ethernet interface.
RTOS
Real Time Operating System.
RVCT
See RealView Compilation Tools.
Scan chain
A scan chain is made up of serially-connected devices that implement boundary-scan
technology using a standard JTAG TAP interface. Each device contains at least one TAP
controller containing shift registers that form the chain. Processors might contain
several shift registers to enable you to access selected parts of the device.
Scope
The range within which it is valid to access such items as a variable or a function.
Semihosting
A mechanism whereby I/O requests made in the application code are communicated to
the host system, rather than being executed on the target.
Simulator
A simulator executes non-native instructions in software (simulating a core).
Software breakpoint
A breakpoint that is implemented by replacing an instruction in memory with one that
causes the processor to take exceptional action. Because instruction memory must be
altered software breakpoints cannot be used where instructions are stored in read-only
memory. Using software breakpoints can enable interrupt processing to continue during
the breakpoint, making them more suitable for use in real-time systems.
See also Breakpoint and Hardware breakpoint.
Glossary-4
Copyright © 2002 ARM Limited. All rights reserved.
ARM DUI 0181B
Glossary
Software Interrupt (SWI)
An instruction that causes the processor to call a programmer-specified subroutine.
Used by the ARM standard C library to handle semihosting.
Stack traceback
Also called a stack backtrace, this a list of procedure or function call instances on the
current program stack. It might also include information about call parameters and local
variables for each instance.
SWI
See Software Interrupt.
TAP
See Test Access Port.
TAP Controller
Logic on a device which enables access to some or all of that device for test purposes.
The circuit functionality is defined in IEEE1149.1.
See also Test Access Port and IEEE1149.1.
Target
The target hardware, including processor, memory, and peripherals, real or simulated,
on which the target application is running.
Target Vehicle Server (TVS)
Essentially the debugger itself, this contains the basic debugging functionality. TVS
contains the run control, base multitasking support, much of the command handling,
target knowledge, such as memory mapping, lists, rule processing, board-files and .bcd
files, and data structures to track the target environment.
Test Access Port (TAP)
The port used to access the TAP Controller for a given device. Comprises TCK, TMS,
TDI, TDO, and nTRST (optional).
Tracepoint
A tracepoint can be a line of source code, a line of assembly code, or a memory address.
In RealView Debugger, you can set a variety of tracepoints to determine exactly what
program information is traced.
Tracing
The real-time recording of processor activity (including instructions and data accesses)
that occurs during program execution. Trace information can be stored either in a trace
buffer of a processor, or in an external trace hardware unit. Captured trace information
is returned to the Analysis window in RealView Debugger where it can be analyzed to
help identify a defect in program code.
Trigger
In the context of breakpoints, a trigger is the action of noticing that the breakpoint has
been reached by the target and that any associated conditions are met.
In the context of tracing, a trigger is an event that instructs the debugger to stop
collecting trace and display the trace information around the trigger position, without
halting the processor. The exact information that is displayed depends on the position
of the trigger within the buffer.
ARM DUI 0181B
Copyright © 2002 ARM Limited. All rights reserved.
Glossary-5
Glossary
TVS
See Target Vehicle Server.
Watch
A watch is a variable or expression that you require the debugger to display at every step
or breakpoint so that you can see how its value changes. The Watch pane is part of the
RealView Debugger Code window that displays the watches you have defined.
Word
A 32-bit unit of information.
Glossary-6
Copyright © 2002 ARM Limited. All rights reserved.
ARM DUI 0181B
Index
The items in this index are listed in alphabetical order, with symbols and numerics appearing at the end. The
references given are to page numbers.
A
About this book vi
Active
projects 4-11
Analysis
viewing results 6-26
Analysis window 6-26
Audience, intended vi
Auto-projects
creating for images 4-17
properties 4-17
see also Projects
B
Base directory
projects 4-9
Binding
projects 4-11
Board file 1-4, 3-4
Board-chip definition file 1-4
ARM DUI 0181B
Book, about this vi
Breakpoints 4-22
complex 4-22
setting simple 3-14
simple 4-22
Browsers 4-21
Build 4-9
changing tools 4-29
finding errors 4-33
tools location 4-4
C
Cancel command 6-15
Close down
connected 5-7
disconnected 5-7
Code views 3-15, 6-5
disassembly tab 3-15
Dsm tab 3-15
source code tab 3-15
Src tab 3-15
Code window 6-19
Actions toolbar 6-8, 6-15
Analysis window 6-26
attachment 6-4
Button toolbars 6-8, 6-15
CAPS 6-10
changing panes 6-7
Color Box 6-9
components 6-3
Cursor location field 6-10
customizing toolbars 6-17
debug views 6-5
default 3-2, 6-2, 6-3
default panes 6-5
docking panes 6-19
Editing toolbar 6-8, 6-15, 6-16
Editor Window 6-22
File Editor pane 6-5
floating panes 6-19
focus control 6-19
in-place editing 6-20
JOU 6-10
LOG 6-10
Copyright © 2002 ARM Limited. All rights reserved.
Index-1
Index
Main menu 6-11
NUM 6-10
pane controls 6-8
panes 6-5
Resource Viewer 6-23
Status line 6-10
STDIOlog 6-10
title bar 3-12, 6-3
windows and panes 6-5
Color Box 6-9
Comments
on documentation xi
on RealView Debugger xi
Concepts
debug target 1-2
DSP 1-2
multithreading 1-3
RTOS 1-2
Concepts and terminology 1-2
see also Glossary
Connect mode 3-6
Connecting 3-4, 3-5
and close down 5-7
RDI details 3-6
Connection Broker
Local mode 1-5
Remote mode 1-5
Connection Control window
managing connections 3-5
Create New Project
dialog 4-5
Create Standard Project
dialog 4-6
Customizing
panes 4-27
toolbars 6-17
windows 4-27
D
Debug target
concept 1-2
configuration 3-4
Connect mode 3-6
connecting 3-4, 3-5
Disconnect mode 5-5
disconnecting 5-5
displaying target status 3-15
Index-2
execution vehicles 1-5
interface 1-5
Processor State 3-15
reconnecting using workspace 5-8
Debug target interface 1-5
Debugging
basic tasks 4-14
getting started 3-14
tutorial 4-14
Debugging environment 1-4
Debugging mode 1-6
Desktop
Actions toolbar 6-8, 6-15
attaching windows 6-4
bottom pane 6-7
Call Stack pane 6-6
CAPS 6-10
changing panes 6-7
Code window 6-2, 6-3
Collapse Pane 6-8
Color Box 6-9
Cursor location field 6-10
customizing toolbars 6-17
Debug menu 6-14
docking panes 6-19
Edit menu 6-12
Editing toolbar 6-8, 6-16
Expand Pane 6-8
File Editor pane 6-5
File menu 6-11
Find menu 6-12
floating panes 6-19
floating toolbars 6-9
focus 6-19
formatting views 6-7
Help menu 6-14
hiding toolbars 6-9
in-place editing 6-20
JOU 6-10
LOG 6-10
Main menu 6-11
Memory pane 6-7
middle row pane 6-6
NUM 6-10
Pane Content menu 6-8
pane controls 6-8
Pane Menu 6-8
Processor State 6-16
Project menu 6-13
Register pane 6-6
side pane 6-6
splash screen 6-2
Status line 6-10
STDIOlog 6-10
tabs 6-21
Tools menu 6-13
View menu 6-12
viewing toolbars 6-8
Watch pane 6-6
Dialog box
Create New Project 4-5
Create Standard Project 4-6
Interactive Register Settings 3-8
Set Address/Data Break/Tracepoint
4-24
Directories
projects 4-10
Disassembly view 3-15
Disconnect mode 5-5
Disconnecting 5-5
and close down 5-7
Documentation
DynaText 2-5
online 2-5
PDF 2-5
structure of this book vi
using the suite 1-7
XML 2-5
Documentation feedback xi
DSP
concept 1-2
E
Editor Window 6-22
Enquiries xi
Execution vehicle
see Debug target
Exiting
RealView Debugger 5-7
F
Favorites
persistence info 5-3
Feedback
Copyright © 2002 ARM Limited. All rights reserved.
ARM DUI 0181B
Index
on documentation xi
on RealView Debugger xi
File Editor
File Editor pane 6-5
Files
adding to projects 4-31
armul.var A-3
board file 1-4, 3-4
board-chip definition 1-4
configuration A-3
genmake.loc A-3
genmake_ARM_ADS.loc A-3
gen_arx.mk A-3
installed in \etc A-3
installed in \home A-5
pARM.prc A-3
project 4-10
rvdebug.brd A-3
rvdebug.tpl A-3
startup.mk A-3
targ_ARM.aco A-3
template.spr A-4
*.auc A-5
*.aws 3-2, 5-2, A-5
*.axf 3-10, 4-11
*.bak 4-11, A-6
*.bcd 1-4, A-4, A-6
*.brd 1-4, 3-4, A-3, A-5
*.cnf A-6
*.ini A-5
*.jtg A-4
*.loc A-5
*.mk 4-9
*.prj 4-9
*.rbe A-6
*.sav 5-3, A-5
*.sig A-5
*.stp A-4
Focus
in Code window 6-19
G
Glossary Glossary-1
ARM DUI 0181B
H
Heap 3-7
History list
saving 5-3
I
Images
loading 3-10
reloading 3-12
unloading 3-13
In-place editing 6-20
focus 6-20
Intended audience vi
Interactive Register Settings
dialog 3-8
L
Loading
images 3-10
M
Makefiles
generated 4-32
Memory 4-17
setting stack and heap 3-7
setting top of memory 3-7
Menus
Debug 6-14
Edit 6-12
File 6-11
Find 6-12
Help 6-14
Main 6-11
Pane Content 6-8
Pane Menu 6-8
Pane Views 6-7
Project 6-13
Tools 6-13
View 6-12
Workspace 5-2
Mode
debugging 1-6
MSC_CLOCK
project compiler option 4-7
Multithreading
concept 1-3
N
Network Broker 1-5
P
Panes
bottom 6-7
Break/Tracepoints 4-25
Call Stack 4-20, 6-6
changing 6-7
collapsing 6-8
customizing 4-27
docking 6-19
expanding 6-8
File Editor 6-5
floating 6-19
focus 6-19
hiding 4-28
in Code window 3-2
Memory 4-17, 6-7
middle row 6-6
multiple 4-27
Process Control 4-16
Register 3-9, 4-14, 6-6
side 6-6
Watch 4-22, 6-6
PC 3-11
Persistence info 1-5, 5-2, 5-4
favorites 5-3
files A-5
Problem solving xi
Processor State 3-15
Product feedback xi
Program Counter 3-11
Projects
active 4-11
adding files 4-31
assembler settings summary 4-30
associated images 4-16
auto-projects 4-17
base directory 4-9
Copyright © 2002 ARM Limited. All rights reserved.
Index-3
Index
binding 4-11
bound 6-4
build errors 4-33
build tools 4-4, 4-29
building applications 4-9
closing projects 4-11
compiler options 4-7, 4-8
compiler settings summary 4-30
files 4-10
generated makefiles 4-32
getting started 4-3, 4-29
linker settings summary 4-30
new projects 4-3
properties 4-7
unbound 6-4
Q
Queries xi
R
RDI
connection details 3-6
Real Time Operating Systems 1-2
RealView Debugger
closing down 5-7
Code window 3-2, 6-2, 6-3
components 1-4
concepts 1-2
connecting to a target 3-4
debug target interface 1-5
debugging mode 1-6
desktop 6-2
environment 1-4
exiting 5-7
image loading 3-10
image reloading 3-12
image unloading 3-13
introduction 1-2
persistence info 1-5
projects 4-3, 4-29
start debugging 3-14
starting 3-2
stopping 5-7
target configuration 3-4
tutorial 4-2
Index-4
TVS 1-4
using the documentation 1-7
window attachment 6-4
Registers 4-14
Reloading
images 3-12
Resource Viewer 6-23
RTOS 1-2
concept 1-2
threads 1-3
viewing resources 6-23
S
Save
session 5-2
Settings options 5-4
Session
history list 5-3
saving 5-2
Settings options 5-4
startup file 5-3
workspace 5-2
Set Address/Data Break/Tracepoint
dialog 4-24
Software Problem Report xi, 6-14
Source view 3-15
SPR
see Software Problem Report
Stack 3-7
Starting
debugging 3-14
RealView Debugger 3-2
Starting the tutorial 4-2
Startup file
saving 5-3
Structure of this book vi
T
Tabbed pages 6-21
Tabs 6-21
Target
see Debug target
Target Vehicle Server (TVS) 1-4
Terminology Glossary-1
Terminology and concepts 1-2
Threads 1-3
Toolbars
Actions 6-15
Build group 6-16
Command cancel 6-15
Connection button 6-15
Context controls 6-15
customizing 6-17
Edit group 6-15
Editing 6-16
Execution group 6-15
File field 6-16
File group 6-15
Find field 6-17
Image load group 6-15
Line number field 6-17
Pane Management controls 6-16
Processor State group 6-16
Source control button 6-17
Threads button 6-16
Tooltip Evaluation 4-19
Top of memory 3-7
Trace
profiling 6-26
viewing results 6-26
Tutorial
breakpoints 4-22
building applications 4-9
changing memory contents 4-18
closing projects 4-11
conditional breakpoints 4-23
custom panes 4-27
debugging tasks 4-14
deleting 4-35
displaying memory 4-17
displaying registers 4-14
finding build errors 4-33
generated makefiles 4-32
getting started 4-2
hiding panes 4-28
how to use 4-2
managing breakpoints 4-25
multiple panes 4-27
process control 4-16
project base directory 4-9
project files 4-10
project properties 4-7, 4-30
setting compiler options 4-7, 4-8
setting up a project 4-3, 4-29
Copyright © 2002 ARM Limited. All rights reserved.
ARM DUI 0181B
Index
setting watches 4-21
using browsers 4-21
using the call stack 4-20
using tooltip evaluation 4-19
U
Unloading
images 3-13
V
Views
code 3-15
W
Watches 4-21
Who should read this book vi
Windows
Analysis 6-26
attachment 3-12, 6-4
Build-Tool Properties 4-4
Code 3-2
Configuration Summary 4-30
Connection Control 3-4
docking 6-19
Editor 6-22
floating 6-19
focus 6-19
Project Properties 4-7
Resource Viewer 6-23
Workspace
connection details 5-5, 5-7, 5-8
saving 5-2
ARM DUI 0181B
Copyright © 2002 ARM Limited. All rights reserved.
Index-5
Index
Index-6
Copyright © 2002 ARM Limited. All rights reserved.
ARM DUI 0181B