1
DECnet/OSI for VMS
Common Trace Facility Use
Part Number: AA–PHEBB–TE
August 1992
Revision/Update Information:
This is a revised manual.
Software Version:
DECnet/OSI for VMS Version 5.5
Operating System Version:
VMS Version 5.5 and later
Digital Equipment Corporation
Maynard, Massachusetts
August 1992
The information in this document is subject to change without notice and should not be construed
as a commitment by Digital Equipment Corporation. Digital Equipment Corporation assumes no
responsibility for any errors that may appear in this document.
The software described in this document is furnished under a license and may be used or copied
only in accordance with the terms of such license.
No responsibility is assumed for the use or reliability of software on equipment that is not supplied
by Digital Equipment Corporation or its affiliated companies.
Restricted Rights: Use, duplication, or disclosure by the U.S. Government is subject to restrictions
as set forth in subparagraph (c)(1)(ii) of the Rights in Technical Data and Computer Software
clause at DFARS 252.227-7013.
© Digital Equipment Corporation 1992.
All Rights Reserved.
The postpaid Reader’s Comments forms at the end of this document request your critical evaluation
to assist in preparing future documentation.
The following are trademarks of Digital Equipment Corporation: DDCMP, DEC, DECnet,
DECrouter, DECUS, DECvoice, DNA, MASSBUS, MicroVAX, Packetnet, PDP, Q–bus, Q22–bus,
RSX, ULTRIX, UNIBUS, VAX, VAXcluster, VMS, VT, and the DIGITAL Logo.
This document was prepared using VAX DOCUMENT, Version 2.0.
Contents
Preface . . . . . . . . . . . . . . . . . . . . . . . . . . . . . . . . . . . . . . . . . . . . . . . . . . . . . . . . . . . .
vii
1 Introduction to CTF
1.1
1.2
1.3
What Is CTF? . . . . . . . . . . . . . . . . . . . . . . . . . . . . . . . . . . . . . . . . . . . . . . .
How Does CTF Work? . . . . . . . . . . . . . . . . . . . . . . . . . . . . . . . . . . . . . . . .
Networking Products that Support CTF . . . . . . . . . . . . . . . . . . . . . . . . . .
1–1
1–1
1–2
2 Technical Overview
2.1
2.1.1
2.2
2.2.1
2.2.2
2.2.3
2.2.4
2.3
2.3.1
2.3.2
2.4
2.5
Tracepoints and Trace Records . . . . . . . . . . . . .
Local and Remote Tracepoints . . . . . . . . . .
How CTF Collects and Displays Trace Records
Detached Tracing . . . . . . . . . . . . . . . . . . . .
Live Tracing . . . . . . . . . . . . . . . . . . . . . . . .
Snapshot Tracing . . . . . . . . . . . . . . . . . . . .
Restrictions on Tracing . . . . . . . . . . . . . . .
CTF Structure . . . . . . . . . . . . . . . . . . . . . . . . .
CTF Support on VMS Systems . . . . . . . . . .
CTF Support on Remote Servers . . . . . . . .
CTF Files . . . . . . . . . . . . . . . . . . . . . . . . . . . . .
An Example of Trace Output . . . . . . . . . . . . . .
.
.
.
.
.
.
.
.
.
.
.
.
.
.
.
.
.
.
.
.
.
.
.
.
.
.
.
.
.
.
.
.
.
.
.
.
.
.
.
.
.
.
.
.
.
.
.
.
.
.
.
.
.
.
.
.
.
.
.
.
.
.
.
.
.
.
.
.
.
.
.
.
.
.
.
.
.
.
.
.
.
.
.
.
.
.
.
.
.
.
.
.
.
.
.
.
.
.
.
.
.
.
.
.
.
.
.
.
.
.
.
.
.
.
.
.
.
.
.
.
.
.
.
.
.
.
.
.
.
.
.
.
.
.
.
.
.
.
.
.
.
.
.
.
.
.
.
.
.
.
.
.
.
.
.
.
.
.
.
.
.
.
.
.
.
.
.
.
.
.
.
.
.
.
.
.
.
.
.
.
.
.
.
.
.
.
.
.
.
.
.
.
.
.
.
.
.
.
.
.
.
.
.
.
.
.
.
.
.
.
.
.
.
.
.
.
.
.
.
.
.
.
.
.
.
.
.
.
.
.
.
.
.
.
.
.
.
.
.
.
.
.
.
.
.
.
.
.
.
.
.
.
2–1
2–2
2–2
2–3
2–3
2–3
2–4
2–4
2–5
2–6
2–7
2–8
Introduction . . . . . . . . . . . . . . . . . . . . . . . . . . . . . .
System Requirements . . . . . . . . . . . . . . . . . . . . . .
Startup Procedure . . . . . . . . . . . . . . . . . . . . . .
System Resources . . . . . . . . . . . . . . . . . . . . . . .
User Requirements . . . . . . . . . . . . . . . . . . . . . . . .
Keypad Definitions . . . . . . . . . . . . . . . . . . . . . .
Running the TRACE Utility . . . . . . . . . . . . . . . . . .
Tracing Phase IV Products . . . . . . . . . . . . . . . .
Starting and Stopping Collection of Trace Records .
Tracepoint Names . . . . . . . . . . . . . . . . . . . . . .
Using Wildcards in Tracepoint Names . . . .
Starting Detached Tracing . . . . . . . . . . . . . . . .
Starting Live Tracing . . . . . . . . . . . . . . . . . . . .
Starting Snapshot Tracing . . . . . . . . . . . . . . . .
Stopping Tracing . . . . . . . . . . . . . . . . . . . . . . .
Displaying Trace Records . . . . . . . . . . . . . . . . . . . .
Controlling Output During Live Tracing . . . . .
Displaying the Contents of Trace Files . . . . . . .
Defining Key Sequences for CTF Commands . . . . .
.
.
.
.
.
.
.
.
.
.
.
.
.
.
.
.
.
.
.
.
.
.
.
.
.
.
.
.
.
.
.
.
.
.
.
.
.
.
.
.
.
.
.
.
.
.
.
.
.
.
.
.
.
.
.
.
.
.
.
.
.
.
.
.
.
.
.
.
.
.
.
.
.
.
.
.
.
.
.
.
.
.
.
.
.
.
.
.
.
.
.
.
.
.
.
.
.
.
.
.
.
.
.
.
.
.
.
.
.
.
.
.
.
.
.
.
.
.
.
.
.
.
.
.
.
.
.
.
.
.
.
.
.
.
.
.
.
.
.
.
.
.
.
.
.
.
.
.
.
.
.
.
.
.
.
.
.
.
.
.
.
.
.
.
.
.
.
.
.
.
.
.
.
.
.
.
.
.
.
.
.
.
.
.
.
.
.
.
.
.
.
.
.
.
.
.
.
.
.
.
.
.
.
.
.
.
.
.
.
.
.
.
.
.
.
.
.
.
.
.
.
.
.
.
.
.
.
.
.
.
.
.
.
.
.
.
.
.
.
.
.
.
.
.
.
.
.
.
.
.
.
.
.
.
.
.
.
.
.
.
.
.
.
.
.
.
.
.
.
.
.
.
.
.
.
.
.
.
.
.
.
.
.
.
.
.
.
.
.
.
.
.
.
.
.
.
.
.
.
.
.
.
.
.
.
.
.
.
.
.
.
.
.
.
.
.
.
.
.
.
.
.
.
.
.
.
.
.
.
.
.
.
.
.
.
.
.
.
.
.
.
.
3–1
3–1
3–2
3–2
3–2
3–3
3–3
3–4
3–4
3–5
3–5
3–6
3–7
3–7
3–8
3–8
3–8
3–10
3–10
3 Using CTF
3.1
3.2
3.2.1
3.2.2
3.3
3.3.1
3.4
3.4.1
3.5
3.5.1
3.5.1.1
3.5.2
3.5.3
3.5.4
3.5.5
3.6
3.6.1
3.6.2
3.7
iii
3.8
3.9
3.9.1
3.9.2
Filtering . . . . . . . . . . . . . . . . . . . . . . . . . .
Problems Running CTF . . . . . . . . . . . . . .
Loss of Trace Records . . . . . . . . . . . . .
Failure to Connect to Remote Servers
.
.
.
.
.
.
.
.
.
.
.
.
.
.
.
.
.
.
.
.
.
.
.
.
.
.
.
.
.
.
.
.
.
.
.
.
.
.
.
.
.
.
.
.
.
.
.
.
.
.
.
.
.
.
.
.
.
.
.
.
.
.
.
.
.
.
.
.
.
.
.
.
.
.
.
.
.
.
.
.
.
.
.
.
.
.
.
.
.
.
.
.
.
.
.
.
.
.
.
.
3–12
3–13
3–13
3–13
4 CTF Commands
4.1
Using the CTF Keypad
ANALYZE . . . . . . . . . .
ATTACH . . . . . . . . . . .
BACK . . . . . . . . . . . . . .
CLEAR . . . . . . . . . . . . .
COLLECT . . . . . . . . . .
DEFINE/KEY . . . . . . . .
DELETE/KEY . . . . . . .
EXIT . . . . . . . . . . . . . .
HELP . . . . . . . . . . . . . .
REFRESH . . . . . . . . . .
SHOW KEY . . . . . . . . .
SPAWN . . . . . . . . . . . .
START . . . . . . . . . . . . .
STOP . . . . . . . . . . . . . .
.
.
.
.
.
.
.
.
.
.
.
.
.
.
.
.
.
.
.
.
.
.
.
.
.
.
.
.
.
.
.
.
.
.
.
.
.
.
.
.
.
.
.
.
.
.
.
.
.
.
.
.
.
.
.
.
.
.
.
.
.
.
.
.
.
.
.
.
.
.
.
.
.
.
.
.
.
.
.
.
.
.
.
.
.
.
.
.
.
.
.
.
.
.
.
.
.
.
.
.
.
.
.
.
.
.
.
.
.
.
.
.
.
.
.
.
.
.
.
.
.
.
.
.
.
.
.
.
.
.
.
.
.
.
.
.
.
.
.
.
.
.
.
.
.
.
.
.
.
.
.
.
.
.
.
.
.
.
.
.
.
.
.
.
.
.
.
.
.
.
.
.
.
.
.
.
.
.
.
.
.
.
.
.
.
.
.
.
.
.
.
.
.
.
.
.
.
.
.
.
.
.
.
.
.
.
.
.
.
.
.
.
.
.
.
.
.
.
.
.
.
.
.
.
.
.
.
.
.
.
.
.
.
.
.
.
.
.
.
.
.
.
.
.
.
.
.
.
.
.
.
.
.
.
.
.
.
.
.
.
.
.
.
.
.
.
.
.
.
.
.
.
.
.
.
.
.
.
.
.
.
.
.
.
.
.
.
.
.
.
.
.
.
.
.
.
.
.
.
.
.
.
.
.
.
.
.
.
.
.
.
.
.
.
.
.
.
.
.
.
.
.
.
.
.
.
.
.
.
.
.
.
.
.
.
.
.
.
.
.
.
.
.
.
.
.
.
.
.
.
.
.
.
.
.
.
.
.
.
.
.
.
.
.
.
.
.
.
.
.
.
.
.
.
.
.
.
.
.
.
.
.
.
.
.
.
.
.
.
.
.
.
.
.
.
.
.
.
.
.
.
.
.
.
.
.
.
.
.
.
.
.
.
.
.
.
.
.
.
.
.
.
.
.
.
.
.
.
.
.
.
.
.
.
.
.
.
.
.
.
.
.
.
.
.
.
.
.
.
.
.
.
.
.
.
.
.
.
.
.
.
.
.
.
.
.
.
.
.
.
.
.
.
.
.
.
.
.
.
.
.
.
.
.
.
.
.
.
.
.
.
.
.
.
.
.
.
.
.
.
.
.
.
.
.
.
.
.
.
.
.
.
.
.
.
.
.
.
.
.
.
.
.
.
.
.
.
.
.
.
.
.
.
.
.
.
.
.
.
.
.
.
.
.
.
.
.
.
.
.
.
.
.
.
.
.
.
.
.
.
.
.
.
.
.
.
.
.
.
.
.
.
.
.
.
.
.
.
.
.
.
.
.
.
.
4–1
4–2
4–6
4–7
4–8
4–9
4–10
4–12
4–13
4–14
4–15
4–16
4–17
4–19
4–24
A DEC WANrouter 100/500 Tracepoints
MODEM_CONNECT LINE
DDCMP LINK . . . . . . . . . .
HDLC LINK . . . . . . . . . . .
LAPB LINK . . . . . . . . . . . .
CSMA-CD STATION . . . . .
CSMA-CD PORT . . . . . . . .
X25L3 DTE . . . . . . . . . . . .
X25L3 CIRCUIT . . . . . . . .
ROUTING CIRCUIT . . . . .
NSP PORT . . . . . . . . . . . . .
.
.
.
.
.
.
.
.
.
.
.
.
.
.
.
.
.
.
.
.
.
.
.
.
.
.
.
.
.
.
.
.
.
.
.
.
.
.
.
.
.
.
.
.
.
.
.
.
.
.
.
.
.
.
.
.
.
.
.
.
.
.
.
.
.
.
.
.
.
.
.
.
.
.
.
.
.
.
.
.
.
.
.
.
.
.
.
.
.
.
.
.
.
.
.
.
.
.
.
.
.
.
.
.
.
.
.
.
.
.
.
.
.
.
.
.
.
.
.
.
.
.
.
.
.
.
.
.
.
.
.
.
.
.
.
.
.
.
.
.
.
.
.
.
.
.
.
.
.
.
.
.
.
.
.
.
.
.
.
.
.
.
.
.
.
.
.
.
.
.
.
.
.
.
.
.
.
.
.
.
.
.
.
.
.
.
.
.
.
.
.
.
.
.
.
.
.
.
.
.
.
.
.
.
.
.
.
.
.
.
.
.
.
.
.
.
.
.
.
.
.
.
.
.
.
.
.
.
.
.
.
.
.
.
.
.
.
.
.
.
.
.
.
.
.
.
.
.
.
.
.
.
.
.
.
.
.
.
.
.
.
.
.
.
.
.
.
.
.
.
.
.
.
.
.
.
.
.
.
.
.
.
.
.
.
.
.
.
.
.
.
.
.
.
.
.
.
.
.
.
.
.
.
.
.
.
.
.
.
.
.
.
.
.
.
.
.
.
.
.
.
.
.
.
.
.
.
.
.
.
.
.
.
.
.
.
.
.
.
.
.
.
.
.
.
.
.
.
.
.
.
.
.
.
.
.
.
.
.
.
A–2
A–3
A–4
A–5
A–6
A–8
A–9
A–10
A–11
A–14
.
.
.
.
.
.
.
.
.
.
.
.
.
.
.
.
.
.
.
.
.
.
.
.
.
.
.
.
.
.
.
.
.
.
.
.
.
.
.
.
.
.
.
.
.
.
.
.
.
.
.
.
.
.
.
.
.
.
.
.
.
.
.
.
.
.
.
.
.
.
.
.
.
.
.
.
.
.
.
.
.
.
.
.
.
.
.
.
.
.
.
.
.
.
.
.
.
.
.
.
.
.
.
.
.
.
.
.
.
.
.
.
.
.
.
.
.
.
.
.
.
.
.
.
.
.
.
.
.
.
.
.
.
.
.
.
.
.
.
.
.
.
.
.
.
.
.
.
.
.
.
.
.
.
.
.
.
.
.
.
.
.
.
.
.
.
.
.
.
.
.
.
.
.
.
.
.
.
.
.
B–2
B–3
B–4
B–6
B–7
B VAX P.S.I. Tracepoints
LAPB LINK . . . . .
LLC2 SAP LINK .
X25L3 DTE . . . . .
X25L3 CIRCUIT .
X25GAP CIRCUIT
iv
.
.
.
.
.
.
.
.
.
.
.
.
.
.
.
.
.
.
.
.
.
.
.
.
.
.
.
.
.
.
.
.
.
.
.
C VAX WAN Device Driver Tracepoints
MODEM_CONNECT LINE
DDCMP LINK . . . . . . . . . .
HDLC LINK . . . . . . . . . . .
LAPB LINK . . . . . . . . . . . .
.
.
.
.
.
.
.
.
.
.
.
.
.
.
.
.
.
.
.
.
.
.
.
.
.
.
.
.
.
.
.
.
.
.
.
.
.
.
.
.
.
.
.
.
.
.
.
.
.
.
.
.
.
.
.
.
.
.
.
.
.
.
.
.
.
.
.
.
.
.
.
.
.
.
.
.
.
.
.
.
.
.
.
.
.
.
.
.
.
.
.
.
.
.
.
.
.
.
.
.
.
.
.
.
.
.
.
.
.
.
.
.
.
.
.
.
.
.
.
.
.
.
.
.
.
.
.
.
.
.
.
.
.
.
.
.
.
.
.
.
.
.
.
.
C–2
C–3
C–5
C–6
.
.
.
.
.
.
.
.
.
.
.
.
.
.
.
.
.
.
.
.
.
.
.
.
.
.
.
.
.
.
.
.
.
.
.
.
.
.
.
.
.
.
.
.
.
.
.
.
.
.
.
.
.
.
.
.
.
.
.
.
.
.
.
.
.
.
.
.
.
.
.
.
.
.
.
.
.
.
.
.
.
.
.
.
.
.
.
.
.
.
.
.
.
.
.
.
.
.
.
.
.
.
.
.
.
.
.
.
.
.
.
.
.
.
.
.
.
.
.
.
.
.
.
.
.
.
.
.
.
.
.
.
.
.
.
.
.
.
.
.
.
.
.
.
.
.
.
.
.
.
.
.
.
.
.
.
.
.
.
.
.
.
.
.
.
.
.
.
.
.
D–2
D–4
D–6
D–9
D–11
Trace Records . . . . . . . . . . . . . . . . . . . . . . . . . . . . . . . . . . . . . . . . . . . .
Live Tracing on VMS Systems and Remote Servers . . . . . . . . . . . . . . .
Detached Tracing on VMS Systems and Remote Servers . . . . . . . . . . .
2–2
2–5
2–6
D DECnet/OSI for VMS Tracepoints
MOP . . . . . . . . . . . . . . . . .
NSP Transport . . . . . . . . .
OSI_TRANSPORT PORT .
ROUTING CIRCUIT . . . .
Session Control . . . . . . . .
.
.
.
.
.
.
.
.
.
.
.
.
.
.
.
Index
Figures
2–1
2–2
2–3
Tables
2–1
3–1
3–2
4–1
A–1
A–2
A–3
A–4
A–5
A–6
A–7
A–8
A–9
A–10
B–1
B–2
B–3
B–4
B–5
C–1
C–2
C–3
CTF Files . . . . . . . . . . . . . . . . . . . . . . . . . . . . . . . . . . . . . . . . . .
Identifiers in the Rights Database . . . . . . . . . . . . . . . . . . . . . . .
Default CTF Keys . . . . . . . . . . . . . . . . . . . . . . . . . . . . . . . . . . .
Summary of CTF Commands . . . . . . . . . . . . . . . . . . . . . . . . . . .
MODEM_CONNECT LINE Trace Events for DEC WANrouter .
DDCMP LINK Trace Events for DEC WANrouter . . . . . . . . . . .
HDLC LINK Trace Events for DEC WANrouter . . . . . . . . . . . .
LAPB LINK Trace Events for DEC WANrouter . . . . . . . . . . . . .
CSMA-CD STATION Trace Events for DECnet–VAX . . . . . . . . .
CSMA-CD PORT Trace Events for DECnet–VAX . . . . . . . . . . . .
X.25 DTE Trace Events for VAX P.S.I. . . . . . . . . . . . . . . . . . . . .
X.25L3 CIRCUIT Trace Events for VAX P.S.I. . . . . . . . . . . . . . .
ROUTING CIRCUIT Trace Events for DEC WANrouter . . . . . .
NSP PORT Trace Events for DEC WANrouter . . . . . . . . . . . . . .
LAPB LINK Trace Events for VAX P.S.I. . . . . . . . . . . . . . . . . . .
LLC2 SAP LINK Trace Events for VAX P.S.I. . . . . . . . . . . . . . .
X.25 DTE Trace Events for VAX P.S.I. . . . . . . . . . . . . . . . . . . . .
X.25L3 CIRCUIT Trace Events for VAX P.S.I. . . . . . . . . . . . . . .
X25GAP CIRCUIT Trace Events for VAX P.S.I. . . . . . . . . . . . . .
MODEM_CONNECT LINE Trace Events for VAX WAN Device
Drivers . . . . . . . . . . . . . . . . . . . . . . . . . . . . . . . . . . . . . . . . . . . .
DDCMP LINK Trace Events for VAX WAN Device Drivers . . . .
HDLC LINK Trace Events for VAX WAN Device Drivers . . . . . .
.
.
.
.
.
.
.
.
.
.
.
.
.
.
.
.
.
.
.
.
.
.
.
.
.
.
.
.
.
.
.
.
.
.
.
.
.
.
.
.
.
.
.
.
.
.
.
.
.
.
.
.
.
.
.
.
.
.
.
.
.
.
.
.
.
.
.
.
.
.
.
.
.
.
.
.
.
.
.
.
.
.
.
.
.
.
.
.
.
.
.
.
.
.
.
2–7
3–3
3–12
4–1
A–2
A–3
A–4
A–5
A–6
A–8
A–9
A–10
A–11
A–14
B–2
B–3
B–4
B–6
B–7
.....
.....
.....
C–2
C–3
C–5
v
C–4
D–1
D–2
D–3
D–4
vi
LAPB LINK Trace Events for VAX WAN Device Drivers . .
MOP Trace Events for DECnet–VAX . . . . . . . . . . . . . . . . .
OSI_TRANSPORT PORT Trace Events for OSI Transport
Software . . . . . . . . . . . . . . . . . . . . . . . . . . . . . . . . . . . . . . .
ROUTING CIRCUIT Trace Events for DECnet–VAX . . . . .
SESSION PORT Trace Events for DECnet–VAX . . . . . . . .
.........
.........
C–6
D–2
.........
.........
.........
D–6
D–9
D–11
Preface
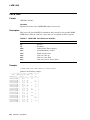
This manual describes how you use the Common Trace Facility (CTF) utility to
collect and analyze protocol data from networking software.
Audience
This manual is intended for the system or network manager who must carry out
problem solving tasks on a DECnet/OSI for VMS network. You should be familiar
with:
•
The VMS operating system
•
DECnet/OSI for VMS
•
The networking product(s) that you are tracing. In particular, you should
have a detailed understanding of the protocols used by these networking
products.
The Structure of the Manual
This manual has four chapters and four appendixes:
•
Chapter 1 is an introduction to CTF.
•
Chapter 2 describes the components of CTF, and how these components collect
and display data.
•
Chapter 3 describes the functions provided by the CTF user interface.
•
Chapter 4 describes the use of each of the CTF commands that make up the
CTF user interface.
•
Appendix A describes the tracepoints provided by DEC WANrouter 100/500
software.
•
Appendix B describes the tracepoints provided by VAX Packetnet System
Interface (P.S.I.) software.
•
Appendix C describes the tracepoints provided by the VAX Wide Area
Network (WAN) Device Drivers software.
•
Appendix D describes the tracepoints provided by the OSI Transport software.
Associated Manuals
The DECnet/OSI for VMS Network Management manual describes the network
management model; you should be familiar with this model, particularly with the
structure of entity names, since most of the tracepoint names that CTF uses are
based on entity names.
vii
You should be familiar with the problem solving documentation for the software
you are tracing. This documentation contains detailed instructions about how to
use CTF to diagnose problems.
Conventions Used in This Manual
viii
Special
type
in examples indicates text that the system displays or user input.
UPPERCASE
in a command represent text that you have to enter as shown.
lowercase
italics
indicate variable information that you supply.
[
in a command definition, enclose parts of the command that you can omit.
]
key
indicates a named key on the keyboard; for example, Return .
Ctrl/x
is the symbol used to represent the pressing of a control key. Hold down
the key marked Ctrl and press the appropriate key.
1
Introduction to CTF
This chapter provides a brief introduction to the Common Trace Facility (CTF).
For a more detailed description of the components and functions of CTF, see
Chapter 2.
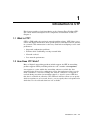
1.1 What Is CTF?
CTF is a VMS utility that assists in network problem solving. CTF allows you to
collect and display information about specific protocol exchanges between systems
in a network. This information is often very useful when attempting to solve such
problems as:
•
Suspected configuration problems
•
Failures while establishing or using network links
•
Network overload
•
Poor network performance
1.2 How Does CTF Work?
Many of Digital’s networking products include support for CTF. A networking
product supports CTF by including within its code a number of tracepoints.
A tracepoint is a point within the networking software at which the data
currently being processed (a combination of user data and protocol data) can be
made available to a user for recording and analysis. Whenever a tracepoint is
reached during execution of networking software, a signal is sent to CTF that
this data is available for collection. The CTF user interface allows you to specify
which tracepoints are to be traced; that is, you can specify those tracepoints from
which data is to be collected whenever it is available.
Introduction to CTF 1–1
When data becomes available at a tracepoint that you are tracing, CTF collects
that data in the form of a trace record. The trace record consists of the data
itself (user data and protocol data), together with additional information about
the trace record, such as:
•
Its size
•
The time at which it was collected
•
The name of the tracepoint from which it was collected
Depending on how you are using CTF, trace records may either be written to a
trace file for later analysis, or they may be displayed on your terminal as they
are collected.
When you display trace records (either as they are collected, or from a previously
created trace file), they are analyzed. This analysis involves:
•
Translating the binary data in the trace record into a user-readable format,
which may be ASCII, hexadecimal, or octal
•
Formatting the data to show the various components of protocol data, user
data, and trace record information
The analysis performed on a trace record depends on the tracepoint from which
it was collected. The routines that analyze trace records are supplied with the
networking software that supports the tracepoints from which they are collected,
and form part of that product’s CTF support.
1.3 Networking Products that Support CTF
You can only use CTF on Digital’s networking products. The tracepoints from
which you can collect information depend on the product you are tracing. Not
all Digital’s networking products have tracepoints; check the Software Product
Description to see if your product supports CTF.
The following networking products support CTF:
DECnet/OSI for VMS
DEC WANrouter 100/500
VAX P.S.I. for DECnet/OSI for VMS
VAX WAN Device Drivers for DECnet/OSI for VMS
See the appendixes to this manual for details of the tracepoints that are provided
by these products.
1–2 Introduction to CTF
2
Technical Overview
This chapter provides a brief technical overview of CTF.
Section 2.1 describes what tracepoints are, and describes the contents of trace
records.
Section 2.2 describes the various ways in which CTF can collect trace records
from tracepoints.
Section 2.3 describes the components of CTF that collect, store, and display trace
records.
Section 2.4 lists the files that CTF uses.
Section 2.5 provides an example of the trace output provided by CTF.
2.1 Tracepoints and Trace Records
Each networking software product that supports CTF has a number of named
tracepoints built into the software. A tracepoint usually records network protocol
data as it passes from one protocol layer to another.
When a tracepoint is reached during execution, the networking software
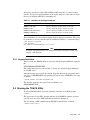
generates a trace record that contains:
•
A trace event code, which indicates the type of event (for example, receive or
transmit) that caused the trace record to be generated. Each tracepoint has
a defined set of events that can cause a trace record to be generated at that
tracepoint.
•
The size of the trace record
•
The time at which the trace record was generated
•
The name of the tracepoint at which the trace record was generated
•
Tracepoint-specific context information
•
The network protocol data itself, consisting of the protocol-specific header and
user data.
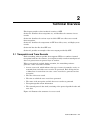
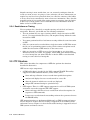
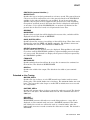
Figure 2–1 illustrates the structure of a trace record.
Technical Overview 2–1
Figure 2–1 Trace Records
Protocol header information
from protocol layers
Trace record data:
event code
size
time
tracepoint name
context data
User data
Network protocol data
2.1.1 Local and Remote Tracepoints
There are two types of tracepoint:
•
Local tracepoints are those found within host-based VMS networking products
such as VAX P.S.I.
•
Remote tracepoints are those found within server-based networking products
such as the DEC WANrouter 100/500.
Using CTF from a VMS system, you can trace:
•
All local tracepoints
•
All remote tracepoints on servers for which the VMS system is a load host
For security reasons, you cannot trace tracepoints on remote VMS systems.
2.2 How CTF Collects and Displays Trace Records
When networking software generates a trace record, it calls CTF to signal that a
trace record is available for collection.
If you have instructed CTF to collect trace records from this tracepoint, CTF
collects the trace record; otherwise, CTF ignores the trace record, which is
therefore lost.
Collecting a trace record involves:
1. Copying the trace record from the network software that generated it into an
internal CTF buffer.
2. Making the contents of the trace record available to the user. Since the trace
record is produced in machine-readable form, it must be analyzed (that is,
formatted into user-readable form) before it can be printed or displayed.
There are three ways in which CTF collects trace records and makes them
available to the user: detached tracing, live tracing, and snapshot tracing.
2–2 Technical Overview
2.2.1 Detached Tracing
In detached tracing, trace records are collected from one or more tracepoints into
an internal CTF buffer, and are then written to a trace file. Note that the trace
records in a trace file have not been analyzed; they are still in binary format, and
are therefore unsuitable for display or printing. You can use CTF commands to
analyze and display the contents of a trace file.
Detached tracing is so called because a separate process called the trace server
process is created to collect the trace records from tracepoints and write them to
the trace file.
You should use detached tracing:
•
If you have a large quantity of trace records to collect
•
If you will be tracing for long periods
•
If you want to save trace records and examine them at a later date
An advantage of detached tracing is that you can exit from CTF but leave the
trace server process running, thus freeing your terminal for other tasks while
trace records are still being collected.
2.2.2 Live Tracing
In live tracing, trace records are collected into an internal CTF buffer and are
immediately analyzed and displayed on your terminal.
You should use live tracing only when you have a small amount of trace data to
collect and you do not wish to keep the trace data for later analysis. It is also
helpful if you can anticipate roughly when the trace records you are interested in
will be generated; this will reduce the amount of trace output that you need to
collect before finding the particular trace records you are interested in.
Due to the difference in speed between the file output performed by detached
tracing and the screen output performed by live tracing, it is possible that you
will lose trace records when live tracing if they are generated faster than they
can be collected and displayed. CTF will inform you if trace records are being
lost. If this happens, you should consider using detached tracing instead.
2.2.3 Snapshot Tracing
In snapshot tracing, trace records are collected from one or more tracepoints into
an internal CTF buffer, as in the case of detached and live tracing. However,
unlike detached and live tracing the collected trace records are neither written to
a trace file nor displayed on your terminal. The CTF buffer simply holds the trace
records as they are collected. When the buffer becomes full, new trace records
overwrite the oldest trace records in the buffer. The CTF buffer is therefore a
circular buffer whose contents represent a ‘‘snapshot’’ of the most recent history
of tracing.
At any point during snapshot tracing you can issue a CTF command that will
either:
•
Write the current contents of the buffer to a trace file (if you are performing
detached tracing). You can then analyze the contents of the trace file as you
would for a trace file that had been produced by detached tracing.
•
Display the contents of the buffer on your terminal (if you are performing live
tracing).
Technical Overview 2–3
Snapshot tracing is most useful when you can accurately anticipate when the
events you want to trace are going to occur; otherwise, the trace information you
require may not have been generated when you collect the contents of the buffer,
or it may have been overwritten by more recent trace information. Note also that
snapshot tracing is less useful when tracing remote tracepoints, since the buffer
in this case is on the remote server and holds less trace information than the
buffer on the local VMS system.
2.2.4 Restrictions on Tracing
You can perform live, detached, or snapshot tracing on both local and remote
tracepoints. However, you should note the following restrictions:
•
You can perform only one type of tracing within a single invocation of CTF;
that is, you cannot mix detached, live, and snapshot tracing within the same
invocation of CTF.
•
You cannot perform both local and remote tracing within the same invocation
of CTF.
•
Only one system can be traced within a single invocation of CTF. This means
that if you are performing remote tracing, all the remote tracepoints traced
within that invocation of CTF must be on the same server.
•
Only one invocation of CTF can trace local tracepoints at any given time.
This means that you cannot, for example, invoke CTF, start detached tracing
on a local tracepoint, exit from CTF, then re-invoke CTF to start detached
tracing on some other local tracepoint.
2.3 CTF Structure
This section describes the components of CTF that perform the functions
described in Section 2.2.
CTF has two major components:
•
A VMS utility that is invoked by the DCL command TRACE. This utility
supports the CTF command interface, which allows you to:
Start and stop collection of trace records from specified tracepoints
Analyze and display the trace records stored in a trace file
Alter the format in which trace records are displayed
Assign CTF command strings to particular keys
•
CTF support. There is a CTF support component in each local VMS system
and remote server that supports CTF. CTF support:
Starts and stops collection of trace records from selected tracepoints (in
response to CTF commands)
Passes trace records from the networking software that generates them to
the TRACE utility
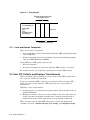
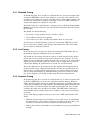
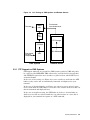
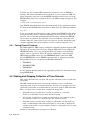
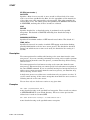
CTF support functions are implemented differently on VMS systems and remote
servers. Figure 2–2 shows how live tracing is supported on local VMS systems
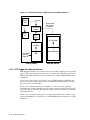
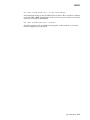
and remote servers. Figure 2–3 shows how detached tracing is supported on local
VMS systems and remote servers.
2–4 Technical Overview
Figure 2–2 Live Tracing on VMS Systems and Remote Servers
To screen
TRACE
utility
Trace records
from remote server
CTF
buffer
CTF Manager
CTF$DCP
DEC WANrouter
Trace records
from local
tracepoints
VMS
VMS System
Remote Server
2.3.1 CTF Support on VMS Systems
CTF support functions are provided on VMS systems partly by VMS and partly
by a process called CTF$DCP. VMS collects trace records from local tracepoints,
and CTF$DCP copies these trace records to a global section, which CTF uses as
an internal buffer.
In the case of live tracing (see Figure 2–2), trace records are read from the CTF
buffer as they arrive and are immediately formatted and displayed on your
terminal.
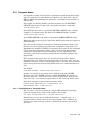
In the case of detached tracing (see Figure 2–3), the trace server process copies
trace records from the CTF buffer to a trace file. The contents of the trace file can
then be formatted and displayed later.
In the case of snapshot tracing, the CTF buffer is used as a circular buffer in
which trace records are collected until they are either written to a trace file or
displayed on your terminal in response to a CTF command.
Technical Overview 2–5
Figure 2–3 Detached Tracing on VMS Systems and Remote Servers
TRACE
utility
Control
Trace server
process
Trace
file
Trace records
from remote
tracepoints
CTF
buffer
CTF Manager
CTF$DCP
DEC WANrouter
Trace records
from local
tracepoints
VMS
VMS System
Remote Server
2.3.2 CTF Support on Remote Servers
CTF support functions on a remote server are provided entirely by the operating
system. The operating system collects trace records and sends them to the local
VMS system from which the server is being traced, using a DECnet/OSI session
connection.
In the case of live tracing (see Figure 2–2), the TRACE utility establishes the
session connection to the remote server, and formats and displays the received
trace records on your terminal.
In the case of detached tracing (see Figure 2–3), the trace server process
establishes the session connection to the remote server, and writes the received
trace records to a trace file. The contents of the trace file can then be formatted
and displayed later.
In the case of snapshot tracing, trace records are buffered at the remote server
and are transmitted to a trace file or to the TRACE utility in response to a CTF
command.
2–6 Technical Overview
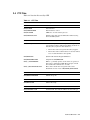
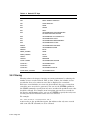
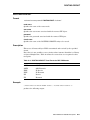
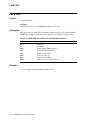
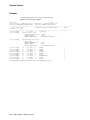
2.4 CTF Files
Table 2–1 lists the files used by CTF.
Table 2–1 CTF Files
File
Description
SYS$SYSTEM:
CTF$UI.EXE
User interface
CTF$SERVER.EXE
Detached trace server
CTF$DCP.EXE
VMS trace record collector process
CTF$SECTION.DAT
Global section file used as CTF buffer when tracing
the local VMS system
SYS$LIBRARY:
CTF$NAME_TABLE.DAT
File containing names of all registered tracepoints
and analysis routines. When networking products are
installed, they register in this database:
•
The names of the tracepoints that they support.
•
The names of the routines that are used to format
trace records from these tracepoints.
CTF$KEY.INIT
System-wide default keypad definitions
CTF$KEY.TEMPLATE
Original for CTF$KEY.INIT
CTF$*_ANALYZE.EXE
Where * generally equates to the name of a protocol
that can be analyzed by CTF. These images contain
the routines that format trace records.
CTF$*_TRACEPOINTS.DAT
These files contain the tracepoint names and
identifiers used to create CTF$NAME_TABLE.DAT.
SYS$MESSAGE:
CTF$MESSAGES.EXE
CTF message file
SYS$HELP:
CTF$HELP.HLB
CTF on-line help
SYS$MANAGER:
CTF$STARTUP.COM
Command file that installs CTF and related images.
Technical Overview 2–7
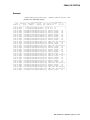
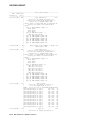
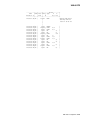
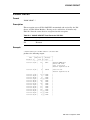
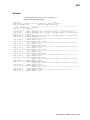
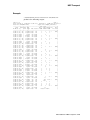
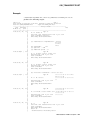
2.5 An Example of Trace Output
This section presents an example of trace output.
Although the exact contents of trace output are protocol-specific, there are some
general features common to all kinds of trace output.
One common feature is the trace output header, which shows:
•
When the trace was started
•
When the trace was analyzed
All trace output is divided into columns containing the following types of
information for each trace record:
•
The time at which the trace record was generated.
•
The event code of the event that caused the trace record to be generated.
•
The size of the protocol message associated with the trace record.
•
The contents of the protocol message associated with the trace record.
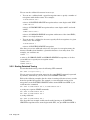
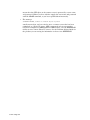
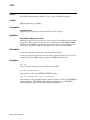
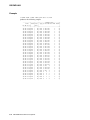
The following example consists of trace records collected from a tracepoint at a
ROUTING CIRCUIT entity. These trace records represent the PDUs that are
transmitted and received on that circuit by the DNA Routing module.
2–8 Technical Overview
CTF V1.0-00
Page 1
Trace started on 28-JUN-1991 09:28:52.98 Analyzed on 28-JUN-1991 09:31:21.44
Trace File [USER]CTF$TRACE.DAT;1
Output File [USER]TRACE.LIS;1
-----------+----+-----+----------------- Routing Packet Header --------------Time |Evnt|Data |
hh mm ss cc|
|Size |
-----------+----+-----+------------------------------------------------------09:28:53.00|TX | 1492|
Type: LAN L2 Hello
|
Protocol ID: 08, Length: 1B, Version: 01
|
Source ID: 08-00-2B-0B-04-28, Holding Time: 30
|
Version: V3.0.0, Segment Length: 05D4
| Circuit: Level 2, L1 Algorithm: N/A, L2 Algorithm: LS
|
Priority: 64, LAN ID: 08-00-2B-0B-04-A6.01
| Options:
|
Type: 01 (Area Address) Length: 12
|
Area: 490041
|
Area: 490042
|
Area: 490001
|
Type: 06 (RTR Nbrs) Length: 6
|
Nbr: AA-00-04-00-DB-A9
|
Type: 08 (DNA Padding) Length: 255
|
Type: 08 (DNA Padding) Length: 255
|
Type: 08 (DNA Padding) Length: 255
|
Type: 08 (DNA Padding) Length: 255
|
Type: 08 (DNA Padding) Length: 255
|
Type: 08 (DNA Padding) Length: 156
|
09:28:53.05|RX | 74|
Phase IV Type: L1 RV, Padding: 0, Flags:
|
Source Node: 1.284
|
09:28:53.31|RX | 1492|
Type: LAN L1 Hello
|
Protocol ID: 08, Length: 1B, Version: 01
|
Source ID: 08-00-2B-0B-02-52, Holding Time: 9
|
Version: V3.0.0, Segment Length: 05D4
| Circuit: Level 1, L1 Algorithm: RV, L2 Algorithm: N/A
|
Priority: 64, LAN ID: 08-00-2B-06-91-F2.01
| Options:
|
Type: 01 (Area Address) Length: 12
|
Area: 490041
|
Area: 490042
|
Area: 490001
|
Type: 06 (RTR Nbrs) Length: 42
|
Nbr: AA-00-04-00-01-06
|
Nbr: AA-00-04-00-44-06
|
Nbr: AA-00-04-00-8B-05
|
Nbr: AA-00-04-00-55-06
|
Nbr: AA-00-04-00-48-06
|
Nbr: AA-00-04-00-46-06
|
Type: 08 (DNA Padding) Length: 255
|
Type: 08 (DNA Padding) Length: 255
|
Type: 08 (DNA Padding) Length: 255
|
Type: 08 (DNA Padding) Length: 255
|
Type: 08 (DNA Padding) Length: 255
|
Type: 08 (DNA Padding) Length: 120
|
Technical Overview 2–9
3
Using CTF
This chapter describes how to prepare your system for using the Common Trace
Facility (CTF), and how to use CTF.
3.1 Introduction
Before anyone can use CTF, you must ensure that all CTF-related images have
been installed and that adequate system resources are available. Section 3.2
describes the preparations that must be made before CTF can be started on a
system.
You will require specific rights identifiers in order to use certain CTF commands.
Also, if you intend to trace remote tracepoints, you will probably need to know
certain items of access control information. Section 3.3 describes the privileges
and access control information that you will require in order to use CTF.
To use the CTF command interface you must run the TRACE utility. Section 3.4
describes how you run the TRACE utility.
To generate trace output you must start collecting trace records from the
tracepoints in which you are interested. Section 3.5 describes how you start
detached, live, or snapshot tracing at one or more tracepoints, and describes how
to stop tracing when you have collected sufficient trace output.
If you are using live tracing, trace records are displayed on your terminal as
they are collected. However, if you are using detached tracing, trace records are
written to a trace file. To display the contents of a trace file you must issue the
appropriate CTF command. Section 3.6 describes how you display the contents
of a trace file, and describes how you can alter the format of the display for both
live and detached tracing.
You can associate CTF commands with function keys on your keyboard.
Section 3.7 describes how you assign CTF commands to keys.
Tracing can significantly degrade system performance, both on the local VMS
system on which CTF is run and, if you are remote tracing, on the remote server
that is being traced. Section 3.8 describes a CTF facility that enables you to
reduce the impact of tracing on system performance.
Section 3.9 describes some of the problems you might encounter using CTF, and
suggests what you should do to solve these problems.
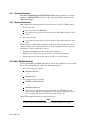
3.2 System Requirements
This section describes the system requirements for running CTF.
Using CTF 3–1
3.2.1 Startup Procedure
The CTF SYS$MANAGER:CTF$STARTUP.COM startup procedure is executed
during the NET$STARTUP procedure. The startup procedure installs all the
CTF-related images.
3.2.2 System Resources
CTF requires the following specific system resources on the local VMS system:
•
For local tracing:
One process slot for CTF$DCP
One process slot for the trace server process (if detached tracing is to be
used)
•
For remote tracing:
One process slot for the trace server process (if detached tracing is to be
used)
Tracing imposes considerable overheads on the local system and, in the case of
remote tracing, on the system being traced, with consequent effects on system
performance. These overheads are due to:
•
Collecting and buffering trace records from tracepoints.
•
Writing trace records to trace files (in the case of detached tracing).
•
Displaying trace records on the screen (in the case of live tracing).
3.3 User Requirements
You use the START and STOP commands to control the collection of trace records.
To use these commands you require the following privileges:
•
For local tracing you require:
NET$TraceHeaders
or
NET$TraceAll
•
For remote tracing you require:
NET$TraceHeadersRemote
or
NET$TraceAllRemote
The username and password associated with the CTF object on the
remote server. These are required only if the remote CTF object on the
server is protected; however, this will usually be the case.
Other CTF commands require no special privileges.
Note
You must have password protection on all remote servers for security.
3–2 Using CTF
All tracing operations of the CTF on DECnet/OSI end nodes or routers require
that the user process hold identifiers in the rights database of the node on which
the user is invoking CTF. These identifiers are:
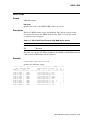
Table 3–1 Identifiers in the Rights Database
Trace Operation
Privilege
NET$TraceHeaders
can trace message headers on the local node.
NET$TraceAll
can trace entire messages on the local node.
NET$TraceHeadersRemote
can trace message headers on remote nodes.
NET$TraceAllRemote
can trace entire messages on remote nodes.
These identifiers are created in the rights database during installation. They may
be granted to a user account through the Authorize Utility by a system manager.
$ SET DEFAULT SYS$SYSTEM
$ RUN AUTHORIZE
UAF> GRANT/ID NET$TRACEHEADERS user_account
Note
For some tracepoints there is no distinction between tracing a header and
tracing a full message.
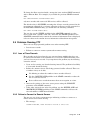
3.3.1 Keypad Definitions
When you run the TRACE utility, it reads the default keypad definitions from the
file:
SYS$LIBRARY:CTF$KEY.INIT
The system manager may edit this file to change the default keypad definitions
for all CTF users.
Individual users may override the default keypad definitions by generating their
own copy of CTF$KEY.INIT and equating the logical name CTF$KEY to the copy,
as follows:
$ DEFINE CTF$KEY SYS$LOGIN:CTF_KEYPAD.INIT
The defaults applied to the logical name translation are:
SYS$LIBRARY:.INIT
3.4 Running the TRACE Utility
To run the TRACE utility, enter the following command at the DCL prompt:
$ TRACE
The appearance of the CTF> prompt indicates that TRACE is running and that
you can enter any of the CTF commands described in Chapter 4.
You can include a CTF command in the TRACE command line, as follows:
$ TRACE command-string
Using CTF 3–3
in which case the specified CTF command is executed as soon as TRACE is
running. When this command has been executed, you are returned to VMS; the
single exception to this rule is the ANALYZE command, which leaves you in the
TRACE utility when it has completed (that is, the CTF> prompt will appear). For
example:
$ TRACE START "ROUTING CIRCUIT LAN-0"
runs TRACE and immediately starts detached tracing at the specified tracepoint.
To exit from the TRACE utility and return to DCL, enter the following command:
CTF> EXIT
If you are currently performing live tracing, exitting from TRACE has the effect
of stopping tracing; that is, collection and display of trace records is stopped. If,
however, you are currently performing detached tracing, exitting from TRACE
has no effect on collection; the collection of trace records into a trace file will
continue under the control of the trace server process. To stop detached tracing
you must explicitly turn off the collection of trace records (see Section 3.5.5).
3.4.1 Tracing Phase IV Products
The DECnet/OSI for VMS versions of Digital’s networking products support CTF.
The Phase IV versions, however, do not support CTF; instead, they support the
NETTRACE utility. If you are tracing the Phase IV version of a networking
product, such as a previous, Phase IV version of VAX P.S.I., rather than the
DECnet/OSI for VMS version, use the NETTRACE utility rather than CTF.
To start NETTRACE, use the TRACE command with an appropriate qualifier.
The qualifiers that you can specify in a TRACE command are:
•
TRACE/PSI
•
TRACE/ROUTER
•
TRACE/SNA
See the Problem Solving Guide for the appropriate product for information about
using NETTRACE.
3.5 Starting and Stopping Collection of Trace Records
This section describes how you start and stop the collection of trace records from
tracepoints.
The CTF commands that start and stop the collection of trace records from
tracepoints refer to these tracepoints by name. Section 3.5.1 describes how local
and remote tracepoints are named and how you refer to them in CTF commands.
There are three ways to collect trace records from tracepoints:
•
Detached tracing, in which trace records are written to a trace file.
Section 3.5.2 describes how you start detached tracing.
•
Live tracing, in which trace records are displayed on your terminal as they
are collected. Section 3.5.3 describes how you start live tracing.
•
Snapshot tracing, in which trace records are collected in a buffer until you
issue a command that either writes the buffer to a trace file or displays the
contents of the buffer on your terminal. Section 3.5.4 describes how you start
snapshot tracing.
Section 3.5.5 describes how you stop trace collection.
3–4 Using CTF
3.5.1 Tracepoint Names
A tracepoint is usually associated with a particular network management entity,
and has a name that is either identical or similar to the entity name. See the
DECnet/OSI Network Management manual for a description of the structure of
entity names.
For example, the Routing module contains tracepoints for each ROUTING
CIRCUIT entity that is created; such a tracepoint would have a name like:
"ROUTING CIRCUIT SYN-0"
where SYN-0 is the name of a particular ROUTING CIRCUIT entity. Another
example of a tracepoint name, this time in the CSMA-CD module, would be:
"CSMACD STATION THIS-STATION"
where THIS-STATION is the name of a particular CSMACD STATION entity.
Tracepoint names must always be enclosed in double quotes when they appear in
CTF commands.
Note that not all tracepoints correspond to network management entities, and
therefore not all tracepoints have names that correspond to entity names (see
Appendix B for examples of VAX P.S.I. tracepoints whose names do not correspond
to X.25 network management entities). Also, not all network management
entities have tracepoints associated with them. See the appendixes to this
manual for a list of the tracepoints provided by the networking products that
support CTF.
The tracepoint names given above are all local tracepoint names. Remote
tracepoint names are similar, but must begin with a node name. Also, since the
CTF object on remote servers is usually protected by a user name and a password,
remote tracepoint names must usually include this access control information as
well.
For example:
NODEA"FRANK CHICKENS"::"CSMACD STATION THIS-STATION"
specifies a tracepoint on the remote server with the node name NODEA,
specifying user name FRANK and the password CHICKENS. The portion of
the name after the :: is the same as for a local tracepoint name. Note that the
node name and :: in a remote tracepoint name are not enclosed in double quotes.
Some more examples of remote tracepoint names follow:
ROUTER3"SYSUSER UNGUESSABLE_PW"::"ROUTING CIRCUIT SYN-2"
REMNODE"REMUSER FRED"::"DDCMP LINK SYN-3"
3.5.1.1 Using Wildcards in Tracepoint Names
You can refer to several tracepoints in a single CTF command by specifying
several tracepoint names, separated by commas. For example:
CTF> START "ROUTING CIRCUIT SYN-0","ROUTING CIRCUIT SYN-1"
Alternatively, you can use the wildcard characters, * (asterisk) and ?, in a
tracepoint name to make it refer to several tracepoints. The ? wildcard can
stand for any single character, and the * wildcard can stand for any string of
characters.
Using CTF 3–5
You can use the wildcard characters in two ways:
•
You can use a wildcard with a partial tracepoint name to specify a number of
tracepoints with similar names. For example:
"ROUTING CIRCUIT SYN-*"
refers to all ROUTING CIRCUIT tracepoints whose name begins with "SYN-".
"DDCMP LINK L*K"
refers to all DDCMP LINK tracepoints whose name begins with L and ends
with K.
"CSMACD STATION STAT-?"
refers to all CSMACD STATION tracepoints with names of the form STAT-x,
where x is a single character.
•
You can use the * wildcard on its own to specify all the tracepoints of a given
entity class. For example:
"ROUTING CIRCUIT *"
refers to all ROUTING CIRCUIT tracepoints.
Note that you can use wildcards only in the last part of a tracepoint name, the
instance identifier that identifies a particular instance of an entity class. For
example, you could not use:
"CSMACD * *"
to refer to all CSMACD PORT and CSMACD STATION tracepoints; to do that
you would have to specify two tracepoint names:
"CSMACD PORT *"
"CSMACD STATION *"
3.5.2 Starting Detached Tracing
To start detached tracing, enter the following CTF command:
CTF> START "tracepoint-name"[,...]
You can enter several tracepoint names in the same START command, separated
by commas; alternatively, you can issue several START commands.
Each of the following examples has the effect of starting collection of trace records
from the specified tracepoints. For example, to start detached tracing of the
tracepoints on two ROUTING CIRCUIT entities named SYN-0 and SYN-1, you
could enter the command:
CTF> START "ROUTING CIRCUIT SYN-0","ROUTING CIRCUIT SYN-1"
or, using two separate START commands:
CTF> START "ROUTING CIRCUIT SYN-0"
CTF> START "ROUTING CIRCUIT SYN-1"
or, using wildcards:
CTF> START "ROUTING CIRCUIT SYN-*"
Note that this last example would start detached tracing on all ROUTING
CIRCUIT tracepoints whose name begins with SYN-, not just SYN-0 and SYN-1.
3–6 Using CTF
Since this is detached processing, a trace server process is created to write the
collected trace records to a trace file. By default, the name of this trace server
process is username$CTF, where username is your user name. You can specify
a different name for the trace server process by using the /PROCESS_NAME
qualifier of the START command. By default, the trace server process writes
trace records to the file CTF$TRACE.DAT in your default directory. You can
specify a different trace file by using the /OUTPUT qualifier of the START
command. For example:
CTF> START/OUTPUT=DDCMPTRACE.DAT "DDCMP LINK SYN-2"
collects trace records from the specified tracepoint and writes them to the file
DDCMPTRACE.DAT in your current directory.
See the description of the START command in Chapter 4 for a description of all
the qualifiers that you can use for detached tracing.
3.5.3 Starting Live Tracing
As with detached tracing (see Section 3.5.2), live tracing is controlled by the
START command. You start live tracing by including the /LIVE qualifier in the
START command. For example:
CTF> START/LIVE "ROUTING CIRCUIT SYN-0"
starts collecting trace records from the specified tracepoint and displays them on
your terminal.
You can interrupt the display of trace records to enter CTF commands at any
time; for example, you may wish to enter CTF commands to change the format
of the display. To interrupt the display, simply press any key; the CTF> prompt
appears, and you can enter a CTF command. When the command has been
executed, the display of trace records is resumed. Any trace records generated
while you were entering a CTF command will have been buffered, and will be
displayed when the display of trace records is resumed. However, since buffer
space is limited, you may lose trace records if you leave the CTF> prompt
displayed for too long.
See the description of the START command in Chapter 4 for a description of the
qualifiers that you can use for live tracing.
3.5.4 Starting Snapshot Tracing
To start snapshot tracing, use the /NOCOLLECT qualifier in the START
command. For example:
CTF> START/NOCOLLECT "ROUTING CIRCUIT SYN-1"
starts reading trace records from the specified tracepoint into the CTF buffer, but
does not write them to a trace file or display them on your terminal. When you
want to collect the contents of the CTF buffer, enter the following command:
CTF> COLLECT
If you are performing detached tracing, the current contents of the CTF buffer
are written to the default trace file, CTF$TRACE.DAT. You can then analyze the
contents of the trace file, as described in Section 3.6.2. If you are performing live
tracing, the current contents of the CTF buffer are displayed on your terminal.
Using CTF 3–7
3.5.5 Stopping Tracing
To stop the collection of trace records from particular tracepoints, enter the
following command:
CTF> STOP [tracepoint-name[,...]]
For example:
CTF> STOP "ROUTING CIRCUIT UNA-0"
stops the collection of trace records from the specified tracepoint.
If you specify no tracepoint names, all current tracing is stopped.
If you specified a trace server process name other than the default,
username$CTF, when you started detached tracing (see Section 3.5.2), you
must specify this process name in the /PROCESS_NAME qualifier in the STOP
command. For example, if you started detached tracing with the command:
CTF> START/PROCESS_NAME=DDCMPTRACE "DDCMP LINK LNK-02"
you would stop this trace with the command:
CTF> STOP/PROCESS_NAME=DDCMPTRACE "DDCMP LINK LNK-02"
If you stop all detached tracing, the trace server process will exit. If you stop all
local tracing, the process CTF$DCP will also exit.
3.6 Displaying Trace Records
This section describes the facilities provided by CTF for displaying trace output.
3.6.1 Controlling Output During Live Tracing
When you start live tracing, trace records are formatted and displayed on your
terminal as they are collected. You can interrupt the display at any time by
pressing any key on the keyboard; you can then use the ANALYZE command to
alter the format and contents of the display.
You can use the /DISPLAY qualifier to specify what parts of the trace record
(other than the protocol data itself) are to be included in the display. For
example:
CTF> ANALYZE/DISPLAY=(CONTEXT,EVENT,NAME)
displays the context-specific information, event code, and tracepoint name for
each trace record.
You can use the /DATA qualifier to specify whether or not the user data part of
the protocol data is displayed, and in what format. For example:
CTF> ANALYZE/DATA=ASCII
causes user data to be displayed in ASCII (the default is to display user data in
hexadecimal). Note that not all trace records include user data; in such cases the
/DATA qualifier has no effect.
Normally, all trace records collected from the tracepoints you are tracing will
be displayed. There are a number of ways in which you can restrict what trace
records are displayed:
•
You can use the /FILTER qualifier to specify that only trace records with
specified event codes are displayed; for example:
CTF> ANALYZE/FILTER=(RX)
3–8 Using CTF
specifies that only trace records with event code RX (receive) are to be
displayed. See Section 3.8 for more information about the /FILTER qualifier.
•
You can use the /NAME qualifier to specify that only trace records from
certain tracepoints are to be displayed; for example:
CTF> ANALYZE/NAME="SYN-0"
specifies that only trace records from tracepoints with the instance name
SYN-0 are to be displayed.
•
You can use the /BEFORE and /SINCE qualifiers to specify that only trace
records collected before or after a specified time are to be displayed.
If your process holds identifier NET$TraceAll for tracing local data or
NET$TraceAllRemote for tracing remote data, the information in a trace record
will consist of a protocol header and user data. For any particular tracepoint,
the user data in the trace record will include the protocol headers from higher
protocol levels. For example, the user data in a trace record collected from
a DDCMP LINK tracepoint will include the protocol information from the
appropriate ROUTING CIRCUIT tracepoint.
If your process does not hold NET$TraceAll or NET$TraceAllRemote, the user
data portion is neither collected nor displayed.
By default, the analysis of a trace record will not include protocol information
within the user data part of the trace record. For example, the default analysis
of a trace record from a ROUTING CIRCUIT tracepoint would analyze only the
routing packet header, and the protocol information for the higher levels would be
displayed as user data.
You can use the /PROTOCOL qualifier to specify that protocol information in the
user data part of the trace record is also to be analyzed. For example:
CTF> ANALYZE/PROTOCOL=(DDCMP,ROUTING)
would analyze both the routing and DDCMP protocol information in each trace
record. Note that you must take care to specify the protocols in the correct order,
from the lowest protocol level upwards. If, for example, you were to specify:
CTF> ANALYZE/PROTOCOL=(ROUTING,DDCMP)
the effect would be to analyze the routing packet header as though it were a
DDCMP packet header and the DDCMP packet header as though it were a
routing packet header. The analysis would be performed as specified, but the
results would, of course, be nonsense.
The /SELECT qualifier is usually used only in connection with the /PROTOCOL
qualifier. If you use the /PROTOCOL qualifier to select multiple protocol analysis
of a trace record, you can use the /SELECT qualifier to specify that only some of
these protocols should be displayed. For example, if you use:
CTF> ANALYZE/PROTOCOL=(MODEM_CONNECT,DDCMP,ROUTING)
to display the analyses of these three protocols, you could subsequently use:
CTF> ANALYZE/SELECT=(DDCMP)
to display only the DDCMP protocol analysis, or:
CTF> ANALYZE/SELECT=(MODEM_CONNECT,ROUTING)
to display only the analyses of the modem connect and routing protocols.
Using CTF 3–9
By default, trace output is displayed continuously as it arrives. You can use the
/NOSCROLL qualifier with ANALYZE to cause output to be displayed a screen
at a time; you can then use the BACK and NEXT commands to move backwards
and forwards through the output one screen at a time.
See the description of the ANALYZE command in Chapter 4 for more information
about the qualifiers that you can use while performing live tracing.
3.6.2 Displaying the Contents of Trace Files
When you start detached tracing, unformatted trace records are collected into a
trace file. To format and display the contents of a trace file, enter the following
command:
CTF> ANALYZE [trace-file]
The ANALYZE command formats the trace records in a trace file into userreadable form and either displays them on your terminal or writes them to a
file. By default the trace records are displayed on your terminal; you can use the
/OUTPUT qualifier to write them to a file instead. If you do not specify the name
of a trace file, the default trace file CTF$TRACE.DAT (in your default directory)
is assumed.
For example:
CTF> ANALYZE/OUTPUT=ANALYSIS.LIS MYTRACE.DAT
formats the trace records in MYTRACE.DAT and writes the results to
ANALYSIS.LIS.
If you stop and restart detached tracing at a tracepoint, specifying the same
trace file name each time, a new version of the trace file is created each time.
The ANALYZE command starts with the lowest existing version of the trace
file and continues up to and including the highest version. If you want to start
the display with a specific version of a trace file, include the version number in
the file specification. You can use the /VERSION_LIMIT qualifier of the START
command to specify how many versions of the same trace file will be kept.
If trace records have been collected for more than one protocol, the default action
when the trace file is analyzed is that only the protocol implied by the first
tracepoint encountered in the trace file is analyzed. You can use the /TRACE_
LEVEL qualifier to alter this action; for example:
CTF> ANALYZE/TRACE_LEVEL=(DDCMP)
analyzes all DDCMP protocol trace records in the trace file.
You can use the qualifiers of the ANALYZE command described in Section 3.6.1
to alter the format and contents of the display of a trace file.
3.7 Defining Key Sequences for CTF Commands
When you run the TRACE utility, certain keys on your keyboard are defined
to implement frequently used CTF commands. Table 3–2 lists the default
assignments of CTF commands to keys.
You can use the DEFINE/KEY command to alter these definitions or to add
further definitions. For example:
CTF> DEFINE/KEY KP2 "START/LIVE/DISPLAY=OCTAL"
redefines KP2.
3–10 Using CTF
You can have multiple definitions for one key by defining key states in the
DEFINE/KEY command. For a description of how to use key states and the
relevant qualifiers of the DCL DEFINE/KEY command, see the description of the
DEFINE/KEY command in your VMS documentation.
You can use the DELETE/KEY command to delete key definitions made with the
DEFINE/KEY command.
You can use the SHOW/KEY command to display the current key definitions.
Using CTF 3–11
Table 3–2 Default CTF Keys
Key
CTF Function
HELP
HELP
PF2
HELP KEYPAD DEFAULT
PF3
SHOW KEY/ALL
KP0
NEXT
KP2
START
KP3
STOP
KP4
ANALYZE/DATA=ASCII/NOSELECT
/NODISPLAY/NOTRUNCATE
KP6
ANALYZE/DISP=ALL/WIDTH=132
KP7
ANALYZE/DATA=ASCII
KP8
ANALYZE/DATA=HEXADECIMAL
KP9
ANALYZE/DATA=OCTAL
MINUS
ANALYZE/DATA=DECIMAL
COMMA
ANALYZE/TRUNCATE
PERIOD
BACK
NEXT_SCREEN
NEXT
PREV_SCREEN
BACK
CTRL/L
CLEAR
CTRL/W
REFRESH
GOLD COMMA
ANALYZE/NOTRUNCATE
GOLD KP0
ANALYZE/SCROLL
GOLD KP2
START/LIVE
GOLD KP6
ANALYZE/NODISPLAY
GOLD NEXT_SCREEN
ANALYZE/SCROLL
3.8 Filtering
Filtering reduces the impact of tracing on system performance by reducing the
number of trace records collected. This, in turn, reduces, the number of trace
records that have to be written to trace files or displayed on a terminal.
Each trace record includes an event code that indicates the type of event that
caused the trace record to be generated. You can use the /FILTER qualifier in
the START command to specify that only trace records with specified event codes
should be collected. For example, most tracepoints generate trace records for
the Receive and Transmit events; you can use /FILTER to specify that only trace
records generated for Transmit events are to be collected.
For example:
CTF> START/FILTER=TX "ROUTING CIRCUIT UNA-0"
starts tracing at the specified tracepoint, but indicates that only trace records
with event code TX (transmit) are to be collected.
3–12 Using CTF
To change the filter associated with a tracepoint, issue another START command
with a different filter. For example, if you follow the previous START command
with:
CTF> START/FILTER=RX "ROUTING CIRCUIT UNA-0"
only trace records with event code RX (receive) will be collected.
The default value is /NOFILTER, meaning that all trace records generated at the
tracepoint are collected. So, to resume collection of all trace records generated at
the ROUTING CIRCUIT entity, you would issue the following command:
CTF> START "ROUTING CIRCUIT UNA-0"
You can also use the /FILTER qualifier in the ANALYZE command to select
trace records with a specific event code. Note that the /FILTER qualifier in the
ANALYZE command merely restricts the amount of information that is displayed;
it has no effect on the amount of trace information collected from tracepoints.
3.9 Problems Running CTF
There are two major potential problem areas when running CTF:
•
Loss of trace records
•
Failure to connect to remote systems when remote tracing
3.9.1 Loss of Trace Records
Trace records can be lost when they are generated more quickly than they can
be collected and written to the terminal or to a trace file. CTF will inform you if
you have lost any trace records. If you experience this problem, try the following
corrective actions:
•
If you are live tracing, try detached tracing instead. The problem is less likely
to occur with detached tracing.
•
Reduce the amount of trace data being generated and/or collected. There are
a number of ways to do this:
Use filtering to reduce the number of trace records collected.
Use the /CAPTURE_SIZE qualifier in the START command to reduce the
size of each trace record.
Do not collect trace records from more than one tracepoint at a time.
•
Increase the priority of the trace server process using the /PRIORITY
parameter of the START command.
•
If the other actions do not solve the problem, use the /BUFFER_SIZE and
/MAXIMUM_BUFFERS qualifiers in the START command to increase the
size and number of CTF internal buffers.
3.9.2 Failure to Connect to Remote Servers
You may see one of two system messages indicating a failure to connect to a
remote server when remote tracing:
•
The message:
%SYSTEM-F-INVLOGIN, LOGIN information invalid at remote node
Using CTF 3–13
means that the CTF object at the remote server is protected by a user name
and password. Either you have failed to supply the user name and password
with the START command, or you have specified them incorrectly.
•
The message:
%SYSTEM-F-REJECT, Connect to network object rejected
usually means that you have tried to trace a remote server that has been
configured as a Phase IV router; CTF is supported only on servers that
have been configured as DECnet/OSI for VMS routers. Use the NETTRACE
facility to trace remote Phase IV servers. See the Problem Solving Guide for
the product you are tracing for information on how to use NETTRACE.
3–14 Using CTF
4
CTF Commands
This chapter provides a detailed description of each of the CTF commands and its
qualifiers.
Table 4–1 lists the available CTF commands.
Table 4–1 Summary of CTF Commands
Command
Description
ANALYZE
Displays the trace records in a trace file, and specifies the format of
this display (for both live and detached tracing).
ATTACH
Transfers control to another process.
BACK
Displays the previous screen of trace data.
CLEAR
Clears the screen of trace data.
COLLECT
Collects trace records generated during a /NOCOLLECT session into a
trace file.
DEFINE/KEY
Associates a command with a key on the keyboard.
DELETE/KEY
Deletes the key definitions you have defined.
EXIT
Stops the TRACE utility.
HELP
Displays on-line help about CTF commands.
REFRESH
Redraws the screen.
SHOW KEY
Displays the key definitions for your keyboard.
SPAWN
Creates a subprocess of the current process.
START
Starts live or detached tracing at specified tracepoints.
STOP
Stops tracing at specified tracepoints.
4.1 Using the CTF Keypad
A number of keys on your keyboard are set up to provide a quick way to enter
certain frequently used CTF commands. You can either use the default keypad
definitions set up when CTF is installed, or you can use the DEFINE/KEY
command to set up your own definitions. See Table 3–2 for a description of the
default keypad definitions.
CTF Commands 4–1
ANALYZE
ANALYZE
The ANALYZE command formats and displays the contents of a trace file. The
command is also used to specify the format in which trace data is displayed,
either during live tracing or when the contents of a trace file are displayed.
Format
ANALYZE [file-spec] [/qualifiers]
Parameters
file-spec
Specifies the name of the trace file to be displayed. The default is the file
CTF$TRACE.DAT in your default directory. You cannot specify this parameter if
you are performing live tracing.
Note
If you do not specify a file version number, the ANALYZE command starts
at the lowest version of the trace file and processes each version of the file
in turn.
Qualifiers
/BEFORE=time
Specifies that only trace records collected before the specified time are to be
displayed. Specify the time in standard VMS format.
/BRIEF
Specifies that a single-line analysis of the protocol data in each trace record is
displayed. /BRIEF is the default display. This qualifier is effective only if the
relevant protocol analysis routines support abbreviated analysis of protocol data.
4–2 CTF Commands
ANALYZE
/DISPLAY=(field,...)
/NODISPLAY
Specifies which fields of a trace record (other than the protocol data itself) are
displayed. The fields that can be displayed are:
[NO]ALL
[NO]CONTEXT
[NO]EVENT
[NO]FUNCTION_CODE
[NO]NAME
[NO]SIZE
[NO]STATUS
[NO]TIME
All the fields shown below are displayed.
Tracepoint-specific information
The event code
The tracepoint-specific function code of the
operation being traced.
The name of the tracepoint from which the trace
record was collected. Names longer than 16
characters will be truncated on the right.
The original size of the trace data, in bytes
If the value in this field is non-zero, it is the
current status of the operation being traced.
The time at which the trace record was collected.
The default display is:
TIME
EVENT
SIZE
/FILTER=(event-code,...)
/NOFILTER
Specifies a filter for trace records. A trace record is displayed only if its event
code is one of those specified in the filter. See the appendixes to this manual for
a list of the event codes supported by each tracepoint. This value overrides the
current filter, if any. You cannot specify this qualifier with /SELECT or /TRACE_
LEVEL. The default is /NOFILTER.
/FULL
Specifies that a multi-line analysis of each trace record is produced. If you do
not specify /FULL, the default is /BRIEF. This qualifier is effective only if the
relevant protocol analysis routines support full analysis of protocol data.
/NAME=instance-name
Specifies the instance part of a tracepoint name. A trace record is displayed
only if it came from the specified tracepoint. If you specify only the first part of
an instance name, trace records are displayed from all tracepoints whose name
begins with this string. The default is to display trace records from all active
tracepoints.
/OUTPUT[=output-filename]
Specifies the name of a file to which the formatted trace records are to be written.
If you specify /OUTPUT without a filename, the default is to display the output
on your terminal. You cannot use this qualifier if you are performing live tracing.
/PAGE=lines-per-page
Specifies the number of lines per page when writing output to a file. This
qualifier has no effect if trace records are being displayed on your terminal. The
default is defined by the logical name SYS$LP_LINES, which usually has the
value 66.
CTF Commands 4–3
ANALYZE
/PROTOCOL=(protocol-identifier,...)
/NOPROTOCOL
Specifies the type of analysis performed on each trace record. The protocol data in
each trace record is analyzed for each of the protocols listed in the /PROTOCOL
qualifier, in the order in which they are specified. If you do not specify this
qualifier, only the protocol data supplied at the protocol level of the originating
tracepoint is analyzed; protocol data from higher levels is displayed, unanalyzed,
as user data. If you specify /NOPROTOCOL, no analysis is performed on the
protocol data in the trace record; it is all presented as user data.
/REVERSE
/NOREVERSE
Specifies that received data will be displayed in reverse video, and titles will be
displayed in bold. The default is /REVERSE.
/SAVE_BUFFER_SIZE=n
Specifies how many screens of saved lines of data will be kept. These screens can
be examined by using the NEXT and BACK commands. The default is 30. The
minimum is one screen. The maximum is 1000 screens.
/SCROLL
/NOSCROLL
Specifies whether data is displayed continuously or a page at a time. If you
specify /NOSCROLL, you have to issue the NEXT or BACK command to display
the next screen or previous screen. The default is /SCROLL, which causes data to
be displayed continuously.
/SELECT=(protocol-identifier,...)
Specifies which protocol analyses are to be displayed. This qualifier is only useful
if you have used the /PROTOCOL qualifier to request multiple protocol analysis
of a trace record. The default is to display all the protocol analyses requested by
the /PROTOCOL qualifier.
/SINCE=time
Specifies that only trace records collected since the specified time are to be
displayed. Specify the time in standard VMS format.
/TRACE_LEVEL=(protocol-identifier,...)
Normally, CTF will display the analysis for a single protocol, even if the trace file
contains trace records from more than one protocol. By default, CTF will analyze
only those trace records with the same protocol as the first trace record in the
trace file. However, if you use this qualifier, all the specified protocols will be
analyzed. You cannot use this qualifier with either /FILTER or /SELECT.
/TRUNCATE
/NOTRUNCATE
Specifies whether data that will not fit on one line is truncated or continued on
the next line. The default is /TRUNCATE for live tracing and /NOTRUNCATE
for analysis of a file.
/WIDTH=n
Specifies the width of the output page, in columns. If the data is written to a file,
the default is 132. If the data is displayed on your terminal, the default is the
width of your screen.
4–4 CTF Commands
ANALYZE
Description
The ANALYZE command allows you to:
•
Display the contents of a trace file, and specify the format of the display.
•
Change the format of the display during live tracing.
If you issue the ANALYZE command while displaying a trace file, and you do not
specify a filename, the qualifiers you use will be applied to the trace file being
displayed.
You may not ANALYZE a trace file during live tracing, but you may use the
ANALYZE command to alter the format of the display for live tracing. Simply
press any key to interrupt the display, enter the ANALYZE command, and the
resumed display will reflect the new format.
If you include the ANALYZE command in a TRACE command line, you will be
left in the TRACE utility on completion of the command.
Examples
CTF> ANALYZE/OUTPUT=TRACE_ASC.LIS
This command formats the contents of the default trace file, CTF$TRACE.DAT,
and places the formatted data in a file called TRACE_ASC.LIS.
CTF> ANALYZE/FILTER=(RX,TX)
This command displays the contents of the default trace file, CTF$TRACE.DAT,
on your terminal. Only trace records with event code RX (receive) or TX
(transmit) will be displayed.
CTF Commands 4–5
ATTACH
ATTACH
The ATTACH command transfers control to the specified process.
Format
ATTACH [process-name] [/qualifiers]
Parameters
process-name
Specifies the name of a parent process or spawned sub-process to which control
passes. The process must already exist, must be part of your current job, and
must share the same input stream as your current process. However, the
process cannot be your current process or a sub-process created with the SPAWN
command using the /NOWAIT qualifier.
Process names can contain from 1 to 15 alphanumeric characters. If a connection
to the specified process cannot be made, an error message is displayed.
You may not specify a process name if you specify either the /IDENTIFICATION
or /PARENT qualifier.
Qualifiers
/IDENTIFICATION=PID
Specifies the process identification of the process to which control is to be
transferred. If you use this qualifier, you cannot specify /PARENT or a process
name.
/PARENT
This is only valid if used from a sub-process. It specifies that control is to be
returned to the parent process. If you use this qualifier, you cannot specify
/IDENTIFICATION or a process name.
Examples
CTF> ATTACH SMITH_1
transfers control to the process called SMITH_1.
CTF> ATTACH /IDENT=39400067
also transfers control to the process SMITH_1, using its PID rather than its
name.
CTF> ATTACH /PARENT
transfers control back to the parent process.
4–6 CTF Commands
BACK
BACK
The BACK command displays the previous screen of trace data.
Format
BACK
Parameters
None
Description
If you are displaying the contents of a trace file, the BACK command puts the
screen into scroll mode, in which you can display trace data one screen at a
time using the NEXT and BACK commands. Each subsequent BACK command
displays the previous screen of trace data.
During live tracing, the first use of the BACK command suspends the collection
of trace records and puts the screen into scroll mode. Each Subsequent BACK
command displays the previous screen of trace data. To scroll forward to the next
screen of trace data, issue a NEXT command.
To resume scrolling of trace data, issue an ANALYZE/SCROLL command.
All saved records are scrolled through before tracing starts again.
CTF Commands 4–7
CLEAR
CLEAR
The CLEAR command clears the screen of trace data.
Format
CLEAR
Parameters
None
Description
See also the REFRESH command.
4–8 CTF Commands
COLLECT
COLLECT
The COLLECT command takes a snapshot of current tracing activity.
Format
COLLECT [/qualifier]
Parameters
None
Qualifiers
/PROCESS_NAME
Specifies the name of the trace server process that is to collect the data. This
must be the same process that you specify in the /PROCESS_NAME qualifier in
the START/NOCOLLECT command that you issued to start snapshot tracing.
If you do not specify a process name, then CTF will use the process named
username$CTF.
You cannot specify a process name if you issue the COLLECT command while
performing live tracing.
Description
If you start tracing with a START/NOCOLLECT command, the collected trace
records are copied to an internal CTF buffer, but are neither written to a trace
file (if you are performing detached tracing) nor displayed on your terminal (if you
are performing live tracing). When the buffer is full, new trace records overwrite
the oldest trace records in the buffer. The buffer is therefore a circular buffer
whose contents provide a snapshot of the most recent history of tracing.
When you issue a COLLECT command, the current contents of the buffer are:
•
Written to the default trace file, CTF$TRACE.DAT, if you are performing
detached tracing. You can then issue an ANALYZE command to display these
trace records.
•
Displayed on your terminal, if you are performing live tracing.
Examples
CTF> COLLECT
if you are performing detached tracing, writes trace records collected by the
default trace server process username$CTF and writes them to CTF$TRACE.DAT.
If you are performing live tracing, the trace records are displayed on your
terminal.
CTF> COLLECT /PROC=SMITH$CTF_Z
writes trace records collected by the process SMITH$CTF_Z to the file
CTF$TRACE.DAT. You must have previously issued a START/NOCOLLECT
command naming SMITH$CTF_Z in the /PROCESS_NAME qualifier.
CTF Commands 4–9
DEFINE/KEY
DEFINE/KEY
The DEFINE/KEY command associates a string with a particular key on your
keyboard.
Format
DEFINE/KEY key-name string [/qualifiers]
Parameters
key-name
Specifies the name of the key that you are defining. See Table 3–2 for a list of the
keys that CTF defines.
string
Specifies the character string to be processed when you press the specified key.
Enclose the string in double quotes to preserve spaces and lower case characters.
Qualifiers
/ECHO
/NOECHO
Specifies whether the command line is echoed to the screen when you press the
defined key. The default is /ECHO.
/IF_STATE=(state,...)
/NOIF_STATE
Specifies a list of states, at least one of which must be set for the specified key
definition to work.
/LOCK_STATE
/NOLOCK_STATE
Specifies that the state set by the /SET_STATE qualifier remains in effect until a
DEFINE/KEY/NOSET_STATE command is issued to unset the state. The default
is /NOLOCK_STATE, meaning that the effect of /SET_STATE lasts only until the
next definable key that you press or the next read-terminating character that you
type.
/SET_STATE=state
/NOSET_STATE
Specifies that the named state is set when the specified key is pressed. The state
name can be any alphanumeric string. The default is /NOSET_STATE, meaning
that the current locked state is unset when the key is pressed.
See the description of the DCL command DEFINE/KEY in your VMS
documentation for more information about key states.
/TERMINATE
/NOTERMINATE
Specifies whether the string executes when you press the specified key. The
default is /NOTERMINATE, which means that you can press other keys before
the command string is processed.
4–10 CTF Commands
DEFINE/KEY
Description
See Table 3–2 for a list of the default key definitions. See also SHOW KEY and
DELETE/KEY.
Examples
CTF> DEFINE/KEY KP2 "START/LIVE/NOCOLLECT"/TERMINATE
causes KP2 to start live snapshot tracing.
CTF> DEFINE/KEY KP2/IF_STATE="GOLD" "START/NOCOLLECT"/TERMINATE
causes GOLD KP2 to start detached snapshot tracing.
CTF Commands 4–11
DELETE/KEY
DELETE/KEY
The DELETE/KEY command deletes key definitions that have been defined by
the DEFINE/KEY command.
Format
DELETE/KEY key-name [/qualifier]
Parameters
key-name
Specifies the name of the key whose definition is to be deleted. See Table 3–2 in
the description of the DEFINE/KEY command for a list of the key names that
CTF supports.
Qualifiers
/STATE=(state,...)
Specifies the name of the state(s) for which the key definition is to be deleted.
The default is the current state.
Description
If you delete the definition of a key, the use of that key within CTF becomes
undefined.
Examples
CTF> DELETE/KEY KP2
deletes the current definition of KP2, leaving this key undefined within CTF.
4–12 CTF Commands
EXIT
EXIT
The EXIT command stops the TRACE utility and returns you to VMS.
Format
EXIT
Parameters
None
Description
If you are performing live tracing, all trace record collection will stop. If you
are performing detached tracing, however, collection will continue unless you
explicitly stop it using the STOP command.
Ctrl/Z
has the same effect as the EXIT command.
CTF Commands 4–13
HELP
HELP
The HELP command displays information about CTF commands.
Format
HELP [command-name]
Parameters
command-name
Specifies the command for which help is required.
Description
The HELP command displays information about the specified CTF command.
You can request additional information on command parameters and qualifiers by
specifying the name of a topic in response to the Topic? prompt.
If you do not specify a command name, HELP lists the commands and topics for
which you can request help.
Examples
CTF> HELP ANALYZE
displays information about the ANALYZE command.
4–14 CTF Commands
REFRESH
REFRESH
The REFRESH command redraws the screen.
Format
REFRESH
Parameters
none
Description
Ctrl/W
has the same effect as the REFRESH command.
CTF Commands 4–15
SHOW KEY
SHOW KEY
The SHOW KEY command displays the current key definitions for your keyboard.
Format
SHOW KEY [key-name] [/qualifiers]
Parameters
key-name
Specifies the name of the key whose definition is to be displayed. See Table 3–2
in the description of the DEFINE/KEY command for a list of the key names
supported by CTF.
If you do not specify a key-name, you must specify the /ALL qualifier.
Qualifiers
/ALL
Displays all the key definitions for your keyboard. You must not specify /ALL if
you specify a key-name.
/BRIEF
Shows a brief display of the key definitions for your keyboard. The default is
/BRIEF.
/FULL
Specifies that all key definitions and qualifiers associated with a definition are
displayed.
/STATE=(state,...)
Displays the key definitions for the specified state(s). The default is to show the
key definitions for all states.
Examples
CTF> SHOW KEY KP2
shows the current definition of KP2 in all states.
CTF> SHOW KEY /ALL
shows the current definition of all keys in all states.
4–16 CTF Commands
SPAWN
SPAWN
The SPAWN command creates a sub-process of the current process.
Format
SPAWN [/qualifiers] [command-string]
Parameters
command-string
Specifies a command string of up to 131 characters that is to be executed in the
context of the created sub-process. When the command completes, the sub-process
terminates and control returns to the parent process.
If you do not specify a command string, a sub-process is created and remains
until you log out.
Qualifiers
/INPUT=file-spec
Specifies an input file that contains one or more DCL commands to be executed
by the spawned sub-process. Once processing of the input file is complete, the
sub-process is terminated. If both a command string and the /INPUT qualifier
are specified, the specified command string is executed before the DCL commands
in the file specified by the /INPUT qualifier.
/LOGICAL_NAMES
/NOLOGICAL_NAMES
Specifies whether process logical names and logical name tables are to be copied
to the spawned sub-process. The default is LOGICAL_NAMES.
/OUTPUT=file-spec
Specifies the name of the output file to which the spawned sub-process writes its
output. The default is SYS$OUTPUT.
/PROCESS_NAME=subprocess-name
Specifies the name of the sub-process to be created. By default, a unique process
name is assigned with the same base name as the parent process and a unique
number.
/PROMPT=string
Specifies the prompt for DCL to use within the sub-process. By default, SPAWN
copies the current prompt from the parent process.
/SYMBOLS
/NOSYMBOLS
Specifies whether the system passes DCL global and local symbols to the subprocess. The default is /SYMBOLS.
/WAIT
/NOWAIT
Specifies whether the system waits until the current sub-process is completed
before allowing more commands to be issued by the parent process. The default
is /WAIT.
CTF Commands 4–17
SPAWN
Examples
CTF> SPAWN "SHOW SYSTEM"
spawns a sub-process in which a SHOW SYSTEM command is executed, after
which control returns to the parent process.
CTF> SPAWN /INPUT=CMDS.COM
spawns a sub-process and executes the DCL commands in CMDS.COM, after
which control returns to the parent process.
CTF> SPAWN /INPUT=CMDS.COM/OUTPUT=CMDS_OUT.LIS/NOWAIT
also executes the DCL commands in CMDS.COM, but returns control
immediately to the parent process without waiting for the spawned sub-process to
complete. Any output produced by the sub-process is written to CMDS_OUT.LIS.
4–18 CTF Commands
START
START
The START command starts tracing on one or more specified tracepoints.
Format
START [node-name["user-name password"]::] "tracepoint-name",... [/qualifiers]
Parameters
node-name
Specifies the node name of a remote server. You must specify a node name when
starting a remote tracepoint.
user-name
Specifies the user name associated with the remote CTF object. You must specify
this user name if the remote CTF object is protected.
password
Specifies the password associated with the remote CTF object. You must specify
this password if the remote CTF object is protected.
tracepoint-name
Specifies the name of a tracepoint that you want to trace. If you are specifying
more than one tracepoint, separate each tracepoint name with a comma.
Qualifiers
The qualifiers for this command are presented in three groups:
1. Qualifiers that are relevant only for detached tracing (that is, tracing that is
started by a START/NOLIVE command).
2. Qualifiers that are relevant only for live tracing (that is, tracing that is
started by a START/LIVE command).
3. Qualifiers that are relevant for both detached and live tracing.
Detached Tracing
/BLOCKS=n
Specifies the size, in blocks, of the trace file to which trace records from the
specified tracepoints are written. If a trace file reaches its maximum size, a
new version of the trace file is created. The default file size is 200 blocks. The
minimum file size is 20 blocks.
/OUTPUT=filename
Specifies the name of the trace file to which trace records are written. The default
trace file is the file CTF$TRACE.DAT in your default directory.
/PRIORITY=priority
Specifies the base priority for the trace server process that writes trace records to
the trace file. The default is 9. The lowest is 0 and the highest is 15.
/PROCESS_NAME=process-name
Specifies the name to be given to the trace server process that is created to write
trace records to the trace file. The default process name is username$CTF.
CTF Commands 4–19
START
/VERSION_LIMIT=n
Specifies the number of versions of the trace file to keep. When this many
versions have been created, each new version of the trace file causes the oldest
current version to be deleted. The default is 10.
Live Tracing
/BRIEF
Specifies that a single-line analysis of the protocol data in each trace record is
displayed. The default is /BRIEF. This qualifier is effective only if the relevant
protocol analysis routines support abbreviated analysis of protocol data.
/DISPLAY=(field,...)
/NODISPLAY
Specifies which fields (apart from the protocol data itself) in a trace record are
displayed. The fields that can be displayed are:
[NO]ALL
[NO]CONTEXT
[NO]EVENT
[NO]FUNCTION_CODE
[NO]NAME
[NO]SIZE
[NO]STATUS
[NO]TIME
All the fields shown below are displayed.
Tracepoint-specific information
The event code
The tracepoint-specific function code of the
operation being traced.
The name of the tracepoint from which the trace
record was collected. Names longer than 16
characters will be truncated on the right.
The original size of the trace data, in bytes
If the value in this field is non-zero, it is the
current status of the operation being traced.
The time at which the trace record was collected.
The default display is:
TIME
EVENT
SIZE
/FULL
Specifies that a multi-line analysis of the protocol data in each trace record is
produced. If you do not specify /FULL, the default is /BRIEF. This qualifier is
effective only if the relevant protocol analysis routines support full analysis of
protocol data.
/NAME=instance-name
Specifies the instance part of a tracepoint name. A trace record is displayed
only if it came from the specified tracepoint. If you specify only the first part of
an instance name, trace records are displayed from all tracepoints whose name
begins with this string. The default is to display trace records from all active
tracepoints.
/PAGE=lines-per-page
Specifies the number of lines per page when writing output to a file. This
qualifier has no effect if trace records are being displayed on your terminal. The
default is defined by the logical name SYS$LP_LINES, which usually has the
value 66.
4–20 CTF Commands
START
/PROTOCOL=(protocol-identifier,...)
/NOPROTOCOL
Specifies the type of analysis performed on each trace record. The protocol data in
each trace record is analyzed for each of the protocols listed in the /PROTOCOL
qualifier, in the order in which they are specified. If you do not specify this
qualifier, only the protocol data supplied at the protocol level of the originating
tracepoint is analyzed; protocol data from lower levels is displayed, unanalyzed,
as user data. If you specify /NOPROTOCOL, no analysis is performed on the
protocol data in the trace record; it is all presented as user data.
/REVERSE
/NOREVERSE
Specifies that received data will be displayed in reverse video, and titles will be
displayed in bold. The default is /REVERSE.
/SAVE_BUFFER_SIZE=n
Specifies how many screens of saved lines of data will be kept. These lines can be
examined by using the NEXT and BACK commands. The default is 30 screens.
The minimum is 1 screen. The maximum is 1000 screens.
/SELECT=(protocol-identifier,...)
Specifies which protocol analyses are to be displayed. This qualifier is only useful
if you have used the /PROTOCOL qualifier to request multiple protocol analysis
of a trace record. The default is to display all the protocol analyses requested by
the /PROTOCOL qualifier.
/TRUNCATE
/NOTRUNCATE
Specifies whether data that will not fit on one line is truncated or continued on
the next line. The default is /NOTRUNCATE.
/WIDTH=n
Specifies the width of the output. The default is the width of your terminal
screen.
Detached or Live Tracing
/BUFFER_SIZE=n
Specifies the size, in bytes, of each CTF internal trace buffer (used for remote
tracing only). The default buffer size is 512 bytes. The minimum buffer size is 68
bytes. You can set this value larger to enable CTF to include more trace records
in a single buffer.
/CAPTURE_SIZE=n
Specifies the amount of data, in bytes, captured in each trace record. The default
data size is 188 bytes. The minimum data size is 0. The maximum data size is
5000 bytes.
/COLLECT
/NOCOLLECT
NOCOLLECT prevents collected trace records being written to a trace file or
displayed on your terminal until you issue a COLLECT command. The buffer
into which trace records are collected is used as a circular buffer; when the
buffer is full, new trace records overwrite the oldest trace records. The default is
/COLLECT.
CTF Commands 4–21
START
/FILTER=(event-code,...)
/NOFILTER
Specifies a filter for trace records. A trace record is collected only if its event
code is one of those specified in the filter. See the appendixes to this manual for
a list of the event codes supported by each tracepoint. This value overrides the
current filter, if any. You cannot specify this qualifier with /SELECT. The default
is /NOFILTER, meaning that all trace records are collected.
/LIVE
/NOLIVE
Specifies whether live or detached tracing is performed on the specified
tracepoints. The default is /NOLIVE, indicating that detached tracing is
performed.
/MAXIMUM_BUFFERS=n
Specifies the maximum number of CTF internal trace buffers. The default is 5.
/TIME_OUT=n
Specifies the interval, in seconds, for which CTF support waits before flushing
partially filled buffers to the the trace server process. The default for detached
tracing is 0 (which means no time out is used); the default for live tracing is 5
seconds.
Description
You cannot perform live and detached tracing at the same time from the same
user process. If you are currently performing live tracing and you wish to perform
detached tracing from the same user process, you must first stop all live tracing,
and vice versa.
You cannot perform local and remote tracing at the same time from the same
user process. This means that you cannot specify local and remote tracepoints in
the same START command. If you are currently tracing local tracepoints and you
wish to trace remote tracepoints from the same user process, you must first stop
all local tracing, and vice versa.
A single user process can collect trace records from only one system at a time. If
you are remote tracing, all the remote tracepoints from which the trace session is
collecting must be on the same server.
You can have only one local trace session at any given time.
Examples
CTF> START "ROUTING CIRCUIT UNA-0"
starts detached tracing at the specified local tracepoint. Trace records are written
to CTF$TRACE.DAT in your default directory. The trace server process that
collects trace records is username$CTF.
CTF> START NODEB"netman netmanpw"::"ROUTING CIRCUIT UNA-2"
starts detached tracing at the specified remote tracepoint.
4–22 CTF Commands
START
CTF> START "ROUTING CIRCUIT UNA-1" /OUT=UNA-1/PROC=UNA1PROC
starts detached tracing at the specified local tracepoint. Trace records are written
to the file UNA-1.DAT, and the name of the trace server process that is created to
collect trace records is UNA1PROC.
CTF> START "ROUTING CIRCUIT UNA-3" /LIVE/FULL
starts live tracing at the specified local tracepoint. A full analysis of each trace
record is displayed on your screen.
CTF Commands 4–23
STOP
STOP
The STOP command stops collection at one or more specified tracepoints.
Format
STOP ["tracepoint-name",...] [/qualifier]
Parameters
tracepoint-name
Specifies the tracepoint(s) at which collection is to be stopped.
Qualifiers
/PROCESS_NAME=process-name
Specifies the process name of the trace server process associated with the specified
tracepoints. This must be the process name specified in the /PROCESS_NAME
qualifier of the START command that started the tracing. This qualifier is only
relevant for detached tracing. The default process name is username$CTF.
Description
If you do not specify a tracepoint, all tracing will be stopped.
If you stop all detached tracing, the trace server process will exit. If you stop all
tracing on the local VMS system, the process CTF$DCP will also exit.
Examples
CTF> STOP
stops all current tracing associated with username$CTF.
CTF> STOP "ROUTING CIRCUIT *"
stops tracing on all local ROUTING CIRCUIT entities.
CTF> STOP "ROUTING CIRCUIT UNA-1" /PROC=UNA1PROC
stops tracing at the specified tracepoint, which is being traced by the UNA1PROC
detached process. The START command that started tracing at ROUTING
CIRCUIT UNA-1 must have specified /PROC=UNA1PROC.
4–24 CTF Commands
A
DEC WANrouter 100/500 Tracepoints
This appendix describes the tracepoints provided by DEC WANrouter 100/500.
These tracepoints are (starting from the lowest protocol level):
MODEM_CONNECT LINE
DDCMP LINK
HDLC LINK
LAPB LINK
CSMA-CD STATION
CSMA-CD PORT
X25L3 DTE
X25L3 CIRCUIT
ROUTING CIRCUIT
NSP PORT
Note that tracepoints within DEC WANrouter 100/500 can only be traced
remotely from a VMS load host; consequently, you must always specify the node
name, user name, and password components of tracepoint names.
DEC WANrouter 100/500 Tracepoints A–1
MODEM_CONNECT LINE
MODEM_CONNECT LINE
Format
node-name"user-name password"::"MODEM_CONNECT LINE line-name"
node-name
Specifies the name of the router node.
user-name
Specifies the user name associated with the remote CTF object.
password
Specifies the password associated with the remote CTF object.
line-name
Specifies the name of the MODEM CONNECT LINE entity to be traced.
Description
This traces DEC STD52 state changes and data PDU’s transmitted on the
specified Modem Connect line. Table A–1 lists the events that are recognized at
this tracepoint.
Table A–1 MODEM_CONNECT LINE Trace Events for DEC WANrouter
Trace Event
Description
RX
TX
0020
Receive
Transmit
DEC STD52 state change
Example
See the MODEM_CONNECT LINE example in Appendix C.
A–2 DEC WANrouter 100/500 Tracepoints
DDCMP LINK
DDCMP LINK
Format
node-name"user-name password"::"DDCMP LINK link-name"
node-name
Specifies the name of the router node.
user-name
Specifies the user name associated with the remote CTF object.
password
Specifies the password associated with the remote CTF object.
link-name
Specifies the name of the DDCMP LINK entity to be traced.
Description
This traces all data link PDUs transmitted and received by the DDCMP module
on the specified link. Table A–2 lists the events recognized at this tracepoint.
Table A–2 DDCMP LINK Trace Events for DEC WANrouter
Trace Events
Description
RX
TX
0020
0021
Receive
Transmit
Flush sent to physical layer/device driver
Flush DONE back by physical layer/device driver
Example
See the example for DDCMP LINK in Appendix C.
DEC WANrouter 100/500 Tracepoints A–3
HDLC LINK
HDLC LINK
Format
node-name"user-name password"::"HDLC LINK link-name"
node-name
Specifies the name of the router node.
user-name
Specifies the user name associated with the remote CTF object.
password
Specifies the password associated with the remote CTF object.
link-name
Specifies the name of the HDCL LINK entity to be traced.
Description
This traces HDLC frames on the specified link. The default analysis of this
tracepoint will analyze the HDLC frame header. Table A–3 lists the events
recognized at this tracepoint.
Table A–3 HDLC LINK Trace Events for DEC WANrouter
Trace Event
Description
RX
TX
Receive
Transmit
Note that if you specify the /FULL qualifier in the START or ANALYZE command,
a full analysis of XID frames will be produced.
Example
See the HDLC LINK example in Appendix C.
A–4 DEC WANrouter 100/500 Tracepoints
LAPB LINK
LAPB LINK
Format
node-name"user-name password"::"LAPB LINK link-name"
node-name
Specifies the name of the router node.
user-name
Specifies the user name associated with the remote CTF object.
password
Specifies the password associated with the remote CTF object.
link-name
Specifies the name ofthe LAPB LINK entity to be traced.
Description
This traces all data link PDUs transmitted and received by the specified LABP
LINK entity. Table A–4 lists the events that are recognized at this tracepoint.
Table A–4 LAPB LINK Trace Events for DEC WANrouter
Trace Event
Description
RX
TX
0020
0023
0024
0026
0027
0028
Receive
Transmit
Acknowledge Timer expired
Retry Maximum reached
Flush issued to line
Line has come up
Line has come down
Line reset sent to device driver
Example
See the example for LAPB LINK in Appendix B.
DEC WANrouter 100/500 Tracepoints A–5
CSMA-CD STATION
CSMA-CD STATION
Format
node-name"user-name password"::"CSMA-CD STATION station-name"
node-name
Specifies the name of the router node.
user-name
Specifies the user name associated with the remote CTF object.
password
Specifies the password associated with the remote CTF object.
station-name
Specifies the name of the CSMACD STATION entity to be traced.
Description
This traces the complete 802.3 frames or the ETHERNET frame, decoding the
802.3 and 802.2 headers where applicable. Table A–5 lists the events recognized
at this tracepoint.
Table A–5 CSMA-CD STATION Trace Events for DECnet–VAX
Trace Event
Description
RX
TX
Receive
Transmit
Note that you cannot specify the /FULL qualifier in the START or ANALYZE
command for this tracepoint.
A–6 DEC WANrouter 100/500 Tracepoints
CSMA-CD STATION
Example
$ TRACE START mynode"myname mypw"::"CSMA-CD STATION csmacd-0"/LIVE
produces the following output:
-----------+----+-----+<-----802.3 Frame Header------>+<-----802.2 Frame Header----->+
Time |Evnt|Data | Destination| Source |Len- |Dst Src C P Type
N
N
|
hh mm ss cc|
|Size | Address | Address |gth |SAP SAP R F
R/S R/S |
-----------+----+-----+<----------------------------->+<-----------------------------+
13:16:18.95|TX | 40|09002B000004|AA0004005606| 26| FE FE C UI
|
13:16:18.95|TX | 40|09002B000004|AA0004005606| 26| FE FE C UI
|
13:16:18.96|RX | 1518|AA0004005606|AA0004001C05|60-03| Ethernet (length = 29)
|
13:16:18.98|RX | 1518|AA0004005606|AA0004001C05|60-03| Ethernet (length = 29)
|
13:16:19.06|RX | 1518|AB0000030000|AA0004005506|60-03| Ethernet (length = 34)
|
13:16:19.08|RX | 1518|AA0004005606|AA0004001C05|60-03| Ethernet (length = 29)
|
13:16:19.12|RX | 1518|AB0000030000|AA000400DB05|60-03| Ethernet (length = 34)
|
13:16:19.12|RX | 1518|09002B020000|AA000400DB05|60-03| Ethernet (length = 34)
|
13:16:19.14|RX | 1518|AA0004005606|AA0004001C05|60-03| Ethernet (length = 29)
|
13:16:19.15|RX | 1518|AA0004005606|AA0004001C05|60-03| Ethernet (length = 29)
|
13:16:19.17|RX | 1518|09002B000005|AA0004004806| 1500| SNAP (PID = 08-00-2B-60-03) |
13:16:19.18|RX | 1518|AB0000030000|AA0004004306|60-03| Ethernet (length = 34)
|
13:16:19.19|RX | 1518|09002B020000|AA0004004306|60-03| Ethernet (length = 34)
|
13:16:19.19|RX | 1518|09002B000005|AA0004000106| 1500| SNAP (PID = 08-00-2B-60-03) |
13:16:19.21|RX | 1518|AA0004005606|AA0004001C05|60-03| Ethernet (length = 29)
|
13:16:19.23|RX | 1518|AA0004005606|AA0004001C05|60-03| Ethernet (length = 29)
|
13:16:19.23|RX | 1518|AA0004005606|AA0004001C05|60-03| Ethernet (length = 29)
|
13:16:19.24|RX | 1518|AA0004005606|AA0004001C05|60-03| Ethernet (length = 29)
|
13:16:19.24|RX | 1518|AA0004005606|AA0004001C05|60-03| Ethernet (length = 29)
|
13:16:19.27|RX | 1518|AA0004005606|AA0004001C05|60-03| Ethernet (length = 29)
|
13:16:19.27|RX | 1518|09002B000005|AA000400DB05| 1500| SNAP (PID = 08-00-2B-60-03) |
13:16:19.28|RX | 1518|AA0004005606|AA0004001C05|60-03| Ethernet (length = 29)
|
13:16:19.37|RX | 1518|AA0004005606|AA0004001C05|60-03| Ethernet (length = 29)
|
13:16:19.38|RX | 1518|AA0004005606|AA0004001C05|60-03| Ethernet (length = 29)
|
13:16:19.40|RX | 1518|AA0004005606|AA0004001C05|60-03| Ethernet (length = 29)
|
13:16:19.41|RX | 1518|AA0004005606|AA0004001C05|60-03| Ethernet (length = 29)
|
13:16:19.42|RX | 1518|09002B000005|AA0004008B05| 1500| SNAP (PID = 08-00-2B-60-03) |
13:16:19.44|RX | 1518|AA0004005606|AA0004001C05|60-03| Ethernet (length = 29)
|
13:16:19.49|RX | 1518|AA0004005606|AA0004001C05|60-03| Ethernet (length = 29)
|
13:16:19.67|RX | 1518|09002B000005|AA0004004406| 1500| SNAP (PID = 08-00-2B-60-03) |
13:16:19.75|RX | 1518|09002B020000|AA000400DB05| 1500| SNAP (PID = 08-00-2B-60-03) |
13:16:19.94|RX | 1518|AB0000030000|AA000400DB05|60-03| Ethernet (length = 50)
|
DEC WANrouter 100/500 Tracepoints A–7
CSMA-CD PORT
CSMA-CD PORT
Format
node-name"user-name password"::"CSMA-CD PORT port-name"
node-name
Specifies the name of the router node.
user-name
Specifies the user name associated with the remote CTF object.
password
Specifies the password associated with the remote CTF object.
port-name
Specifies the name of the CSMACD PORT entity to be traced.
Description
This traces the DATA part of ETHERNET frames and the 802.2 LLC PDU part of
802.3 frames. Table A–6 lists the events recognized at this tracepoint.
Table A–6 CSMA-CD PORT Trace Events for DECnet–VAX
Trace Event
Description
RX
TX
Receive
Transmit
Note that you cannot specify the /FULL qualifier in a START or ANALYZE
command for this tracepoint.
Example
$ TRACE START mynode"myname mypw"::"CSMA-CD PORT CSMACD-0"/LIVE
produces the following output:
-----------+----+-----+<-----802.2 Frame Header----->+
Time |Evnt|Data |Dst Src C P Type
N
N |
hh mm ss cc|
|Size |SAP SAP R F
R/S R/S |
-----------+----+-----+<-----------------------------+
13:16:44.04|RX | 31| Ethernet (length = 29)
|
13:16:44.07|RX | 31| Ethernet (length = 29)
|
13:16:44.29|RX | 1500| SNAP (PID = 08-00-2B-60-03) |
13:16:44.40|RX | 35| FE FE C UI
|
13:16:44.46|RX | 31| Ethernet (length = 29)
|
13:16:44.73|RX | 1500| SNAP (PID = 08-00-2B-60-03) |
13:16:44.76|TX | 26| FE FE C UI
|
13:16:44.79|TX | 26| FE FE C UI
|
13:16:44.82|TX | 26| FE FE C UI
|
13:16:44.88|RX | 1500| SNAP (PID = 08-00-2B-60-03) |
13:16:44.90|RX | 76| Ethernet (length = 74)
|
13:16:44.93|RX | 36| Ethernet (length = 34)
|
13:16:44.96|RX | 1500| SNAP (PID = 08-00-2B-60-03) |
A–8 DEC WANrouter 100/500 Tracepoints
X25L3 DTE
X25L3 DTE
Format
node-name"user-name password"::"X25L3 DTE DTE-name"
node-name
Specifies the node name of a remote server.
user-name
Specifies the user name associated with the remote CTF object.
password
Specifies the password associated with the remote CTF object.
DTE-name
Specifies the name of the X25 PROTOCOL DTE entity to be traced.
Description
This traces all X25 packet-level PDUs transmitted and received by the X25
PROTOCOL Module on the specified DTE. Table A–7 lists the events that are
recognized at this tracepoint.
Table A–7 X.25 DTE Trace Events for VAX P.S.I.
Trace Event
Description
RX
TX
0020
0021
0022
0023
0024
0025
0026
0027
Receive
Transmit
Call Timer expired
Clear Timer Timer expired
Reset Timer expired
Restart Timer expired
Link has come up
Link has gone down
Interrupt Timer expired
Link has been reset
Example
See the example for X25L3 DTE in Appendix B.
DEC WANrouter 100/500 Tracepoints A–9
X25L3 CIRCUIT
X25L3 CIRCUIT
Format
node-name"user-name password"::"X25L3 CIRCUIT *"
node-name
Specifies the node name of a remote server.
user-name
Specifies the user name associated with the remote CTF object.
password
Specifies the password associated with the remote CTF object.
Description
This tracepoint traces all X25 packet level PDUs transmitted and received by the
X25 Protocol Module. Tracing can be enabled for all circuits only. Table A–8 lists
the events that are recognized at this tracepoint.
Table A–8 X.25L3 CIRCUIT Trace Events for VAX P.S.I.
Trace Event
Description
RX
TX
Receive
Transmit
Example
See the example for X25L3 CIRCUIT in Appendix B.
A–10 DEC WANrouter 100/500 Tracepoints
ROUTING CIRCUIT
ROUTING CIRCUIT
Format
node-name"user-name password"::"ROUTING CIRCUIT circuit-name"
node-name
Specifies the name of the router node.
user-name
Specifies the user name associated with the remote CTF object.
password
Specifies the password associated with the remote CTF object.
circuit-name
Specifies the name of the ROUTING CIRCUIT entity to be traced.
Description
This traces all network-layer PDUs transmitted and received by the specified
circuit.
Note that it is not possible to trace circuits whose instance identifier is a Binary
or Quoted Simplename. Table A–9 lists the events that are recognized at this
tracepoint.
Table A–9 ROUTING CIRCUIT Trace Events for DEC WANrouter
Trace Event
Description
ARRX
ARTX
IPRX
IPTX
RX
TX
ARP Receive
ARP Transmit
IP Receive
IP Transmit
Receive
Transmit
Example
$ TRACE START/LIVE MYNODE"MYNAME NODEPW"::"ROUTING CIRCUIT CSMA-CD-0"
produces the following output:
DEC WANrouter 100/500 Tracepoints A–11
ROUTING CIRCUIT
-----------+----+-----+----------------- Routing Packet Header ---------------Time |Evnt|Data |
hh mm ss cc|
|Size |
-----------+----+-----+-------------------------------------------------------09:28:53.00|TX | 1492|
Type: LAN L2 Hello
**1**
|
Protocol ID: 08, Length: 1B, Version: 01
|
Source ID: 08-00-2B-0B-04-28, Holding Time: 30
|
Version: V3.0.0, Segment Length: 05D4
| Circuit: Level 2, L1 Algorithm: N/A, L2 Algorithm: LS
|
Priority: 64, LAN ID: 08-00-2B-0B-04-A6.01
| Options:
|
Type: 01 (Area Address) Length: 12
|
Area: 490041
|
Area: 490042
|
Area: 490001
|
Type: 06 (RTR Nbrs) Length: 6
|
Nbr: AA-00-04-00-DB-A9
|
Type: 08 (DNA Padding) Length: 255
|
Type: 08 (DNA Padding) Length: 255
|
Type: 08 (DNA Padding) Length: 255
|
Type: 08 (DNA Padding) Length: 255
|
Type: 08 (DNA Padding) Length: 255
|
Type: 08 (DNA Padding) Length: 156
|
09:28:53.05|RX | 74|
Phase IV Type: L1 RV, Padding: 0, Flags: **2**
|
Source Node: 1.284
|
09:28:53.31|RX | 1492|
Type: LAN L1 Hello
|
Protocol ID: 08, Length: 1B, Version: 01
|
Source ID: 08-00-2B-0B-02-52, Holding Time: 9
|
Version: V3.0.0, Segment Length: 05D4
| Circuit: Level 1, L1 Algorithm: RV, L2 Algorithm: N/A
|
Priority: 64, LAN ID: 08-00-2B-06-91-F2.01
| Options:
|
Type: 01 (Area Address) Length: 12
|
Area: 490041
|
Area: 490042
|
Area: 490001
|
Type: 06 (RTR Nbrs) Length: 42
|
Nbr: AA-00-04-00-01-06
|
Nbr: AA-00-04-00-44-06
|
Nbr: AA-00-04-00-8B-05
|
Nbr: AA-00-04-00-55-06
|
Nbr: AA-00-04-00-48-06
|
Nbr: AA-00-04-00-46-06
|
Type: 08 (DNA Padding) Length: 255
|
Type: 08 (DNA Padding) Length: 255
|
Type: 08 (DNA Padding) Length: 255
|
Type: 08 (DNA Padding) Length: 255
|
Type: 08 (DNA Padding) Length: 255
|
Type: 08 (DNA Padding) Length: 120
|
09:29:10.93|RX | 257|
Type: L1 CSNP
|
Protocol ID: 08, Length: 21, Version: 01
|
Src: 08-00-2B-0B-04-A6.00, V3.0.0
|Range: 00-00-00-00-00-00.00.00:FF-FF-FF-FF-FF-FF.FF.FF
|08-00-2B-0B-04-A6.00.00, Seq #:
656, Life:
37
|08-00-2B-0B-04-A6.01.00, Seq #:
869, Life:
52
|08-00-2B-0B-04-A6.01.01, Seq #:
636, Life: 116
|08-00-2B-0B-04-A6.01.02, Seq #:
636, Life: 116
|08-00-2B-0B-04-A6.01.03, Seq #:
636, Life: 116
|08-00-2B-0B-04-A6.01.04, Seq #:
636, Life: 116
|08-00-2B-0B-04-A6.01.05, Seq #:
636, Life: 116
|08-00-2B-0B-04-A6.01.06, Seq #:
635, Life: 116
|08-00-2B-0B-04-A6.01.07, Seq #:
635, Life: 116
|08-00-2B-0B-04-A6.01.08, Seq #:
636, Life: 116
|08-00-2B-0B-04-A6.01.09, Seq #:
636, Life: 116
|08-00-2B-0B-04-A6.01.0A, Seq #:
636, Life: 116
|08-00-2B-0B-04-A6.01.0B, Seq #:
635, Life: 116
|08-00-2B-0B-04-A6.01.0C, Seq #:
635, Life: 116
|
09:29:15.52|RX | 107|
Type: DT
**3**
|
Protocol ID: 81, Length: 28, Version: 01
A–12 DEC WANrouter 100/500 Tracepoints
ROUTING CIRCUIT
09:29:15.52|TX |
09:29:15.69|TX |
|
Lifetime: 1E, Checksum: 0000, Flags: SP ER **4**
|
Destination Address
|
49004108002B0964E701
|
Source Address
|
49004108002B107A9701
|
Segment Length: 006B, Data Unit Id: 0536
|
Segment Offset: 0000, Total Length: 006B
| Options:
|
Type: C3 (QOS) Length: 1 Value: C4
|
31|
Type: RD
|
Protocol ID: 82, Length: 1F, Version: 01
|
Holding Time: 0258, Checksum: 0000
|
Destination Address
|
49004108002B0964E701
|
Subnet Address
|
AA-00-04-00-DC-06
| Options:
|
Type: C3 (QOS) Length: 1 Value: C4
|
70|
Type: L1 LSP
|
Protocol ID: 08, Length: 1B, Version: 01
|Src: 08-00-2B-0B-04-28.00.00, V3.0.0, Seq #:
86
| Good Type: L1+L2, Life: 1199, Phase: V, Overload: N **4**
|
Area 490041
|
Area 490042
|
Area 490001
| Router 08-00-2B-06-91-F2.01, Cost: 20
| Endnode 08-00-2B-0B-04-28, Cost: 0
| Endnode AA-00-04-00-59-06, Cost: 0
|
DEC WANrouter 100/500 Tracepoints A–13
NSP PORT
NSP PORT
Format
node-name"user-name password"::"NSP PORT port-reference"
node-name
Specifies the name of the router node.
user-name
Specifies the user name associated with the remote CTF object.
password
Specifies the password associated with the remote CTF object.
port-reference
Specifies the 4-digit local reference number of the NSP PORT entity to be traced.
Description
This traces all PDUs transmitted and received by the specified port. Note,
however, that NSP ports used by CTF to transfer trace records to the collecting
VMS host are not traced.
Table A–10 lists the events that are recognized at this tracepoint.
Table A–10 NSP PORT Trace Events for DEC WANrouter
Trace Event
Description
RX
TX
Receive
Transmit
Example
$ TRACE START/LIVE MYNODE"MYNAME NODEPW"::"NSP PORT *"/LIVE
produces the following output:
A–14 DEC WANrouter 100/500 Tracepoints
NSP PORT
-----------+----+-----+<--------------------NSP Frame------------------>+
Time |Evnt|Data |Msg
Data Other Segnum Drc
Flow|
hh mm ss cc|
|Size |Type Dest Source C Numb Numb D Numb
Irc Cntl|
-----------+----+-----+<----------------------------------------------->+
16:15:30.68|RX |
7|Dack 9731 8199
8
|
16:15:31.66|TX | 292|Data 8199 9731
2
9
|
16:15:31.68|RX |
7|Dack 9731 8199
9
|
16:15:32.66|TX | 292|Data 8199 9731
2
10
|
16:15:32.68|RX |
7|Dack 9731 8199
10
|
16:15:32.79|RX | 13|DisI 9729 8214
Reason = Abort
|
16:15:32.84|TX |
7|DisC 8214 9729
Reason = Disc Complete
|
16:15:32.90|RX | 13|DisI 9729 8214
Reason = Abort
|
16:15:32.95|TX |
7|DisC 8214 9729
Reason = Disc Complete
|
16:15:32.95|TX | 448|Data 8199 9731
2
11
|
16:15:32.97|RX |
7|Dack 9731 8199
11
|
16:15:32.98|RX |
7|Dack 9731 8199
11
|
16:15:32.98|TX | 448|Data 8199 9731
2
12
|
16:15:33.01|RX |
7|Dack 9731 8199
12
|
16:15:33.01|RX |
7|Dack 9731 8199
12
|
16:15:33.66|TX | 442|Data 8199 9731
2
13
|
16:15:33.68|RX |
7|Dack 9731 8199
13
|
16:15:34.66|TX | 292|Data 8199 9731
2
14
|
16:15:34.68|RX |
7|Dack 9731 8199
14
|
16:15:34.69|RX |
7|Dack 9731 8199
14
|
16:15:35.66|TX | 367|Data 8199 9731
2
15
|
16:15:35.68|RX |
7|Dack 9731 8199
15
|
16:15:36.66|TX | 292|Data 8199 9731
2
16
|
16:15:36.68|RX |
7|Dack 9731 8199
16
|
16:15:37.66|TX | 292|Data 8199 9731
2
17
|
16:15:37.68|RX |
7|Dack 9731 8199
17
|
16:15:38.66|TX | 292|Data 8199 9731
2
18
|
16:15:38.68|RX |
7|Dack 9731 8199
18
|
16:15:39.66|TX | 292|Data 8199 9731
2
19
|
16:15:39.69|RX |
7|Dack 9731 8199
19
|
16:15:39.70|RX |
7|Dack 9731 8199
19
|
16:15:40.66|TX | 367|Data 8199 9731
2
20
|
16:15:40.68|RX |
7|Dack 9731 8199
20
|
16:15:40.69|RX |
7|Dack 9731 8199
20
|
16:15:41.66|TX | 367|Data 8199 9731
2
21
|
16:15:41.68|RX |
7|Dack 9731 8199
21
|
16:15:42.66|TX | 292|Data 8199 9731
2
22
|
16:15:42.67|RX |
7|Dack 9731 8199
22
|
16:15:43.66|TX | 292|Data 8199 9731
2
23
|
16:15:43.68|RX |
7|Dack 9731 8199
23
|
16:15:43.69|RX |
7|Dack 9731 8199
23
|
16:15:44.66|TX | 367|Data 8199 9731
2
24
|
16:15:44.68|RX |
7|Dack 9731 8199
24
|
16:15:44.69|RX |
7|Dack 9731 8199
24
|
16:15:45.66|TX | 367|Data 8199 9731
2
25
|
16:15:45.67|RX |
7|Dack 9731 8199
25
|
16:15:46.66|TX | 292|Data 8199 9731
2
26
|
16:15:46.68|RX |
7|Dack 9731 8199
26
|
DEC WANrouter 100/500 Tracepoints A–15
B
VAX P.S.I. Tracepoints
This appendix describes the tracepoints provided by VAX P.S.I. for
DECnet/OSI for VMS. These tracepoints are (starting from the lowest
protocol level):
LAPB LINK
LLC2 SAP LINK
X25L3 DTE
X25L3 CIRCUIT
X25GAP CIRCUIT
VAX P.S.I. Tracepoints B–1
LAPB LINK
LAPB LINK
Format
"LAPB LINK link-name"
link-name
Specifies the name of the LAPB LINK entity to be traced.
Description
This traces all data link PDUs transmitted and received by the specified LABP
LINK entity. Table B–1 lists the events that are recognized at this tracepoint.
Table B–1 LAPB LINK Trace Events for VAX P.S.I.
Trace Event
Description
RX
TX
0020
0023
0024
0026
0027
0028
Receive
Transmit
Acknowledge Timer expired
Retry Maximum reached
Flush issued to line
Line has come up
Line has come down
Line reset sent to device driver
Example
$ TRACE START/LIVE "LAPB LINK dsv-0"/PROTOCOL=LAPB
produces the following output:
-----------+----+-----+<--------Frame-------->+
Time |Evnt|Data |Ad P Type
N
N |
hh mm ss cc|
|Size | F
R/S R/S |
-----------+----+-----+<--------------------->+
14:54:22.24|TX | 15| C I
1/1
|
14:54:22.30|RX |
2| R RR
2/ |
14:54:23.25|RX |
5| C I
2/1 |
14:54:23.25|TX |
2| R RR
2/
|
14:54:23.27|RX | 16| C I
2/2 |
14:54:23.27|TX |
2| R RR
3/
|
14:54:23.28|RX |
6| C I
2/3 |
14:54:23.28|TX |
2| R RR
4/
|
14:54:23.38|TX |
5| C I
4/2
|
14:54:23.39|RX |
2| R RR
3/ |
14:54:23.67|TX |
5| C I
4/3
|
14:54:23.68|RX |
2| R RR
4/ |
14:54:23.80|TX | 16| C I
4/4
|
14:54:23.83|RX |
2| R RR
5/ |
14:54:23.85|RX |
5| C I
5/4 |
14:54:23.85|TX |
2| R RR
5/
|
14:54:24.14|RX |
8| C I
5/5 |
14:54:24.14|TX |
2| R RR
6/
|
B–2 VAX P.S.I. Tracepoints
LLC2 SAP LINK
LLC2 SAP LINK
Format
"LLC2 SAP sap-name LINK link-name"
sap-name
Specifies the name of the SAP whose link is to be traced.
link-name
Specifies the name of the SAP LINK entity to be traced.
Description
This traces all data-link PDUs transmitted and received by the LLC2 Module
on the specified link. Table B–2 lists the events that are recognized at this
tracepoint.
Table B–2 LLC2 SAP LINK Trace Events for VAX P.S.I.
Trace Event
Description
RX
TX
0020
0021
0022
0023
0025
Receive
Transmit
Acknowledge Timer expired
Poll Timer expired
Reject Timer expired
Busy Timer expired
Retry Maximum reached
Example
$ TRACE START/LIVE "LLC2 SAP LINK lan-0"/PROTOCOL=LLC2"
produces the following output:
-----------+----+-----+<-----802.2 Frame Header----->+
Time |Evnt|Data |Dst Src C P Type
N
N |
hh mm ss cc|
|Size |SAP SAP R F
R/S R/S |
-----------+----+-----+<-----------------------------+
14:58:12.60|TX | 22| 7E 7E R I
1/1
|
14:58:13.12|RX |
4| 7E 7E R RR
2/ |
14:58:13.50|RX | 15| 7E 7E R I
2/1 |
14:58:13.51|RX | 18| 7E 7E R I
2/2 |
14:58:13.52|RX |
8| 7E 7E R I
2/3 |
14:58:13.68|TX |
7| 7E 7E R I
4/2
|
14:58:14.02|TX |
7| 7E 7E R I
4/3
|
14:58:14.13|RX | 10| 7E 7E R I
4/4 |
14:58:14.15|RX | 55| 7E 7E R I
4/5 |
14:58:14.23|TX |
7| 7E 7E R I
6/4
|
14:58:14.25|TX |
7| 7E 7E R I
6/5
|
14:58:14.26|RX |
9| 7E 7E R I
5/6 |
14:58:14.28|TX | 18| 7E 7E R I
7/6
|
14:58:14.30|TX |
7| 7E 7E R I
7/7
|
14:58:14.31|RX |
7| 7E 7E R I
7/7 |
14:58:14.39|RX | 19| 7E 7E R I
8/8 |
14:58:14.42|TX |
7| 7E 7E R I
9/8
|
14:58:14.92|RX |
4| 7E 7E R RR
9/ |
VAX P.S.I. Tracepoints B–3
X25L3 DTE
X25L3 DTE
Format
"X25L3 DTE DTE-name"
DTE-name
Specifies the name of the X25 PROTOCOL DTE entity to be traced.
Description
This traces all X25 packet-level PDUs transmitted and received by the X25
PROTOCOL Module on the specified DTE. Table B–3 lists the events that are
recognized at this tracepoint.
Table B–3 X.25 DTE Trace Events for VAX P.S.I.
Trace Event
Description
RX
TX
0020
0021
0022
0023
0024
0025
0026
0027
Receive
Transmit
Call Timer expired
Clear Timer Timer expired
Reset Timer expired
Restart Timer expired
Link has come up
Link has gone down
Interrupt Timer expired
Link has been reset
Example
$ TRACE START/LIVE "X25L3 DTE dte1"/PROTOCOL=L3
produces the following output:
B–4 VAX P.S.I. Tracepoints
X25L3 DTE
-----------+----+-----+<--------Packet-------->+
Time |Evnt|Data |Chn Q Type
P
P |
hh mm ss cc|
|Size |
M
R/S R/S |
-----------+----+-----+<---------------------->+
14:56:07.30|TX | 13|001 CALL
|Called DTE 10210
|
Calling DTE 102
|
Data 01 00 00 00
|
|
14:56:08.25|RX |
3|001 CALLC
|
14:56:08.27|RX | 14|001Q DATA
0/0
|
14:56:08.28|RX |
4|001 DATA
0/1
|
14:56:08.36|TX |
3|001 RR
1/ |
14:56:08.67|TX |
3|001 RR
2/ |
14:56:08.80|TX | 14|001Q DATA
2/0 |
14:56:08.85|RX |
3|001 RR
1/
|
14:56:09.14|RX |
6|001 DATA
1/2
|
14:56:09.20|RX | 51|001 DATA
1/3
|
14:56:09.23|TX |
3|001 RR
3/ |
14:56:09.24|TX |
3|001 RR
4/ |
14:56:09.25|RX |
5|001 DATA
1/4
|
14:56:09.32|TX |
3|001 RR
5/ |
14:56:09.34|RX | 15|001 DATA
1/5
|
14:56:09.42|TX |
3|001 RR
6/ |
VAX P.S.I. Tracepoints B–5
X25L3 CIRCUIT
X25L3 CIRCUIT
Format
"X25L3 CIRCUIT *"
Description
This tracepoint traces all X25 packet level PDUs transmitted and received by the
X25 Protocol Module. Tracing can be enabled for all circuits only. Table B–4 lists
the events that are recognized at this tracepoint.
Table B–4 X.25L3 CIRCUIT Trace Events for VAX P.S.I.
Trace Event
Description
RX
TX
Receive
Transmit
Example
$ TRACE START/LIVE "X25L3 CIRCUIT */PROTOCOL=L3
produces the following output:
-----------+----+-----+<--------Packet-------->+
Time |Evnt|Data |Chn Q Type
P
P |
hh mm ss cc|
|Size |
M
R/S R/S |
-----------+----+-----+<---------------------->+
15:05:04.35|RX |
3|001 CALLC
|
15:05:04.37|RX | 14|001Q DATA
0/0
|
15:05:04.38|RX |
4|001 DATA
0/1
|
15:05:04.48|TX |
3|001 RR
1/ |
15:05:04.76|TX |
3|001 RR
2/ |
15:05:04.90|TX | 14|001Q DATA
2/0 |
15:05:04.94|RX |
3|001 RR
1/
|
15:05:05.19|RX |
6|001 DATA
1/2
|
15:05:05.22|TX |
3|001 RR
3/ |
15:05:05.24|RX | 51|001 DATA
1/3
|
15:05:05.25|RX |
5|001 DATA
1/4
|
15:05:05.33|TX |
3|001 RR
4/ |
15:05:05.34|TX |
3|001 RR
5/ |
15:05:05.39|RX | 15|001 DATA
1/5
|
15:05:05.42|TX |
3|001 RR
6/ |
B–6 VAX P.S.I. Tracepoints
X25GAP CIRCUIT
X25GAP CIRCUIT
Format
"X25GAP CIRCUIT *"
Description
This tracepoint traces all X25 GAP PDUs transmitted and received by the X25
Server and X25 Client Modules. Tracing can be enabled for all circuits only.
Table B–5 lists the events that are recognized at this tracepoint.
Table B–5 X25GAP CIRCUIT Trace Events for VAX P.S.I.
Trace Event
Description
RX
TX
Receive
Transmit
Example
$ TRACE START/LIVE "X25GAP CIRCUIT */PROTOCOL=GAP
produces the following output:
-----------+----+-----+--+-----------+
Time |Evnt|Data |Q | Message |
hh mm ss cc|
|Size |M | Type
|
-----------+----+-----+--------------+
15:21:51.57|RX | 25|
CALL
|Network CAMERON_S2
|
|Called DTE 10210
|
|Data 01 00 00 00
|
|Network capabilities 04
|
15:21:52.72|TX |
9|
CALLC
|Data size 128
|
|Network capabilities 04
|
15:21:52.77|TX | 13| Q| DATA
|
15:21:53.18|TX |
3|
DATA
|
15:21:53.34|TX |
5|
DATA
|
15:21:53.37|RX | 13| Q| DATA
|
15:21:53.40|TX | 50|
DATA
|
15:21:53.45|TX |
4|
DATA
|
15:21:53.61|TX | 14|
DATA
|
15:21:55.13|RX |
3|
DATA
|
15:21:55.33|TX | 21|
DATA
|
15:21:55.34|TX | 31|
DATA
|
15:21:55.53|TX | 24|
DATA
|
15:21:55.54|TX | 13| Q| DATA
|
15:21:55.55|RX | 13| Q| DATA
|
15:21:55.59|TX |
9| Q| DATA
|
VAX P.S.I. Tracepoints B–7
C
VAX WAN Device Driver Tracepoints
This appendix describes the tracepoints provided by VAX WAN device drivers for
DECnet/OSI for VMS. These tracepoints are (starting with the lowest protocol
level):
MODEM_CONNECT LINE
DDCMP LINK
HDLC LINK
LAPB LINK
VAX WAN Device Driver Tracepoints C–1
MODEM_CONNECT LINE
MODEM_CONNECT LINE
Format
"MODEM_CONNECT LINE line-name"
line-name
Specifies the name of the MODEM CONNECT LINE entity to be traced.
Description
This traces DEC STD52 state changes and data PDU’s transmitted on the
specified Modem Connect line. Table C–1 lists the events that are recognized at
this tracepoint.
Table C–1 MODEM_CONNECT LINE Trace Events for VAX WAN Device Drivers
Trace Event
Description
RX
TX
0020
Receive
Transmit
DEC STD52 state change
Example
$ TRACE START "MODEM_CONNECT LINE $QLIN-DSV-0-0"/LIVE
produces the following output:
-----------+----+-----+--------------------------------Time |Evnt|Data |Data
hh mm ss cc|
|Size |
-----------+----+-----+--------------------------------16:23:35.50|0020|
0| D52 new state - HDPX_IDLE
|
16:23:35.50|TX |
6| 05 06 C0 00 00 00
|
16:23:35.50|0020|
0| D52 new state - HDPX_WAITCTS |
16:23:35.60|0020|
0| D52 new state - HDPX_TRANSMIT |
16:23:35.60|0020|
0| D52 new state - HDPX_TXLAST
|
16:23:35.60|0020|
0| D52 new state - HDPX_DROPRTS |
16:23:35.70|0020|
0| D52 new state - HDPX_TX_HOLDOFF|
16:23:35.70|0020|
0| D52 new state - HDPX_IDLE
|
16:23:38.90|TX |
6| 05 06 C0 00 00 00
|
16:23:38.90|0020|
0| D52 new state - HDPX_WAITCTS |
16:23:39.00|0020|
0| D52 new state - HDPX_TRANSMIT |
16:23:39.00|0020|
0| D52 new state - HDPX_TXLAST
|
16:23:39.00|0020|
0| D52 new state - HDPX_DROPRTS |
16:23:39.10|0020|
0| D52 new state - HDPX_TX_HOLDOFF|
16:23:39.10|0020|
0| D52 new state - HDPX_IDLE
|
16:23:40.80|0020|
0| D52 new state - HDPX_RECEIVE |
C–2 VAX WAN Device Driver Tracepoints
DDCMP LINK
DDCMP LINK
Format
"DDCMP LINK link-name"
link-name
Specifies the name of the DDCMP LINK entity to be traced.
Description
This traces all data link PDUs transmitted and received by the DDCMP module
on the specified link. Table C–2 lists the events recognized at this tracepoint.
Table C–2 DDCMP LINK Trace Events for VAX WAN Device Drivers
Trace Events
Description
RX
TX
0020
0021
Receive
Transmit
Flush sent to physical layer/device driver
Flush DONE back by physical layer/device driver
VAX WAN Device Driver Tracepoints C–3
DDCMP LINK
Example
$ TRACE START "DDCMP LINK $qlnk-dsv-0-0"/LIVE
produces the following output:
-----------+----+-----+<--------DDCMP Frame-------->+
Time |Evnt|Data | Typ QS Res Num Ctl Adr Count|
hh mm ss cc|
|Size |
|
-----------+----+-----+<--------------------------->+
09:28:30.81|RX | 16| DAT S 241 242
1
8|
09:28:30.82|TX | 16| DAT S 242 243
1
8|
09:28:30.82|TX | 16| DAT S 242 244
1
8|
09:28:30.84|TX | 16| DAT S 242 245
1
8|
09:28:30.85|RX | 16| DAT S 242 243
1
8|
09:28:30.87|TX | 16| DAT S 243 246
1
8|
09:28:30.88|RX | 16| DAT S 242 244
1
8|
09:28:30.90|RX | 16| DAT S 242 245
1
8|
09:28:30.93|RX | 16| DAT S 243 246
1
8|
09:28:30.93|TX | 16| DAT S 246 247
1
8|
09:28:30.96|RX | 16| DAT S 246 247
1
8|
09:28:30.99|TX | 16| DAT S 247 248
1
8|
09:28:31.00|TX | 16| DAT S 247 249
1
8|
09:28:31.02|TX | 16| DAT S 247 250
1
8|
09:28:31.02|RX | 16| DAT S 247 248
1
8|
09:28:31.04|TX | 16| DAT S 248 251
1
8|
09:28:31.05|RX | 16| DAT S 247 249
1
8|
09:28:31.08|RX | 16| DAT S 247 250
1
8|
09:28:31.10|RX | 16| DAT S 248 251
1
8|
09:28:31.10|TX | 16| DAT S 251 252
1
8|
09:28:31.13|RX | 16| DAT S 251 252
1
8|
09:28:31.13|TX | 16| DAT S 252 253
1
8|
09:28:31.14|TX | 16| DAT S 252 254
1
8|
09:28:31.16|TX | 16| DAT S 252 255
1
8|
09:28:31.17|RX | 16| DAT S 252 253
1
8|
09:28:31.19|TX | 16| DAT S 253 0
1
8|
09:28:31.19|RX | 16| DAT S 252 254
1
8|
09:28:31.22|RX | 16| DAT S 252 255
1
8|
09:28:31.24|RX | 16| DAT S 253 0
1
8|
09:28:31.24|TX | 16| DAT S 0 1
1
8|
09:28:31.28|RX | 16| DAT S 0 1
1
8|
09:28:31.28|TX | 16| DAT S 1 2
1
8|
09:28:31.30|TX | 16| DAT S 1 3
1
8|
09:28:31.31|TX | 16| DAT S 1 4
1
8|
C–4 VAX WAN Device Driver Tracepoints
HDLC LINK
HDLC LINK
Format
"HDLC LINK link-name"
link-name
Specifies the name of the HDLC LINK entity to be traced.
Description
This traces HDLC frames on the specified link. The default analysis of this
tracepoint will analyze the HDLC frame header. Table C–3 lists the events
recognized at this tracepoint.
Table C–3 HDLC LINK Trace Events for VAX WAN Device Drivers
Trace Event
Description
RX
TX
Receive
Transmit
Note that if you specify the /FULL qualifier in the START or ANALYZE command,
a full analysis of XID frames will be produced.
Example
$ TRACE START "HDLC LINK Link1"/LIVE
produces the following output:
-----------+----+-----+----------------+--------+--------+<-------Frame--------->+
Time |Evnt|Data |Name
|Function|Status |Ad P Type
N
N |
hh mm ss cc|
|Size |
|Code
|
| F
R/S R/S |
-----------+----+-----+----------------+--------+--------+<--------------------->+
15:59:03.06|TX |
2|dsv0
|00000205|00000001| C P DISC
|
15:59:03.06|RX |
2|dsv0
|00000005|00000001| R F RD
|
15:59:20.27|RX | 78|dsv0
|00000005|00000001|gC P XID
|
15:59:20.27|TX | 78|dsv0
|00000205|00000001| R F XID
|
15:59:20.29|RX |
2|dsv0
|00000005|00000001| C P SABME
|
15:59:20.29|TX |
2|dsv0
|00000205|00000001| R F UA
|
15:59:20.46|TX |
3|dsv0
|00000205|00000001| C P RR
0/
|
15:59:20.46|RX |
3|dsv0
|00000005|00000001| C P RR
0/
|
15:59:20.46|TX |
3|dsv0
|00000205|00000001| R F RR
0/ |
15:59:20.46|RX |
3|dsv0
|00000005|00000001| R F RR
0/ |
VAX WAN Device Driver Tracepoints C–5
LAPB LINK
LAPB LINK
Format
"LAPB LINK link-name"
link-name
Specifies the name of the LAPB LINK entity to be traced.
Description
This traces all data link PDUs transmitted and received by the specified LAPB
LINK entity. Table C–4 lists the events that are recognized at this tracepoint.
Table C–4 LAPB LINK Trace Events for VAX WAN Device Drivers
Trace Event
Description
RX
TX
0020
0023
0024
0026
0027
0028
Receive
Transmit
Acknowledge Timer expired
Retry Maximum reached
Flush issued to line
Line has come up
Line has come down
Line reset sent to device driver
Example
See the example for LAPB LINK in Appendix B.
C–6 VAX WAN Device Driver Tracepoints
D
DECnet/OSI for VMS Tracepoints
This appendix describes the tracepoints provided by DECnet/OSI for VMS. These
tracepoints are (starting from the lowest protocol level):
MOP CIRCUIT
NSP PORT
NSP GLOBAL
OSI_TRANSPORT PORT
ROUTING CIRCUIT
SESSION PORT
DECnet/OSI for VMS Tracepoints D–1
MOP
MOP
Format
"MOP CIRCUIT circuit-name"
circuit-name
Specifies the name of the MOP CIRCUIT entity to be traced.
Description
This traces all the PDUs passed between MOP and the datalink drivers over
the specified circuit. Table D–1 lists the events that are recognized at this
tracepoint.
Table D–1 MOP Trace Events for DECnet–VAX
Trace Event
Description
RX
TX
Receive
Transmit
Note that ANALYZE/FULL will interpret the message type and all parameters.
The /BRIEF qualifier will interpret the message type but display the remainder
of the messages as uninterpreted data.
D–2 DECnet/OSI for VMS Tracepoints
MOP
Example
$ TRACE/ANALYZE/PROTOCOL=MOP/FULL CTF$TRACE.DAT
produces the following output:
CTF V1.0-00
Page 1
Trace started on 6-FEB-1992 15:57:45.03 Analyzed on 6-FEB-1992 16:52:36.36
Trace File CTF$TRACE.DAT;2
Output File CTF$MOP_CIRCUIT.DAT;1
-----------+----+-----+-------+-------------------------------------------------------------------------Time |Evnt|Data |MOP
|Parameters
hh mm ss cc|
|Size |MsgType|
-----------+----+-----+-------+-------------------------------------------------------------------------15:57:45.03|Rx | 11|RqProg |DevTyp=QNA Fmt=1 Prog=OpSys SoftID=None Proc=System BufSiz=1030
15:58:04.21|Rx | 25|RqProg |DevTyp=QNA Fmt=1 Prog=OpSys SoftID=TEST_IMAGE.SYS Proc=System BufSiz=
15:58:04.46| Tx|
1|AsstVol|
15:58:04.47|Rx | 25|RqProg |DevTyp=QNA Fmt=1 Prog=OpSys SoftID=TEST_IMAGE.SYS Proc=System BufSiz=
15:58:04.47| Tx| 1010|MemLoad|LdNum=0 Addr=00000200
|
|Data=D4 EF 03 EC 00 00 17 EF 30 E9 00 00 C1 AB 38 AB 34 57 C0 8F 00 02 00 00 57 CA
15:58:04.48|Rx |
3|RqLoad |LdNum=1 Error=0
15:58:04.49| Tx| 1010|MemLoad|LdNum=1 Addr=000005EC
|
|Data=51 8F 50 00 13 57 B1 51 8F 00 02 12 4B DF EF FC 24 01 00 DD BC 04 DD
15:58:04.50|Rx |
3|RqLoad |LdNum=2 Error=0
15:58:04.50| Tx| 1010|MemLoad|LdNum=2 Addr=000009D8
|
|Data=EF 09 15 53 50 DE 40 62 51 10 20 D0 10 55 CB 8F FF 1F 00 00 A7 54 54
15:58:04.51|Rx |
3|RqLoad |LdNum=3 Error=0
15:58:04.51| Tx| 1010|MemLoad|LdNum=3 Addr=00000DC4
|
|Data=00 00 00 00 00 00 00 00 00 00 00 00 00 00 00 00 00 00 00 00 00 00 00
15:58:04.52|Rx |
3|RqLoad |LdNum=4 Error=0
15:58:04.53| Tx| 1010|MemLoad|LdNum=4 Addr=000011B0
|
|Data=41 53 54 44 52 49 56 45 52 2E 45 58 45 44 41 00 00 00 00 00 00 00 00
15:58:04.53|Rx |
3|RqLoad |LdNum=5 Error=0
15:58:04.54| Tx| 1010|MemLoad|LdNum=5 Addr=0000159C
|
|Data=FD D0 AC 10 CF E0 FD D0 AC 14 CF DE FD DE CF C6 FD 5C DB 38 CF AD F5
15:58:04.55|Rx |
3|RqLoad |LdNum=6 Error=0
15:58:04.55| Tx| 1010|MemLoad|LdNum=6 Addr=00001988
|
|Data=37 DE CF 36 F8 52 9A 82 50 C0 50 52 9A 62 50 D6 50 C1 50 05 56 BB 37
15:58:04.56|Rx |
3|RqLoad |LdNum=7 Error=0
15:58:04.67| Tx| 1010|MemLoad|LdNum=7 Addr=00001D74
|
|Data=00 00 00 00 00 00 00 00 00 00 00 00 00 00 00 00 00 00 00 00 00 00 00
15:58:04.70|Rx |
3|RqLoad |LdNum=8 Error=0
15:58:04.72| Tx| 19|ParLdXA|LdNum=8 Time=1992-02-06 15:58:04.72 +0000 End Xfer=00000200
15:58:04.72|Rx |
3|RqLoad |LdNum=9 Error=0
DECnet/OSI for VMS Tracepoints D–3
NSP Transport
NSP Transport
Format
"NSP PORT port-name"
port-name
Specifies the name of the NSP port entity to be traced.
Description
This tracepoint captures receive data after the PDU from Routing has been
analyzed to determine what port it belongs to. Transmit data is captured just
before it is passed to Routing.
Format
"NSP GLOBAL globe-name"
globe-name
Specifies the wildcard "*".
Description
This tracepoint captures receive data immediately after it is passed from Routing,
before it is determined what port the PDU is associated with, and before any
validation is performed. The data traced is not specific to any one port. Transmit
data is captured just before it is passed to Routing. It to is specific to data at one
port.
D–4 DECnet/OSI for VMS Tracepoints
NSP Transport
Example
$ TRACE/ANALYZE/PROTOCOL=NSPTP/FULL CTF$TRACE.DAT
produces the following output:
CTF V1.0-00
Page 1
Trace started on 6-FEB-1992 15:48:01.90 Analyzed on 6-FEB-1992 15:51:46.07
Trace File CTF$TRACE.DAT;1
Output File CTF$NSP_PORT.DAT;1
-----------+----+-----+<--------------------NSP Frame------------------>+
Time |Evnt|Data |Msg
Data Other Segnum Drc
Flow|
hh mm ss cc|
|Size |Type Dest Source C Numb Numb D Numb
Irc Cntl|
-----------+----+-----+<----------------------------------------------->+
15:48:01.90| Tx| 13|LnkS 33035 202
1
1
2 1
Same|
15:48:01.92| Tx| 26|Data 33035 202
1
1
1
|
15:48:01.97|Rx |
7|Oack 202 33035
2
|
15:48:01.99|Rx | 44|Data 202 33035
1
1
2
|
15:48:01.99|Rx | 20|Data 202 33035
1
3
|
15:48:02.00| Tx| 13|LnkS 33035 202
2
1
3 1
Same|
15:48:02.01| Tx| 66|Data 33035 202
2
1
2
|
15:48:02.02|Rx |
7|Oack 202 33035
3
|
15:48:02.03|Rx | 24|Data 202 33035
2
4
|
15:48:02.03| Tx| 24|Data 33035 202
2
1
3
|
15:48:02.04| Tx|
7|Dack 33035 202
3
|
15:48:02.06| Tx| 11|LnkS 33035 202
1
4 1
Same|
15:48:02.08| Tx|
7|Dack 33035 202
4
|
15:48:02.09|Rx |
7|Oack 202 33035
4
|
15:48:02.09| Tx| 11|LnkS 33035 202
1
5 1
Same|
15:48:02.10| Tx| 35|Data 33035 202
4
1
4
|
15:48:02.10|Rx |
7|Oack 202 33035
5
|
15:48:03.13|Rx | 100|Data 202 33035
4
1
5
|
15:48:03.13| Tx| 13|LnkS 33035 202
5
1
6 1
Same|
15:48:03.14|Rx |
7|Oack 202 33035
6
|
15:48:04.74|Rx | 42|Data 202 33035
4
1
6
|
15:48:04.75| Tx| 13|LnkS 33035 202
6
1
7 1
Same|
15:48:04.76|Rx |
7|Oack 202 33035
7
|
15:48:10.40| Tx| 33|Data 33035 202
6
1
5
|
15:48:12.16|Rx | 42|Data 202 33035
5
1
7
|
15:48:12.17| Tx| 13|LnkS 33035 202
7
1
8 1
Same|
15:48:12.18|Rx |
7|Oack 202 33035
8
|
15:48:15.36| Tx| 34|Data 33035 202
7
1
6
|
15:48:15.51|Rx | 44|Data 202 33035
6
1
8
|
15:48:15.51|Rx | 30|Data 202 33035
6
9
|
15:48:15.53| Tx| 13|LnkS 33035 202
8
1
9 1
Same|
15:48:15.54|Rx |
7|Oack 202 33035
9
|
15:48:15.56| Tx|
7|Dack 33035 202
9
|
15:48:15.59| Tx| 11|LnkS 33035 202
1
10 1
Same|
15:48:15.60|Rx |
7|Oack 202 33035
10
|
15:48:16.35| Tx| 11|LnkS 510 132
782 2067 0
Same|
15:48:16.36|Rx |
7|Oack 132 510
2067
|
15:48:21.59| Tx| 16|Data 33035 202
9
1
7
|
15:48:21.59| Tx| 21|Data 33035 202
9
1
8
|
15:48:22.97|Rx | 42|Data 202 33035
8
1 10
|
15:48:22.98| Tx| 13|LnkS 33035 202
10
1
11 1
Same|
15:48:22.99|Rx |
7|Oack 202 33035
11
|
15:48:24.97| Tx|
8|DisI 33035 202
Reason = Abort
|
DECnet/OSI for VMS Tracepoints D–5
OSI_TRANSPORT PORT
OSI_TRANSPORT PORT
Format
"OSI_TRANSPORT PORT name"
name
Specifies the name of the OSI TRANSPORT PORT entity to be traced.
Description
This traces all PDUs transmitted and received by the OSI module at the specified
port. Table D–2 lists the events that are recognized at this tracepoint.
Table D–2 OSI_TRANSPORT PORT Trace Events for OSI Transport Software
Trace Event
Description
RX
TX
Receive
Transmit
D–6 DECnet/OSI for VMS Tracepoints
OSI_TRANSPORT PORT
Example
$ TRACE ANAL CTF$TRACE.DAT;7/PROT=OSI_TRANSPORT/OUT=TRACE_FULL.LIS/FU
produces the following output:
CTF V1.0-00
Page 1
Trace started on 15-NOV-1990 12:51:39.87 Analyzed on 15-NOV-1990 12:52:51.54
Trace File [TEST]CTF$TRACE.DAT;7
Output File TRACE_FULL.LIS;1
-----------+----+-----+<---------------------Transport-Header----------------------->
Time |Evnt|Data |
Data
hh mm ss cc|
|Size |
-----------+----+-----+<------------------------------------------------------------>
12:51:39.87| Tx| 75||
Type: CC
||
Li: 1D Credit: 04
||
Source Ref: 020E Destination Ref: 115F TC_id : 020E
||
Class 4, Extended, Flowcontrol
||
Remote Nsap: 49004108002B079D7321
||
||
||
(01) Identification of Implementation : 03 44 45
||
43 06 58
||
31 2E 30
||
2E 33
||
(85) Acknowledge :
1 ms
||
(C0) Tpdu Size : 2048
||
(C6) Additional Options : 03
||
12:51:39.88|Rx | 55||
Type: AK
||
Li: 09 Yr-Tu-Nr: 00000000 Credit: 0003
||
Destination Ref: 020E TC_id : 020E
||
Class 4, Extended
||
Remote Nsap: 49004108002B079D7321
||
||
||
12:51:39.88| Tx| 65||
Type: AK
||
Li: 13 Yr-Tu-Nr: 00000000 Credit: 0004
||
Destination Ref: 115F TC_id : 020E
||
Class 4, Extended
||
Remote Nsap: 49004108002B079D7321
||
||
||
(8C) Flow Control Confirmation : 00000000 0000 0003
||
12:51:39.90|Rx | 79||
Type: DT
03 00 00 00 01 00 00
||
E8 03 00 00 C8
||
Li: 07 Nr: 00000000
00 00 00 05 00 00 00
||
00
||
Destination Ref: 020E TC_id : 020E
||
Class 4, Extended
||
Remote Nsap: 49004108002B079D7321
||
EOT
||
||
12:51:39.91| Tx| 89||
Type: AK
07 F0 5F 11 80 00 00
||
00 00 01 00 00
||
Li: 09 Yr-Tu-Nr: 00000001 Credit: 0004 00 0B 00 E8 03 00 00
||
00 05 00 00 00
||
Destination Ref: 115F TC_id : 020E
01 00 00 00
||
Class 4, Extended
||
Remote Nsap: 49004108002B079D7321
||
||
||
12:51:40.12| Tx| 52||
Type: DR
||
Li: 06
||
Source Ref: 020E Destination Ref: 115F TC_id : 020E
||
Class 4, Extended
||
Remote Nsap: 49004108002B079D7321
||
Reason: 80
||
- Normal disconnect initiated by session
00 0B 00
01 00 00
00 03 00
C8 00 00
DECnet/OSI for VMS Tracepoints D–7
OSI_TRANSPORT PORT
12:51:40.13|Rx |
||
||
51||
||
||
||
||
||
||
||
Type: DC
Li: 05
Source Ref: 115F Destination Ref: 020E TC_id : 020E
Class 4, Extended
Remote Nsap: 49004108002B079D7321
TRACE ANAL CTF$TRACE.DAT;7/PROT=OSI_TRANSPORT/OUT=TRACE_FULL.LIS/FU
D–8 DECnet/OSI for VMS Tracepoints
ROUTING CIRCUIT
ROUTING CIRCUIT
Format
"ROUTING CIRCUIT circuit-name"
circuit-name
Specifies the name of the ROUTING CIRCUIT entity to be traced.
Description
This traces all network-layer PDUs transmitted and received on the specified
circuit. Note that it is not possible to trace circuits whose instance identifier is a
Binary or Quoted Simplename. Table D–3 lists the events that are recognized at
this tracepoint.
Table D–3 ROUTING CIRCUIT Trace Events for DECnet–VAX
Trace Event
Description
RX
TX
Receive
Transmit
Note that a full listing is always produced for this tracepoint, even if you specify
the /BRIEF qualifier in the START or ANALYZE command.
DECnet/OSI for VMS Tracepoints D–9
ROUTING CIRCUIT
Example
$ TRACE/START/PROTOCOL=ROUTING
produces the following output:
CTF V1.0-00
Page 1
Trace started on 21-FEB-1992 16:38:17.49 Analyzed on 21-FEB-1992 16:41:43.05
Trace File DISK$:[MGR]LAN0.DAT;1
Output File DISK$:[MGR]LAN0.LIS;2
-----------+----+-----+----------------- Routing Packet Header ----------------+-------------------Time |Evnt|Data |
|Data
hh mm ss cc|
|Size |
|
-----------+----+-----+--------------------------------------------------------+-------------------16:38:19.75| Tx| 33|
Phase IV Type: Long Data, Padding: 1, Flags: IE | 10 7C 61 D2 00 01
|
Destination: 41.363, Source: 63.502
|
|
Congestion: No, Visit Count: 1
|
16:38:19.76|Rx | 28|
Phase IV Type: Long Data, Padding: 0, Flags: IE | 14 D2 00 7C 61 03
|
Destination: 63.502, Source: 41.363
|
|
Congestion: No, Visit Count: 0
|
16:38:22.04| Tx| 40|
Phase IV Type: LAN ES Hello, Padding: 0, Flags: | 08 AA AA AA AA AA
|Source Node: 63.502, Hello Time: 30, DR: 00-00-00-00-00-|
|
Level: Endnode, Blocksize: 0598, Version: V2.2.0
|
16:38:22.94|Rx | 48|
Phase IV Type: LAN IS Hello, Padding: 0, Flags: |
|
Source Node: 63.500, Hello Time: 10, Priority: 1
|
|
Level: Level 2, Blocksize: 0598, Version: V2.2.0
|
|
Nbr: AA-00-04-00-53-A4, Con: 1, Pri: 120
|
|
Nbr: AA-00-04-00-01-F8, Con: 1, Pri: 96
|
|
Nbr: AA-00-04-00-09-A4, Con: 1, Pri: 64
|
|
|
16:38:23.15|Rx | 24|
Type: IS Hello
|
|
Protocol ID: 82, Length: 18, Version: 01
|
|
Holding Time: 001E, Checksum: Good
|
|
Source Address
|
|
490029AA00040023A600
|
| Options:
|
|
Type: C6 (ES Timer) Len: 2 Value: 600
|
|
|
16:38:25.93|Rx | 24|
Type: IS Hello
|
|
Protocol ID: 82, Length: 18, Version: 01
|
|
Holding Time: 001E, Checksum: 0000
|
|
Source Address
|
|
49003FAA000400F4FD00
|
| Options:
|
|
Type: C6 (ES Timer) Len: 2 Value: 600
|
|
|
16:38:26.51|Rx | 89|
Type: DT
| 30 E4 00 00 05 00
|
Protocol ID: 81, Length: 28, Version: 01
|
|
Lifetime: 3F, Checksum: 0000, Flags: SP
|
|
Destination Address
|
|
49003FAA000400F6FD21
|
|
Source Address
|
|
49003FAA000400F7FD21
|
|
Segment Length: 0059, Data Unit Id: 1904
|
|
Segment Offset: 0000, Total Length: 0059
|
| Options:
|
|
Type: C3 (QOS) Len: 1 Value: C0
|
|
|
16:38:27.67|Rx | 56|
Null Internet NPDU
| 30 E4 00 00 06 00
|
LAN Address
|
|
AA-00-04-00-F7-FD
|
16:38:28.24| Tx| 65|
Type: ES Hello
|
|
Protocol ID: 82, Length: 41, Version: 01
|
|
Holding Time: 001E, Checksum: 0000
|
|
Source Address
|
|
49003FAA000400F6FD20
|
|
49003FAA000400F6FD21
|
|
49003FAA000400F6FD41
|
|
49003FAA000400F6FD81
|
|
49003FAA000400FEFD20
|
TRACE ANAL LAN0/OUT=LAN0/WID=100/TRUN
D–10 DECnet/OSI for VMS Tracepoints
Session Control
Session Control
Format
"SESSION PORT port-name"
port-name
Specifies the name of the SESSION PORT entity to be traced.
Description
This tracepoint shows the address towers used when establishing session
connections, as well as the state transitions that the specified port undergoes.
Table D–4 lists the event that is recognized by this tracepoint:
Table D–4 SESSION PORT Trace Events for DECnet–VAX
Trace Event
Description
MSG
Informational Mmessage
DECnet/OSI for VMS Tracepoints D–11
Session Control
Example
$ TRACE/ANALYZE/PROTOCOL=SCL/FULL CTF$TRACE.DAT
produces the following output:
CTF V1.0-00
Page 1
Trace started on 6-FEB-1992 15:39:12.04 Analyzed on 6-FEB-1992 15:53:06.67
Trace File [MILLBRANDT]CTF$TRACE.DAT;1 Output File CTF$SESSION_PORT.DAT;1
-----------+----+-----+<---------------------------------------------------------------->+----------Time |Evnt|Data |
DNA Session Analysis GLOBAL ROUTINE
|Data
hh mm ss cc|
|Size |
|
-----------+----+-----+<---------------------------------------------------------------->+----------15:39:12.04|Msg |
8|
Port Event =>
P_CinACPcmp
|
15:39:12.05|Msg | 27|Source Connect Tower
|
{ { DNA$ProtId$SessCtlV3
, NULL}
|
{ DNA$ProtId$Nsp
, NULL}
|
{ DNA$ProtId$RoutingV3
, 49003FAA000400D8FD20} |
|
|
15:39:12.05|Msg | 35|Destination Connect Tower
|
{ {0113,NULL}
|
{ DNA$ProtId$SessCtlV3
, 002A}
|
{ DNA$ProtId$Nsp
, NULL}
|
{ DNA$ProtId$RoutingV3
, 490013AA000400D24E20} |
|
|
15:39:12.05|Msg |
8|
Port State =>
COGTRN
|
15:39:12.16|Msg |
8|
Port Event =>
T_CIcmp
|
15:39:12.17|Msg |
8|
Port State =>
RUNNING
|
15:39:25.14|Msg |
8|
Port Event =>
S_CNreq
|
15:39:25.14|Msg |
8|
Port State =>
RUNNING
|
15:39:25.18|Msg |
8|
Port Event =>
S_CDreq
|
15:39:25.18|Msg |
8|
Port State =>
DISCONNECTING
|
15:39:25.21|Msg |
8|
Port Event =>
T_CDcmp
|
15:39:25.22|Msg |
8|
Port State =>
CLOSED
|
TRACE ANA WORK3:[MILLBRANDT]CTF$TRACE.DAT;1/OUT=CTF$SESSION_PORT.DAT
D–12 DECnet/OSI for VMS Tracepoints
Index
B
CTF commands (cont’d)
SHOW KEY, 4–16
SPAWN, 4–17
START, 3–2, 3–6, 3–7, 4–19
STOP, 3–2, 3–8, 4–24
summary, 4–1
CTF support, 2–4
on remote servers, 2–6
on VMS systems, 2–5
BACK command, 3–10, 4–7
Buffers, 2–4
D
A
Analysis, 4–2
of trace records, 1–2
ANALYZE command, 3–8, 3–10, 4–2
ATTACH command, 4–6
C
CLEAR command, 4–8
COLLECT command, 4–9
Collecting trace records, 2–2
detached tracing, 2–3, 3–4, 3–6
live tracing, 2–3, 3–4, 3–7, 3–8
snapshot tracing, 2–3, 3–7
CTF
buffers, 2–3, 3–13
files, 2–7
filtering, 3–13
overheads of tracing, 3–2
overview, 1–1
problems, 3–13
resources required, 3–2
snapshot facility, 4–9
startup procedure, 3–2
structure, 2–4
user preparation, 3–2
CTF$DCP process, 2–5
CTF commands
ANALYZE, 3–10, 4–2
ANALYZE command, 3–8
ATTACH, 4–6
BACK, 3–10, 4–7
CLEAR, 4–8
COLLECT, 4–9
DEFINE/KEY, 4–10
DELETE/KEY, 4–12
EXIT, 3–4, 4–13
HELP, 4–14
in TRACE command line, 3–3
NEXT, 3–10
REFRESH, 4–15
/DATA qualifier, 3–8
DEFINE/KEY command, 4–10
DELETE/KEY command, 4–12
Detached process, 2–3
Detached tracing, 2–3, 3–4
starting, 3–6
stopping, 3–8
Displaying trace records, 3–8
/DISPLAY qualifier, 3–8
E
EXIT command, 3–4, 4–13
Exiting from TRACE, 3–4
F
Failure to connect to remote systems, 3–13
Filtering, 3–12, 3–13
/FILTER qualifier, 3–8
G
Global section, 2–5
H
HELP command, 4–14
K
Keypad, 4–1, 4–10, 4–12
default definitions, 3–3, 3–12, 4–1
Index–1
L
/LIVE qualifier, 3–7
Live tracing, 2–3, 3–4, 3–8
starting, 3–7
stopping, 3–8
Local tracepoints, 2–2
Loss of trace records, 3–13
N
/NAME qualifier, 3–9
NETTRACE utility, 3–4
NEXT command, 3–10
/NOCOLLECT qualifier, 3–7
/NOSCROLL qualifier, 3–10
P
Problems running CTF, 3–13
failure to connect to remote systems, 3–13
loss of trace records, 3–13
/PROTOCOL qualifier, 3–9
R
REFRESH command, 4–15
Remote tracepoints, 2–2
names, 3–5
Running TRACE, 3–3
S
/SELECT qualifier, 3–9
SHOW KEY command, 4–16
Snapshot facility, 4–9
Snapshot tracing, 2–3
starting, 3–7
stopping, 3–8
SPAWN command, 4–17
START command, 3–6, 3–7, 4–19
/LIVE qualifier, 3–7
/NOCOLLECT qualifier, 3–7
privileges required, 3–2
Starting
detached tracing, 3–6
Index–2
live tracing, 3–7
snapshot tracing, 3–7
STOP command, 3–8, 4–24
privileges required, 3–2
Stopping
tracing, 3–8
System preparation, 3–1
System resources, 3–2
T
Trace event code, 2–1
Trace file, 1–2, 2–3
version numbers, 3–10
Tracepoints, 1–1, 2–1
for DEC WANrouter 100/500, A–1
for OSI Transport, D–1
for VAX P.S.I., B–1
for VAX WAN device drivers, C–1
local, 2–2
names, 3–5
remote, 2–2, 3–5
Trace records, 1–2, 2–1, 2–2
analysis, 1–2
collection, 2–2
displaying, 3–8
event code, 3–12
Trace server process, 3–7
TRACE utility, 2–4
exit, 3–4
running, 3–3
/TRACE_LEVEL qualifier, 3–10
Tracing
stopping, 3–8
U
User requirements, 3–2
W
Wildcard character
in CTF, 3–5
Wildcards, 3–6, 3–13