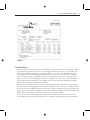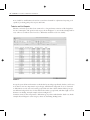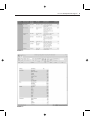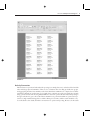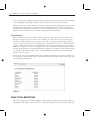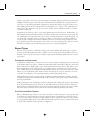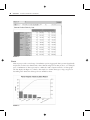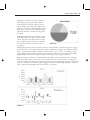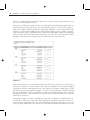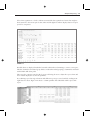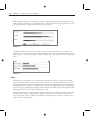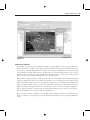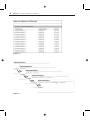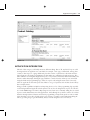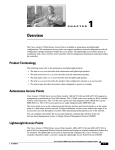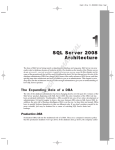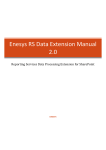
1
AL
1
TE
RI
Business Reporting Paradigms
HT
ED
MA
In the world of business, we use a lot of different styles and types of reports. To appreciate how
pervasive reports are in the world of business, in different organizations, and in our day-to-day lives,
we must first define what a report is. Any formatted output of data from a database or any other
type of data source could be called a report. Some types are obvious and may include sales reports,
end-of-period summaries, trend analysis, and comparisons. These are some traditional report styles.
Reports are used in all areas of business and practically every business function involves printing,
displaying, browsing, or using some other method to present data to business leaders, workers,
service providers, customers, inspectors, analysts, and others for a variety of reasons. Reports, in many
different forms, are everywhere.
CO
PY
R
IG
Less traditional report types that may be used in different business scenarios include things like product
labels, name badges, routing tags, invoices, claim forms, request forms, government documents, and
shipping manifests. You probably have types of reports that are unique to your specific business or
industry that outsiders aren’t even aware of. To provide a better understanding about the various
functions that reports perform, this chapter explores different types of reports. Chapters 2 and 3 will
review the basic building blocks of report design and development that you will need to know to apply
the report design recipes in this book. We expect that you already have some hands-on experience with
SQL Server Reporting Services but we will review the basics as a quick refresher.
For the purpose of simplicity, we will group all of these report types into general categories. You will
no doubt be able to identify some of your own unique reporting requirements but they generally fall
into one of the following major categories:
➤
Process and operational support
➤
Business intelligence and analytical reports
➤
Application integration
➤
Forms, labels, and letters
2
❘
CHAPTER 1 BUSINESS REPORTING PARADIGMS
PROCESS AND OPERATIONAL SUPPORT
Day-to-day business processes require reporting solutions to keep business working. Nearly all businesses and organizations today rely on operational data stored in some kind of database. Although
there are some proprietary, special-purpose databases used to support certain types of business, more
than ninety percent of all data is stored in a relational database system on a standard product platform
such as Oracle, SQL Server, IBM DB2, or SyBase. These systems capture transactions as they occur,
and records are stored at the detailed transactional level to support real-time processes.
Consumer business has many common examples. A point-of-sale transaction is captured in a local
database at the store or POS terminal and may be replicated to a regional or central database. Of
course, the sales receipt is a report generated directly from this transactional data. Similarly, banking
transactions record every debit, credit, and adjustment made to an account. Transactional records may
be recorded every time you use your cellular phone, swipe your key card at work, go to the gym, send
a tweet, post a comment on Facebook, or visit a secure web site.
Report Types
Operational reports are some of the most commonplace in the business and consumer world but they
also exist in many specialized scenarios. In working with several different consulting clients to migrate
their reporting solutions to a new platform or toolset, we often ask them to identify the operational
reports from analytical and decision-support reports. Inevitably we identify a gray area of reports in
each category. These may be reports that aggregate and group details for analysis from operational
data stores or analytical reports that include some level of operational detail.
Putting the exceptions aside for the time being, let’s take a look at some of the more common and a few
of the less common types of operational reports.
Sales Orders, Invoices, Manifests, and Inventory Forms
The items in this category are usually not referred to — or even thought of — as reports. Specialized
software is typically used to input and process orders. These may be for general use in a retail or commercial wholesale operation or they may be for specialized applications, such as a medical laboratory
or an electronics assembly plant. Although the basic structure of an order or invoice may be similar,
the specific components may be adapted to meet specific business needs. An invoice usually contains
a header, specific sections for the seller and customer’s contact, and billing and shipping information,
followed by a tabular section of line items. Each item typically has a product code, description, price,
quantity, and other information that may be specific to the business process or industry, such as weight,
cost, discounts, freight, tax, or shipping cost.
These types of reports have a relatively simple design but are also usually integrated into a custom
application, rather than selected from a report menu on a central server. Some order forms may be
printed on stock forms and other companies may print the entire form on blank paper. Figure 1-1
shows a typical sales order report with a customer and shipping details header, repeating line items,
summary totals, and a footer area containing contact information.
Process and Operational Support
❘ 3
FIGURE 1-1
Template Forms
In the past, most forms were preprinted with blank lines for typed or hand-written information. Modern printers have made it much easier to produce highly formatted forms all at once on blank paper
rather than using fill-in-the-blank forms with preprinted logos, borders, and detail lines. However,
certain applications call for printing on standard forms for a variety of reasons. It may be cheaper to
use lesser-quality printers or black ink/toner printers with multi-colored forms. Some forms require
duplicate copies produced with impact printers. Or, perhaps the process has yet to be modernized. In
the medical insurance claim business, for example, some of these traditional standards were highly
influenced by a thriving pre-printed forms industry.
Whatever the reason, these forms can be quite challenging because each character must be printed in
a specific location. Often, getting the report character spacing and size to line up is only half the battle
because these forms are highly-dependent on the printer and paper dimensions such as the margins and
gripper space. Reports that are designed to provide some latitude for margins and character positioning
make it easier to adjust the report itself rather than to rely on printer settings.
In recent years, most of the industry-standard preprinted forms have been replaced by all-at-once
reports that print on standard sized blank paper. Less expensive, high quality printers have made this
4
❘
CHAPTER 1
BUSINESS REPORTING PARADIGMS
more feasible for small businesses but it has created more demand for sophisticated reporting tools
capable of producing pixel-perfect reports and forms.
Tabular and List Reports
Tabular, row-based reports have been common for so long and many variations of this design have
become commonplace. The green bar-style report, shown in Figure 1-2, uses a shaded background for
every other row to make it easier for users to differentiate and follow each row visually.
FIGURE 1-2
Grouped reports add more information to the tabular layout with grouped bands, headers, and footers.
Color has become more important in report design, and different background colors are often used
to differentiate not only each row but the group bands and other related elements. This report type
uses different background colors for the table header and two group bands, and then a light color for
alternate row shading. A simple example is shown in Figure 1-3.
Sometimes it may be more important to differentiate group values rather than the detail rows. In the
example shown in Figure 1-4, the Category values use alternating shading bands.
Process and Operational Support
FIGURE 1-3
FIGURE 1-4
❘ 5
6
❘
CHAPTER 1 BUSINESS REPORTING PARADIGMS
Catalogs
A product catalog is a common layout used to group categories of products and then provide details in
an ordered list. A catalog report must be easy to read with bold headings and group descriptive text.
Figure 1-5 shows a continuous report using a repeating list area for product category and subcategory
groups and containing a description block and product image in the group header. The groups include
a tabular region for product details.
FIGURE 1-5
Labels
Label reports are usually simple in layout but have a few unique characteristics. A rectangular data
region is repeated across rows and columns on the printed page. The size and position of the data
region must be aligned to the standard label sheet with relatively precise margins and column spacing.
Figure 1-6 shows a multi-column list report formatted to fit a standard label sheet.
The greatest challenge is to easily produce labels in a variety of standard sizes and dimensions. The label
industry, led by a few well-known companies and influenced by dozens of generic label form producers,
has managed to produce hundreds of ‘‘standard’’ sheet label formats.
Process and Operational Support
❘ 7
FIGURE 1-6
Activity Summaries
The line between operational and analytical reporting is not simply that one is at the detail level and the
other includes groups and summaries. There is a lot of business value in rolling up details into groups
and aggregating measures into summary totals. Even when these summaries are compared across different business dimensions, such as time or geography, these comparisons can be performed appropriately
using operational data. The most significant difference between operational and analytical reporting is
the approach taken to get to the result. If these summaries are performed within an operational scope
(such as a single manufacturing plant or within a finite period of time) and the results should be easy
reconciled back to the details, then this is an extension of operational reporting. However, if the results
8
❘
CHAPTER 1 BUSINESS REPORTING PARADIGMS
are for enterprise-wide comparisons, long-term trend analysis, and corporate decision support, you will
be met with significant challenges trying to run these reports with operational data sources.
Summary reports on occasion will evolve to include components of truly analytical reports and, when
that happens, it’s important to consider whether they should be migrated to a business intelligence
reporting model. The paramount question to consider is whether the report exists to support a specific
business operation within the scope of that group, department, and leadership.
Status Reports
The term ‘‘status report’’ means different things to different people but the common theme is that
this type of report is used to provide concise results that are comparable over periods of time. It’s
important to understand the needs of the person who will use the report and the message it should
convey. A common report may be for a team leader to get the status for a project or task. This should
typically summarize data points to a standard indicator at the end of a time period or project phase,
relative to some goal or objective. For example, is the project on schedule, behind schedule, or ahead of
schedule? Is the application component development completed or incomplete? These simplified results
are typically broken down by tasks, stages, or responsibilities for comparison over each reporting
period to measure progress.
Status reports can vary in sophistication but most are fairly simple. Figure 1-7 shows an example of a
Top 10 report of ranked values, which is common in many business scenarios where leaders may want
to see the best producing items.
FIGURE 1-7
ANALYTICAL REPORTING
The concept and purpose of business intelligence (BI) is much more than just reporting. BI solutions
help business leaders make critical decisions. A complete BI strategy involves financial forecasting and
Analytical Reporting
❘ 9
strategic approaches to the way resource investments are planned, managed, and measured. A business
intelligence methodology prescribes the rules and standards for defining business targets and the success factors for measuring actual metrics against those targets. Reporting is a big part of that process.
After defining business metrics and the rules for measuring success — and of course, gathering all of
the necessary data, different report types are used to analyze current and historical data to evaluate
correlations and trends.
Analytical reports tend to be more concise and graphical than operational reports. Traditionally, column and line charts dominated the desktops of business analysts but a new breed of reports plays the
role of BI dashboard components. There are a variety of standard metaphors for indicating goals, status, and trends. Sometimes an array of simple pie charts or needle gauges is an effective method to
convey the state of things in the business enterprise. However, as user reporting needs have become
more sophisticated (as have many business users) there is an ever-increasing need to add more useful
information to business reports while keeping reports easy to read and manageable.
Report Types
The style of reports used in a BI solution range from common tabular and chart reports to particular report styles with graphical indicators, symbols, arrows, and progress bars. BI defines a lot more
than just a style of reports; other types of business data systems can include dashboard and scorecard
report styles.
Dashboards and Scorecards
By definition, a dashboard is a collection of reports or report elements and gauges that convey the state
of related key metrics. At a glance, a dashboard reflects the health of the business. Report actions allow
users to drill down or drill through to more specific details and assess the status of each metric across
different dimensions, such as time periods or geographic regions. A business scorecard is a specific
style of dashboard-type report that helps business leaders measure key performance and success values
relative to goals and business plans. Aside from the style and layout of reports, business scorecards
conform to a standard process for planning business growth and measuring success.
Although dashboards and scorecards may not be limited to business intelligence solutions, the need
for them may suggest that eventually a full BI solution should be developed to support all the business
reporting requirements.
Dashboard design is often a balancing act between simplicity and usability. The goal is to give business
users the information that they need, based on universally understood metrics, measures, and performance indicators. That information must be delivered at the right level of detail so the users can make
important decisions and take action on the most critical issues affecting business performance.
Pivot Table and Matrix Reports
Known within different products as a cross-tab, pivot table, or matrix, this type of report groups data
on both the rows and columns axis, showing aggregated values at each intersect point. Pivot reports
are very useful for ad-hoc analysis. For larger volume result sets, drill-down features can allow results
to be aggregated at higher group levels within axis hierarchies and allow users to expand each branch
to expose more detail at lower group levels. See Figure 1-8.
10
❘
CHAPTER 1
BUSINESS REPORTING PARADIGMS
FIGURE 1-8
Charts
Chart reports provide a varied range of visualization options. Aggregated data is presented graphically
and plotted on a linear two-dimensional or three-dimensional grid, in circular pie slices, or a radial plot
space. Combinations of chart types may be combined to make comparisons and to correlate graphical data displays. In Figure 1-9, a Pareto chart employs a column chart type to range categories in
descending order while a line chart type shows cumulative values.
FIGURE 1-9
Analytical Reporting
❘ 11
Simplicity is often the best choice. A basic pie
chart displays proportional values with an
optional legend (see Figure 1-10). Pie charts
can also display data point values and/or point
labels over each slice or with callout labels. Pie or
donut charts can have bold visual impact when
exploded, extruded, or embossed 3-D options
are added.
Although common chart types like the pie and
donut display data in a simple, easily readable
format, they may not be the best choice when
more sophisticated users need a lot of information presented with the most effective use of
screen space.
FIGURE 1-10
Charting data values provides an effective means for seeing whether a measured data point or aggregated total is more or less than another but at times it’s important to apply some conclusive business
logic to a measurement and show whether a certain value is ‘‘good,’’ ‘‘bad,’’ ‘‘acceptable,’’ or otherwise. Business data should be actionable; and for leaders to take action, they must be able make a
judgment. That’s why decision makers measure results against goals, targets, and quotas.
Figure 1-11 shows variations of column and line charts that put more information into a relatively
small space. This ‘‘report card’’ report groups axis labels in a two-level hierarchy — showing both
years and quarters, and then plots quotas and actual values using two different chart types in the same
chart area. Columns not only show relative aggregate values by column height but apply conditional
logic to display the meaningful results in red, yellow, or green bars.
FIGURE 1-11
12
❘
CHAPTER 1 BUSINESS REPORTING PARADIGMS
The lower column chart plots time relative values above or below a target or threshold line. Bars are
also colored to add qualitative context.
The previous example showed charted values on a scaled grid with detailed labeling. Often times, too
much information produces unnecessary noise and defeats the purpose of a report. The example in
Figure 1-12 combines sparkline charts in-line with tabular details. It is a report pattern that provides
a balance of specific detail and high-level trend analysis that can help a report consumer get the big
picture without becoming overwhelmed and lost in the details. This simple example uses sparklines to
show the annual sales trend. If this visual is interesting to the reader, he can click the chart and drill
through to a detail chart report showing a measured and scaled view of the same data.
FIGURE 1-12
Different users need more or less information than others and one report may not provide the appropriate level of detail for every data consumer. One of the great challenges in report design is tuning the
detail and presentation of important data facts to the audience. For example, a simple gauge or trend
line may be an appropriate graphical metaphor for a poster or advertisement for a donation campaign.
But a production plant or robotic assembly line operating engineer will spend most of his or her time
watching an operating console and may need to monitor a lot of detailed information in a relatively
small area of screen space.
The example in Figure 1-13 takes a comprehensive approach, providing more useful information in
a smaller space. This report is the result of many generations of design. The line chart at the top of
the report shows detailed trend lines on a scaled grid with axis labels. The large chart acts as a zoom
feature, showing details when a user clicks on one of the smaller sparklines in the tabular report area
Analytical Reporting
❘ 13
below. Line segments are colored to indicate status and the last segment has a heavier line weight to
draw attention to the current period value and trend. The lighter trend line displays data from a prior
period for comparison.
FIGURE 1-13
Detailed values are displayed in tubular form with conditional text formatting to conserve screen space.
The first column shows indented group labels to indicate hierarchal groupings of summaries and detail
with clickable drill-down paths.
The report also contains controls in the footer area allowing the user to adjust the report volume and
level of detail displayed in each of the sparklines.
By combining report data region elements with different report types, users benefit by reading meaningful data in context. Figure 1-14 shows a column sparkline chart embedded within a pivot table
report.
FIGURE 1-14
14
❘
CHAPTER 1
BUSINESS REPORTING PARADIGMS
Bullet charts (see Figure 1-15) exemplify a compact reporting element capable of displaying several
relative values in a small space. A single bullet chart, constructed from a linear gauge report item, plots
four separate values in a single thermometer or progress bar line.
FIGURE 1-15
Combining a bullet chart or other variations of gauges or charts with a table, list, or matrix is an
effective way to create intuitive reports. Graphics and icons can be used with standard bars to separate
different types of data elements. Figure 1-16 uses a graphic dot to plot goals and a bar to show grade
scores.
FIGURE 1-16
Maps
Geographical reporting has become a mainstream requirement for many reporting solutions. Map
reports can include data and visual elements from several sources. Geospatial data may be stored in
standard formats such as SQL Server spatial objects and data types, ESRI map objects, and map files.
Geographical boundary maps are available for many countries and other political regions, and may be
created for any geographical unit. SQL Server Reporting Services (SSRS) maps may be combined with
the Bing map service to show online aerial and street views.
Data points are plotted over maps to show address locations, regional data measurements, and points
of interest. These may be standard shapes, variable size bubbles, or customized icons. Figure 1-17
shows a Bing map of the Los Angeles area with the locations plotted for customers, based on data
points stored in a database table.
Analytical Reporting
❘ 15
FIGURE 1-17
Interactive Reports
Reporting is no longer just about printing information on paper. Reports can be used to gather information from users, to update records, and to perform actions. A common request in Reporting Services
solutions is to customize the parameter bar and provide a richer prompting interface for report parameters and other user input. The best way to prompt a user for report parameters may be to use a report.
Because a report can call a report action when a user clicks text, images, or other report items, an action
may be used to send parameter information back to the same report.
With a little creativity, parameters, and expression code, users can benefit from a customized navigation
experience. Figure 1-18 shows a report that uses checkbox icons to identify selected or related records
with a checkmark. An interactive version of this report allows users to check list items and then click a
button or image to update, delete, or pass the selected items to another report as parameter selections.
Figure 1-19 shows an example of how report items may be used to track a user’s report navigation
history and provide links to each report in a breadcrumb list. Reports can be used to create custom
menus and launch screens for reports and other applications.
Figue 1-20 shows another example of a report with custom navigation. The box on the left acts as a
table of contents for groups in the report body. Links in that list may be used to navigate within the
report.
16
❘
CHAPTER 1
FIGURE 1-18
FIGURE 1-19
BUSINESS REPORTING PARADIGMS
Application Integration
❘ 17
FIGURE 1-20
APPLICATION INTEGRATION
The title of this category could really mean two different things. First of all, any kind of report could
be integrated into an application of some kind. For example, a web page could include, among other
content, a chart report or a gauge dashboard placed in a frame or panel next to the menus and navigation buttons coded using programming tools that make up a standard web application page. The
other definition of an integrated application report is a report that contains the menu functionality and
buttons, rather than simply sharing the page with these controls. Because online reports can include
navigation links and programming logic, where do reports end and applications start? Conversely,
where do applications end and reports start? That’s a very good question, and one that doesn’t always
have a simple answer.
Using powerful capabilities in SQL Server Reporting Services, a lot of the programming logic typically
created using traditional application development tools can now be designed into reports. As a moderator on the MSDN support forum for Reporting Services, I hear users constantly asking how to extend
reports to make them behave more like applications. And, although it’s possible to achieve a lot of this
behavior through advanced features and custom programming, an important question comes to mind:
is this the right tool for the job? Like using a pair of pliers to pound in a nail (rather than taking the
time to go to the garage to get the hammer), always consider using the best tool for the job.
18
❘
CHAPTER 1
BUSINESS REPORTING PARADIGMS
The following section introduces the components and techniques that may be used to enable reports
to be integrated into applications. After that, we’ll discuss some ways that reports can behave like
applications.
Report Integration into Applications
Out-of-the-box, Reporting Services installs a web application called Report Manager to serve as both
a report server management console and a menu system for deployed reports. With Report Manager,
users make use of familiar web navigation links to open folders, select parameter options, display, and
print reports from their web browser. A secondary option for running reports is integration with Office
SharePoint Server or Windows SharePoint Services. Like using Report Manager, reports are displayed
in SharePoint site libraries by using built-in web browser functionality. In either instance, the user
experience is that they navigate to a specific site in their browser to view and run reports.
In many cases, we may want to offer users a different experience, more in line with their business
processes. Rather than going to a special web site or address to get their reports, the users simply
use controls within their business application or device. Whatever tool, screen, program, or other
mechanism the business workers use, they will have an option to obtain the information they need to
more effectively perform their job function — using a report. Sometimes users may not even perceive
that they are using a report at all. They simply see the information they need.
Reports should be actionable. That is the mantra of the business intelligence movement in the business community today. What is an actionable report? One might say that it is a report that delivers
information enabling a business leader or worker to take appropriate action. That may be true in many
cases but an actionable report can also be a user interface designed using a sophisticated reporting tool
where the report may be used to take the action. Imagine a report containing links labeled ‘‘click here
to place an order’’ or ‘‘click here to resolve this issue.’’ When the user clicks the link, the appropriate
application dialog opens to complete the necessary task or a record is simply updated with no further
action required.
Desktop Applications
Desktop applications usually contain rich functionality and are responsive to user interaction because
the processing takes place on the desktop computer. On the Microsoft Windows platform, each dialog
or window contains a variety of controls for gathering user input or performing a task of some kind.
Windows programs developed on the .NET Framework utilize Windows forms (Win Forms) to design
each application dialog. Win Forms applications have the most sophisticated, easiest to program controls because using the Visual Studio integrated development environment allows you to directly utilize
Windows’ capabilities through objects exposed in the .NET Framework namespaces and common
language runtime (CLR).
Like developing most visual functionality in Win Forms programming, adding reports is as simple as
dropping a control onto a form and setting a few properties. The Win Forms ReportViewer control uses
properties and methods to abstract all of the major functionality of Reporting Services with as little or
as much programming and control as you like. Most all report functions that can be performed through
Application Integration
❘ 19
the Report Manager interface can be performed using the ReportViewer control, either visually using
toolbar options or programmatically, using methods of the control object in custom code.
Web Applications
With the expansion of business applications throughout distributed business enterprises, many desktop
applications have been replaced with web applications to reduce maintenance and support costs, and to
make applications more accessible. If you have worked with both Windows forms desktop applications
and web applications, either as a user or programmer, you know that there are usually some differences
in the look, feel, and responsiveness of the application. Web applications are hosted on a central web
server and viewed in the user’s web browser. Most user requests require a postback to the server, which
takes more time to process than a typical desktop application. Since web-based applications became a
reality in the late 1990s, programmers and technology architects have developed a variety of techniques
and technologies to make them behave more like desktop programs, including Java applets, ActiveX
controls, Flash, AJAX, and Silverlight.
Microsoft’s web development platform is ASP.NET which, like Win Forms, is an extension of the
.NET Framework and CLR. Web Forms projects may also be developed with Visual Studio and there
are many similarities in the development environment and some of the programming objects. The
similarities can be deceiving because there are significant differences in the capabilities and behavior of
the objects and the subsequent user experience.
Fortunately, Reporting Services is a web technology and is in fact based in the ASP.NET programming
platform. SSRS reports are easily added to ASP.NET applications using the WebForms version of the
ReportViewer control, which is almost identical to the WinForms version.
Because Reporting Services is a web technology, it also can be integrated into web applications developed using non-Microsoft programming tools. A report may be added to a web page using simple
HTML tags, embedded frames, JavaScript, or an HTTP address with query string parameters. They
may not offer the same level of convenience or sophistication as the .NET ReportViewer controls but
most report functionality can be accessed using these simple techniques.
Portal Content
Corporate intranet portals have become an important component in the way we communicate and collaborate with our business associates. Simply storing documents and other content in network folders
is not a sufficient method for managing important business content. The most significant challenges we
typically face when allowing a group of people access to shared content are how to keep that content
accessible only to the right people and keep it synchronized and consistent as it is shared. Shared file
stores only make it possible to copy the content to the desktop, where it may be changed and pushed
back to the file system. In a shared environment, this means that different users could overwrite each
other’s changes. Users download their own copies of spreadsheets and reports, creating different versions of the truth. And if changes are made, change tracking and version control may be important.
Many documents and components requiring maintenance and testing may need to progress through a
workflow and signoff process.
20
❘
CHAPTER 1
BUSINESS REPORTING PARADIGMS
Reports can be used in a collaborative portal environment. Whether the objective is to manage the
design and testing phases of report development or to give users access to a completed report in a
consistent interface with other shared content, an intranet, web-based portal as an excellent platform
for this type of collaboration. SharePoint server technologies have become the de facto standard for
managing collaborative content for many organizations. Reporting Services integrates effectively with
SharePoint in several different ways. Because different organizations and development groups have
different needs and objectives, here are some of the ways SSRS may be used within a SharePoint site:
➤
For development teams, reports may be deployed to document or report libraries to manage
the development cycle. Workflow processes may be used to manage and graduate a report
definition as it is designed, validated, tested, and deployed for production use. The report can
remain in a single library and use a workflow to manage the progress and sign-off through
these stages or it may be migrated from one library to another for design and development,
unit testing, user acceptance, integration, and release to production.
➤
For self-service reporting, business users can save their reports to a personal or team library
or site. By isolating user reports from IT production reports, the needs of business users and
business leaders are both met while maintaining a standard method of validation for missioncritical data reporting.
➤
SharePoint server enables version control for reports and other content. Like other documents, reports must be checked out and then checked back into the library to maintain ownership and change control. With version control enabled, each check-in creates an assessable
version of the file so a report may be reverted to a prior version.
➤
Because site content is stored in a SQL Server database, all documents, files, and reports are
backed up and may be restored using a conventional disaster recovery plan.
➤
Report content and security may be fully integrated and managed through SharePoint
using the SharePoint integrated mode. This places all content, security, and deployment
management into the hands of SharePoint administrators. Reports deployed to SharePoint
site libraries may be managed with integrated workflow and version control.
➤
SharePoint pages and dashboards may be used to surface reports using a ReportViewer web
part. The content or report server folders may be added to pages using the ReportList web
part to create simple report menus. Report content may appear alongside Excel and PerformancePoint reports to create interactive pages and complex reporting dashboards. This type
of report integration is possible in SharePoint integrated or SSRS native mode.
ReportViewer Control
All of the functionality of Reporting Services is exposed through a web service that provides multiple SOAP endpoints. This was exciting news for developers because they could have access to every
capability through a low-level programming interface and automate reports within their custom applications. However, this approach to report integration removes much of the convenience and efficiency
Application Integration
❘ 21
that are part of the inherent user experience. For example, capabilities like user authentication, page
caching, drill-through, drill-down, and prompt interaction are normally part of the standard browserbased UI. By handling the report rendering through SOAP calls, the developer must manage rendering,
report and image content streaming, and any dynamic report features themselves. The advantage of the
SOAP-based API is that developers can integrate reports into custom applications using any programming platform that speaks SOAP, such as Java, PERL, or C++.
The ReportViewer control allows report execution to be managed through a self-contained user
interface while still preserving programmable objects for more advanced control. Two versions exist:
the Win Forms control is used to place a report on a Windows form application developed in Visual
Studio with the .NET Framework and common language runtime. The Web Forms control is exactly
the same but used to add a report to an ASP.NET web form. Both of these controls can render
reports on the report server using the remote processing mode, or reports may be rendered locally
within the application using local processing mode. For Win Forms, reports are actually processed
on the desktop and for Web Forms; the report is processed on the web server hosting the web forms
application.
The ReportViewer SharePoint web part is an ASP.NET wrapper around the Web Forms ReportViewer
control. It has the same behavior as the web form control but processes reports only on the report
server in remote processing mode.
Installing the Reporting Services Samples
and SQL Server Sample Databases
The report recipes in this book use a variety of sample databases. With the exception of those that have
special requirements, most of our recipes use the sample databases provided by Microsoft. You can
download working samples of all the reports and the specialized databases from Wrox.com.
The standard SQL Server sample databases primarily consist of two databases containing data related
to a fictional bicycle manufacturer, Adventure Works Cycles. The OLTP sample database contains
structures typical of a transactional system, whereas the DW sample database contains structures
typical of an analytical system. Together, these will assist you in gaining familiarity with both operational and analytical reporting. To work through all of the SSRS 2008 recipes that depend on a SQL
Server data source, download and install the AdventureWorks2008 transactional database, the AdventureWorksDW2008 sample data warehouse, and the Adventure Works DW Analysis Services sample
database and project.
The Reporting Services samples and SQL Server sample databases are available on the CodePlex
web site at www.CodePlex.com/SqlServerSamples. For each sample database and the Reporting Services samples, you will need to download an installation file appropriate to your hardware platform.
These files are identified in the following table. Each recipe will tell you what version of SQL Server
is supported. Many of the recipes will work with the sample databases from either SQL Server 2005
or 2008.
22
❘
CHAPTER 1 BUSINESS REPORTING PARADIGMS
CPU
MSI
SAMPLE
32-bit
SQL2008.Reporting_Services.Samples.x86.msi
Reporting Services Samples
SQL2008.AdventureWorks_OLTP_DB_v2008.x86.msi
AdventureWorks2008
Sample Database
SQL2008.AdventureWorks_DW_BI_v2008.x86.msi
AdventureWorks2008DW
Sample Database
SQL2008.Reporting_Services.Samples.x64.msi
Reporting Services Samples
SQL2008.AdventureWorks_OLTP_DB_v2008.x64.msi
AdventureWorks2008
Sample Database
SQL2008.AdventureWorks_DW_BI_v2008.x64.msi
AdventureWorks2008DW
Sample Database
SQL2008.Reporting_Services.Samples.ia64.msi
Reporting Services Samples
SQL2008.AdventureWorks_OLTP_DB_v2008.ia64.msi
AdventureWorks2008
Sample Database
SQL2008.AdventureWorks_DW_BI_v2008.ia64.msi
AdventureWorks2008DW
Sample Database
x64 64-bit
IA64 64-bit
Before starting the sample installations, verify that the SQL Server Database Engine and Reporting
Services are running. Then, launch each downloaded MSI and follow the instructions provided to
install the samples.
The installation procedure and specific files you may need are subject to change. Please refer to information on the CodePlex web site for the most up-to-date installation instructions for these files.
SERVER REPORTS
The new generation of Report Builder provides true ad-hoc reporting tools that allow users to create
reports directly on the server without using the local file system. This capability is not enabled in the
initial RTM release of SQL Server 2008 but was added in Service Pack 1. The functionality is enabled
by default in SQL Server 2008 R2 with Report Builder 3.0.
With server reports enabled on the report server, any standard reports to which the user has access can
be opened directly in Report Builder using the standard Open dialog. To open a report on the server,
local, or network file system, click the ‘‘orb’’ Office start button in the top left corner and select Open
from the menu. You can navigate to a folder using the most recent items or other folder shortcuts on
the Open Report dialog window.
In this book we will not discuss any specific differences between reports deployed in native mode and
SharePoint integrated mode. For our purposes, you will simply use the appropriate URL to target the
report server or the SharePoint library used to manage your reports. If your report server is in native
Server Reports
❘ 23
mode, you may use the Report Manager web application to access and manage reports. If you are using
SharePoint integrated mode, you will use SharePoint to manage reports and then deploy and view them
in a document or report library.
HTML Viewer
Web browsers, such as Microsoft Internet Explorer, are the most popular tools for viewing Reporting
Services reports. In most cases, when a report is rendered to HTML, Reporting Services adds JavaScript
to provide several interactive features. These features include a toolbar, document maps, fixed table
headers, and table sorting. Collectively, these script-based features are referred to as the HTML Viewer.
To ensure compatibility with the HTML Viewer, it is recommended that you use the latest version
of Internet Explorer. Currently, Microsoft guarantees full HTML Viewer functionality in Internet
Explorer version 8.0 with up-to-date service packs and scripting enabled.
Other web browsers can be used to view Reporting Services reports rendered to HTML, but many
of the HTML Viewer features will not be available. Refer to Books Online for more details on which
features are supported by which browsers if you plan to distribute reports to users employing browsers
other than current versions of Internet Explorer.
Report Viewer Control
The Report Viewer control allows Reporting Services reports to be displayed within custom applications. The Report Viewer control is actually two controls — one for use in web applications and the
other for Win Forms applications. Each supports the same functionality.
The Report Viewer control runs in one of two modes. In the default Remote Processing mode, reports
are rendered by a Reporting Services instance and displayed through the control. This is the preferred
mode as the full feature set of Reporting Services is available and the processing power of the Reporting
Services server can be employed.
In situations in which a Reporting Services server is not available or retrieving data directly through
the client system is required, the Report Viewer control can be run in the Local Processing mode. In
this mode, the application retrieves data and couples it with the report definition to produce a rendered
report on the host system without the support of a Reporting Services server. Not all Reporting Services
features are available when the control is executed in Local Processing mode.
Reporting Services Processors and Extensions
What exactly is Reporting Services? The core processing engine is a Windows service whose functionality is performed by several processing extensions. Theses .NET assemblies perform security
authentication, data processing, format-specific report rendering, and report delivery. These processing
extensions can be extended by developers by registering additional assemblies on the server and in the
development tools.
Microsoft’s Windows Management Instrumentation (WMI) technology provides a mechanism for
the consistent management of devices and applications running on Windows platforms. The Reporting Services Windows service exposes itself to WMI by registering two classes with the local WMI
24
❘
CHAPTER 1 BUSINESS REPORTING PARADIGMS
Windows service. These classes expose properties and methods that the WMI service makes available
to administrative applications.
The first of the two classes registered by Reporting Services, MSReportServer_Instance, provides basic
information about the Reporting Services installation, including edition, version, and mode.
The second class, MSReportServer_ConfigurationSetting, provides access to many of the settings in the
RSReportServer.config configuration file and exposes a host of methods supporting critical administrative tasks. Administrative interfaces such as the Reporting Services Configuration tool leverage this
provider for their functionality.
A Remote Procedure Call (RPC) interface provided by the Reporting Services service acts as a bridge
between the WMI and Reporting Services Windows services. Through this bridge, calls against the
registered classes received by the WMI service are relayed to Reporting Services.
All server functionality is exposed through the Reporting Services Windows service endpoints. The
service’s core processing features were introduced as an application domain whose functionality is provided through a collection of components. You will now explore those components to gain a deeper
understanding of just how Reporting Services delivers its primary functionality and where that functionality can be extended.
Before jumping into the specific components, you should be aware of the difference between extensions
and processors. Processors are the coordinators and facilitators in Reporting Services’ component
architecture. They are responsible for calling the extensions as needed and providing mechanisms for
data exchange between them. Although configuration settings may alter their behavior, the processors
cannot be extended through custom code.
Extensions are components registered with Reporting Services to provide specific functionality.
They expose standardized interfaces, which provide the mechanism by which Reporting Services
engages them.
Report Caching
When a report is initially rendered, a session is established. Requests from a specific user are made
within the context of a specific session until that session expires.
During a session, users will often request that the same report be rendered multiple times, possibly in
differing formats. Reporting Services anticipates this by storing the intermediate format report in its
Session cache. The cached copy is recorded with Session identifiers so that when an end-user repeats
a request for a report as part of his or her session, the cached copy can be leveraged. This feature of
Reporting Services, known as report session caching, is always enabled.
If a deployed report is configured for instance caching, and data is retrieved using the requestor’s credentials, the report may contain data only appropriate for that specific user. The intermediate report
contains this data so that if it is cached and made available to another requestor, that user may be
exposed to data that he or she otherwise should not see.
For this reason, only reports that do not use the requestor’s credentials to retrieve data from external data sources can be configured for report execution caching. With report execution caching, the
Server Reports
❘ 25
intermediate report generated from a report request is cached for some period of time and used to
render reports for other users until the cached copy expires.
With both report session and report execution caching, the end-user requests a report, and the Report
Processor checks for a cached copy. If none exists, the Report Processor must assemble the intermediate
format report, store it in a cache for subsequent requests, and then render the requested final report.
While later requests may take advantage of the cached copy, the first request does not have this option.
This can lead to an inconsistent end-user experience.
To address this, snapshots may be scheduled to populate the cache in advance of an end-user request.
Snapshots are recorded in the same intermediate format and have the same security requirements as
report execution caching.
The HTML Rendering Extension
HTML is highly accessible and a generally good format for interactive reports. For these reasons,
HTML 4.0 is the default rendering format for Reporting Services reports.
The downside to HTML is that web pages have never been very good for printing. The HTML Viewer,
a JavaScript-based application embedded in most HTML-rendered reports discussed earlier in this
chapter, provides client-side printing that overcomes some of the challenges experienced when printing
from a web browser. (Client-side printing is accessed through the HTML Viewer toolbar.)
The HTML rendering extension can be instructed to return MIME-HTML (MHTML) as an alternative
to the HTML 4.0 default. With MHTML, images, style sheets, and other referenced items are embedded in the HTML document. This allows a report to be delivered without dependencies on external
resources. That can be very useful in certain scenarios such as the e-mail delivery of a report to a user.
(Not all e-mail products support MHTML, so check with your user community before selecting this
format for e-mail delivery.)
The CSV-Rendering Extension
The comma-separated values (CSV)–rendering extension renders the data portion of a report to a
comma-delimited flat-file format accessible by spreadsheets and other applications. With the 2008
release of Reporting Services, this extension has been improved to keep formatting elements out of the
resulting data file.
The 2008 CSV-rendering extension operates in two modes. In the default, Excel-optimized mode,
each data region of the report is rendered as a separate block of comma-delimited values. In CSVcompliant mode, the extension produces a single, uniform block of data accessible to a wider range of
applications.
The XML-Rendering Extension
XML is another format commonly used for rendering reports. The XML-rendering extension incorporates both data and layout information in the XML it generates.
One of the most powerful features of the XML-rendering extension is its capability to accept an XSLT
document. XSLT documents provide instructions for converting XML to other text-based formats.
26
❘
CHAPTER 1
BUSINESS REPORTING PARADIGMS
These formats may include HTML, CSV, XML, or a custom file format. The Reporting Services team
recommends attempting to leverage the XML-rendering format with XSLT for specialized rendering
needs before attempting to implement a custom rendering extension.
The Image-Rendering Extension
Through the Image-rendering extension, reports are published to one of seven image formats, the
default of which is Tagged Image File Format (TIFF). TIFF is a widely used format for storing document
images. Many facsimile (fax) programs use TIFF as their transfer standard, and many organizations
make use of it for document archives.
The PDF-Rendering Extension
Reporting Services comes with a rendering extension for Adobe’s Portable Document Format (PDF).
The PDF format is one of the most popular for document sharing over the Internet. It produces clean,
easy-to-read documents with exceptional printing capabilities. In addition, PDF documents are not
easily altered.
Although not as interactive as an HTML report with the HTML Viewer, PDFs do support document
maps. This functionality enables the creation of a table of contents-like feature, which is invaluable
with large reports. Adobe Acrobat Reader 6.0 or higher is required for viewing the PDF documents
produced by Reporting Services. It is available for free download from the Adobe web site.
The Excel-Rendering Extension
Rendering reports to Excel is another option supported by Reporting Services. Rendering to Excel is
highly useful if additional analysis is to be performed on the data by the end-user.
Not all report elements translate to Excel. While many features not available in prior versions of the
Excel-rendering extension (such as nested data regions and sub-reports) are supported in this release,
other features continue to render poorly or not at all. It is a good idea to review your reports rendered
to this format prior to publication if Excel rendering is a critical requirement. Reporting Services Books
Online provides details of how each report feature is handled when rendered to Excel.
The Word-Rendering Extension
The Word-rendering extension is new for Reporting Services 2008. The extension renders reports in
Microsoft Word 97 format with many of the same features and limitations as rendering in PDF. Unlike
PDF, the Word format allows reports to be more easily edited by the end-user following rendering.
SUMMARY
Most all reports will fit into the categories introduced in this chapter. There will be other variations
of these basic themes and you’ll likely develop a set of designs that work best for you, your users,
project sponsors, or clients. We encourage you to leverage successful report designs others have created.
Following proven design patterns provides a reliable starting point. After you discover what does and
doesn’t work for you, you can make necessary adjustments to create your own brand of reports.
Summary
❘ 27
Reporting Services developers enjoy strong community support because creative individuals share their
ideas and feedback for the benefit of the community. When you discover a pattern that works well
(or doesn’t), please share it with the community by participating in the MSDN forum or contact the
authors through their blog sites.
We’ve introduced report categories and report design concepts at a high level. The next two chapters
review essential report design components and the specific skills necessary to apply these patterns to
create many of the reports introduced in this chapter.