1
Part I: Getting Started
Chapter 1: IDE
RI
Chapter 3: Program and Module Structure
AL
Chapter 2: Controls in General
TE
Chapter 4: Data Types, Variables, and Constants
MA
Chapter 5: Operators
TE
D
Chapter 6: Subroutines and Functions
GH
Chapter 7: Program Control Statements
RI
Chapter 8: Error Handling
PY
Chapter 9: Introduction to Windows Forms Controls
CO
Chapter 10: Forms
Chapter 11: Database Controls and Objects
Chapter 12: Custom Controls
Chapter 13: Drag and Drop, and the Clipboard
Chapter 14: UAC Security
IDE
This chapter describes the Visual Studio integrated development environment (IDE). It explains the
most important windows, menus, and toolbars that make up the environment, and shows how to
customize them to suit your personal preferences. It also explains some of the tools that provide
help while you are writing Visual Basic applications.
Even if you are an experienced Visual Basic programmer, you should at least skim this material.
The IDE is extremely complex and provides hundreds (if not thousands) of commands, menus,
toolbars, windows, context menus, and other tools for editing, running, and debugging Visual
Basic projects. Even if you have used the IDE for a long time, there are sure to be some features
that you have overlooked. This chapter describes some of the most important of those features,
and you may discover something useful that you’ve never noticed before.
Even after you’ve read this chapter, you should periodically spend some time wandering through
the IDE to see what you’ve missed. Every month or so, spend a few minutes exploring the menus
and right-clicking things to see what their context menus contain. As you become a more proficient
Visual Basic programmer, you will find uses for tools that you may have previously dismissed or
failed to understand.
It is important to remember that the Visual Studio IDE is extremely customizable. You can move,
hide, or modify the menus, toolbars, and windows; create your own toolbars; dock, undock, or
rearrange the toolbars and windows; and change the behavior of the built-in text editors (change
their indentation, colors for different kinds of text, and so forth).
These capabilities enable you to display the features you need the most and hide those that are
unnecessary for a particular situation. If you need to use the Properties window, you can display
it. If you want to make room for a very wide form, you can make it short and wide, and move it
to the bottom of the screen. If you have a collection of favorite tools and possibly some you have
written yourself, you can put them all in one convenient toolbar. Or you can have several toolbars
for working with code, forms in general, and database forms in particular.
This chapter describes the basic Visual Studio development environment as it is initially installed.
Because Visual Studio is so flexible, your development environment may not look like the one
described here. After you’ve moved things around a bit to suit your personal preferences, your
menus and toolbars may not contain the same commands described here, and other windows may
be in different locations or missing entirely.
Part I: Getting Started
To avoid confusion, you should probably not customize the IDE’s basic menus and toolbars too much.
Removing the help commands from the Help menu and adding them to the Edit menu will only cause
confusion later. Moving or removing commands will also make it more difficult to follow the examples
in this and other books, and will make it more difficult to follow instructions given by others who might
be able to help you when you have problems.
It’s less confusing to leave the menus more or less alone. Hide any toolbars you don’t want and create new
customized toolbars to suit your needs. Then you can find the original standard toolbars if you decide you
need them later. The section “Customize” later in this chapter has more to say about rearranging the IDE’s
components.
Before you can understand how to use the IDE to manage Visual Basic projects and solutions, however,
you should know what projects and solutions are.
Projects and Solutions
A project is a group of files that produces some specific output. This output may be a compiled executable
program, a dynamic-link library (DLL) of classes for use by other projects, or a custom control for use on
other Windows forms.
A solution is a group of one or more projects that should be managed together. For example, suppose that
you are building a server application that provides access to your order database. You are also building
a client program that each of your sales representatives will use to query the server application. Because
these two projects are closely related, it might make sense to manage them in a single solution. When you
open the solution, you get instant access to all the files in both projects.
Both projects and solutions can include associated files that are useful for building the application but that
do not become part of a final compiled product. For example, a project might include the application’s
proposal and architecture documents. These are not included in the compiled code, but it is useful to associate them with the project.
When you open the project, Visual Studio lists those documents along with the program files. If you doubleclick one of these documents, Visual Studio opens the file using an appropriate application. For example, if
you double-click a file with a .doc extension, Visual Studio normally opens it with Microsoft Word.
To associate one of these files with a project or solution, right-click the project in the Solution Explorer
(more on the Solution Explorer shortly). Select the Add command’s Add New Item entry, and use the
resulting dialog box to select the file you want to add.
Often a Visual Basic solution contains a single project. If you just want to build a small executable program,
you probably don’t need to include other programming projects in the solution.
Another common scenario is to place Visual Basic code in one project and to place documentation (such
as project specifications and progress reports) in another project within the same solution. This keeps the
documentation handy whenever you are working on the application but keeps it separate enough that it
doesn’t clutter the Visual Studio windows when you want to work with the code.
4
Chapter 1: IDE
Although you can add any file to a project or solution, it’s not a good idea to load dozens of unrelated
files. Although you may sometimes want to refer to an unrelated file while working on a project, the
extra clutter brings additional chances for confusion. It will be less confusing to shrink the Visual Basic
IDE to an icon and open the file using an external editor such as Word or WordPad. If you won’t use a
file very often with the project, don’t add it to the project.
IDE Over view
When you first start Visual Studio, it initially displays a Startup Page by default. To change what Visual
Studio does when it starts, select the Tools menu’s Options command. Select the Show all settings check
box so you can see all of the options. Use the Environment folder’s Startup page to tell Visual Studio how
to start.
There are several reasons why Visual Studio on your system may not look exactly like the screens shown
in this book. First, Visual Studio looks different on different operating systems. The figures in this book
were taken on a computer running a pre-release version of Windows Vista, so they display the distinctive
Vista style. This computer was using the new Aero Glass style, so the forms use large, translucent borders
and other Aero-style decorations. You may see a different appearance, even if you are using Vista and you
have selected another style, or if Vista thinks your hardware won’t support Aero nicely. Additionally, some
commands may not behave exactly the same way on different operating systems.
In addition to its new Aero appearance, new features in Vista also include a new User Account Control
(UAC) security model. When you first log on, all accounts get a normal level of user privileges. Later,
when you try to run certain applications that require increased permissions, a UAC privilege elevation
dialog box appears where you can enter an administrator password. The examples in this book were
tested using a normal user account, so you should not see that dialog while running them, but you
may see it if you use other development tools. Chapter 14 provides more details about UAC.
Second, Visual Studio will look different depending on which version you have installed. The free Visual
Basic 2005 Express Edition product has fewer tools than other editions such as the high-end Visual Studio
2005 Team Suite. The figures in this book were captured while using Visual Studio 2005 Team Suite, so, if
you have another version, you may not see all of the tools shown here.
Finally, you may be using different configuration settings that the ones used while writing this book.
When you install Visual Studio, it asks you what kind of development settings you want to use. The
most obvious choice for a Visual Basic developer is Visual Basic Development Settings. This choice
customizes Visual Studio to work more easily with Visual Basic, and is a good choice if you will focus
on Visual Basic development.
Another reasonable choice is General Development Settings. This option makes Visual Studio behave more
like Visual Studio 2003 does. It’s a good choice if you are used to Visual Studio 2003, or if you expect to use
other Visual Studio languages such as C# fairly regularly.
This book assumes that you have configured Visual Studio for Visual Basic development. If you have
chosen a different configuration, some of the figures in this book may look different from what you see
on your screen. Some of the menu items available may be slightly different, or may appear in a different
order. Usually, the items are available somewhere, but you may have to search a bit to find them.
5
Part I: Getting Started
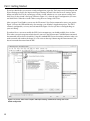
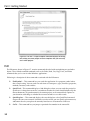
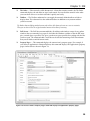
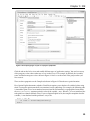
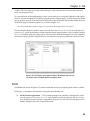
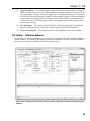
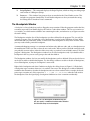
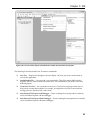
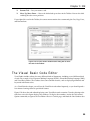
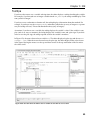
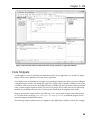
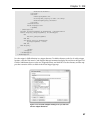
If you later decide that you want to switch configurations, open the Tools menu and select Import and
Export Settings to display the Import and Export Settings Wizard. Select the Reset all settings option
button and click Next. In the second page, tell the wizard whether to save your current settings and
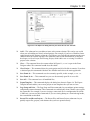
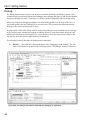
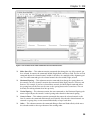
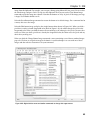
click Next. On the wizard’s final page (shown in Figure 1-1), select the type of configuration you want
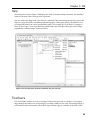
and click Finish. When the wizard is done saving the new settings, click Close.
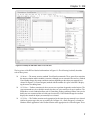
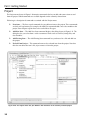
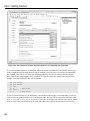
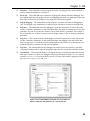
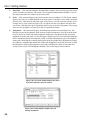
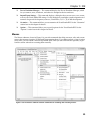
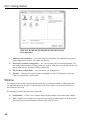
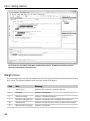
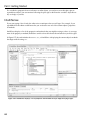
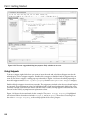
After you open Visual Studio, you can use the File menu’s New Project command to start a new project.
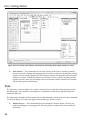
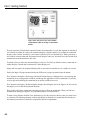
Figure 1-2 shows the IDE immediately after starting a new Windows Application project. The IDE is
extremely configurable, so it may not look much like Figure 1-2 after you have rearranged things to
your own liking.
If you don’t have a reason to modify the IDE’s basic arrangement, you should probably leave it alone.
Then when you read a magazine article that tells you to use the Project menu’s Add Reference command,
the command will be where it should be. Using the standard IDE layout also reduces confusion when you
need to consult with another developer. It’s a lot easier to share tips about using the Format menu if you
haven’t removed that menu from the IDE.
Figure 1-1: Use the Tools menu’s Import and Export Settings command to change the Visual
Studio configuration.
6
Chapter 1: IDE
1
2
3
5
4
6
7
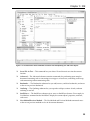
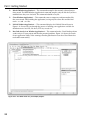
Figure 1-2: Initially the IDE looks more or less like this.
The key pieces of the IDE are labeled with numbers in Figure 1-2. The following list briefly describes
each of these pieces:
❑
(1) Menus — The menus contain standard Visual Studio commands. These generally manipulate
the current solution and the modules it contains, although you can customize the menus as needed.
Visual Studio changes the menus and their contents depending on the object you currently have
selected. In Figure 1-2, a Form Designer (marked with the number 4) is open so the IDE is displaying the menus for editing forms.
❑
(2) Toolbars — Toolbars contain tools that you can use to perform frequently needed actions. The
same commands may be available in menus, but they are easier and faster to use in toolbars. The
IDE defines several standard toolbars such as Formatting, Debug, and Image Editor. You can also
build your own custom toolbars to hold your favorite tools. Visual Studio changes the toolbars
displayed to match the object you currently have selected.
❑
(3) Toolbox — The Toolbox contains tools appropriate for the item that you currently have selected
and for the project type that you are working on. In Figure 1-2, a Form Designer is selected in a
Windows Forms application so the Toolbox contains tools appropriate for a Form Designer. These
7
Part I: Getting Started
include Windows Forms controls and components, plus tools in the other Toolbox tabs: Crystal
Reports, Data, and Components (plus the General tab is scrolled off the bottom of the Toolbox).
You can add other customized tabs to the Toolbox to hold your favorite controls and components. Other project types may display other tools. For example, a Web project would display
web controls and components instead of Windows Forms components.
❑
(4) Form Designer — A Form Designer enables you to modify the graphical design of a form. Select
a control tool from the Toolbox, and click and drag to place an instance of the control on the form.
Use the Properties window (marked with the number 6) to change the new control’s properties. In
Figure 1-2, no control is selected, so the Properties window shows the form’s properties.
❑
(5) Solution Explorer — The Solution Explorer lets you manage the files associated with the current solution. For example, in Figure 1-2, you could select Form1.vb in the Project Explorer and
then click the View Code button (the third icon from the right at the top of the Solution Explorer)
to open the form’s code editor. You can also right-click an object in the Solution Explorer to get a
list of appropriate commands for that object.
❑
(6) Properties — The Properties window lets you change an object’s properties at design time.
When you select an object in a Form Designer or in the Solution Explorer, the Properties window displays that object’s properties. To change a property’s value, simply click the property
and enter the new value.
❑
(7) Error List — The Error List window shows errors and warnings in the current project. For
example, if a variable is used and not declared, this list will say so.
If you look at the bottom of Figure 1-2, you’ll notice that the Error List window has a series of tabs. The
Task List tab displays items flagged for further action such as To Do items. The Command Window lets
you execute Visual Studio commands such as those invoked by menu items. The Immediate Window
lets you type and execute Visual Basic commands, possibly while a program is running, but paused.
The Output tab shows output printed by the application. Usually an application interacts with the user
through its forms and dialog boxes, but it can display information here to help you debug the code. The
Output window also shows informational messages generated by the IDE. For example, when you compile an application, the IDE sends messages here to tell you what it is doing and whether it succeeded.
The following sections describe the major items of the IDE in more detail.
Menus
The IDE’s menus contain standard Visual Studio commands. These are generally commands that manipulate the project and the modules it contains. Some of the concepts are similar to those used by any Windows
application (File ➪ New, File ➪ Save, Help ➪ Contents), but many of the details are specific to Visual Studio
programming, so the following sections describe them in a bit more detail.
The menus are customizable, so you can add, remove, and rearrange the menus and the items they contain. This can be quite confusing, however, if you later need to find a command that you have removed
from its normal place in the menus. Some developers place extra commands in standard menus, particularly the Tools menu, but it is generally risky to remove standard menu items. Usually it is safest to leave
the standard menus alone and make custom toolbars to hold customizations. For more information on
this, see the section “Customize” later in this chapter.
8
Chapter 1: IDE
Many of the menus’ most useful commands are also available in other ways. Many provide shortcut
key combinations that make using them quick and easy. For example, Ctrl+N opens the New Project
dialog box just as if you had selected the File ➪ New Project menu command. If you find yourself
using the same command very frequently, look in the menu and learn its keyboard shortcut to save
time later.
Many menu commands are also available in standard toolbars. For example, the Debug toolbar contains
many of the same commands that are in the Debug menu. If you use a set of menu commands frequently,
you may want to display the corresponding toolbar to make using the commands easier.
Visual Studio also provides many commands through context menus. For example, if you right-click a
project in the Solution Explorer, the context menu includes an Add Reference command that displays
the Add Reference dialog box just as if you had invoked Project ➪ Add Reference. Often it is easier to
find a command by right-clicking an object related to whatever you want to do than it is to wander
through the menus.
The following sections describe the general layout of the standard menus. You might want to open the
menus in Visual Studio as you read these sections, so you can follow along.
Note that Visual Studio displays different menus and different commands in menus depending on what
editor is active. For example, when you have a form open in the form editor, Visual Studio displays a
Format menu that you can use to arrange controls on the form. When you have a code editor open,
the Format menu is hidden because it doesn’t apply to code.
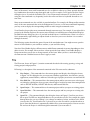
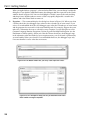
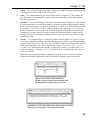
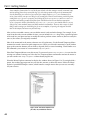
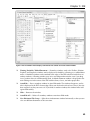
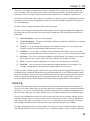
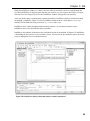
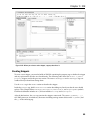
File
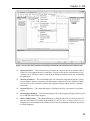
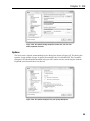
The File menu, shown in Figure 1-3, contains commands that deal with creating, opening, saving, and
closing projects and project files.
Following is a description of the commands contained in the File menu and its submenus:
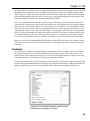
❑
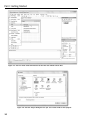
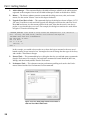
New Project — This command closes the current project and displays the dialog box shown
in Figure 1-4. This dialog box lets you create new Windows applications, class libraries, console
applications, control libraries, and more. Select the type of project you want to start and click OK.
❑
New Web Site — This command closes the current project and lets you start a new web site project. It displays a dialog box where you can select the type of web site to create from among choices
such as ASP.NET Web Site, ASP.NET Web Service, and Personal Web Site.
❑
Open Project — This command closes the current project and lets you open an existing project.
❑
Open Web Site — This command closes the current project and lets you open an existing web
site project.
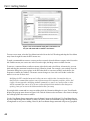
❑
Open File — This command displays the dialog box shown in Figure 1-5 and lets you select a
file to open. The IDE uses integrated editors to let you edit the new file. For example, the simple
bitmap editor lets you set a bitmap’s size, change its number of colors, and draw on it. When
you close the file, Visual Studio asks if you want to save the file and lets you decide where to
put it. Note that this doesn’t automatically add the file to your current project. You can save the
file and use the Project ➪ Add Existing Item command if you want to do so.
9
Part I: Getting Started
Figure 1-3: The File menu holds commands that deal with the solution and its files.
Figure 1-4: The New Project dialog box lets you start various kinds of new projects.
10
Chapter 1: IDE
Figure 1-5: The Open File dialog box lets you select files to view and edit.
❑
Add — This submenu lets you add new items to the current solution. This can be very useful
when you are building two closely related projects. For example, if you have a Windows forms
application that calls routines written in a class library, you can load both projects into the same
solution and work on them together. This submenu’s most useful commands for Visual Basic
developers are New Project and Existing Project, which add a new or existing Visual Basic
project to the solution.
❑
Close — This command closes the current editor. In Figure 1-3, Form1 is open in the Form
Designer editor. This command would close this editor.
❑
Close Project — This command closes the entire project and all of the files it contains. If you have
a solution open, this command is labeled Close Solution and it closes the entire application.
❑
Save Form1.vb — This command saves the currently open file, in this example, Form1.vb.
❑
Save Form1.vb As — This command lets you save the currently open file in a new file.
❑
Save All — This command saves all modified files.
❑
Export Template — This command displays the dialog box shown in Figure 1-6. The Export
Template Wizard enables you to create project or item templates that you can use later.
❑
Page Setup and Print — The Page Setup and Print commands let you configure printer settings
and print the current document. These commands are enabled only when it makes sense to print
the current file. For example, if you are viewing a source code file or a configuration file (which
is XML text), you can use these commands. If you are viewing bitmap or a form in design mode,
these commands are disabled.
❑
Recent Files and Recent Projects — The Recent Files and Recent Projects submenus let you
quickly reopen files, projects, and solutions that you have opened recently.
11
Part I: Getting Started
Figure 1-6: The File ➪ Export Template command displays this dialog
box to help you create project or items templates that you can easily
use in other projects.
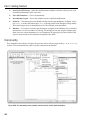
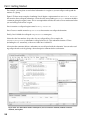
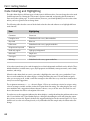
Edit
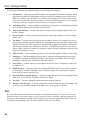
The Edit menu, shown in Figure 1-7, contains commands that deal with manipulating text and other
objects. These include standard commands such as the Undo, Redo, Cut, Copy, Paste, and Delete
commands that you’ve seen in other Windows applications.
Following is a description of other commands associated with the Edit menu:
12
❑
Find Symbol — This command lets you search the application for a program symbol rather
than a simple string. You can search for such items as namespaces, types, interfaces, properties,
methods, constants, and variables.
❑
Quick Find — This command displays a find dialog box where you can search the project for
specific text. A drop-down menu lets you indicate whether the search should include only the
current document, all open documents, the current project, or the current block. Options let
you determine such things as whether the text must match case or whole words.
❑
Quick Replace — This command displays the same dialog box as the Quick Find command
except with some extra controls. It includes a text box where you can specify replacement text,
and buttons that let you replace the currently found text or all occurrences of the text.
❑
Go To — This command lets you jump to a particular line number in the current file.
Chapter 1: IDE
Figure 1-7: The Edit menu holds commands that deal with manipulating text and other objects.
❑
Insert File As Text — This command lets you select a file and insert its text into the current
location.
❑
Advanced — The Advanced submenu contains commands for performing more complex
document formatting such as converting text to upper- or lowercase, controlling word wrap,
and commenting and uncommenting code.
❑
Bookmarks — The Bookmarks submenu lets you add, remove, and clear bookmarks, and move
to the next or previous bookmark.
❑
Outlining — The Outlining submenu lets you expand or collapse sections of code, and turn
outlining on and off.
❑
IntelliSense — The IntelliSense submenu gives access to IntelliSense features. For example, its
List Members command makes IntelliSense display the current object’s properties, methods,
and events.
❑
Next Method/Previous Method — The Next Method and Previous Method commands move
to the next or previous method or class in the current document.
13
Part I: Getting Started
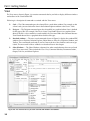
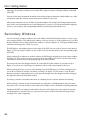
View
The View menu, shown in Figure 1-8, contains commands that let you hide or display different windows
and toolbars in the Visual Studio IDE.
Following is a description of commands associated with the View menu:
❑
Code — The Code command opens the selected file in a code editor window. For example, to edit
a form’s code, you can click on the form in the Solution Explorer and then select View ➪ Code.
❑
Designer — The Designer command opens the selected file in a graphical editor if one is defined
for that type of file. For example, if the file is a form, Visual Studio opens it in a graphical form
editor. If the file is a class module or a code module, the View menu hides this command because
Visual Studio doesn’t have a graphical editor for those file types.
❑
Standard windows — The next several commands shown in Figure 1-8 display the standard IDE
windows Server Explorer, Solution Explorer, Object Browser, Error List, Properties Window, and
Toolbox. These commands are handy if you have removed one of the windows and want to get
it back. The most useful of these windows are described later in this chapter.
❑
Other Windows — The Other Windows submenu lists other standard menus that are not listed
in the View menu itself. These include the Class View, Command Window, Document Outline,
Output, Task List, and Macro Explorer.
Figure 1-8: The View menu lets you show and hide IDE windows and toolbars.
14
Chapter 1: IDE
❑
Tab Order — If the currently visible document is a form that contains controls, the Tab Order
command displays the tab order on top of each control. You can click the controls in the order
you want them to have to set their tab order’s quickly and easily.
❑
Toolbars — The Toolbars submenu lets you toggle the currently defined toolbars to hide or
display them. This submenu lists the standard toolbars in addition to any custom toolbars
you have created.
Tip: Rather than modifying standard menus and toolbars, hide them and create new ones to customize.
Then you can later restore the original standard menus and toolbars if necessary.
❑
Full Screen — The Full Screen command hides all toolbars and windows except for any editor
windows that you currently have open. It also hides the Windows taskbar so that the IDE occupies as much space as possible. This gives you the most space possible for working with the files
you have open. The command adds a small box to the title bar containing a Full Screen button
that you can click to end full-screen mode.
❑
Property Pages — This command displays the current item’s property pages. For example, if
you select an application in Solution Explorer, this command displays the application’s property
pages similar to those shown in Figure 1-9.
Figure 1-9: The View menu’s Property Pages command displays an application’s property pages.
15
Part I: Getting Started
Project
The Project menu shown in Figure 1-10 contains commands that let you add and remove items to and
from the project. Which commands are available depends on the currently selected item.
Following is a description of commands associated with the Project menu:
❑
New items — The first several commands let you add new items to the project. These commands
are fairly self-explanatory. For example, the Add Class command adds a new class module to the
project. Later chapters explain how to use each of these file types.
❑
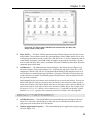
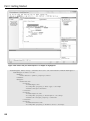
Add New Item — The Add New Item command displays the dialog shown in Figure 1-11. The
dialog box lets you select from a wide assortment of items such as text files, bitmap files, and
class modules.
❑
Add Existing Item — The Add Existing Item command lets you browse for a file and add it to
the project.
❑
Exclude From Project — This command removes the selected item from the project. Note that
this does not delete the item’s file; it just removes it from the project.
Figure 1-10: The Project menu lets you add files and references to the currently selected project.
16
Chapter 1: IDE
Figure 1-11: The Project menu’s Add New Item command lets you add a wide
variety of items to the project.
❑
Show All Files — The Show All Files command makes Solution Explorer list files that are normally hidden. These include resource files corresponding to forms, hidden partial classes such
as designer-generated form code, resource files, and files in the obj and bin directories that are
automatically created by Visual Studio when it compiles your program. Normally, you don’t
need to work with these files, so they are hidden. Select this command to show them. Select the
command again to hide them.
❑
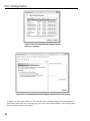
Add Reference — The Add Reference command displays the dialog shown in Figure 1-12.
Select the category of the external object, class, or library that you want to find. For a .NET
component, select the .NET tab. For a Component Object Model (COM) component such as an
ActiveX library or control built using Visual Basic 6, select the COM tab. Select the Projects tab
to add a reference to another Visual Studio project. Click the Browse tab to manually locate the
file you want to reference.
Scroll through the list of references until you find the one you want and select it. You can use
Shift+Click and Ctrl+Click to select more than one library at the same time. When you have
made your selections, click OK to add the references to the project. After you have added a reference to the project, your code can refer to the reference’s public objects. For example, if the
file MyMathLibrary.dll defines a class named MathTools and that class defines a public
function Fibonacci, a project with a reference to this DLL could use the following code.
Dim math_tools As New MyMathLibrary.MathTools
MsgBox(“Fib(5) = “ & math_tools.Fibonacci(5))
❑
Add Web Reference — The Add Web Reference command displays the dialog box shown in
Figure 1-13. You can use this dialog box to find web services and add references to them so
your project can invoke them across the Internet.
❑
WindowsApplication1 Properties — This command displays the application’s property pages
shown in Figure 1-14.
17
Part I: Getting Started
Figure 1-12: Use the Add Reference dialog box to add
references to libraries.
Figure 1-13: Use the Add Web Reference dialog to add references to web services.
In Figure 1-14, the Toolbox, Error List, Task List, and other secondary windows have been hidden to
make more room for the large Properties page. You can see these other windows’ icons lurking along
the left and bottom edges of the figure.
18
Chapter 1: IDE
Figure 1-14: Property pages let you set a project’s properties.
Click the tabs on the left to view and modify different types of application settings. You can leave many
of the property values alone and many are set in other ways. For example, by default, the Assembly
name and Root namespace values shown in Figure 1-14 are set to the name of the project when you
first create it.
There are three properties on the Compile tab shown in Figure 1-15 that deserve special mention.
First, Option Explicit determines whether Visual Basic requires you to declare all variables before using
them. Leaving this option turned off can sometimes lead to subtle bugs. For example, the following code
is intended to print a list of even numbers between 0 and 10. Unfortunately, a typographical error makes
the Debug.WriteLine statement print the value of the variable j not i. Because j is never initialized, the
code prints out a bunch of blank values. If you set Option Explicit to On, the compiler complains that the
variable j is not declared and the problem is easy to fix.
For i = 1 To 10
If i Mod 2 = 0 Then Debug.WriteLine(j)
Next i
19
Part I: Getting Started
Figure 1-15: The Compile tab contains important properties for controlling code generation.
The second compiler option is Option Strict. When this option is turned off, Visual Studio allows your
code to implicitly convert from one data type to another, even if the types are not always compatible.
For example, Visual Basic will allow the following code to try to copy the string s into the integer i.
If the value in the string happens to be a number, as in the first case, this works. If the string is not a
number, as in the second case, this fails at runtime.
Dim
Dim
s =
i =
s =
i =
i As Integer
s As String
“10”
s
‘ This works.
“Hello”
s
‘ This Fails.
If you set Option Strict to On, the IDE warns you that the two data types are incompatible, so you can
easily resolve the problem while you are writing the code. You can still use conversion functions such
as CInt, Int, and Integer.Parse to convert a string into an Integer, but you must take explicit action
to do so. This makes you think about the code and reduces the chances that the conversion is just an
20
Chapter 1: IDE
accident. This also helps you use the correct data types and avoid unnecessary conversions that may
make your program slower.
To avoid confusion and long debugging sessions, you should always set Option Explicit On and Option
Strict On. You can turn them on for a project using the project’s Property pages. To make them on by default
for new projects, open the Tools menu and select Options. Open the Projects and Solutions folder, select the
VB Defaults page, and turn the options on, as shown in Figure 1-16.
You will see many more options in Figure 1-16 if the Show all settings check box is selected.
The final compiler directive, Option Compare, can take the values Binary or Text. If you set Option Compare to Binary, Visual Basic compares strings using their binary representations. If you set Option Compare
to Text, Visual Basic compares strings using a case-insensitive method that depends on your computer’s
localization settings. Option Compare Binary is faster, but may not always produce the result you want.
Figure 1-16: The Projects and Solutions folder’s VB Defaults page lets you
set default values for Option Explicit and Option Strict.
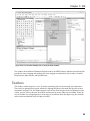
Build
The Build menu, shown in Figure 1-17, contains commands that let you compile projects within a solution.
Following is a description of commands associated with the Build menu:
❑
Build WindowsApplication1 — This command compiles the currently selected project, in this
case the project WindowsApplication1. Visual Studio examines the project’s files to see if any
have changed since the last time it compiled the project. If any of the files have changed, Visual
Studio recompiles those files to update the result.
21
Part I: Getting Started
❑
Rebuild WindowsApplication1 — This command recompiles the currently selected project
from scratch. The Build WindowsApplication1 command compiles only the files that you have
modified since they were last built. This command rebuilds every file.
❑
Clean WindowsApplication1 — This command removes temporary and intermediate files
that were created while building the application, leaving only the source files and the final
result .exe and .dll files.
❑
Publish WindowsApplication1 — This command displays the Publish Wizard shown in
Figure 1-18. It can walk you through the process of making your application available for
distribution on a local file, file share, FTP site, or web site.
❑
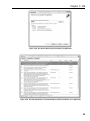
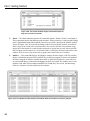
Run Code Analysis on WindowsApplication1 — This command makes Visual Studio perform
a code analysis of your project and describe potential problems. Figure 1-19 shows the results
for one application. Many of the warnings describe globalization issues that Visual Basic does
not handle automatically.
Figure 1-17: The Build menu lets you compile projects.
22
Chapter 1: IDE
Figure 1-18: The Publish Wizard helps you deploy an application.
Figure 1-19: The Run Code Analysis command displays potential problems in an application.
23
Part I: Getting Started
Debug
The Debug menu, shown in Figure 1-20, contains commands that help you debug a program. These
commands help you run the program in the debugger, move through the code, set and clear breakpoints,
and generally follow the code’s execution to see what it’s doing and hopefully what it’s doing wrong.
Effectively using these debugging techniques can make finding problems in the code much easier, so
you should spend some time learning how to use these tools. They can mean the difference between
finding a tricky error in minute, hours, or days.
The commands visible in the Debug window change, depending on several conditions such as the type
of file you have open, whether the program is running, the line of code that contains the cursor, and
whether that line contains a breakpoint. This section discusses the menu items shown in Figure 1-20.
You will see other menus items under different circumstances.
The following list briefly describes the Debug menu’s commands:
❑
Windows — This submenu’s commands display other debugging-related windows. This submenu is described in more detail in the following section, “The Debug ➪ Windows Submenu.”
Figure 1-20: The Debug menu contains commands for debugging an application.
24
Chapter 1: IDE
❑
Continue — This command resumes program execution. The program runs until it finishes, it
reaches another breakpoint, or you stop it.
❑
Break All — This command stops execution of all programs running within the debugger. This
may include more than one program if you are debugging more than one application at the same
time. This can be useful, for example, if two programs work closely together.
❑
Stop Debugging — This command halts the program’s execution and ends its debugging session. The program stops immediately, so it does not get a chance to execute any cleanup code.
❑
Step Into — This command makes the debugger execute the current line of code. If that code
invokes a function, subroutine, or some other procedure, the point of execution moves into that
procedure. It is not always obvious whether a line of code invokes a procedure. For example, a
line of code that sets an object’s property may be simply setting a value or invoking a property
procedure.
❑
Step Over — This command makes the debugger execute the current line of code. If that code
invokes a function, subroutine, or some other procedure, the debugger calls that routine but
does not step into it, so you don’t need to step through its code. However, if a breakpoint is set
inside that routine, execution will stop at the breakpoint.
❑
Step Out — This command makes the debugger run until it leaves the routine it is currently
executing. Execution pauses when the program reaches the line of code that called this routine.
❑
QuickWatch — This command displays a dialog box that gives information about the selected
code object. Figure 1-21 shows the dialog box displaying information about a TextBox control
named txtDirectory. If you look closely, you can see some of the control’s properties including TabIndex, TabStop, Tag, and Text.
Figure 1-21: The QuickWatch dialog box lets you examine an
object’s properties and optionally set a new watch on it.
25
Part I: Getting Started
When you right-click on a property’s value and select Edit Value, you can change it within the
dialog box. If you click the Add Watch button, the debugger adds the expression to the Watch
window shown in Figure 1-22. You can also highlight a variable’s name in the code and drag
and drop it into a Watch window to create a watch very quickly. Right-click a watch in this
window and select Delete Watch to remove it.
❑
Exceptions — This command displays the dialog box shown in Figure 1-23. When you select
a Thrown check box, the debugger stops whenever the selected type of error occurs. If you
select a User-unhandled check box, the debugger stops when the selected type of error occurs
and the program does not catch it with error-handling code. For example, suppose that your
code calls a subroutine that causes a divide-by-zero exception. Use the dialog box to select
Common Language Runtime Exceptions/System/System.DivideByZeroException (use the
Find button to find it quickly). When you select the Thrown check box, the debugger stops
in the subroutine when the divide-by-zero exception occurs, even if the code is protected by
an error handler. When you select the User-unhandled check box, the debugger stops only
if no error handler is active when the error occurs.
Figure 1-22: The Watch window lets you easily track expression values.
Figure 1-23: The Exceptions dialog box lets you determine how Visual
Basic handles uncaught exceptions.
26
Chapter 1: IDE
❑
Toggle Breakpoint — This command toggles whether the current code line contains a breakpoint.
When execution reaches a line with an active breakpoint, execution pauses so you can examine the
code and program variables. You can also toggle a line’s breakpoint by clicking on the margin to
the left of the line in the code editor. In Figure 1-20, line number 5 displays a circle containing an
arrow on the left, indicating that it has a breakpoint (the circle) and that it is the current line of
execution (the arrow). The following line contains a disabled breakpoint, indicated by a hollow
circle in the left margin.
❑
New Breakpoint — This submenu contains the Break At Function command. This command
displays a dialog box that lets you specify a function where the program should break.
❑
Delete All Breakpoints — This command removes all breakpoints from the entire solution.
The Debug ➪ Windows Submenu
The Debug menu’s Windows submenu, shown in Figure 1-24, contains commands that display debuggingrelated windows. The following list briefly describes these commands. The two sections that follow
describe some of the more complicated windows in greater detail.
Figure 1-24: The Debug menu’s Windows submenu contains commands that display debugging-related
windows.
27
Part I: Getting Started
❑
Immediate — This command displays the Immediate window, where you can type and execute
ad hoc Visual Basic statements. The section “The Command and Immediate Windows” later in
this chapter describes this window in a bit more detail.
❑
Locals — This command displays the Locals window shown in Figure 1-25. The Locals window
displays the values of variables defined in the local context. To change a value, click it and enter
the new value. Click the plus and minus signs to the left of a value to expand or collapse it. For
example, the Me entry shown in Figure 1-25 is an object with lots of properties that have their
own values. Click the plus sign to expand the object’s entry and view its properties. Those properties may also be objects, so you may be able to expand them further.
❑
Breakpoints — This command displays the Breakpoints window shown in Figure 1-26. This
dialog box shows the breakpoints, their locations, and their conditions. Select or clear the check
boxes on the left to enable or disable breakpoints. Right-click a breakpoint to edit its location,
condition, hit count, and action. Use the dialog box’s toolbar to create a new function breakpoint,
delete a breakpoint, delete all breakpoints, enable or disable all breakpoints, go to a breakpoint’s
source code, and change the columns displayed by the dialog. Right-click a breakpoint to change
its condition (a condition that determines whether the breakpoint is activated), hit count (a count
that determines whether the breakpoint is activated), and When Hit (action to take when activated). See the section “The Breakpoints Window” later in this chapter for more detail.
Figure 1-25: The Locals window displays the values
of variables defined in the local context.
Figure 1-26: The Breakpoints window helps you
manage breakpoints.
28
Chapter 1: IDE
❑
Output — This command displays the Output window. This window displays compilation results
and output produced by Debug and Trace statements.
❑
Autos — This command displays the Autos window shown in Figure 1-27. This window displays the values of local and global variables used in the current line of code and in the three
lines before and after it.
❑
Call Stack — This command displays the Call Stack window shown in Figure 1-28. This window
lists the routines that have called other routines to reach the program’s current point of execution.
In this example, the program is at the line 32 in function FindEmployee. That function was called
by function SearchDatabase at line 15, and that function was called by the Form_Load event
handler. Double-click a line to jump to the corresponding code in the program’s call stack. This
technique lets you move up the call stack to examine the code that called the routines that are
running. This can be a very effective technique when you need to find out what code is calling
a particular routine.
❑
Threads — This command displays the Threads window shown in Figure 1-29. A thread is a separate execution path that is running. A multithreaded application can have several threads running
to perform more than one task at the same time. The Threads window lets you control the threads’
priority and suspended status. The last line has the location WindowsApplication1.Form1
.FindEmployee, indicating that this thread is executing the FindEmployee routine in the Form1
module in program WindowsApplication1. The arrow on the left indicates that this is the currently active thread.
Right-click a thread and select Freeze to suspend it. Select Thaw to make it resume execution.
Double-click a thread or right-click it and select Switch To Thread to activate that thread.
Figure 1-27: The Autos window displays the
variables used in the current code statement and
the threestatements before and the three after.
Figure 1-28: The Call Stack window shows which routines have called
which to get to the program’s current point of execution.
29
Part I: Getting Started
Figure 1-29: The Threads window displays information about the
program’s threads of execution.
❑
Watch — The Watch submenu contains the commands Watch 1, Watch 2, Watch 3, and Watch 4.
These commands display four different watch windows. When you create a watch using the Debug
menu’s QuickWatch command described earlier, the new watch is placed in the Watch 1 window
(shown in Figure 1-22). You can click and drag watches from one watch window to another to
make a copy of the watch in the second window. You can also click the Name column in the
empty line at the bottom of a watch window and enter an expression to watch. One useful IDE
trick is to drag watch windows 2, 3, and 4 onto Watch 1 so that they all become tabs on the same
window. Then you can easily use the tabs to group and examine four sets of watches.
❑
Modules — This command displays the Modules window shown in Figure 1-30. This window
displays information about the DLL and EXE files used by the program. It shows each module’s
file name and path. It indicates whether the module is optimized, whether it is your code (versus an installed library), and whether debugging symbols are loaded. The window shows each
module’s load order (lower-numbered modules are loaded first), the version, and timestamp.
Click on a column to sort the modules by that column.
Figure 1-30: The Modules window displays information about the modules used by the program.
30
Chapter 1: IDE
❑
Script Explorer — This command displays the Script Explorer, which can help you debug script
code written in VBScript or JScript.
❑
Processes — This window lists processes that are attached to the Visual Studio session. This
includes any programs launched by Visual Studio and processes that you attached to using
the Debug menu’s Attach to Process command.
The Breakpoints Window
A breakpoint is a line of code that you have flagged to stop execution. When the program reaches that line,
execution stops and Visual Studio displays the code in a code editor window. This lets you examine or
set variables, see which routine called the one containing the code, and otherwise try to figure out what
the code is doing.
The Breakpoints window lists all the breakpoints you have defined for the program. This is useful for
a couple of reasons. First, if you define a lot of breakpoints, it can be hard to find them all later. While
other commands let you disable, enable, or remove all of the breakpoints at once, there are times when
you may need to find a particular breakpoint.
A common debugging strategy is to comment out broken code, add new code, and set a breakpoint near
the modification so that you can see how the new code works. When you have finished testing the code,
you probably want to remove either the old or new code, so you don’t want to blindly remove all of the
program’s breakpoints. The Breakpoints window lists all of the breakpoints and, if you double-click a
breakpoint in the list, you can easily jump to the code that holds it.
The Breakpoints window also lets you modify the breakpoints you have defined. Select or clear the boxes
on the left to enable or disable breakpoints. Use the dialog’s toolbar to enable or disable all breakpoints,
clear all breakpoints, or jump to a breakpoint’s source code.
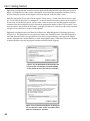
Right-click a breakpoint and select Condition to display the dialog shown in Figure 1-31. By default,
a breakpoint stops execution whenever it is reached. You can use this dialog box to add an additional
condition that determines whether the breakpoint activates when reached. In this example, the breakpoint stops execution only if the expression (i = j) And (i > 20) is True when the code reaches
the breakpoint. Note that specifying a breakpoint condition can slow execution considerably.
Figure 1-31: The Breakpoint Condition dialog box
lets you specify a condition that determines whether
Visual Studio stops at the breakpoint.
31
Part I: Getting Started
Right-click a breakpoint and select Hit Count to display the Breakpoint Hit Count dialog box shown in
Figure 1-32. Each time the code reaches a breakpoint, it increments the breakpoint’s hit count. You can
use this dialog box to make the breakpoint’s activation depend on the hit count’s value.
From the drop-down list you can select the options “break always,” “break when the hit count is equal
to,” “break when the hit count is a multiple of,” or “break when the hit count is greater than or equal to.”
If you select any but the first option, you can enter a value in the text box and the program will pause
execution when the breakpoint has been reached the appropriate number of times. For example, if you
select the option “break when the hit count is a multiple of” and enter 2 into the text box, then execution
will pause every other time it reaches the breakpoint.
Right-click a breakpoint and select When Hit to display the When Breakpoint Is Hit dialog box shown
in Figure 1-33. This dialog box lets you specify the actions that Visual Basic takes when the breakpoint is
activated. Select the Print a message check box to make the program display a message in the Output
window. Select the Run a macro check box to make the program execute a VBA macro. Select the Continue
execution check box to make the program continue running without stopping.
Figure 1-32: The Breakpoint Hit Count dialog box
lets you make a breakpoint’s activation depend
on the number of times the code has reached it.
Figure 1-33: The When Breakpoint Is Hit dialog box
lets you determine what actions Visual Basic takes
when the breakpoint is activated.
32
Chapter 1: IDE
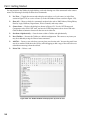
The Command and Immediate Windows
The Command and Immediate windows enable you to execute commands while the program is stopped
in the debugger. One of the more useful commands in each of these windows is the Debug.Print statement. For example, the command Debug.Print x displays the value of the variable x.
You can use a question mark as an abbreviation for Debug.Print. The following text shows how the
command might appear in the Command window. Here the > symbol is the command prompt provided
by the window and 123 is the result: the value of variable x. In the Immediate window, the statement
would not include the > character.
>? x
123
The command >immed tells the Command window to open the Immediate window. Conversely, the
command >cmd tells the Immediate window to open the Command window.
Although there is some overlap between these two windows, they serve two mostly different purposes.
The Command window can issue commands to the Visual Studio IDE. Typically, these are commands
that appear in menus or toolbars, or that could appear in menus and toolbars. For example, the following command uses the Debug menu’s QuickWatch command to open a QuickWatch window for the
variable first_name.
>Debug.QuickWatch first_name
One particularly useful command is Tools.Alias. This command lists command aliases defined
by the IDE. For example, it indicates that ? is the alias for Debug.Print and that ?? is the alias for
Debug.QuickWatch.
The Command window includes some IntelliSense support. If you type the name of a menu, for example
Debug or Tools, IntelliSense will display the commands available within that menu.
While the Command window issues commands to the IDE, the Immediate window executes Visual Basic
statements. For example, suppose that you have written a subroutine named CheckPrinter. Then the
following statement in the Immediate window executes that subroutine.
CheckPrinter
Executing subroutines in the Immediate window lets you quickly and easily test routines without writing user interface code to handle all possible situations. You can call a subroutine or function, passing it
different parameters to see what happens. If you set breakpoints within the routine, the debugger will
pause there.
Similarly, you can also set the values of global variables and then call routines that use them. The
following Immediate window commands set the value of the m_PrinterName variable and then
call the CheckPrinter subroutine.
m_PrinterName = “LP_REMOTE”
CheckPrinter
33
Part I: Getting Started
You can execute much more complex statements in the Command and Immediate windows. For example,
suppose that your program uses the following statement to open a file for reading.
Dim fs As FileStream = File.OpenRead( _
“C:\Program Files\Customer Orders\Summary” & _
datetime.Now().ToString(“yymmdd”) & “.dat”)
Suppose that the program is failing because some other part of the program is deleting the file. You can
type the following code (all on one line) into the Immediate window to see if the file exists. As you step
through different pieces of the code, you can use this statement again to see if the file has been deleted.
?System.IO.File.Exists(“C:\Program Files\Customer Orders\Summary” & _
DateTime.Now().ToString(“yymmdd”) & “.dat”)
The window evaluates the complicated string expression to produce a file name. It then uses the
System.IO.File.Exists command to determine whether the file exists and displays True or
False accordingly.
Data
The Data menu, shown in Figure 1-34, contains commands that deal with data and data sources. Some
of the commands in this menu are only visible and enabled if you are designing a form and that form
contains the proper data objects.
The following list describes commands shown in Figure 1-34:
❑
Show Data Sources — This command displays the Data Sources window, where you can work
with the program’s data sources. For example, you can drag and drop tables and fields from this
window onto a form to create controls bound to the data.
❑
Preview Data — This command displays a dialog box that lets you load data into a DataSet
and view it at design time.
❑
Add New Data Source — This command displays the Data Source Configuration Wizard,
which walks you through the process of adding a data source to the project.
❑
Add Query — This command is available when you are designing a form and have selected a
data bound control such as a DataGridView or bound TextBox. This command opens a dialog
where you can specify a query to add to the form. This places a ToolStrip on the form containing ToolStripButtons that populate the bound control by executing the query.
Format
The Format menu, shown in Figure 1-35, contains commands that arrange controls on a form. The following list describes the Format menu’s submenus:
❑
34
Align — This submenu contains commands that align the controls you have selected in various
ways. It contains the commands Lefts, Centers, Rights, Tops, Middles, Bottoms, and to Grid.
For example, the Lefts command aligns the controls so their left edges line up nicely. The to
Grid command snaps the controls to the nearest grid position. This is useful if you have moved
some controls off of the alignment grid, possibly by using one of the other Align commands or
by changing a control’s Location property in the Properties window.
Chapter 1: IDE
Figure 1-34: The Data menu holds commands that deal with datasets.
❑
Make Same Size — This submenu contains commands that change the size of the controls you
have selected. It contains the commands Width, Height, Both, and Size to Grid. The Size to Grid
command adjusts the selected controls’ widths so that they are a multiple of the alignment grid
size. The other commands give the selected controls the same width, height, or both.
❑
Horizontal Spacing — This submenu contains commands that change the spacing between
the controls you have selected. It contains the commands Make Equal, Increase, Decrease, and
Remove. For example, if you have selected three controls, the Make Equal command makes
the spacing between the first two the same as the spacing between the second two. This can
be handy for making columns that line up nicely.
❑
Vertical Spacing — This submenu contains the same commands as the Horizontal Spacing submenu except it adjusts the controls’ vertical spacing rather than their horizontal spacing.
❑
Center in Form — This submenu contains commands that center the selected controls on the
form. It contains the commands Horizontally and Vertically. Note that the selected controls are
centered as a group; they are not centered individually on top of each other.
❑
Order — This submenu contains the commands Bring to Front and Send to Back, which move
the selected controls to the top or bottom of the stacking order.
35
Part I: Getting Started
Figure 1-35: The Format menu contains commands for formatting and arranging controls on a form.
❑
Lock Controls — This command locks all of the controls on the form so that they cannot be
moved or resized by clicking and dragging. You can still move and resize the controls by changing their Location and Size properties in the Properties window. Invoking this command again
unlocks the controls. Locking the controls can be useful if you have spent a long time positioning them precisely. After they are locked, you can work on the controls without fear of accidentally messing up your careful design.
Tools
The Tools menu, shown in Figure 1-36, contains miscellaneous tools that do not fit particularly well in
the other menus. It also contains a few duplicates of commands in other menus and commands that
modify the IDE itself.
The following list describes the Tools menu’s most useful commands. Note that not all of these commands
are shown in Figure 1-36; some only appear when another type of editor is open.
❑
36
Attach to Process — This command displays the dialog box shown in Figure 1-22 to let you
attach the debugger to a running process. Select the process to which you want to attach and
click Attach.
Chapter 1: IDE
Figure 1-36: The Tools menu contains miscellaneous commands and commands that modify the IDE.
❑
Connect to Device — This command lets you connect to a physical device or emulator such as
Pocket PC or Smartphone devices or emulators. You can use the devices and emulators to test
software you are writing for devices other than the Windows platform where you are building
the application.
❑
Connect to Database — This command displays the Connection Properties dialog box, where
you can define a database connection. The connection is added to the Server Explorer window.
You can later use the connection to define data adapters and other objects that use a database
connection.
❑
Connect to Server — This command displays a dialog box that lets you connect to a database
server.
❑
Code Snippets Manager — This command displays the Code Snippets Manager, which you can
use to add and remove code snippets.
❑
Choose Toolbox Items — This command displays a dialog box that lets you select the tools displayed in the Toolbox. For instance, by default the OleDbDataAdapater and OleDbConnection
components are not included in the Toolbox. You can use this command to add them if you will
use them frequently.
37
Part I: Getting Started
❑
Add-in Manager — This command displays the Add-in Manager, which lists the add-in projects
registered on the computer. You can use the Add-in Manager to enable or disable these add-ins.
❑
Macros — The Macros submenu contains commands that help you create, edit, and execute
macros. See the section “Macros” later in this chapter for details.
❑
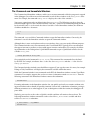
Upgrade Visual Basic 6 Code — This command displays the dialog box shown in Figure 1-37. If
you enter Visual Basic 6 code and click Upgrade, the dialog box translates the code into Visual
Basic 2005 and inserts it at the current position in the code. Note that the result is not always
perfect, so you should always review it. For example, the dialog box translates the code shown
in Figure 1-37 into the following code.
‘UPGRADE_WARNING: Lower bound of array values was changed from 1 to 0. Click for
more: ‘ms-help://MS.VSCC.v80/dv_commoner/local/redirect.htm?keyword=
“0F1C9BE1-AF9D-476E-83B1-17D43BECFF20”‘
Dim values(10) As Short
Dim i As Short
For i = 1 To 10
values(i) = i
Next i
In this example, you would at least need to re-evaluate the logic to account for the new array’s
bounds starting at zero instead of one. You might also want to change the data types of the array
and variable i from Short to Integer.
❑
External Tools — This command displays a dialog box that lets you add and remove commands
from the Tools menu. For example, you could add a command to launch WordPad, MS Paint,
WinZip, and other handy utilities from the Tools menu.
❑
Performance Tools — This submenu contains performance profiling tools such as the Performance Wizard and the New Performance Session command.
Figure 1-37: This dialog helps convert Visual Basic 6
code into Visual Basic 2005 code.
38
Chapter 1: IDE
❑
Device Emulation Manager — This command displays the Device Emulation Manager, which
lets you connect, reset, shut down, and otherwise manipulate device emulators.
❑
Import/Export Settings — This command displays a dialog box that you can use to save, restore,
or reset your Visual Studio IDE settings. Use this dialog box to configure your development environments for general development, team test, Visual Basic, C#, C++, J#, or Web development.
❑
Customize — This command allows you to customize the Visual Studio IDE. See the “Customize”
section later in this chapter for details.
❑
Options — This command allows you to specify options for the Visual Studio IDE. See the
“Options” section later in this chapter for details.
Macros
The Macros submenu, shown in Figure 1-38, provides commands that help you create, edit, and execute
macros that automate repetitive Visual Studio programming chores. If you must perform a series of actions
many times, you can record a macro that performs them. Then you can call the macro repeatedly to perform the actions rather than executing them manually.
Figure 1-38: The Macros submenu contains commands for recording and executing macros.
39
Part I: Getting Started
Some examples of macros that I’ve used in the past include code that: arranges controls in unusual ways,
such as spacing picture boxes around the edge of a circle; that generates a long series of statements that
does the same thing to a collection of text values (for example, makes Select Case statements for a
series of text values); sets up a new dialog box by creating the OK and Cancel buttons, positioning them,
setting their DialogResult properties, and setting the form’s AcceptButton and CancelButton
properties; and building a name and address form with labels and text boxes that have appropriate
Anchor properties. Author John Mueller (www.mwt.net/~jmueller) uses similar macros to set up
dialog boxes, create standard menus, and build standard event handlers. There are other ways to do these
things, such as saving a pre-built dialog box for use as a template, or by using code snippets described
later in this chapter, but macros are quick and easy.
After you have recorded a macro, you can edit the macro’s code and make changes. For example, if you
want to run the code a certain number of times, you can include it in a For loop. Often, a quick inspection
of the code lets you figure out how to modify the code to perform actions similar to (but not exactly the
same as) the actions you originally recorded.
Most of the commands in the macros submenu are self-explanatory. Use the Record TemporaryMacro
command to record a macro for quick temporary use. When you select this command, a small window
pops up that contains buttons you can click to suspend, finish, or cancel recording. Visual Studio saves
the commands you execute in a macro named TemporaryMacro.
Select Run TemporaryMacro to run this macro. If you record a new TemporaryMacro, it overwrites the
existing one without warning you. Select the Save TemporaryMacro command to rename the macro so
you can record a new TemporaryMacro without destroying this one.
Select the Macro Explorer command to display the window shown in Figure 1-39. If you right-click a
macro, the resulting pop-up menu lets you run, edit, rename, or delete the macro. Notice the Macro
Explorer’s predefined Samples section, which contains example macros that you can use or modify
for your own use.
Figure 1-39: The Macro Explorer lets
you edit, run, and delete macros.
40
Chapter 1: IDE
Sometimes when you perform a series of programming tasks many times, there are better ways to approach
the problem than writing a macro. For example, you may be able to make your program repeat the steps
inside a loop. Or you may be able to extract the common code into a subroutine and then call it repeatedly
rather than repeating the code many times. In these cases, your application doesn’t need to contain a long
sequence of repetitive code that may be hard to debug and maintain.
Macros are generally most useful when you must write similar pieces of code that cannot be easily
extracted into a routine that can be shared by different parts of the application. For example, suppose
that you need to write event handlers for several dozen TextBox controls. You could record a macro
while you write one of them. Then you could edit the macro to make it generate the others in a loop
using different control names for each event handler. You could place the bulk of the event-handling
code in a separate subroutine that each event handler would call. That would avoid the need for extensive duplicated code. (In fact, you could even use the AddHandler statement to make all the controls
use the same event handler. Then you wouldn’t even need to write all of the separate event handlers.)
Macros are also useful for manipulating the IDE and performing IDE-related tasks. For example, you can
write macros to show and hide your favorite toolbars, or to change whether the current file is opened
read-only.
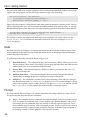
Customize
The Tools menu’s Customize command displays the dialog box shown in Figure 1-40. On the Toolbars
tab, select the check boxes next to the toolbars that you want to be visible. Click New to create a new
toolbar where you can add your favorite tools. You can leave the toolbar floating or drag it to the edge
of the IDE and dock it. If you drag it to the top, it joins the other toolbars.
Click the Commands tab to see a list of categories as shown in Figure 1-41. Select a category on the left. Then
click and drag a command from the list on the right. If you drop the command on a toolbar, the command is
added to the toolbar. Hover over a menu to open the menu so that you can drop the command in it.
Figure 1-40: The Customize dialog box’s Toolbars tab lets
you determine which toolbars are visible.
41
Part I: Getting Started
Figure 1-41: The Customize dialog box’s Commands tab
lets you add commands to toolbars and menus.
To create a new menu, select the New Menu item in the list on the left. Then drag and drop the New Menu
entry from the right list onto the IDE’s menu area.
To make a command that executes a macro you have created, select the Macros category in the list on the
left. Find the macro you want to use in the list on the right, and drag it onto a toolbar or menu.
To remove a command from a toolbar or menu, right-click it and select Delete. Alternatively, you can
click and drag the command somewhere that it cannot be placed. For example, you can drop it on the
Customize dialog box or most places in the IDE other than on a menu or toolbar (code editors, the
Properties window, the Toolbox). The mouse cursor changes to a box with an X beside it when the
mouse is over one of these areas.
Modifying the IDE’s standard menus and toolbars can cause confusion later. You may later discover
that you need a command that you have removed from a menu, and it may take you quite a while to find
it again. A better approach to modifying standard commands is to create a new custom toolbar or menu.
Add the commands you want to use to the new toolbar and then hide the standard toolbar that you are
replacing. Later you can restore the hidden standard toolbar if necessary.
If you right-click a command in a menu or toolbar while the Customize dialog box is open, Visual Studio
displays the pop-up menu shown in Figure 1-42. Click the Name text box and enter a new name to change
the text displayed in the menu or toolbar.
Use the Copy Button Image command to copy the button’s image to the clipboard. Use Paste Button Image
to paste a copied image onto a button. Usually you will use these two commands to copy the image from an
existing button to one you are adding. However, the Paste Button Image command will paste any graphical
42
Chapter 1: IDE
image from the clipboard. For example, you can open a bitmap using Microsoft Paint, press Ctrl+A to select
the whole image, and press Ctrl+C to copy it to the clipboard. Then you can use the Paste Button Image
command to paste the image into a button. Note that the buttons are 16 by 16 pixels. If the image you copy
is larger, Visual Studio shrinks it to fit.
Select the Reset Button Image command to restore the button to its default image. For a command tied to
a macro, this erases the image.
Select the Edit button image to display the simple button editor shown in Figure 1-43. When you click a
pixel that is not the selected foreground color (black in Figure 1-43), the editor changes the pixel to the
foreground color. When you hold the mouse down and drag it, the editor gives the pixels you cross that
color, too. When you click a pixel that is already the foreground color, the editor erases the pixel and any
others that you drag over.
When you click the Change Button Image command, a menu containing several dozen standard images
pops out. Click one to assign that image to the button. A useful technique is to start with one of these
images and then edit it to customize it for your command.
Figure 1-42: Right-click the menu and toolbar commands to change their appearances.
43
Part I: Getting Started
Figure 1-43: You can use the Visual Studio
simple button editor to change a command’s
button.
The pop-up menu’s Default Style command makes the command use a style that depends on whether it
is in a menu or toolbar. In a menu, the command displays a button and text. In a toolbar, the command
displays only a button. Ironically, a new button’s default style is not Default Style. When you create a
new toolbar or menu command, the button initially displays only text. You need to use the Default Style
command to make the button use this style.
Text Only (Always) makes the command display only text. Text Only (in Menus) makes a command in a
toolbar display a button and a command in a menu display text.
Image and Text makes the command display both an icon and text whether it is in a toolbar or a menu.
Finally, the Begin a Group command makes the IDE insert a group separator before the button.
The Customize dialog box’s Rearrange Commands button displays a dialog that lets you rearrange the
commands in an existing menu or toolbar, and change the appearance of those commands. It’s usually
easier to just click and drag the commands on its menu or toolbar, however.
The Customize dialog box’s Keyboard button displays the dialog box shown in Figure 1-44. You can use
this display to view and edit keyboard shortcuts.
Enter words in the Show commands containing text box to filter the commands. When you click on a
command, the dialog box displays any keyboard shortcuts associated with it.
To make a new shortcut, click the Press shortcut key(s) text box and press the keys that you want to use
as a shortcut. The Shortcut currently used by drop-down list displays any commands that already use
the shortcut you entered. To make the assignment, click the Assign button.
44
Chapter 1: IDE
Figure 1-44: The Options dialog’s Keyboard section lets you view and
modify keyboard shortcuts.
Options
The Tools menu’s Options command displays the dialog box shown in Figure 1-45. This dialog box
contains a huge number of pages of options that configure the Visual Studio IDE. The Customize
dialog box’s Keyboard button described in the previous section uses the same dialog box with the
Keyboard item selected in the list on the left.
Figure 1-45: The Options dialog box lets you specify IDE options.
45
Part I: Getting Started
The following list describes the Options dialog box’s most important categories:
❑
Environment — Contains general IDE settings such as whether the IDE uses a Multiple Document Interface (MDI) or Single Document Interface (SDI), the number of items shown in the
MRU lists, and how often the IDE saves AutoRecover information. The Fonts and Colors subsection lets you determine the colors used by the editors for different types of text. For example,
comments are shown in green by default, but you can change this color.
❑
Performance Tools — Contains settings for performance testing such as a flag indicating whether
times should be displayed in clock ticks or milliseconds.
❑
Projects and Solutions — Contains the default settings for Option Explicit, Option Strict, and
Option Compare.
❑
Source Control — Contains entries that deal with the source code control system (for example,
Source Safe).
❑
Text Editor — Contains entries that specify the text editor’s features. For example, you can use
these pages to determine whether delimiters are highlighted, the editor provides drag-and-drop
editing, scroll bars are visible, long lines are automatically wrapped, line numbers are displayed,
and the editor provides smart indentation. The Basic ➪ VB Specific subsection lets you specify
options such as whether the editor uses outlining, whether it displays procedure separators, and
suggested corrections for errors.
❑
Database Tools — Contains database parameters such as default lengths for fields of various types.
❑
Debugging — Contains debugging settings such as whether the debugger displays messages
as modules are loaded and unloaded, whether it should make you confirm when deleting all
breakpoints, and whether it should allow Edit-and-Continue.
❑
Device Tools — Contains options for development on devices such as Smartphones, Pocket PCs,
or Windows CE.
❑
HTML Designer — Contains options for configuring HTML Designer. These options determine
such settings as whether the designer starts in source or design view, and whether it displays
Smart Tags for controls in design view.
❑
Microsoft Office Keyboard Settings — Contains settings that specify how the keyboard should
work when you use Excel or Word files within Visual Studio.
❑
Test Tools — Contains settings that determine how testing tools behave.
❑
Windows Form Designer — Contains settings that control the Form Designer. For example, this
section lets you determine whether the designer uses a snap-to grid or snap lines.
Test
The Test menu contains commands that control the Visual Studio testing tools. These tools let you perform such actions as coverage testing (to see if every line of code is executed), regression testing (to see
if changes to the code broke anything), and load testing (to see how the application performs with a lot
of simulated users running at the same time). Figure 1-46 shows the Test menu.
46
Chapter 1: IDE
Figure 1-46: The Test menu displays commands that control Visual Studio’s testing tools.
The following list briefly describes the Test menu’s commands:
❑
New Test — Displays the dialog box shown in Figure 1-47 to let you create various kinds of
tests for the application.
❑
Load Metadata File — Lets you load a test metadata file. These files contain XML data that
describes test lists, each of which can contain tests. This command lets you load test lists into
different projects.
❑
Create New Test List — Lets you make a new test list. Test lists let you group related tests so
that you can execute them together. For example, you might have test lists for user interface
testing, print tests, database tests, and so forth.
❑
Start Selected Test Project with Debugger — Starts executing the test project that is currently
active in Solution Explorer with the debugger.
❑
Start Selected Test Project without Debugger — Starts executing the test project that is currently
active in Solution Explorer without the debugger.
47
Part I: Getting Started
Figure 1-47: The Add New Test dialog box lets you define new tests
for the application.
❑
Administer Test Controllers — Lets you manage test controllers. Test controllers manage test
agents and gather test results. Test agents run the tests.
❑
Select Active Test Run Configuration — Lets you select the active test run configuration. Test
run configurations determine testing parameters (such as what files are associated with the tests
and whether unit tests produce coverage information).
❑
Edit Test Run Configurations — Lets you edit test run configurations.
❑
Windows — Displays test-related windows including Test View, Test Manager, Test Results,
Code Coverage Results, and Test Runs.
Window
The Window menu contains commands that control the Visual Studio windows. Which commands
are enabled depends on the type of window that has the focus. Figure 1-48 shows this menu when
the Toolbox has the focus.
The following list briefly describes these commands:
48
❑
New Window — Creates a new window displaying the contents of the current code window.
❑
Split — Splits a code window into two panes that can display different parts of the code at the
same time. This command changes to Remove Split when you use it.
Chapter 1: IDE
Figure 1-48: The Window menu displays commands that control the Visual Studio windows.
❑
Floating, Dockable, Tabbed Document — Secondary windows such as the Toolbox, Solution
Explorer, and Properties windows can be displayed as dockable, as floating, or as tabbed documents. A dockable window can be attached to the edges of the IDE or docked with other secondary windows. A floating window stays in its own independent window even if you drag
it to a position where it would normally dock. A tabbed document window is displayed in the
main editing area in the center of the IDE with the forms, classes, and other project files.
❑
Auto Hide — Puts a secondary window in Auto Hide mode. The window disappears, and its
title is displayed at the IDE’s nearest edge. When you click on the title or hover over it, the window reappears so that you can use it. If you click on another window, this window hides itself
again automatically.
❑
Hide — Removes the window.
❑
Auto Hide All — Makes all secondary windows enter Auto Hide mode.
❑
New Horizontal Tab Group — Splits the main document window horizontally so that you can
view two different documents at the same time.
49
Part I: Getting Started
❑
New Vertical Tab Group — Splits the main document window vertically so that you can view
two different documents at the same time.
❑
Close All Documents — Closes all documents.
❑
Reset Window Layout — Resets the window layout to a default configuration.
❑
Form1.vb — The bottom part of the Window menu lists the open documents. In Figure 1-48, it
lists Form1.vb in the code editor and Form1.vb [Design] in the Form Designer (Design mode).
The Form Designer entry is checked because it is the currently active document.
❑
Windows — If you have too many open documents to display in the Window menu, select this
command to see a list of windows in a dialog. This dialog box lets you switch to another document, close one or more documents, or save documents. By pressing Ctrl+Click or Shift+Click
you can select more than one document and quickly close them.
Community
The Community menu shown in Figure 1-49 provides links to various pages on the go.Microsoft.com
web site. These commands only work if you are connected to the Internet.
Figure 1-49: The Community menu provides Internet links for Visual Studio developers.
50
Chapter 1: IDE
Help
The Help menu shown in Figure 1-50 displays the usual assortment of help commands. You should be
familiar with most of these from previous experience.
One new item in the Help menu is the How Do I command. This command opens the help system and
displays a page full of links to common programming topics. These topics lead to a hierarchical series
of categorized tutorials on various programming topics. For example, the Visual Basic ➪ Language ➪
Basics ➪ Data Types ➪ Data Type Summary topic describes the Visual Basic data types, their storage
requirements, and their ranges of allowed values.
Figure 1-50: The Help menu contains commands that give you help.
Toolbars
The Visual Studio toolbars are easy to rearrange. Grab the four gray dots on a toolbar’s left or upper
edge and drag the toolbar to its new position. If you drag a toolbar to one of the Visual Studio edges, it
will dock there either horizontally (on the IDE’s top or bottom edge) or vertically (on the IDE’s left or
51
Part I: Getting Started
right edge). If you drop a toolbar away from the IDE’s edges, it becomes a floating window not docked
to the IDE.
You can use the menu commands described earlier in this chapter to determine which toolbars are visible,
to determine what they contain, and to make custom toolbars of your own.
Many menu commands are also available in standard toolbars. For example, the Debug toolbar contains
many of the same commands that are in the Debug menu. If you use a set of menu commands frequently,
you may want to display the corresponding toolbar to make using the commands easier.
Secondar y Windows
You can rearrange secondary windows such as the Toolbox and Solution Explorer almost as easily as you
can rearrange toolbars. Click and drag the window’s title area to move it. As the window moves, the IDE
displays little blue icons to help you dock the window, as shown in Figure 1-51. This figure probably looks
somewhat confusing, but it’s fairly easy to use.
The IDE displays four docking icons near the edges of the IDE. You can see these icons near the edges of
Figure 1-51. If you drop the window on one of these icons, the window docks to the corresponding edge
of the IDE.
When you drag the window over another window, the IDE displays docking icons for the other window.
In Figure 1-51, these are the five icons near the mouse in the middle of the screen. The four icons on the
sides dock the window to the corresponding edge of the other window.
The center icon places the dropped window in a tab within the other window. If you look closely at
Figure 1-51, you can see a little image of a document with two tabs on the bottom in this icon.
When you drag the mouse over one of the docking icons, the IDE displays a pale blue rectangle to give
you an idea of where the window will land if you drop it. In Figure 1-51, the mouse is over the main
document window’s right docking icon, so the grayed rectangle shows the dropped window taking up
the right half of the main document window.
If you drop a window somewhere other than on a docking icon, the window becomes free-floating.
When you drop a window on the main document area, it becomes a tabbed document, and you cannot
later pull it out. To free the window, select it and use the Window menu’s Dockable or Floating command.
Sometimes the IDE is so cluttered with windows that it’s hard to figure out exactly where the window
will be dropped. It’s usually fairly easy to just move the mouse around a bit and watch the pale blue
rectangle to see what’s happening.
52
Chapter 1: IDE
Figure 1-51: Use the IDE’s docking icons to help you dock windows.
The windows in the Microsoft Document Explorer used by the MSDN Library and other external help files
provide the same arranging and docking tools for managing its subwindows such as Index, Contents,
Help Favorites, Index Results, and Search Results.
Toolbox
The Toolbox window displays a series of sections containing tools for the currently active document.
These tools are grouped into sections called tabs, although they don’t look much like the tabs on most
documents. In Figure 1-52, the Toolbox displays tools for the Form Designer in the All Windows Forms
section as icons. It shows the tools in the Data section listed by name. Other tabs are hidden. In this figure, the Toolbox was enlarged greatly to show most of its contents. Most developers keep this window
much smaller and docked to the left edge of the IDE.
53
Part I: Getting Started
You can customize the Toolbox by right-clicking a tab and selecting one of the commands in the context
menu. The following list briefly describes these commands:
❑
List View — Toggles the current tab to display tools either as a list of names (as in the Data
section in Figure 1-52) or a series of icons (as in the All Windows Forms section in Figure 1-52).
❑
Show All — Shows or hides less commonly used tool tabs such as XML Schema, Dialog Editor,
DataSet, Login, WebParts, Report Items, Device Controls, and many others.
❑
Choose Items — Displays the dialog box shown in Figure 1-53. Use the .NET Framework
Components tab to select .NET tools, and use the COM Components tab to select COM tools.
Click the Browse button to locate tools that are not in either list.
❑
Sort Items Alphabetically — Sorts the items within a Toolbox tab alphabetically.
❑
Reset Toolbox — Restores the Toolbox to a default configuration. This removes any items you
may have added by using the Choose Items command.
❑
Add Tab — Creates a new tab where you can place your favorite tools. You can drag tools from
one tab to another. Hold down the Ctrl key while dragging to add a copy of the tool to the new
tab without removing it from the old tab.
❑
Delete Tab — Deletes a tab.
Figure 1-52: The Toolbox window can display tools by name or icon.
54
Chapter 1: IDE
❑
Rename Tab — Lets you rename a tab.
❑
Move Up, Move Down — Moves the clicked tab up or down in the Toolbox. You can also click
and drag the tabs to new positions.
If you right-click a tool in the Toolbox, the context menu contains these commands plus Cut, Copy, Paste,
and Rename Item.
Figure 1-53: Use the Choose Toolbox Items dialog box to select
the tools in the Toolbox.
The V isual Basic Code Editor
Visual Studio includes editors for many different kinds of documents, including several different kinds
of code. For example, it has Hypertext Markup Language (HTML), Extensible Markup Language (XML),
and Visual Basic editors. These editors share some common features, such as displaying comments and
keywords in different colors.
As a Visual Basic developer, you will use the Visual Basic code editor frequently, so you should spend a
few minutes learning about its specialized features.
Figure 1-54 shows the code editor displaying some Visual Basic code at runtime. To make referring to the
code lines easier, this figure displays line numbers. To display line numbers, invoke the Tools menu’s
Options command, navigate to the Text Editor ➪ Basic ➪ General page, and check the Line Numbers box.
55
Part I: Getting Started
Figure 1-54: The Visual Basic code editor provides many features, including line numbers and icons
that indicate breakpoints and bookmarks.
Margin Icons
The gray margin to the left of the line numbers contains icons giving information about the corresponding
lines of code. The following table describes the icons on lines 4 through 13.
56
Line
Icon
Meaning
4
Yellow arrow
Indicates that execution is paused at this line
5
Red circle
Indicates a breakpoint
6
Hollow red circle
Indicates a disabled breakpoint
7
Red circle with plus sign
Indicates a breakpoint with a condition or hit count test
10
Red diamond
Indicates a breakpoint that executes an action when reached
11
Blue and white rectangle
Indicates a bookmark
Chapter 1: IDE
These icons can combine to indicate more than one condition. For example, line 12 shows a blue and
white rectangle to indicate a bookmark, a hollow red diamond to indicate a disabled breakpoint that
performs an action, and a plus sign to indicate that the breakpoint has a condition or hit count test.
Note that the editor marks some of these lines in other ways than just an icon. It highlights the currently
executing line with a yellow background. It marks lines that hold enabled breakpoints with white text
on a red background.
To add or remove a simple breakpoint, click in the gray margin.
To make a more complex breakpoint, click in the margin to create a simple breakpoint. Then right-click
the breakpoint icon and select one of the context menu’s commands. The following list describes these
commands:
❑
Delete Breakpoint — Removes the breakpoint.
❑
Disable Breakpoint — Disables the breakpoint. When the breakpoint is disabled, this command
changes to Enable Breakpoint.
❑
Location — Lets you change the breakpoint’s line number. Usually it is easier to click in the
margin to remove the old breakpoint and then create a new one.
❑
Condition — Lets you place a condition on the breakpoint. For example, you can make the
breakpoint stop execution only when the variable num_employees has a value greater than 100.
❑
Hit Count — Lets you set a hit count condition on the breakpoint. For example, you can make
the breakpoint stop execution when it has been reached a certain number of times.
❑
Filter — Lets you restrict the breakpoint so it is only set in certain processes or threads.
❑
When Hit — Lets you specify the action that the breakpoint performs when it triggers. For
example, it might display a message in the Output window or run a macro.
To add or remove a bookmark, place the cursor on a line and then click the Toggle Bookmark tool. You
can find this tool, which looks like the blue and white bookmark icon, in the Text Editor toolbar (under
the mouse in Figure 1-54) and at the top of the Bookmarks window. Other bookmark tools let you move
to the next or previous bookmark, the next or previous bookmark in the current folder, or the next or
previous bookmark in the current document. The final bookmark command clears all bookmarks.
Outlining
By default, the code editor displays an outline view of code. If you look at the first line in Figure 1-53,
you’ll see a box with a minus sign in it just to the right of the line number. That box represents the outlining for the Form1 class. If you click this box, the editor collapses the class’s definition and displays it as a
box containing a plus sign. If you then click the new box, the editor expands the class’s definition again.
The gray line leading down from the box leads to other code items that are outlined, and that you can
expand or collapse to give you the least cluttered view of the code you want to examine. Near the bottom of Figure 1-54, you can see that the RandomizeArray subroutine has been collapsed. The ellipsis
and rectangle around the routine name provide an extra indication that this code is hidden.
The editor automatically creates outlining entries for namespaces, classes and their methods, and modules and their methods. You can also use the Region statement to group a section of code for outlining.
57
Part I: Getting Started
For example, you can place several related subroutines in a region so you can collapse and expand the
routines as a group.
Figure 1-55 shows more examples of outlining. Line 36 begins a region named Randomization Functions
that contains three collapsed subroutines. Notice that the corresponding End Region statement includes
a comment giving the region’s name. This is not required but it makes the code easier to understand when
you are looking at the end of a region.
Line 89 contains a collapsed region named Utility Functions.
Line 95 starts a module named HelperRoutines that contains one collapsed subroutine.
Finally, Line 114 holds the collapsed ImageResources namespace.
Notice that the line numbers skip values for any collapsed lines. For example, the
RandomizeIntegerArray subroutine is collapsed on line 38. This subroutine contains 15 lines
(including the Sub statement), so the next visible line is labeled 53.
Also notice that comments before a subroutine are not collapsed with the subroutine. You can make reading collapsed code easier by placing a short descriptive comment before each routine.
Figure 1-55: The code editor outlines namespaces, classes and their methods, modules and their
methods, and regions.
58
Chapter 1: IDE
Tooltips
If you hover the mouse over a variable at design time, the editor displays a tooltip describing the variable.
For example, if you hovered over an integer variable named num_actions, the tooltip would display “Dim
num_actions As Integer.”
If you hover over a subroutine or function call, the tooltip displays information about that method. For
example, if you hover over the RandomizeArray subroutine (which takes an array of integers as a parameter), the tooltip will read, “Private Sub RandomizeArray(arr() As Integer).”
At runtime, if you hover over a variable, the tooltip displays the variable’s value. If the variable is complex (such as an array or structure), the tooltip displays the variable’s name and a plus sign. If you click
or hover over the plus sign, the tooltip expands to show the variable’s members.
In Figure 1-56, the mouse hovered over variable arr. The editor displayed a plus sign and the text arr
{Length = 100}. When the mouse hovered over the plus sign, the editor displayed the values shown
in the figure. Moving the mouse over the up and down arrows at the top and bottom of the list makes
the values scroll.
Figure 1-56: You can hover the mouse over a variable at run time to see its value.
59
Part I: Getting Started
If a variable has properties that are references to other objects, you can hover over their plus signs to
expand those objects. You can continue following the plus signs to drill into the variable’s object hierarchy as deeply as you like.
IntelliSense
If you start typing a line of code, the editor tries to anticipate what you will type. For example, if you
typed Me. then the editor would know that you are about to use one of the current object’s properties
or methods.
IntelliSense displays a list of the properties and methods that you might be trying to select. As you type
more of the property or method, IntelliSense scrolls to show the choices that match what you have typed.
In Figure 1-57, the code includes the text me.Set, so IntelliSense is displaying the current object’s methods
that begin with the string Set.
Figure 1-57: IntelliSense displays a list of properties and methods that you might be trying to type.
60
Chapter 1: IDE
While the IntelliSense window is visible, you can use the up and down arrows to scroll through the
list. While IntelliSense is displaying the item that you want to use, you can press the Tab key to accept
that item. Press the Escape key to close the IntelliSense window and type the rest manually.
After you finish typing a method and its opening parenthesis, IntelliSense displays information about
the method’s parameters. Figure 1-58 shows parameter information for a form object’s SetBounds
method. This method takes four parameters: x, y, width, and height.
IntelliSense shows a brief description of the current parameter x. As you enter parameter values,
IntelliSense moves on to describe the other parameters.
IntelliSense also indicates whether there are overloaded versions of the method. In Figure 1-58, IntelliSense
is describing the first version of two available versions. You can use the up and down arrows on the left
to move through the list of overloaded versions.
Figure 1-58: IntelliSense displays information about a method’s parameters.
61
Part I: Getting Started
Code Coloring and Highlighting
The code editor displays different types of code items in different colors. You can change the colors used
for different items by selecting the Tools menu’s Options command, and opening the Environment ➪
Fonts and Colors option page. To avoid confusion, however, you should probably leave the colors alone
unless you have a good reason to change them.
The following table describes some of the default colors that the code editor uses to highlight different
code elements.
Item
Highlighting
Comment
Green text
Compiler error
Underlined with a wavy blue underline
Keyword
Blue text
Other error
Underlined with a wavy purple underline
Preprocessor keyword
Blue text
Read-only region
Light gray background
Stale code
Purple text
User types
Navy text
Warning
Underlined with a wavy green underline
A few other items that may be worth changing have white backgrounds and black text by default. These
include identifiers (variable names, types, object properties and methods, namespace names, and so forth),
numbers, and strings.
When the code editor finds an error in your code, it highlights the error with a wavy underline. If you
hover over the underline, the editor displays a tooltip describing the error. If Visual Studio can guess
what you are trying to do, it adds a small flat rectangle to the end of the wavy error line to indicate that
it may have useful suggestions.
The assignment statement i = “12” shown in Figure 1-59 has an error because it tried to assign a string
value to an integer variable and that violates the Option Strict On setting. The editor displays the wavy
error underline and a suggestion indicator because it knows a way to fix this error. The Error List window at the bottom also shows a description of the error.
If you hover over the suggestion indicator, the editor displays a tooltip describing the problem and an error
icon. If you click the icon, Visual Studio displays a dialog box describing the error and listing the actions
that you may want to take. Figure 1-60 shows the suggestion dialog box for the error in Figure 1-59. If you
click the text over the revised sample code, or if you double-click the sample code, the editor makes the
change.
62
Chapter 1: IDE
Figure 1-59: If the code editor can figure out what’s wrong, it displays a suggestion indicator.
Code Snippets
A code snippet is a piece of code that you might find useful in many applications. It is stored in a snippet
library so that you can quickly insert it into a new application.
Visual Studio comes with hundreds of snippets for performing standard tasks. Before you start working on
a complicated piece of code, you should take a look at the snippets that are already available to you. In fact,
it would be worth your time to use the Snippet Manager available from the Tools menu to take a good look
at the available snippets right now before you start a new project. There’s little point in you reinventing
methods for calculating statistical values if someone has already done it and given you the code.
Snippets are stored in simple text files with XML tags, so it is easy to share snippets with other developers. Go to this book’s web page, www.vb-helper.com/vbprogref.htm, to contribute snippets and to
download snippets contributed by others.
The following sections explain how to use snippets in your applications and how to create new snippets.
63
Part I: Getting Started
Figure 1-60: The error suggestion dialog box proposes likely solutions to an error.
Using Snippets
To insert a snippet, right-click where you want to insert the code and select Insert Snippet to make the
editor display a list of snippet categories. Double-click a category to find the kinds of snippets that you
want. If you select a snippet, a tooltip pops up to describe it. Figure 1-61 shows the editor preparing to
insert the snippet named Create a public property from the VbProgRef Code Snippets category.
Double-click the snippet to insert it into your code. The snippet may include values that you should replace
in your code. These replacement values are highlighted with a light green background, and the first value
is initially selected. If you hover the mouse over one of these values, a tooltip appears to describe the value.
You can use the Tab key to jump between replacement values.
Figure 1-62 shows the inserted code for this example. The text An Integer Property is highlighted
and selected. Other selected text includes Integer, 0, and MyProperty. The mouse is hovering over
the value An Integer Property, so the tooltip explains that value’s purpose.
64
Chapter 1: IDE
Figure 1-61: When you select a code snippet, a pop-up describes it.
Creating Snippets
To create a new snippet, you need to build an XML file containing the property tags to define the snippet
and any replacements that the user should make. The following code shows the Create a public
property snippet used in the previous section. The outer CodeSnippets and CodeSnippet tags are
standard and you should not change them.
Use the Title tag in the Header section to describe the snippet.
Inside the Snippet tag, build a Declarations section describing any literal text that the user should
replace. This example defines DataType, Description, DefaultValue, and PropertyName symbols.
Each literal definition includes an ID, and can include a ToolTip and Description.
After the declarations, the Code tag contains the snippets source code. The syntax <![CDATA[...]]>
tells XML processors to include any characters including carriage returns between the <![CDATA[ and
the ]]> in the enclosing tag.
65
Part I: Getting Started
Figure 1-62: Values that you should replace in a snippet are highlighted.
<CodeSnippets xmlns=”http://schemas.microsoft.com/VisualStudio/2005/CodeSnippet”>
<CodeSnippet Format=”1.0.0”>
<Header>
<Title>Create a public property</Title>
</Header>
<Snippet>
<Declarations>
<Literal>
<ID>DataType</ID>
<ToolTip>The property’s data type.</ToolTip>
<Default>Integer</Default>
</Literal>
<Literal>
<ID>Description</ID>
<ToolTip>The property’s description.</ToolTip>
<Default>An Integer property.</Default>
</Literal>
<Literal>
<ID>DefaultValue</ID>
<ToolTip>The property’s default value.</ToolTip>
66
Chapter 1: IDE
<Default>0</Default>
</Literal>
<Literal>
<ID>PropertyName</ID>
<ToolTip>The property’s name.</ToolTip>
<Default>MyProperty</Default>
</Literal>
</Declarations>
<Code Language=”VB”>
<![CDATA[
‘ $Description$
Private m_$PropertyName$ As $DataType$ = $DefaultValue$
Public Property $PropertyName$() As $DataType$
Get
Return m_$PropertyName$
End Get
Set(ByVal value As $DataType$)
m_$PropertyName$ = value
End Set
End Property
]]>
</Code>
</Snippet>
</CodeSnippet>
</CodeSnippets>
Save the snippet’s XML definition in a snippet directory. To add the directory to the list of usable snippet
locations, select the Tool menu’s Code Snippets Manager command to display the tool shown in Figure 1-63.
Click the Add button, browse to the new snippet directory, and click OK. Now the directory and the snippets that it contains will be available in the Insert Snippet pop-ups.
Figure 1-63: The Code Snippets Manager lets you add and
remove snippet directories.
67
Part I: Getting Started
The Code Editor at Runtime
The code editor behaves slightly differently at runtime and design time. Many of its design time features
still work. Breakpoints, bookmarks, IntelliSense, and snippets still work.
At runtime, the editor adds new tools for controlling the program’s execution. Right-click a value and
select Add Watch or QuickWatch to examine and monitor the value. Use the Stop Into, Step Over, and
Step Out commands on the Debug menu or toolbar to make the program walk through the code.
Right-click a statement and select Show Next Statement to move the cursor to the next statement that the
program will execute. Select Run To Cursor to make the program continue running until it reaches the
cursor’s current line.
Right-click and select Set Next Statement to make the program jump to a new location. You can also drag
the yellow arrow indicating the next statement to a new location in the left margin. There are some restrictions on where you can move the execution position. For example, you cannot jump out of one routine
and into another.
You can discover other runtime features by exploring the editor at run time. Right-click on different parts
of the editor to see which commands are available in that mode.
Summar y
The Visual Studio integrated development environment provides many tools for writing and debugging
applications. It provides code snippets that make saving and reusing code easy. It lets you add, remove,
and disable complex breakpoints that check conditions and hit counts, and that can perform customized
actions. You can use regions and bookmarks to organize and find pieces of code, and you can step through
the code line by line at execution time.
The IDE is extremely flexible. You can show, hide, and rearrange windows; add and remove items from
menus and toolbars; and write macros to automate simple chores. Context menus attached to all sorts of
objects provide help, tools, and other features that make sense for their particular objects and under different situations.
This chapter describes some of the most useful parts of the IDE, but listing every last nook and cranny
would be tedious and not terribly useful. Rather than reading about the IDE further, you would be better
off experimenting with it. Spend a few hours really examining all of the menus. Create a snippet with
some replacement values and then insert it into your code. Step through a small program and try the
Immediate and Command windows.
While you do all this, and while you’re developing real applications, right-click things to see what sort
of context menus they provide. The IDE is packed with so many tools that it is sometimes hard to find
the one you want. Because context menus are tied closely to the objects that you click to display them,
they often provide more appropriate and focused commands than the toolbars or menus.
68
Chapter 1: IDE
After you have used the IDE for a while and are comfortable with it, customize it to match your preferences. Build custom toolbars and menus to make using your favorite tools easier. When you have the
tools that you use most at your fingertips, you will see just how productive Visual Studio can be.
After you have become familiar with the IDE, you can start building applications. One way to begin is to
design the application’s user interface: the forms, labels, text boxes, and other controls that the user sees
and manipulates to control the application. Chapter 2 describes controls in general terms. It explains what
controls are, how you can add them to a form, and how you can control and interact with them at design
time and runtime.
69