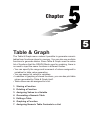
1
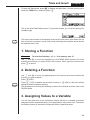
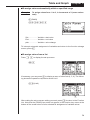
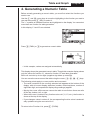
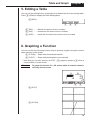
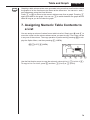
Chapter
5
Table & Graph
The Table & Graph menu makes it possible to generate numeric
tables from functions stored in memory. You can also use multiple
functions to generate tables. Since Table & Graph uses the same
list of functions that the GRAPH Mode uses for graphing, there is
no need to input the same functions in different modes.
• You can specify the range and increment of values assigned to
variables for table value generation.
• You can assign list values to variables.
• In addition to graphing of stored functions, you can also plot table
values generated by Table & Graph itself.
• Table values can be assigned to a list.
1.
2.
3.
4.
5.
6.
7.
Storing a Function
Deleting a Function
Assigning Values to a Variable
Generating a Numeric Table
Editing a Table
Graphing a Function
Assigning Numeric Table Contents to a List
Table and Graph
Chapter 5
To enter the Table Mode, press m to display the Main Menu, use the cursor keys to
select the TABLE icon, and then press w.
This is the initial Table Mode screen. To generate a table, you must first specify the
variable range.
P.8
The menu at the bottom of the display looks like the one shown here when the Var
item of the set-up screen is set to a list name (indicating that variable values should
be obtained from a list).
1. Storing a Function
Example
To store the function y = 3 x2 – 2 in memory area Y1
Use f and c to move the highlighting in the TABLE Mode function list to the
memory area where you want to store the function. Next, input the function and
press w to store it.
2. Deleting a Function
Use f and c to move the highlighting to the memory area that contains the
function you want to delete.
Press 2 (DEL).
Press 1 (YES) to delete the selected function or 4 (NO) to abort the delete
operation without deleting anything.
P.52
The procedures for storing and deleting functions are identical to those used in the
GRAPH Mode.
3. Assigning Values to a Variable
You can use either one of two methods to assign values to a variable: automatic
assignment within a specified range, and assignment of values from a list. The standard default method is automatic assignment within a specified range.
72
Table and Graph
Chapter 5
u To assign values automatically within a specified range
Example
To assign values from –3 to 3, in increments of 1 (seven values
total)
3(RANG)
-dwdwbw
Strt: ................. Variable x start value
End: ................ Variable x end value
ptch: ............... Variable x value change
To interrupt automatic assignment of variables and return to the function storage
screen, press Q.
u To assign values from a list
Press ! Z to display the set-up screen.
!Z
If necessary, you can press [ to display a menu of other lists (4, 5, 6). The following shows the operation required to select List 6.
[3(List6)
1
2
3
4
After making the set-up screen setting you want, press Q to return to the Function
List. Note that the [RANG] item does not appear in the function key menu at the
bottom of the screen when a list is selected for assignment of variable values.
73
Table and Graph
Chapter 5
4. Generating a Numeric Table
Before actually generating a numeric table, you must first select the functions you
want to use.
Use the f and c cursor keys to move the highlighting to the function you want to
use and then press 1 (SEL) to select it.
The “=” symbols of selected functions are highlighted on the display. You can select
more than one function for table generation.
In this display, Y1 and Y3 are selected.
1
2
3
4
Press 4 (TABL) or w to generate a numeric table.
• In this example, values are assigned automatically.
This display shows the generated numeric table. Though this example display shows
only the values for function Y1, values for function Y3 were also generated.
Each cell can hold up to six digits (negative sign takes up one digit).
You can move the cursor around the table using the cursor (f, c, d, e) keys.
The following points apply to cursor position and movement.
• The value contained in the currently selected cell appears at the bottom of the
display, with all current display attributes (number of decimal place, number of
significant digit, and exponential display range settings) applied.
• Moving the cursor off the screen causes the table to scroll when there are cells
off the top, bottom, left, or right .
• When the cursor is located in any function value cell (Y1, Y2, etc.), the function is
shown at the top of the display.
• If you change a value in column X, the corresponding function value is automatically updated using the new value for X.
To return to the Function List, press 1 (FORM).
74
Table and Graph
Chapter 5
5. Editing a Table
You can use the editing screen to add lines to or delete lines from an existing table.
Press 2 (ROW) to display the Table Editing Menu.
2(ROW)
1
2
3
4
1 (DEL) ....... Deletes line where cursor is located.
2 (INS) ........ Inserts new line where cursor is located.
3 (ADD) ....... Insert new line below line where cursor is located.
6. Graphing a Function
You can use the two following function keys to produce a graph using the numeric
table currently on the screen.
3 (G-CON) .. Graph with connected plot points
4 (G-PLT) .... Graph with plotted points (unconnected)
• Note that you can also produce a G-PLT (4) graph by pressing w while a
numeric table is on the screen.
Example
To graph the function Y1 = 2X, whose table of numeric values is
currently on the screen
1
2
3
4
4(G-PLT)
3(G-CON)
75
Table and Graph
P.48
Chapter 5
Graphing a table whose values were generated using more than one function causes
the graphs of all the functions to be drawn at the same time. You can set x- and yaxis parameters using the View Window.
Press u or A to return to the numeric table screen from a graph. Pressing u
again goes back to the graph. You can use u to switch between the graph and its
table as long as you do not clear the graph.
7. Assigning Numeric Table Contents to
a List
You can assign a column of values from a table into a list. Simply use d and e to
move the cursor into the column whose values you want to copy. The cursor can be
in any row of the column. The copy operation is performed by pressing K to display the Option Menu, and then pressing 2 (LMEM).
K1(LIST)2(LMEM)
1
2
3
4 [
Use the first function menu to copy the column’s values to List 1 (1) to List 4 (4).
To copy to List 5 or List 6, press [ and then 1 (List 5) or 2 (List 6).
76