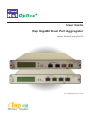
1
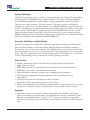
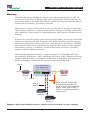
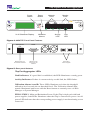
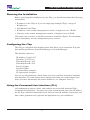
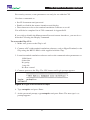
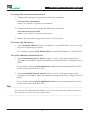
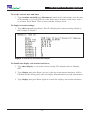
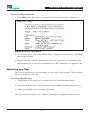
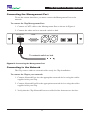
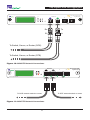
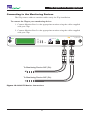
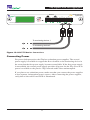
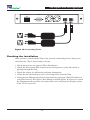
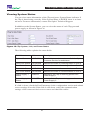
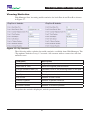
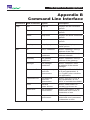
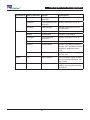
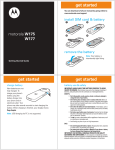
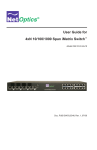
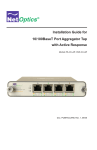
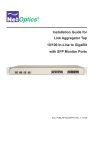
User Guide
iTap GigaBit Dual Port Aggregator
Models 96542iTP and 96547iTP
Doc. PUB542iTPU Rev. 1, 3/06
PLEASE READ THESE LEGAL NOTICES CAREFULLY.
By using a Net Optics iTap GigaBit Dual Port Aggregator you agree to the terms and conditions of usage
set forth by Net Optics, Inc.
No licenses, express or implied, are granted with respect to any of the technology described in this
manual. Net Optics retains all intellectual property rights associated with the technology described in this
manual. This manual is intended to assist with installing Net Optics products into your network.
Trademarks and Copyrights
© 2006 by Net Optics, Inc. Net Optics® is a registered trademark of Net Optics, Inc. iTapTM is a trademark of Net Optics, Inc. Additional company and product names may be trademarks or registered trademarks of the individual companies and are respectfully acknowledged.
Additional Information
Net Optics, Inc. reserves the right to make changes in specifications and other information contained
in this document without prior notice. Every effort has been made to ensure that the information in this
document is accurate.
iTap GigaBit Dual Port Aggregator
Contents
Chapter 1
Introduction
Overview . . . . . . . . . . . . . . . . . . . . . . . . . . . . . . . . . . . . . . . . . . . . . . . . . . . . . . . . . .1
Memory . . . . . . . . . . . . . . . . . . . . . . . . . . . . . . . . . . . . . . . . . . . . . . . . . . . . . . . . . .4
Unpacking and Inspection. . . . . . . . . . . . . . . . . . . . . . . . . . . . . . . . . . . . . . . . . . . . .6
About this Guide . . . . . . . . . . . . . . . . . . . . . . . . . . . . . . . . . . . . . . . . . . . . . . . . . . . .6
Chapter 2
Installing the iTap
Overview . . . . . . . . . . . . . . . . . . . . . . . . . . . . . . . . . . . . . . . . . . . . . . . . . . . . . . . . . .7
Planning the Installation . . . . . . . . . . . . . . . . . . . . . . . . . . . . . . . . . . . . . . . . . . . . . .9
Configuring the iTap . . . . . . . . . . . . . . . . . . . . . . . . . . . . . . . . . . . . . . . . . . . . . . . . .9
Using the Command Line Interface (CLI) . . . . . . . . . . . . . . . . . . . . . . . . . . . . . . . .9
Mounting the iTap . . . . . . . . . . . . . . . . . . . . . . . . . . . . . . . . . . . . . . . . . . . . . . . . . .13
Connecting the Management Port . . . . . . . . . . . . . . . . . . . . . . . . . . . . . . . . . . . . . .14
Connecting to the Network . . . . . . . . . . . . . . . . . . . . . . . . . . . . . . . . . . . . . . . . . . .14
Connecting to the Monitoring Device. . . . . . . . . . . . . . . . . . . . . . . . . . . . . . . . . . .16
Connecting Power . . . . . . . . . . . . . . . . . . . . . . . . . . . . . . . . . . . . . . . . . . . . . . . . . .17
Checking the Installation . . . . . . . . . . . . . . . . . . . . . . . . . . . . . . . . . . . . . . . . . . . .18
Chapter 3
Using the Front Panel Interface
Overview . . . . . . . . . . . . . . . . . . . . . . . . . . . . . . . . . . . . . . . . . . . . . . . . . . . . . . . . .19
Display . . . . . . . . . . . . . . . . . . . . . . . . . . . . . . . . . . . . . . . . . . . . . . . . . . . . . . . . . .19
Utilization Alarm LEDs . . . . . . . . . . . . . . . . . . . . . . . . . . . . . . . . . . . . . . . . . . . . .20
Link LEDs. . . . . . . . . . . . . . . . . . . . . . . . . . . . . . . . . . . . . . . . . . . . . . . . . . . . . . . .20
Power LEDs . . . . . . . . . . . . . . . . . . . . . . . . . . . . . . . . . . . . . . . . . . . . . . . . . . . . . .20
Reset Button . . . . . . . . . . . . . . . . . . . . . . . . . . . . . . . . . . . . . . . . . . . . . . . . . . . . . .20
iTap GigaBit Dual Port Aggregator
Chapter 4
Using Web Manager
Overview . . . . . . . . . . . . . . . . . . . . . . . . . . . . . . . . . . . . . . . . . . . . . . . . . . . . . . . . .21
Accessing Web Manager . . . . . . . . . . . . . . . . . . . . . . . . . . . . . . . . . . . . . . . . . . . . .21
Viewing System Status . . . . . . . . . . . . . . . . . . . . . . . . . . . . . . . . . . . . . . . . . . . . . .23
Viewing Statistics . . . . . . . . . . . . . . . . . . . . . . . . . . . . . . . . . . . . . . . . . . . . . . . . . .24
Configuring the iTap . . . . . . . . . . . . . . . . . . . . . . . . . . . . . . . . . . . . . . . . . . . . . . . .25
Chapter 5
Using System Manager
Overview . . . . . . . . . . . . . . . . . . . . . . . . . . . . . . . . . . . . . . . . . . . . . . . . . . . . . . . . .27
Installing System Manager . . . . . . . . . . . . . . . . . . . . . . . . . . . . . . . . . . . . . . . . . . .27
Exploring System Manager. . . . . . . . . . . . . . . . . . . . . . . . . . . . . . . . . . . . . . . . . . .31
Creating a Group . . . . . . . . . . . . . . . . . . . . . . . . . . . . . . . . . . . . . . . . . . . . . . . . . . .32
Deleting a Group . . . . . . . . . . . . . . . . . . . . . . . . . . . . . . . . . . . . . . . . . . . . . . . . . . .33
Adding iTaps . . . . . . . . . . . . . . . . . . . . . . . . . . . . . . . . . . . . . . . . . . . . . . . . . . . . . .33
Deleting an iTap . . . . . . . . . . . . . . . . . . . . . . . . . . . . . . . . . . . . . . . . . . . . . . . . . . .36
Configuring an iTap . . . . . . . . . . . . . . . . . . . . . . . . . . . . . . . . . . . . . . . . . . . . . . . .37
Viewing iTap Information . . . . . . . . . . . . . . . . . . . . . . . . . . . . . . . . . . . . . . . . . . . .38
Modifying an iTap. . . . . . . . . . . . . . . . . . . . . . . . . . . . . . . . . . . . . . . . . . . . . . . . . .40
Appendix A
Specifications and Models
Specifications . . . . . . . . . . . . . . . . . . . . . . . . . . . . . . . . . . . . . . . . . . . . . . . . . . . . .41
Available Models . . . . . . . . . . . . . . . . . . . . . . . . . . . . . . . . . . . . . . . . . . . . . . . . . .43
Appendix B
Command Line Interface
iTap GigaBit Dual Port Aggregator
Chapter 1
Introduction
Overview
Thank you for purchasing the latest innovation in Tap technology – the iTap
GigaBit Dual Port Aggregator. Net Optics' GigaBit Dual Port Aggregator Taps
provide ultra-efficient access to critical GigaBit links using only one NIC on the
monitoring device. Net Optics’ iTap is a port aggregator Tap that gives you a quick
visual reference of link performance. The iTap GigaBit Port Aggregator monitors
and displays link bandwidth utilization on its front panel so you can see exactly
what is happening on both sides of the network link.
Intelligent TapTM
The iTap Port Aggregator displays the link utilization level, last peak with time
right on the front panel so you can see real-time utilization on both directions of
the network link. The iTap Port Aggregator is accessible from remote interfaces
that provide information and control from anywhere in the network. The iTap gives
you the information and the passive access point you need to respond quickly to
network events.
Performance Aggregation
The iTap Port Aggregator combines and regenerates both directions of a fullduplex stream, sending all aggregated traffic out one or two separate passive monitoring ports. Typically, full-duplex monitoring with a network tap requires two
NICs (or a dual channel NIC)–one interface for each side of the full-duplex link.
Net Optics’ iTap Port Aggregator enables one or two devices to simultaneously
monitor a full-duplex link using only one NIC per device.
After the traffic has been aggregated to a single flow, it is no longer possible to
distinguish the utilization levels of each side of the bi-directional link. The iTap
Port Aggregator tracks the utilization levels before aggregation, keeping this vital
information easily accessible from its remote and command line interfaces.
Buffers Absorb Bursts
When the traffic levels exceed the capacity of the receiving NIC, the iTap Port
Aggregator stores the overflow traffic in buffer memory. For high-load links, the
iTap Port Aggregator has 256MB of buffer memory. The buffers clear automati-
1
iTap GigaBit Dual Port Aggregator
cally when the traffic volume falls below the receiving capacity of the NIC. These
buffers allow the iTap Port Aggregator to absorb traffic bursts without dropping
packets.
Traffic Monitoring
The iTap Port Aggregator monitors the utilization levels of both sides of the fullduplex link. This information is displayed on the front panel and is available from
the remote interfaces. The iTap Port Aggregator allows you to set a threshold for
each side of the full-duplex link at which an alarm is triggered. For example, the
iTap Port Aggregator can warn you when the utilization in either direction passes
the 30% level. When a threshold level is exceeded, the alarm LED illuminates and
the remote interfaces record the event. The iTap Port Aggregator records the level
of the highest peak along with the date and time. Since the iTap Port Aggregator is
monitoring the utilization levels, this information is always available regardless of
the aggregation process.
Seeing is Believing
The display and alarm LEDs provide a quick visual check that the utilization
levels are not exceeding the capacity of the monitoring device or a pre-determined
threshold. From the display, you can view the current bandwidth utilization of each
side of a full-duplex link with the size and time of the highest peak. A quick check
of the display lets you know if there was an event that requires further investigation. After taking action on a utilization or peak event, you can reset the data from
a recessed reset button on the front panel or from a remote interface.
Access Information Anywhere
The Web Manager and System Manager allow you to remotely set parameters,
view status information, and monitor traffic statistical data. These interfaces
provide security and performance information such as the number of over- and
under-sized packets, packet collisions, and CRC errors. You can remotely set the
alarm thresholds, clear the traffic data counters, and turn on or off a Monitor Port.
This access is also available via an optional wireless link from your wireless PDA
or laptop.
Web Manager
Net Optics' Web Manager is the browser-based interface that allows you to change
settings, view status, and retrieve data remotely with simple-to-use controls. When
you access an iTap Port Aggregator with Web Manager, all configurations, status,
and traffic data are displayed on a single page. Changes to the configuration can be
made with a few clicks of the mouse.
2
iTap GigaBit Dual Port Aggregator
System Manager
iTap Port Aggregators can be used as a system managed via Simple Network Management Protocol (SNMP) from a single interface. Net Optics' System Manager
is an SNMP management tool that offers central management of all Net Optics
iTap devices in the network. You can organize iTaps into groups according to
workgroup, location, or any other criteria. As with Web Manager, you can view all
status, configuration, and traffic information and make changes quickly to any iTap
in the system. The iTap Port Aggregator generates SNMP alarm traps for system
status, threshold alarm, link status, and power status. If you are already using an
SNMP management tool, iTap Port Aggregators can be fully accessed after loading
Net Optics' Management Information Base (MIB) file.
Security, Visibility, and Reliability
You have the option of setting the iTap Port Aggregator so that it will not display
data on the LCD and you can turn off the Management Port, thus preventing it
from being accessed from the network. The Monitor Ports can also be turned off to
prevent unauthorized access to the network link. The monitoring device connected
to the iTap Port Aggregator sees all full-duplex traffic including Layer 1 and Layer
2 errors. Redundant power connections provide uptime protection.
Ease of Use
• Display alternately shows link utilization, highest peak, and when the
highest peak occurred
• LED indicators show redundant power, link status, and utilization alarm
• IEEE 802.11b wireless communication optional
• Front-mounted connectors support easy installation and operation
• Silk-screened application diagram illustrates all connections for easy
deployment
• All necessary network and monitor cables included
• Optional 19-inch rack frames hold up to two iTaps
• Tested and compatible with all major manufacturers’ monitoring devices, including protocol analyzers, probes, and intrusion detection/prevention systems
Support
• Net Optics offers free technical support throughout the lifetime of your purchase. Our technical support team is available from 8 am to 5 pm Pacific Time,
Monday through Friday at +1 (408) 737-7777 and via email at ts-support@
netoptics.com. FAQs are also available on Net Optics' website at www.netoptics.
com.
3
iTap GigaBit Dual Port Aggregator
Memory
All traffic that passes through the iTap is sent to the monitoring device NIC on
a first-in-first-out basis, including traffic that is temporarily stored in memory. If
two packets enter at the same time then one packet is processed while the other is
stored briefly in memory, preventing collisions.
When there is a burst of data, traffic in excess of the NIC’s capacity is sent to the
iTap’s memory. Memory continues to fill until its capacity is reached, or the burst
ends, whichever comes first. For controlling bursts, the iTap has 256 MB of total
memory.
In both cases, the iTap applies a first-in-first-out procedure, processing stored data
before new data from the link. If memory fills before the burst ends, the memory
stays filled as the stored data is processed – data that leaves the buffer is immediately replaced. If the burst ends before the memory fills, memory clears until the
full memory capacity is available, or until another burst in excess of the NIC’s
capacity requires additional memory.
The following diagrams illustrate a simple example of a 1000 Mbps NIC moving from 80% utilization to 140% utilization, then back to 80% utilization. In this
example, Side A begins as 300 Mbps and Side B is at 500 Mbps, The aggregated
traffic is 800 Mbps, well below the capacity of the 1000 Mbps NIC.
Side A
iTap GigaBit Dual
Port Aggregator
A
®
2
A
1
B
Network
TM
B
1
ACT LINK
ACT LINK
2
Dual Port Aggregator
GigaBit Copper
RESET
ACT LINK
www.netoptics.com
ACT LINK
Monitor
Router
Firewall
Side B
Side A +
Side B
Monitoring
Device 1
1 Each using a single NIC,
the monitoring devices
both receive all combined
traffic from Side A and
Side B, including physical
layer errors.
Monitoring
Device 2
Figure 1: Side A plus Side B is less or equal to 100% of the NIC’s receive capacity
4
iTap GigaBit Dual Port Aggregator
The NIC receives 800 Mbps (80% utilization), so no memory is required for the
monitoring device's NIC to process all full-duplex traffic.
If there is burst of traffic on Side A of 900 Mbps and Side B remains at 500 Mbps,
the aggregated traffic equals 1400 Mbps, 400 Mbps over the capacity of the NIC.
The excess traffic is put in memory on a first-in-first-out basis until either the buffer is full or the burst passes.
Side A
iTap GigaBit Dual
Port Aggregator Tap
A
®
2
A
1
B
Network
TM
B
1
ACT LINK
ACT LINK
2
Dual Port Aggregator
GigaBit Copper
RESET
ACT LINK
www.netoptics.com
ACT LINK
Monitor
Router
Firewall
Side B
Memory
Side A +
Side B
2
Monitoring
Device 1
The extra 400 Mbps of traffic
is stored in buffer memory.
Memory continues to fill until
capacity is reached, or the
burst ends.
Monitoring
Device 2
Figure 2: Side A plus Side B becomes greater than 100% of the NIC’s receive
capacity
After the burst has passed and the buffers have passed all the stored traffic, each
monitoring device resumes receiving traffic directly from the link.
Note: ____________________________________________________________________
Utilization statistics and alarms are monitored before buffering and aggregation.
__________________________________________________________________________
5
iTap GigaBit Dual Port Aggregator
Unpacking and Inspection
Carefully unpack the iTap GigaBit Dual Port Aggregator and check for damaged or
missing parts. The iTap ships with the following:
•
•
•
•
•
•
•
iTap GigaBit Dual Port Aggregator (96542iTP or 96547iTP)
Two power supplies with cords
iTap GigaBit Dual Port Aggregator User Guide
iTap Software CD
Pads for surface mounting
Network and monitor cables
RS232 DB-9 cable for use with the Command Line Interface
You may have also ordered a one rack unit panel for rack mounting the iTap
GigaBit Port Aggregator and an extended warranty. Carefully check the packing
slip against parts received.
If any part is missing or damaged, contact Net Optics' Customer Service immediately.
About this Guide
This Guide provides you all the information you need to configure and operate the
iTap GigaBit Copper Dual Port Aggregator and the iTap GigaBit Fiber Dual Port
Aggregator. Please read the entire Guide before attempting to install or operate the
iTap.
The Guide is organized into the following chapters:
•
•
•
•
•
•
•
Chapter 1 Introduction
Chapter 2 Installing the iTap
Chapter 3 Using the Front Panel Interface
Chapter 4 Using Web Manager
Chapter 5 Using System Manager
Appendix A Specifications and Models
Appendix B Command Line Interface
This guide can be found in PDF format on the iTap CD.
6
iTap GigaBit Dual Port Aggregator
Chapter 2
Installing the iTap
Overview
This chapter describes how to install and connect the iTap GigaBit Dual Port
Aggregator. The procedure for installing the iTap follows these basic steps:
•
•
•
•
•
•
•
•
Plan the installation
Configure iTap parameters
Mount the iTap
Connect the Management Port
Connect iTap to the network
Connect iTap to the monitoring device(s)
Apply power to the iTap
Check the installation
After the iTap is installed, you can remotely monitor and control the iTap from
Web Manager or System Manager.
iTap Physical Features
Figures 3 and 4 show the front panels of the fiber and copper versions of the iTap
GigaBit Dual Port Aggregator. Figure 5 shows the rear panel of both models.
Link
LEDs
Power
Status
Reset
Button
TM
®
LINK
A
A
B
A
2
1
2
B
1
OUT
Utilization
Alarms
Figure 3 : 96542iTP Front Panel Features
7
1
B
Dual Port Aggregator
GigaBit Fiber
2
RESET
www.netoptics.com
2x16 Character Display
Network
IN
OUT
Network
Ports
IN
OUT
Monitor
OUT
Monitor
Ports
iTap GigaBit Dual Port Aggregator
Power
Status
Reset
Button
Monitor
Ports
Network
Ports
TM
A
®
2
A
1
B
Network
B
1
ACT LINK
ACT LINK
2
Dual Port Aggregator
GigaBit Copper
RESET
ACT LINK
www.netoptics.com
ACT LINK
Monitor
2x16 Character Display
Utilization
Alarms
Activity
LED
Link
LED
Figure 4: 96547iTP Front Panel Features
Management
Port
RS232
Management Port
for Remote Interfaces
RS232 Port for
Command Line
Interface
Redundant
Power Supplies
Figure 5: Rear panel features
iTap Port Aggregator LEDs
Link Indicators: If a good link is established, the LED illuminates a steady green.
Activity Indicators: If there is current activity on this link, the LED flashes.
Utilization Alarms A and B: These LEDs illuminate red when the threshold
utilization level exceeds the set threshold level. The Utilization Alarm LEDs
remain illuminated until reset with the Reset button or remotely reset via Web
Manager or System Manager.
PWR 1/ PWR 2: Main and Redundant Power. If the iTap is deployed with both
power supplies, both LEDs illuminate when the iTap is connected to power. An off
power LED indicates that the corresponding power supply is not functioning or not
connected.
8
iTap GigaBit Dual Port Aggregator
Planning the Installation
Before you begin the installation of your iTap, you should determine the following
information:
• IP address of the iTap or, if you are deploying multiple iTaps, a range of
IP addresses.
• Net Mask for the iTaps.
• IP address of the remote management console, if deployed over a WAN.
• Gateway to the remote management console, if deployed over a WAN.
Also make sure you have a suitable location to install the iTap(s). For maximum
power redundancy, use two independent power sources.
Configuring the iTap
The iTap is configured with default values that allow you to install the iTap and
then modify parameters from Web Manager or System Manager.
The defaults values are:
IP Address: 10.60.0.123
Netmask: 255.255.0.0
Threshold Port A: 50%
Threshold Port B: 50%
Port A: Gigabit
Port B: Gigabit
CLI username: netoptics
CLI password: netoptics
You can set all parameters, check status, and view statistics from the Command
Line Interface. You can change most settings later from one of the remote interfaces (for more information on remote interfaces, see Chapters 4 and 5).
Using the Command Line Interface (CLI)
All configuration options, status, and statistics are accessible from the iTap's
Command Line Interface. You must set a new username and password, IP address
for the iTap, utilization threshold levels for Port A and B, and the current date and
time. Other parameters are optional and dependent on your installation.
9
iTap GigaBit Dual Port Aggregator
For security reasons, some parameters can only be set with the CLI.
Use these commands to:
• Set CLI username and password
• Enable or disable the remote interfaces and display
• Turn character echo to the terminal emulation software on or off
You will find a complete list of CLI commands in Appendix B.
If you wish to disable the Management Port and remote interfaces, you can do so
from the CLI using the Display command.
To access the iTap CLI:
1. Make sure power to the iTap is off.
2. Connect a PC with terminal emulation software, such as HyperTerminal, to the
iTap using the RS232 DB-9 cable supplied with the iTap.
3. Launch terminal emulation software and set the communication parameters to:
19200 baud
8 data bits
No parity
1 stop bit
No flow control
3. Connect power to the iTap. The CLI banner and login prompt appears.
Figure 6: Login and Password Prompts
4. Type netoptics and press Enter.
5. At the password prompt, type netoptics and press Enter. The NetOptics:
prompt appears.
10
iTap GigaBit Dual Port Aggregator
To change the username and password:
1. Change the username by typing the following command:
set username <username>
where <username> is your new username.
2. Change the password by typing the following command:
set password <password>
where <password> is your new password.
3. Record the username and password in a secure location.
To set the iTap IP address:
1. Type set ip <ip address> where <ip address> is the IP address you are assigning to the iTap and press Enter.
For example, typing set ip 10.60.0.100 sets the iTap IP address to 10.60.0.100.
To set the utilization threshold levels:
1. Type set threshold port a <level> where <level> is the percentage of the
available bandwidth at which the utilization alarm for Port A is triggered. Press
Enter.
For example, typing set threshold port a 30 sets the alarm threshold level for
traffic received on Port A to 30%.
2. Type set threshold port b <level> where <level> is the percentage of the
available bandwidth at which the utilization alarm for Port B is triggered. Press
Enter.
For example, typing set threshold port b 30 sets the alarm threshold level for
traffic received on Port B to 30%.
Tip! _____________________________________________________________________
You can set the utilization threshold levels at any time from the remote interfaces.
See Chapters 4 and 5 for more information.
__________________________________________________________________________
11
iTap GigaBit Dual Port Aggregator
To set the current date and time:
1. Type set time <mm/dd/yyyy-hh:mm:ss> where mm is the month, dd is the day
of the month, yyyy is the year, hh is the hour, mm is minutes of the hour, and ss
is seconds. Press Enter. Time is based on the 24-hour clock.
To display current settings:
1. Type show set and press Enter. The CLI displays the current setting similar to
the example in Figure 7.
Figure 7: Show Set Command Example
To disable the display and remote interfaces:
1. Type show display to view the current setting. The default value is Display:
ON.
2. Type display and press Enter. Access to the tap from remote interfaces will be
blocked and the front panel will not display link utilization or peak information.
3. Type display and press Enter again to restore the display and remote intefaces.
12
iTap GigaBit Dual Port Aggregator
To use the Help command:
1. Type Help at the NetOptics prompt. The list of help topics is displayed.
Figure 8: iTap CLI Help Menu
5. To view the syntax for changing the iTap’s configuration parameters, type help
set and press Enter.
6. Repeat with the variable of interest to view the syntax for all commands available from the CLI. For more information on CLI commands, see Appendix B.
Mounting the iTap
The iTap is designed for rack mounting in a two-slot, 19-inch panel. The mounting
panel occupies one rack unit.
To rack mount the iTap:
1. Attach the two-slot panel to your rack using the attached thumbscrews.
2. Slide the iTap into one of the slots and secure with the attached thumbscrews.
3. Make sure that the rack is properly grounded.
The iTap can also be placed on a surface using the pads supplied with the iTap.
13
iTap GigaBit Dual Port Aggregator
Connecting the Management Port
To use the remote interfaces you must connect the Management Port to the
network.
To connect the iTap Management Port:
1. Connect a CAT5 cable to the Manangement Port as shown in Figure 9.
2. Connect the other end to a network switch or hub.
Management
Port
RS232
To network switch or hub
Figure 9: Connecting the Management Port
Connecting to the Network
The iTap comes with two network cables ready for iTap installation.
To connect the iTap to your network:
1. Connect Network Port A to the appropriate network device using the cables
supplied with your iTap.
2. Connect Network Port B to the appropriate network device using the cables
supplied with your iTap.
3. Verify that the iTap Network Ports are cabled in-line between two devices.
14
iTap GigaBit Dual Port Aggregator
TM
®
LINK
A
A
B
A
2
1
2
B
1
Network
1
B
Dual Port Aggregator
GigaBit Fiber
2
RESET
OUT
www.netoptics.com
IN
OUT
IN
OUT
Rx
Tx
B
A
OUT
Monitor
To Switch, Server, or Router (DCE)
To Switch, Server, or Router (DTE)
Figure 10: 96542iTP Network Connections
TM
A
®
2
A
1
B
Network
B
1
ACT LINK
ACT LINK
2
Dual Port Aggregator
GigaBit Copper
RESET
ACT LINK
www.netoptics.com
ACT LINK
Monitor
To DCE network switch or router
Figure 11: 96547iTP Network Connections
15
To DTE network switch or router
iTap GigaBit Dual Port Aggregator
Connecting to the Monitoring Devices
The iTap comes with two monitor cables ready for iTap installation.
To connect the iTap to your monitoring device:
1. Connect Monitor Port 1 to the appropriate monitor using the cables supplied
with your iTap.
2. Connect Monitor Port 2 to the appropriate monitor using the cables supplied
with your iTap.
TM
®
LINK
A
A
B
A
2
1
2
B
1
To Monitoring Device NIC (Rx)
To Monitoring Device NIC (Rx)
Figure 12: 96542iTP Monitor Connections
16
1
B
Dual Port Aggregator
GigaBit Fiber
2
RESET
OUT
www.netoptics.com
Network
IN
OUT
IN
OUT
Monitor
OUT
iTap GigaBit Dual Port Aggregator
TM
A
®
2
A
1
B
Network
B
1
ACT LINK
ACT LINK
2
Dual Port Aggregator
GigaBit Copper
RESET
ACT LINK
www.netoptics.com
ACT LINK
Monitor
To monitoring device 1
To monitoring device 2
Figure 13: 96547iTP Monitor Connections
Connecting Power
For power fault protection, the iTap has redundant power supplies. The second
power supply is available to support the flow of traffic to the monitoring device in
the event that the first power supply becomes unavailable. If the first power supply
is unavailable, the second power supply provides all power for the iTap. Even if no
power is available to the passive iTap, network traffic flows uninterrupted.
If you plan to use redundant power, make sure that you connect the power supplies
to two separate, independent power sources. After connecting the power supplies,
verify that at least one Power LED is illuminated.
17
iTap GigaBit Dual Port Aggregator
Management
Port
RS232
Figure 14: Connecting Power
Checking the Installation
After you have connected the iTap to the network, monitoring device and power,
verify that the iTap is functioning correctly.
• Check that at least one power LED is illuminated.
• Check the link status LEDs located on the front panel to verify that traffic is
passing through the iTap.
• Check the display for utilization and peak information.
• Verify that the monitoring device is receiving traffic from the iTap.
• Verify that the Management Port is functional by typing the iTap's IP address in
your Web browser. Net Optics' Web Manager should appear. If it does not, check
the Management Port cables and connections and verify that the Display option
in the CLI is set to ON.
18
iTap GigaBit Dual Port Aggregator
Chapter 3
Using the Front Panel Interface
Overview
This chapter describes how to interpret and work with the front panel features of
the iTap GigaBit Dual Port Aggregator. The following topics are covered:
• Display
• LED indicators
• Reset Button
The iTap front panel provides information in two ways. The displays shows utilization and peak information and the LEDs show link status and alarm conditions.
The front panel also has a recessed reset button to clear the peak data.
Display
The front panel of the iTap provides network traffic information on a 2x16
character LCD. After a bootup message, the display scrolls through the following
messages, advancing every five seconds:
Display Message
Description
% Util A = XX%
Percent of Network Port A bandwidth being used by
incoming traffic
% Util B = XX%
Percent of Network Port B bandwidth being used by
incoming traffic
Peak A = XX%
Incoming traffic peak on Network Port A as percent of
bandwidth
Peak B = XX%
Incoming traffic peak on Network Port B as percent of
bandwidth
Time A = AAA, hh:
mm:ss
The day and time of the highest peak on Network Port A
since last reset where AAA is the day of the week and hh:
mm:ss is hours, minutes, and seconds on a 24-hour clock
Time B = AAA, hh:
mm:ss
The day and time of the highest peak on Network Port B
since last reset where AAA is the day of the week and hh:
mm:ss is hours, minutes, and seconds on a 24-hour clock
19
iTap GigaBit Dual Port Aggregator
The percentage utilization data on the display is refreshed every second.
Network peaks are given as a percent of utilization and reflect the highest peak
recorded since the last reset. The day and time information reflects the highest
peak event since reset. You can set the iTap's 24-hour clock through the CLI or
remote interfaces.
For example:
If you have set the thresholds for 30% utilization on Friday and during the weekend several peaks over this level occur, the iTap provides information only on the
highest peak event.
If data is not displaying as expected, check the Network Port connectors for link
status and activity. Also check the status of the Display command using the CLI
(see page 12).
Utilization Alarm LEDs
There are two LEDs indicating when the utilization levels have exceeded the
threshold. There is one LED for incoming traffic on each Network Port. When a
Utilization Alarm LED is red, it indicates that the threshold level was exceeded for
that port since the last reset. The LEDs remain illuminated until reset via the reset
button or remote interfaces.
Link LEDs
The RJ45 connectors have two LEDs for link status. If a good link is established,
the right LED illuminates a steady green. If there is current activity on this link,
the left LED flashes.
Power LEDs
If the iTap is deployed with both power supplies, both power LEDs illuminate
when the iTap is connected to power. If an LED is off, the corresponding power
supply is not functioning.
Reset Button
Use the Reset button to quickly reset the traffic peak and time on the display and
the Utilization Alarm LEDs. To prevent accidental resets, the Reset button is
recessed from the front panel. To push the Reset button, use a thin, rigid tool such
as an unbent paperclip.
20
iTap GigaBit Copper Port Aggregator
Chapter 4
Using Web Manager
Overview
This chapter describes how to monitor and control individual iTap GigaBit Port
Aggregators using Web Manager. The following topics are covered:
•
•
•
•
Accessing Web Manager
Status
Statistics
Configuration
The iTap GigaBit Port Aggregator has built-in support for remote control from any
computer with an Internet browser and access to the iTap’s IP address. Web Manager is the browser-based interface that allows you to change settings, view status,
and retrieve data remotely.
Note: ____________________________________________________________________
To access Web Manager, the Display option in the CLI must be set to ON. For
more information, see Using the Command Line Interface on page 9.
__________________________________________________________________________
Accessing Web Manager
Web Manager is a browser-based interface that provides access to an iTap that has
an IP address accessible from the computer running Web Manager. Web Manager
supports all common browsers.
To access Web Manager:
1. Open an Internet browser on your computer.
2. Enter the iTap’s IP address in the URL box and press Enter. The default IP
address is 10.60.0.123. The Web Manager page appears as shown in Figure 15.
21
iTap GigaBit Copper Port Aggregator
Figure 15: Web Manager Page
The following table explains the fields in Web Manager. To save any changes to
the iTap, you must click Submit Changes.
22
iTap GigaBit Copper Port Aggregator
Viewing System Status
You can view status information of the iTap and ports. System Status indicates if
the iTap is functioning correctly. If the System Status is DOWN, there is an internal error. For more information, contact Net Optics' Technical Support.
In addition to the System Status, you can view the status of each iTap port and
power supply as shown in Figure 16.
Figure 16: iTap System, Link, and Power Status
The following table explains the status fields.
Field Name
Value
Description
System Status
UP/DOWN
Down indicates an internal error. Call Net Optics
Customer Service for assistance
Port A Link Status
UP/DOWN
Indicates the state of incoming traffic on Port A
Port B Link Status
UP/DOWN
Indicates the state of incoming traffic on Port B
Port 1 Link Status
UP/DOWN
Indicates the state of communication on Port 1
Port 2 Link Status
UP/DOWN
Indicates the state of communication on Port 2
Power Supply 1
Status
ON/OFF
Indicates if the iTap is receiving power from
Power Supply 1
Power Supply 2
Status
ON/OFF
Indicates if the iTap is receiving power from
Power Supply 2
If a link is down, check the Port Parameters in the configuration section and submit
correct settings if needed. If the link is still down, verify the communication
settings of the connected devices are correct and check the cables.
23
iTap GigaBit Copper Port Aggregator
Viewing Statistics
Web Manager lists incoming traffic statistics for both Port A and Port B as shown
in Figure 17.
Figure 17: iTap Statistics
The following table explains the traffic statistics available from Web Manager. The
iTap updates statistics every 15 seconds. All counters reflect counts since the last
statistics reset.
Field Name
Description
Peak Rate (%)
Highest peak since last reset
Peak Date & Time
When the highest peak occurred
Current Utilization Rate (%)
Utilization level of the incoming traffic on the port
Total Packets
Total packets received
Total Bytes
Total bytes received
CRC Errors
Number of CRC errors
Collision Packets
Number of packet collisions
Undersize Packets
Number of undersize packets
Oversize Packets
Number of oversize packets
To update the statistics displayed, refresh your browser.
24
iTap GigaBit Copper Port Aggregator
Configuring the iTap
Web Manager has both read-only and read/write fields. Use the read/write fields
in the iTap Configuration section of the Web Manager page to set configuration
parameters (see Figure 18).
Figure 18: iTap Configuration
The following table explains each available option. To make your changes take
effect, click Submit Changes at the bottom of the page.
Field Name
Function/Value
Description
IP Address
0.0.0.0
IP address of the iTap. The default
IP address is 10.60.0.123. You can
change the IP address by typing a
new IP address in the text box.
Net Mask
0.0.0.0
Displays current Net Mask of the
iTap. The default Net Mask is
255.255.0.0. You can change the IP
address by typing a new Net Mask in
the text box.
Manager IP
Address
0.0.0.0
IP Address of the computer running
Net Optics System Manager over a
WAN. You can change the IP address
by typing a new IP address in the
text box.
Gateway IP
Address
0.0.0.0
Displays current IP Address of the
current WAN Gateway. You can
change the Gateway by typing a new
IP address in the text box.
25
iTap GigaBit Copper Port Aggregator
Field Name
Function/Value
Description
Port A Parameters
Gigabit
Auto-negotiation
100BT Full Duplex
100BT Half Duplex
10BT Full Duplex
10BT Half Duplex
Disable
The iTap GigaBit Port Aggregator is a
single-speed device. Leave parameter at the default GigaBit setting.
You have the option of disabling Port
A, however all incoming traffic to Port
A will be lost.
Port B Parameters
Gigabit
Auto-negotiation
100BT Full Duplex
100BT Half Duplex
10BT Full Duplex
10BT Half Duplex
Disable
The iTap GigaBit Port Aggregator is a
single-speed device. Leave parameter at the default GigaBit setting.
You have the option of disabling Port
B, however all incoming traffic to Port
B will be lost.
Port 1 Parameters
Gigabit
Auto-negotiation
100BT Full Duplex
100BT Half Duplex
10BT Full Duplex
10BT Half Duplex
Disable
The iTap GigaBit Port Aggregator is a
single-speed device. Leave parameter at the default GigaBit setting.
You have the option of disabling Port
1 to prevent unauthorized access to
the Monitor Port.
Port 2 Parameters
Gigabit
Auto-negotiation
100BT Full Duplex
100BT Half Duplex
10BT Full Duplex
10BT Half Duplex
Disable
The iTap GigaBit Port Aggregator is a
single-speed device. Leave parameter at the default GigaBit setting.
You have the option of disabling Port
2 to prevent unauthorized access to
the Monitor Port.
Port A Peak Rate
Reset
No/Yes
To reset the Peak data for Port A,
select Yes and click Submit Changes.
Port B Peak Rate
Reset
No/Yes
To reset the Peak data for Port B,
select Yes and click Submit Changes.
Port A Utilization
Threshold (%)
Utilization Level
Alarm
Enter the utilization level that will
trigger a threshold alarm for Port A.
Port B Utilization
Threshold (%)
Utilization Level
Alarm
Enter the utilization level that will
trigger a threshold alarm for Port B.
Reset Port A
Statistics
No/Yes
To zero all counters for Port A, select
Yes and click Submit Changes.
Reset Port B
Statistics
No/Yes
To zero all counters for Port B, select
Yes and click Submit Changes.
Current Date and
Time
XX/XX/XXXX
XX:XX:XX
Enter your local date and time for
traffic peak timestamps.
26
iTap GigaBit Dual Port Aggregator
Chapter 5
Using System Manager
Overview
This chapter describes how to install and use Net Optics' System Manager, which
allows you to change settings, view status, and retrieve data remotely from multiple Net Optics iTap devices. The following topics are covered:
•
•
•
•
•
•
Installing System Manager
Exploring System Manager
Creating a Group
Adding and Deleting iTaps
Using the Status Tab
Using the Configuration Tab
Installing System Manager
The installation executable file for System Manager can be found on the CD
included with the iTap.
To install System Manger:
1. Locate Setup.exe on the CD and double click it. The License Agreement dialog
box appears as shown in Figure 19.
Figure 19: Net Optics System Manager License Agreement
27
iTap GigaBit Dual Port Aggregator
3. After reading the agreement, select I Agree and click Next to install System
Manager. The Welcome dialog box appears as shown in Figure 20.
Figure 20: Welcome Dialog Box
2. Click Next. The Select Installation Folder dialog box shown in appears.
Figure 21: Select Installation Folder
3. To install in the default folder, make no changes to the path in the Folder: text
box. To install in a different location, either type the path in the Folder: text
box or click Browse to find another location. To check the space available for
System Manager on the selected drive, click Disk Cost.
28
iTap GigaBit Dual Port Aggregator
4. To limit access to System Manager to the current user of the PC, select Just
Me. To allow access to any user logged into the PC, select Everyone.
5. Click Next. The Confirm Installation dialog box shown in Figure 22 appears.
To continue the installation, click Next. The Progress dialog box appears as
shown in Figure 23.
Figure 22: Confirm Installation
Figure 23: Installation Progress
29
iTap GigaBit Dual Port Aggregator
6. If you want to stop the installation, click Cancel. When the installation is complete, the Installation Complete dialog box appears as shown in Figure 24.
Figure 24: Installation Complete
7. Click Close. System Manager is now installed on your computer and there is a
Net Optics shortcut icon on your desktop.
30
iTap GigaBit Dual Port Aggregator
Exploring System Manager
This section explains the features and functions of System Manager. With System
Manager you can:
•
•
•
•
•
Create iTap groups
Add and delete iTaps from the system
Remotely configure iTaps
View traffic utilization and peaks
View traffic statistics
NOTE ___________________________________________________________________
To access the iTap with System Manager, the Display option in the CLI must be set
to ON. For more information, see Using the Command Line Interface on page 9.
__________________________________________________________________________
To access System Manager:
1. Double click the System Manager icon on your PC desktop. The initial window,
shown in Figure 25, will not show any iTaps.
System Frame
Information Frame
Figure 25: Initial window
The System Frame displays iTaps and iTap Groups as you add them to the system.
The Information Frame displays Configuration and Status information for individual iTaps.
31
iTap GigaBit Dual Port Aggregator
Tip! _____________________________________________________________________
To use pop-up menu shortcuts, click your right mouse button in the System Frame.
__________________________________________________________________________
Using the Toolbar
Figure 26 shows the System Manager toolbar.
Figure 26: Toolbar
The table below describes the icons found on the toolbar.
Tool
Description
New iTap
Add iTaps to a group
New Group
Create an iTap group
Delete
Delete iTap from the system
Modify
Change the iTap name, IP address, model, and add notes
Refresh
Refresh the data display
Exit
Close Net Optics System Manager
About
View information about System Manager
Creating a Group
You can organize iTap devices into groups for quick access. You must create a
Group before you can add iTaps to your system.
To create an iTap group:
1. Click New Group in the toolbar as shown in Figure 27. A new group bar
appears in the System Frame as shown in Figure 28.
Figure 27: New Group
32
iTap GigaBit Dual Port Aggregator
Figure 28: Group Bar
2. Type the name of the new group and press Enter.
Deleting a Group
You can delete a group however, all iTaps in that group will also be deleted.
To delete a Group:
1. Right click on the group bar of the group you want to delete.
2. Select Delete from the pop-up menu. The Group and all associated iTaps are
deleted from the system.
Adding iTaps
To create a system in System Manager, you must add iTaps to System Manager.
Once you have added an iTap, you can configure, modify, and delete it from the
system.
To add an iTap to the system:
1. Select the Group to which you want to add an iTap by clicking the group bar.
2. Click New iTap in the toolbar as shown in Figure 29. The New iTap dialog box
appears as shown in Figure 30.
Figure 29: Adding a New iTap
33
iTap GigaBit Dual Port Aggregator
Figure 30: New iTap
2. Enter a name for the iTap you are adding in the iTap Name text box. Each iTap
Name in the system must be unique.
3. Enter the IP address of the iTap in the IP Address text box. Make sure the IP
address is unique on the network.
4. Select your model of the iTap from the Product drop-down list.
5. Enter any relevant information about the iTap in the Notes text box.
6. Check your settings and click Create. The System Manger now shows the iTap
in the system similar to Figure 31.
34
iTap GigaBit Dual Port Aggregator
Figure 31: Net Optics System Manager with iTap
The indicator to the right of the iTap picture blinks green when System
Manager is communicating with the iTap. If the indicator blinks red, check that
the iTap is connected to the network and verify the configuration information.
7. Repeat Steps 1-6 for each iTap you are adding.
Tip! _____________________________________________________________________
To change the order in which iTaps appear in the System Frame, click and drag
iTaps into the desired order.
__________________________________________________________________________
35
iTap GigaBit Dual Port Aggregator
Deleting an iTap
You can delete an iTap from System Manager when you remove an iTap from your
network. If you have removed an iTap from the network, System Manager continues to poll the iTap’s IP address for data until you delete the iTap from System
Manager.
To delete an iTap from System Manager:
1. Select the iTap you want to delete by clicking its icon.
2. Click Delete in the toolbar. A confirmation dialog box appears.
Figure 32: Delete Confirmation
3. Click Yes to delete the iTap from System Manager.
36
iTap GigaBit Dual Port Aggregator
Configuring an iTap
You can set configuration parameters of an iTap in the system from the Configure
tab.
To configure the iTap:
1. Click on the icon of the iTap you want to configure and click the Configure tab
as shown in Figure 33.
Figure 33: iTap Configure Tab
2. For the parameter you wish to configure, click on the corresponding value field.
3. Select an option from the drop-down list or enter a new value from your
keyboard.
4. The new configuration parameters take effect next time System Manager polls
the iTap.
37
iTap GigaBit Dual Port Aggregator
Viewing iTap Information
System Manager allows you to view the status of the iTap, traffic statistics collected by the iTap, and the current iTap configuration information.
To view iTap information:
1. Click the image of the iTap you want to view in the System Frame. A window
similar to Figure 34 appears.
Figure 34: iTap Status Tab
38
iTap GigaBit Dual Port Aggregator
The Status tab is a read-only list of information from the iTap. Use the scroll bar
and arrows to view the entire list.
TIP! _____________________________________________________________________
Fields that have been updated since the last refresh appear with a circle and arrow
just to the left of the value field.
__________________________________________________________________________
To shorten the list by port, click the View type drop-down list as shown in Figure
35 and select the port you want to view.
Figure 35: View Type List
39
iTap GigaBit Dual Port Aggregator
Modifying an iTap
You can change the IP address and other basic iTap configuration parameters
from the Modify iTap dialog box.
To modify the iTap configuration:
1. Click on the image of the iTap you want to change in the System Frame.
2. Click Modify in the toolbar. The Modify iTap dialog box appears as shown in
Figure 36.
Figure 36: Modify iTap
3. Make the desired changes and click Save Change.
40
iTap GigaBit Dual Port Aggregator
Appendix A
Specifications and Models
Specifications
Electrical
Power Supply Input
100-240VAC, 0.5A, 47-63Hz
Power Supply Output
12V, 1.5A
Environmental
Operating Temperature
0˚C to 55˚C
Storage Temperature
-10˚C to 70˚C
Relative Humidity
10% min, 95% max, non-condensing
Mechanical
Dimensions
1.3125” high x 12” deep x 8.75” wide
96542iTP Connectors
(1) DB9 (RS232 configuration port)
(1) RJ45 (management port)
(2) LC (monitoring ports)
(2) LC (network ports)
96547iTP Connectors
(1) DB9 (RS232 configuration port)
(1) RJ45 (management port)
(2) RJ45 (monitoring ports)
(2) RJ45 (network ports)
Indicators
(1) 2x16 Character LCD
(3) Link LEDs 96542iTP, (8) Link LEDs 96547iTP
(2) Threshold Alarm LEDs
(2) Power LEDS
41
iTap GigaBit Dual Port Aggregator
Optical Interface (96542iTP)
Fiber Type
Corning Multimode 62.5/125μm, wavelength 850nm
Split Ratio
Network Port Insertion Loss
Monitor Port Insertion Loss
70/30
≤ 2.4 dB
≤ 6.3 dB
60/40
≤ 3.1 dB
≤ 5.1 dB
50/50
≤ 4.5 dB
≤ 4.5 dB
Transceiver Specifications
GigaBit SX 850nm, VCSEL, supports 62.5/125μm
Monitor Port Output Power
-9.5 dBm
Split Ratios
70/30, 60/40, and 50/50
Copper Interface (96547iTP)
Copper Cable Type:
22-24 AWG Unshielded twisted pair cable, CAT5/CAT5e
Link Distance Supported:
100 meters
Memory
256MB buffer memory
Software
iTap Command Line Interface
Any terminal emulation software
Web Manager
Any browser
Net Optics System Manager
Windows 98, Windows 2000, Windows XP
WiFi
Standard
Conforms to IEEE 802.11b, 11 Mbps
Range (typical)
Indoors: 50 feet
Outdoors: 100 feet
42
iTap GigaBit Dual Port Aggregator
Available Models
Models
96542iTP iTap GigaBit Fiber Dual Port Aggregator
96547iTP iTap GigaBit Copper Dual Port Aggregator
Wireless Option
Accessories
RK-iTP2 Two slot rack-mount panel
43
iTap GigaBit Dual Port Aggregator
Appendix B
Command Line Interface
Command
Sub-Command
Syntax
Description
Help
Set
help set
Displays the set command
options.
Reset
help reset
Displays the reset command
options.
Show
help show
Displays the show command
options.
Echo
help echo
Displays the echo command
options.
Display
help display
Displays the display command options.
IP
set ip <address>
Where <address> is the ip
address of the iTap.
Netmask
set netmask
<address>
Where <address> is the ip
address netmask.
Gateway
set gateway
<address>
Where <address> is the ip
address of the gateway.
Manager
set manager
<address>
Where <address> is the
ip address of the remote
manager.
Parameter Port
set parameter port
<port ID>
<parameter>
Where <port ID> is A, B, C,
or D and <parameter> is
0 = GigaBit (other variables
not applicable).
Threshold Port
set threshold
<port ID>
<parameter>
Where <port ID> is A or B
and <parameter> is 0 to
100% of available bandwidth.
Time
set time
<date & time>
Where <date & time> is
mm/dd/yyyy-hh:mm:ss.
Username
set username
<username>
Where <username> is the
authorized user's name, 8
characters or less.
Password
set password
<password>
Where <password> is the
authorized user's password,
8 characters or less.
Set
44
iTap GigaBit Dual Port Aggregator
Command
Sub-Command
Syntax
Description
Reset
Peak
reset peak
<port ID>
Where <port ID> is A or B.
Statistics
reset statistics port
<port ID>
Where <port ID> is A or B.
Storage
reset storage
Resets configuation to factory defaults.
Set
show set
Displays currents settings.
Status
show status
Displays iTap status.
Statistics
show statistics
<port ID>
Where <port ID> is A or B.
Show
Power
show power
Displays power status.
Display
show display
Displays the display setting.
Display OFF disables remote
interfaces and front panel
LCD.
User
show user
Displays current user logged
into the CLI.
Echo
n/a
echo <on/off>
Echo off stops typed character from being displayed on
the screen.
Display
n/a
display
Toggles the front panel
display and remote interface
on and off.
45
iTap GigaBit Dual Port Aggregator
Notes:
46
www.netoptics.com
© 2006 by Net Optics, Inc. All Rights Reserved.