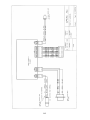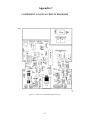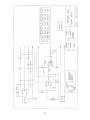
1
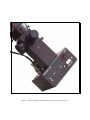
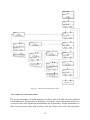
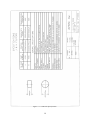
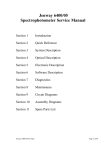
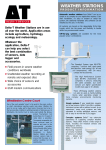
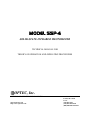
MODEL SSP-4 SOLID-STATE INFRARED PHOTOMETER TECHNICAL MANUAL FOR THEORY OF OPERATION AND OPERATING PROCEDURES OPTEC, Inc. OPTICAL AND ELECTRONIC PRODUCTS [email protected] http://www.optecinc.com 199 Smith St. Lowell, MI 49331 U.S.A. (616) 897-9351 (616) 897-8229 FAX (888) 488-0381 Toll-Free Figure 1-1. SSP-4 Solid-State Infrared Photometer shown with TCF-S Focuser. TABLE OF CONTENTS Revision 1 – June 2010 Section 1.0 2.0 3.0 4.0 5.0 6.0 7.0 INTRODUCTION . . . . . . . . . . . . . . . . . . . . . . . . . . . . . . . . . . . . . . . . . . . . . . Page 1 THEORY OF OPERATION. . . . . . . . . . . . . . . . . . . . . . . . . . . . . . . . . . . . . . . 2.1 Basic Physical Characteristics . . . . . . . . . . . . . . . . . . . . . . . . . . . . . . . . 2.2 The Detector. . . . . . . . . . . . . . . . . . . . . . . . . . . . . . . . . . . . . . . . . . . . . . 2.3 Detector/Electrometer Design . . . . . . . . . . . . . . . . . . . . . . . . . . . . . . . . 4 4 5 5 2.4 Signal Processing . . . . . . . . . . . . . . . . . . . . . . . . . . . . . . . . . . . . . . . . . . ... OPERATING PROCEDURE . . . . . . . . . . . . . . . . . . . . . . . . . . . . . . . . . . . . . . 3.1 Check-Out List . . . . . . . . . . . . . . . . . . . . . . . . . . . . . . . . . . . . . . . . . . . . 3.2 Using the Photometer . . . . . . . . . . . . . . . . . . . . . . . . . . . . . . . . . . . . . . . 3.3 The 2-Button Interface . . . . . . . . . . . . . . . . . . . . . . . . . . . . . . . . . . . . . . .... 3.4 .Calibration and Adjustments . . . . . . . . . . . . . . . . . . . . . . . . . . . . . . . . . 6 PC SERIAL INTERFACE AND COMMANDS . . . . . . . . . . . . . . . . . . . . . . . .4.1 . . . . .PC . (RS-232) Serial Communications . . . . . . . . . . . . . . . . . . . . . . . . . . 12 12 4.2 4.3 Connecting the SSP-4 to the PC . . . . . . . . . . . . . . . . . . . . . . . . . . . . . . . Communications Protocol . . . . . . . . . . . . . . . . . . . . . . . . . . . . . . . . . . . 12 12 TROUBLE-SHOOTING GUIDE . . . . . . . . . . . . . . . . . . . . . . . . . . . . . . . . . . . .......... SPECIFICATIONS . . . . . . . . . . . . . . . . . . . . . . . . . . . . . . . . . . . . . . . . . . . . . . . J & H FILTERS . . . . . . . . . . . . . . . . . . . . . . . . . . . . . . . . . . . . . . . . . . . . . . . . 16 8 8 8 9 9 18 19 APPENDICES A A-1 B InGaAs Photodiode . . . . . . . . . . . . . . . . . . . . . . . . . . . . . . . . . . . . . . . . . . . .Wiring Diagram . . . . . . . . . . . . . . . . . . . . . . . . . . . . . . . . . . . . . . . . . . . . . . C Component Layout & Circuit Diagrams . . . . . . . . . . . . . . . . . . . . . . . . . . . C-1 D Sample Data Entry Form . . . . . . . . . . . . . . . . . . . . . . . . . . . . . . . . . . . . . . . D-1 i B-1 LIST OF FIGURES Figure 1-1 Page cover 1-2 SSP-4 Solid-State Infrared Photometer with TCF-S focuser . . . . . . . . . . . . .SSP-4 . . . . .System . . . . Components . . . . . . . . . . . . . . . . . . . . . . . . . . . . . . . . . . . . . 2-1 Cross-sectional view of the SSP-4 . . . . . . . . . . . . . . . . . . . . . . . . . . . . . . . . 3 2-2 6 2-3 Detector/Electrometer Circuit . . . . . . . . . . . . . . . . . . . . . . . . . . . . . . . . . . . .Functional Signal Processing Diagram . . . . . . . . . . . . . . . . . . . . . . . . . . . . 2-4 Sensitivity of SSP-4 with 10” Telescope . . . . . . . . . . . . . . . . . . . . . . . . . . . 8 3-1 Front Panel Controls . . . . . . . . . . . . . . . . . . . . . . . . . . . . . . . . . . . . . . . . . . 9 3-2 2-Button Interface Flow Diagram . . . . . . . . . . . . . . . . . . . . . . . . . . . . . . . . . J & H Filter Specifications . . . . . . . . . . . . . . . . . . . . . . . . . . . . . . . . . . . . . .. 11 7-1 2 7 20 LIST OF TABLES Table 2-1 Page 4-1 Physical and Electrical Characteristics of the Model G5851-203 . . . . . . . . . .Enter . . . . SSP-4 . . . . . .Serial . Command . . . . . . . . . . . . . . . . . . . . . . . . . . . . . . . . . . . . 14 4-2 .Set Gain Command . . . . . . . . . . . . . . . . . . . . . . . . . . . . . . . . . . . . . . . . . . . . 14 4-3 Set Integration Time Command . . . . . . . . . . . . . . . . . . . . . . . . . . . . . . . . . . .Start Count Command . . . . . . . . . . . . . . . . . . . . . . . . . . . . . . . . . . . . . . . . . . 15 Select Detector Temperature Command . . . . . . . . . . . . . . . . . . . . . . . . . . . . .Get . . .Detector . . . . . . . Temperature Command . . . . . . . . . . . . . . . . . . . . . . . . . . . . . . 16 Exit Serial Mode Command . . . . . . . . . . . . . . . . . . . . . . . . . . . . . . . . . . . . . . 16 4-4 4-5 4-6 4-7 ii 5 15 16 SECTION 1.0 INTRODUCTION – a personal history by Gerald Persha The SSP-4 IR photometer has a long history at Optec. In 1984 a prototype unit was first designed and constructed using an uncooled Lead-Sulfide photoconductive cell from Hamamatsu. The system used a chopper to stabilize the temperature drift and allow for long integration times. Considering the available electronics and IR detectors at the time, this instrument held much promise for small observatories attempting JHK photometry. The prototype instrument was first demonstrated to an interested group of astronomers and amateurs on the night of August 17, 1984 at the James C. Veen Observatory. The event was the culmination of a symposium on “Near-IR and Solid-State Photometry” hosted by Russell Genet and myself as part of the I.A.P.P.P. organizational and educational efforts. The name of the observed star escapes me but a signal was detected to the amazement and joy of all in attendance. Unfortunately, the joy was short lived as the arm flailing of my soon to be ex-wife knocked a can of coke into the electronic works of the instrument bringing the demonstration to a sticky and bitter end. Events in the development of new computer controlled telescopes, photometers and visibility related instruments directed the efforts of Optec into other areas for the rest of 80s and 90s and the SSP-4 was shelved. Since Optec had already developed the models SSP-1, 2 and 3 photometers, it was natural to name this instrument the SSP-4. The SSP-5 and 7 were years away from development and the defunct SSP-6 is a story for another time. Since 1984, the SSP-4 project notebook and prototype remains had sat undisturbed on a crypt-like shelf at Optec. Seventeen years later in August of 2001, I received a communication from Dr. Douglas West about his desire to have an IR photometer manufactured. At first I dismissed it but his persistence, knowledge of new detectors pertaining to the subject and this lingering unfinished business in my life made me reconsider this photometer. Through his efforts in organizing a serious group of astronomers both amateur and professional, a new and improved SSP-4 photometer was proposed and designed using new technology and detectors. The relatively new InGaAs PIN photodiodes on the market were designed for the fiber optics communication market and have reached very high performance levels compared to the IR detectors of 1984. It is now possible to build an IR photometer, which will allow a great many stars to be observed accurately in the J (1250nm) and H (1650nm) bands. Unfortunately however, the characteristics of the detector material do not allow the K band at 2200nm to be observed. Without the hindrance from my ex-wife, the new SSP-4 was developed, tested, and finally brought to market. The sequence of SSPs is nearly complete. Enjoy. 1 Fig. 1-2. SSP-4 System Components 2 Fig. 2-1. Cross-sectional view of the SSP-4 3 SECTION 2.0 THEORY OF OPERATION 2.1 BASIC PHYSICAL CHARACTERISTICS Figure 2-1 shows a cross-sectional view of the SSP-4 photometer. Light enters the photometer through the 1.25-inch telescope adapter and is directed either to the focusing eyepiece or the detector by means of a flip-mirror. The focusing eyepiece consists of a 1-inch focal length Ramsden type optic and a reticule with a precisely scribed ring that defines the detector field of view. A green LED illuminates the reticule from the side. A reticule diameter of 0.3mm is standard for the instrument but a 1.0mm is available for the optional 1.0mm detector. After a star is centered in the ring, the flip mirror is rotated to expose the detector. It is important to note that, unlike a photo multiplier system, the image of the star falls on the detector plane; a Fabry lens is not used. A two-position filter slider is mounted between the flip mirror and the detector. Any pair of filters selected by the user before delivery can be mounted in the slider. Since the slider is easily pulled out of the unit, sliders with other combinations of filters can be inserted. For most variable star work, a single slider with J and H filters is recommended. Because of the wide and deep atmospheric absorption bands that lie within the spectral sensitivity of this detector, observing without a filter in place is not recommended. The detector and electrometer are rigidly mounted behind the filter slider on an X-Y adjustable dovetail bracket. Accurate alignment of this bracket on an optical bench insures that the sensitive area of the detector matches the stellar field as defined by the reticule in the focusing eyepiece. Detector diameters of 0.3 and 1.0 mm are available with the 0.3 mm size considered best for most telescopes with focal lengths in the range of 50 to 150 inches. 9 The electrometer amplifies the current from the photodiode by a factor of 1 x 10 and is analogous to the operation of a photo multiplier tube. From the electrometer amplifier, the signal is then routed to the voltage-to-frequency converter for final processing into counts based on a 1, 5, 10 or 30 second gate time interval. The resulting count is then read from the four-digit readout on the front panel. Under PC control using SSP4DATA.EXE nearly any integration time can be chosen with 0.01 second resolution from 1 to 60 seconds. Control of the instrument is possible either through the front panel two-button interface with output shown on a 4-character display or through a serial connection to a PC running our SSP4DATA.EXE interface program. Most all functions of the instrument are accessible with the two-button interface so that observations can be made with only a data logging pad and pencil. 4 2.2 THE DETECTOR The detector used in the SSP-4 is a model G5851 manufactured by Hamamatsu Corporation. This unit can be classified as an InGaAs-PIN photodiode, which offers the highest possible shunt resistance value (Rs) resulting in a very low noise current when used in the photovoltaic mode. See Appendix A for complete description of this detector. The detector is normally operated in a cooled state down to –40 C using a two stage thermoelectrically Peltier cooler. This decreases thermal noise from the detector and increases shunt resistance, which reduces the noise voltage contribution from the preamp from swamping the total noise budget. At room temperature the shunt resistance is under 1M and over 200M at -40 C. The operating temperature is made stable by a feedback system using an integrated thermistor mounted within the detector package. Size Active Diameter Spectral Range Peak Response Normal Operating Temp. Shunt Resistance Noise Equivalent Power TO-8 can 0.30 mm, 1.00mm optional 900 to 2050 nm 1.2 A/W at 1950 nm -35 C >0.2 G at -35 C -14 2x10 W/ Hz at -35 C Table 2-1. Physical and Electrical Characteristics of the Model G5851-203 2.3 DETECTOR/ELECTROMETER DESIGN The detector/electrometer circuit is the heart of the SSP-4 photometer and its design is a matter of optimizing both key elements as a single working unit. Figure 2-2 shows the basic current-to-voltage amplifier configuration used in the SSP-4. Photocurrent from the detector is balanced by an equal current in the feedback resistor, but flowing in the opposite direction so that the inverting input is kept near zero potential. The output voltage is thus: Eout = - Rf x Is 9 where Rf is the feedback resistance and, in the case of the SSP-4, is equal to 1 G ohm (1 x 10 ). The photocurrent from the photodiode is Is. 5 Of course, the gain stability of this circuit is highly dependent on the resistance stability of the feedback resistor. Fluctuations of its value due to temperature changes could cause gain errors during observations, which are especially objectionable when all-sky photometry is done. The special resistor used has a temperature coefficient of 200 ppm/°C which is extremely low for a resistor of its size and Figure 2-2. Detector/Electrometer Circuit rating. Thus, a 20°C drop in temperature during the night, which is not uncommon, would cause a 0.004 magnitude error in electrometer gain. Even though this error source can be safely ignored, temperature effects on the responsivity of the detector and passbands of the filters also have to be considered when extreme temperature changes do occur. At the center of the H band (1650nm), the detector responsivity is close to 1 A/W (amp/watt) of incident power. Thus, the output voltage from the preamp is equal to Eout = P * 1x10⁹ V/W where P is the incident power on the detector in watts. Of course, the maximum output from the electrometer is limited to its power supply rail of about 2.7 volts. Since extremely small currents are amplified, surface leakage currents may affect the overall accuracy of the detector/electrometer circuit. To protect against this, the finished circuit is baked at an elevated temperature in a vacuum dessicator for several days before it is heavily coated with a silicon sealant that has a very high bulk resistance. During the cure time, which also may last several days, the finished circuit is stored in a vacuum dessicator until mounted in the SSP-4. 2.4 SIGNAL PROCESSING The voltage signal from the electrometer amplifier is processed by the voltage-to-frequency converter to a frequency that is directly proportional to the input voltage. It is extremely 6 linear, resulting in laboratory measured correlation coefficient using a least squares regression of r = 0.99995. There is an offset adjustment on the front control panel that allows the user to select the output count for zero input light or dark count. It is important to set this to a positive count of around five a gain setting of 1 and a 1 second integration time. This insures that if the electrometer amplifier drifts slightly, the dark count will still be above 0. If the offset drifts to a negative value, a reading of the dark count will show nothing on the display - the display will be dark. The gain of the voltage-to-frequency converter has three selectable settings of 1, 10 and 100. Based on a selected gain of 10, the output frequency of the voltage-to-frequency converter is equal to Fout = Eout * 3x10⁴ Hz/V where Eout is the output voltage from the electrometer stage. The maximum output frequency is about 15KHz before saturation . Figure 2.3 shows a functional diagram of the signal processing circuit and Figure 2.4 shows the placement of the front panel controls. Figure 2-3. Signal Processing Diagram 7 SECTION 3.0 OPERATING PROCEDURE 3.1 CHECK-OUT LIST Remove the filter slider and clean filters, if necessary, with a cotton swab dipped in alcohol or lens cleaning fluid. Do NOT rub hard. Before taking readings, turn the photometer on and allow at least 10 minutes warm-up time at observatory temperature. The green TEMP LED will light up in approximately 1 minute after the unit is turned on. This indicates that the detector is at the default operating temperature of -25 C. It is suggested that the operating temperature be changed to at least -35 C or -40 C if a cooler ambient temperature condition will allow it. See Figure 3-1. Figure 3-1. Front Panel Controls When powered up, the SSP-4 is waiting to connect to the PC running SSP4DATA.EXE or another interface program using a serial interface. In this state, the integration time is set to 0.001 second so that any characters sent on the serial interface to the SSP-4 will not lost. In order to use the photometer manually, the integration (INTG) time needs to be set to 1, 5, 10 or 30 seconds using the 2-Button interface. See Section 3.3. After warm-up, observe that the count with the mirror down (no light on detector) is within the range of 3 to 7 with GAIN and INTG set at 1. If reading is not within this range, adjust the offset pot with a small screwdriver until the correct reading is obtained. 8 Light energy from any observatory red light will be a serious source of error for this photometer. Tungsten lamps are a rich source of IR in the spectral band that this instrument is most sensitive to. Even interior observatory surfaces which are dimly illuminated by the red light and near the front of the telescope will affect the reading substantially. What might appear as a good black paint in the visible spectrum may appear gloss white in the J and H bands. Before taking any readings with the SSP-4, it is recommended that the user experiment with the illumination in the observatory to gauge the effect it has on the count. Tungsten lamps with a thick heat absorbing filter or florescent lamps with a red filter are suggested for use as night-lights around the telescope. Red LEDS would also be a good choice since they have no IR emissions. One other note based on experience, the use of black vinyl electrical tape to provide a light seal is an exercise in futility. Aluminum foil duct tape is best for sealing any light leaks. 3.2 USING THE PHOTOMETER With the mirror down, site the star or sky region in the center of the reticule. After confirming that the telescope is tracking properly, carefully flip the mirror up and record the readings. To take a star or sky brightness measurement, three consecutive readings of 10 seconds integration time (INTG set for 10) each are normally taken. Always ignore the first reading since the mirror can never be flipped up exactly at the beginning of a new 10-second cycle. After seeing the first count displayed, record the next three. After the reading sequence is completed, return the mirror to the viewing position and confirm that the star is still centered properly in the reticule. Normally, if the star is within a circle of 0.35 radius of the scribed ring center, the detector has collected more than 99% of the star’s light. This rule of thumb does depend on seeing quality. At this point, the user has successfully completed making a reading and is referred to other sources of information about stellar photometry. 3.3 THE 2-BUTTON INTERFACE Integration time, voltage-to-frequency gain and detector operating temperature can be selected using the 2-button control. In order to get to the menu of selections, hold down the MODE key until “STOP” is displayed. If the photometer is in the process of taking a count with a long integration time, it will be necessary to hold down the key until the end of the process. “STOP” is displayed for 1 second and replaced by a “Y N” over the SELECT and MODE buttons. If no action is taken for 5 seconds or the MODE key is pressed, the program is returned to the normal operating loop and a new count is initiated. If the SELECT key is pressed, the program is put into the menu routine. See figure 3-2 for a guide to navigate the flow chart of all possible selections. 9 Figure 3-2. 2-Button Control Menu Flow Chart 3.4 CALIBRATION AND ADJUSTMENTS For precise determination of stellar magnitude, the filters used in the SSP-4 must be calibrated with standard stars. The procedure for doing this is beyond the scope of this manual and the user is referred to the IAPPP organization and standard texts on photometry. Simple determination of filter correction factors can be made by using a close pair of stars with a wide color temperature 10 difference. This method is used by many members of the IAPPP and is recommended for novice users. The reticule and detector are critically aligned at the factory and the user should make no adjustment. If the eyepiece is removed from its mount it may be necessary to realign the detector that will probably have to be done at Optec. If dust on the reticule is troublesome, remove it by blowing air (canned air for camera cleaning is suggested) through the 1.25-inch snout. If the reticule ring needs to be adjusted in brightness, the circuit board mounted potentiometer located on the bottom right corner of the main circuit board can be adjusted. Use a small screwdriver to turn the control CCW to brighten the reticule or CW to dim it. 11 SECTION 4.0 PC SERIAL INTERFACE AND COMMANDS 4.1 PC (RS-232) SERIAL COMMUNICATIONS The SSP-4 provides a serial communications feature as standard for this model. Using simple ASCII commands, the SSP-4 can be commanded to select gain, integration time, detector operating temperature and report the count. The RS-232 interface operates at 19.2 K baud with 8 data bits, one stop bit and no parity. Optec has developed a user interface program called SSP4DATA.EXE that can control the instrument and record data in standard text format using the serial link. This program is supplied with the SSP-4 and instructions for its use can be found in the HELP file on the distribution disk. The latest version of SSP4Dataq can be downloaded from the Optec web site at: www.optecinc.com. Look for the Software Download link on the SSP-4 pages. 4.2 CONNECTING THE SSP-4 TO THE PC For the physical wiring connection between the PC and the SSP-4, a DB-9 female/female null modem cable is suggested. These are commonly available from most PC accessory suppliers or from Optec (Stk. No. 17154, 10 foot cable). The RS-232 implementation used with the SSP-4 is a simple 3-line interface using RX, TX, and GND. 4.3 COMMUNICATIONS PROTOCOL The remote PC communication program should be set for 19.2 K baud rate with 8 data bits, 1 stop bit, and no parity (8N1). The SSP-4 is preset for these values and will not respond to other settings and cannot be changed. Be sure to set the baud rate to 19.2K BAUD before attempting communication with the SSP-4. Tables 4-1 through 4-7 below describe in detail the commands used to control and communicate with the SSP-4. To establish communications a SSTART command must be sent along the serial line to the SSP-4. This command should consist of the ASCII serial string “SSTART” (without the quotes). If a partial command string is received, the SSP-4 microcontroller will timeout after only a few milliseconds and may not parse the entire command string properly. Once the SSTART command has been received and accepted by the SSP-4, a return character of “!” (followed by a CR/LF) will be sent back to the PC communications program. None of the other commands will work before the SSTART command has properly initialized the serial connection. 12 Command Return SSTART ! CR LF Function: This command initializes the serial connection between the PC and the SSP-4. SSTART causes the SSP-4 program to enter into the main serial loop which checks for additional inputs along the serial interface. A successful return from this command (!) is required before the SSP-4 will accept any other user commands. Warning: If “!” is not returned repeat SSTART. There is a possibility that the command will timeout. The INTG setting for the instrument must be PC for serial control to be enabled. Table 4-1. Enter SSP-4 Serial Mode Command. Command Return SGAINx none Function: This command sets the gain of the voltage-to-frequency converter. The value of x is either 1 for a gain of 100X, 2 for 10X or 3 for 1X gain. Warning: No values for x other than 1, 2 or 3 are acceptable. Table 4-2. Set Gain Command. 13 Command Return SIwxyz none Function: This command sets the integration time for acquiring a count from the voltage-tofrequency converter. The four-digit integer value of wxyz is equal to the total integration time in units of 0.01 seconds. Thus, a value of 0100 will set the integration time to 1.00 seconds. Warning: Values less than 0100 (1.00 seconds) are of limited value because the rise time and noise of the system electronics demand longer integrations. The maximum count that can be retained is 2 bytes wide (216), which will limit long integration times. Table 4-3. Set Integration Time Command. Command Return SCOUNT C=vwxyz CR LF Function: This command starts an integration for the selected integration time and gain settings. The vwxyz output value is the integer count. The left side of the value is padded with zeros so that a five-character value is always sent. Thus, a count of 100 is sent as C=00100 CR LF. Warning: The maximum value that can be sent is two bytes wide or 65536 decimal. During the integration time, the SSP-4 will not accept any serial inputs. Table 4-4. Start Count Command 14 Command Return STEMxy none Function: This command sets the detector operating temperature in degrees celsius below 0. Thus, a xy value of 05 will set the detector to -5 C. Warning: Only integer values from 00 to 40 are acceptable. Table 4-5. Select Detector Temperature Command Return SFTEMP F=xy.z CR LF Function: This command gets the detector operating temperature in degrees centigrade below 0 and sends it on the serial interface. Resolution is approximately 0.2 C based on the 8-bit A/D conversion algorithm. Thus, an output value of F=35.4 CR LF is an operating detector temperature of -35.4 C. Warning: Only values from 00.0 to 44.9 are reported. Table 4-6. Get Detector Temperature Command Command Return SEXITn “END” CR LF Function: This command exits the serial mode and returns control of the instrument to the 2button interface. The value of padding character n can be anything. Table 4-7. Exit Serial Mode Command 15 SECTION 5.0 TROUBLE-SHOOTING GUIDE The following common problems and solutions have been collected over the years from our customers and our attempts to solve their instrument problems. Before calling us, read through these and relevant sections of this manual to see if an easy solution exist for your errant photometer. 1) Unit has been turned on and left to warm up for the proper time but no display is seen unless light is incident on the detector. With a small screwdriver adjust the offset control pot on the front panel. (See Figure 2-7.) With no light incident on the detector, rotate the control pot CCW for at least 20 turns to make sure a display value is seen and then rotate CW until a count of 5 is obtained with the GAIN and TIME set for 1. 2) The dark count (no light on the detector) appears to drift with time and temperature beyond what you have been accustomed to. This could be a serious problem if the drift is due to a break in the moisture seal protecting the detector/electrometer assembly. The unit should always be kept in a dry and warm environment when not used. Place the unit in a sealed container with about 4 ounces of activated desiccant for a period of 48 hours. If desiccant is not available, use a 100watt spotlight placed about 2 feet from the unit for a similar length of time. Allow the unit to come to ambient temperature before measuring the drift. If the problem does not disappear or reduce to acceptable levels, it will have to be returned to Optec for repair. 3) The unit appears to give much higher than expected counts every once in a while. If the unit is powered by the adapter, any surge in the power line may cause an increase in the number of counts for the integration interval. Refrigerator, compressors, dome motors, and telescope position servos could easily be the cause of this problem. Vibration and strong radio signals may also be the cause of the problem. 4) The night appears clear but the star count is diminishing with time faster than expected due to changing extinction conditions. A common problem especially with Celestron and Meade telescopes is that a nearly invisible film of condensed water will develop on the corrector plate or main mirror during the night if the dew point is high enough. Usually this fog film can only be seen when a strong light is projected down the front of the telescope and the optics carefully inspected. A hair dryer is the only cure. "Dew-zappers", low wattage heaters designed to fit over the front cell, are now commonly available to avoid this condensation problem. 5) As the star approaches the edge of the detector the count begins to fall but it looks as if the star is still completely within the ring as seen in the eyepiece. The stellar light profile (energy vs. radius from the center of the star) is much larger than what is seen. On a good night a seeing disk could appear to be about 2 arc-second in diameter. However, to capture over 99% of the energy a detector diameter (field aperture) of over 20 arc seconds is needed. A hazy night or a night with much greater turbulence could increase the stellar profile many more times. Thus, care must be taken to keep the star from drifting near the edge of the detector since some of the incident energy will be lost. 16 SECTION 6.0 SPECIFICATIONS DETECTOR (G5851-203) Type NEP InGaAs PIN-photodiode -14 2x10 W/ Hz (typical) at –35 C 0.3mm diameter (1.0mm diameter optional) 900 to 1850nm >0.2G (typical) at –35 C 1.2 A/W at 1750 nm Detector Size Spectral Range (5% points) Shunt Resistance Peak Response ELECTROMETER (AD8552) Type Bias Current Offset Voltage Open Loop Gain Closed Loop Gain (Rf) Current-to-Voltage 10 pA typical 1 V typical 120db Min. 9 1x10 0.32 µV(p-p) (0 to 1Hz) 2 f /Hz1/2 (10Hz) 2.7 V Input Voltage Noise Input Current Noise Maximum Output Voltage A/D CONVERTER (LM231) Type Full Scale Frequency Full Scale Input Voltages Voltage-to-Frequency 10 Khz -33 mV (100 SCALE) -330 mV(10 SCALE) -3.3V (1 SCALE give a 8KHz maximum output) <0.3% <.5mV (adjustable to 0) Linearity Offset MICROCONTROLLER Type EPROM RAM I/O Lines 8-bit A/D Operating Temperature PIC16C73B-20I/SP 4K x 14 192 x 8 22 5-Ch -40 to +80 C POWER SUPPLY Type Output Input Output Connector Switching +5V DC, 3A regulated 100-120 VAC, 50-60 Hz, 0.4A 2.1mm Power Plug, 6’ cord EYEPIECE Focal Length Type Reticule Illumination Field of View (80 inch FL) 25 mm Ramsden Green LED 0.4 degrees MECHANICAL Body Material Finish Overall Length Weight Telescope Coupler Aluminum 6061-T6 alloy Bright Dip Black Anodized 9 inches (tip to tip) 2 lbs. 14 oz. 1.25 inch (standard) 17 SECTION 7.0 J & H FILTERS 18 Figure 7-1. J & H Filter Specifications. 19 Appendix A InGaAs PHOTODIODE A-1 A-2 A-3 A-4 A-5 Appendix B WIRING DIAGRAM B-1 B-2 Appendix C COMPONENT LAYOUT & CIRCUIT DIAGRAMS Figure C-1. SSP-4 Circuit Board Component Layout. C-1 C-2 C-3 Appendix D SAMPLE DATA ENTRY FORM The sample report form printed on the next page is useful for recording data when using the differential photometry technique. Basically, this method is to compare the brightness of the variable star to that of a nearby comparison star, which is known to have no variability. No attempt is made here to educate the user in all aspects of proper observing procedure and the associated data reduction. A number of texts about astronomical photometry are available which describe the proper methodology. Figure D-1 shows a sample observing report for the night of September 18-19, 2001. VAR..___NOVA__________________ DOUBLE DATE ___MARCH 14-15, 2002__ COMP.____ HD 182618________________ PAGE ______ OF ______ OBSERVER __J.P. ____________________ ___________________________________________ TELESCOPE ___MEADE 10” f/10 LX-200_____ ____________________ CONDITIONS_____GOOD_____________________ ___________________________________________ ___________________________________ __ ________________ UT STAR FILTER SCALE TIME 1::21 COMP J 10 10 1:24 NOVA J 10 10 1.:29 COMP J 10 10 NOTES ______________________________ _____________________________________ _____________________________________ COUNT SKY 894 891 594 509 507 510 881 880 877 . . . 402 402 401 Figure D-1. Sample Data Entry Using the Report Form. D-1 COMMENTS VAR __________________________________ DOUBLE DATE _______________________ COMP._____________________________ VAR. ______________________________ PAGE ______ OF_______________________ OBSERVER____________________________ ___________________________ TELESCOPE___________________________ ___ CONDITIONS__________________________ NOTES________________________________ UT STAR FILTER SCALE TIME ______________________________________ ______________________________________ COUNT D-2 SKY COMMENTS