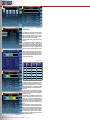
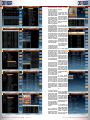
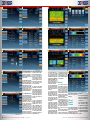
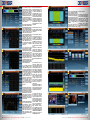
1
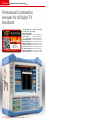
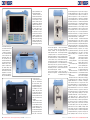
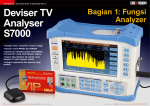
TEST REPORT
Multi Norm Digital TV Signal Analyzer
Deviser TV
Analyser
S7000
Part 1: Analyzer
Functions
•Very large, high resolution display
•Suitable for MPEG2 and MPEG4
•Real-time spectrum for quickly
identifying active transponders
•Can be remotely controlled via PC
or mobile phone
•Very ergonomical and practical
operation
18 TELE-audiovision International — The World‘s Largest Digital TV Trade Magazine — 09-10/2013 — www.TELE-audiovision.com
www.TELE-audiovision.com — 09-10/2013 — TELE-audiovision International — 全球发行量最大的数字电视杂志
19
TEST REPORT
Multi Norm Digital TV Signal Analyzer
Professional Combination
Analyzer for all Digital TV
Standards
09-10/2013
Deviser S7000
Best professional instrument
for measurement and analysis
of all globally used TV systems
www.TELE-audiovision.com/13/09/deviser
My expectations were
big when Deviser sent
their new flagship S7000
to us here at TELE-audiovision to be tested.
It‘s a signal analyzer
that can work with essentially all the different TV
standards: satellite DVBS/S2 signals, cable DVBC signals as well as all
the terrestrial standards
DVB-T/T2/H, ATSC, DTMB
signals and, believe it or
20 TELE-audiovision International — The World‘s Largest Digital TV Trade Magazine — 09-10/2013 — www.TELE-audiovision.com
not, even older analog
signals.
As is normal, I first use
the device to be tested for a
while without having to worry about the test report so
that I can simply gain some
experience with the unit.
But I also like to open up the
boxes as soon as they arrive
and play around with the devices without first reading
the user manual. It‘s simply
ously only available on a PC
with specialized software.
But that‘s not all. Do you
remember the TELE-audiovision issues from 12-01/2012
and 02-03/2012? In those
issues I described my idea
of implementing a waterfall
diagram to continuously display the spectrum for satellite signal analyzers. This
makes it possible to display
the spectrum over a specified time period so that, for
example, intermittent errors
could be identified. It also
makes it much easier to align
antennas, especially motorized dishes. Suffice it to say
that it‘s thrilling to find this
fun to do this but it also gives
you a feel of how easy it will
be to work with the unit.
But this time it was different: I was speechless when
I first saw the S7000. This
unbelievable analyzer can
not only handle your typical measurements like those
you‘d find in higher-end professional units, it also integrates a complete transport stream analyzer that
provides information on the
entire contents of a received
transponder. All of the parameters can be displayed this type of detail was previ-
that the entire signal analyzer could be completely
remotely controlled. This
makes it possible to remotely diagnose problems. You
simply place the analyzer at
the customer site and access
it via the internet. Or you
could climb on the roof with
your mobile phone while the
analyzer stays in the living
room. The Deviser S7000 is
overwhelming. Thus far we
have never had the opportunity to test such a complete
and feature-rich signal analyzer.
function in the S7000.
It also comes as no surprise that measurements
like Echo, Barscan, skew,
constellation diagrams, realtime spectrum analysis, etc.,
are available in this super
analyzer. Using the S7000
is child‘s play and the user
manual was only needed occasionally to make sure that
none of its functions were
overlooked.
Another surprise in these
tests came from the included
CD. The software on this CD
not only allowed the comfortable administration of
the channel and transponder
lists, logger files and screenshots, but we discovered
22 TELE-audiovision International — The World‘s Largest Digital TV Trade Magazine — 09-10/2013 — www.TELE-audiovision.com
Since a full encompassing
test report of this unbelievable signal analyzer would
be much longer than normal,
this report is divided into two
parts. The first part presents
a detailed introduction to the
Deviser S7000’s wide range
of functions. In the next issue of TELE-satellite we will
report on our actual test results where we thoroughly
tested the S7000 to our satisfaction.
Deviser was founded in
1990 and is located in Tianjin
in northeastern China, not
too far from Beijing. Deviser
develops signal analyzers for
TV and radio and is China’s
leader in this segment. Deviser is on the way to becoming an international force as
well. Deviser is the first Chinese signal analyzer manufacturer to receive ISO9001
certification. Deviser first appeared in TELE-audiovision
in the 06-07/2011 issue and
then again recently in the
07-08/2013 issue after they
moved into their brand new
production and office facility.
The Deviser TV Analyzer
S7000 reached our test center packed in a cardboard box
in which the actual product
package was packed. Inside
we found the sufficiently protected S7000 in a soft carrying case made out of durable
nylon. A removable box contained the following accessories:
• Charger (12V/5A)
• 12V car charger
• Carrying case replacement strap
• Two “F” adapters (malemale)
• GPS antenna with USB
interface
• Mini CD with user manual in PDF format and control
software
• Guarantee card
The analyzer’s TFT screen
is surprisingly large with a
diagonal measurement of 7
inches. Its size is similar to
that of Android tablets. The
analyzer is relatively lightweight and thanks to its rubber jacket it can be securely
held in your hands. At 3.4 Kg
(7.5 Lbs), longer workdays
are possible with the S7000.
The carrying case is very
handy. Unlike other analyzers, you won’t have the urge
to remove the case since,
despite providing protection for the analyzer, it still
allows access to all of the
unit’s buttons. Also practical is the ability to open the
case upwards into three segments. By folding the three
segments into a triangle, it
makes it easy to place the
analyzer in an inclined position on a table thus simplifying its use, especially if
you’re used to using analyzers that could only be laid flat
on the table or placed standing fully upright. In either
case the analyzer would be
hard to use and the screen
could not easily be viewed.
So, a serious plus to Deviser
for coming up with the idea
to place the analyzer in an
inclined position.
The front side of the S7000
pays tribute to Deviser’s
many years of experience
with professional signal analyzers. And it’s the ergonomics that stand out here in the
foreground; sure enough,
you’ll find your way around
very quickly. The already
mentioned 7” TFT screen
has a resolution of 800x480
pixels and is large enough to
clearly display all information. The days of switching
between different low-resolution screens just to view
all of the important parameters are over. To the left of
the centrally located screen
is a button to turn the unit
on and off. Below this button
are three LEDs that show the
status of the rechargeable
battery: battery is charging,
analyzer is switched on/off
and battery is discharged.
To the right of the screen
are six function buttons. The
function of these buttons is
shown in the corresponding spot on the screen next
to these buttons and varies
depending on what menu
screen is currently active.
Under the screen are an
additional three groups of
buttons: the group to the left
consists of six function buttons that can be accessed
at any time (TV, HOME, EXPLORER, CH INFO, SETUP
and SAVE), the central group
consists of an alphanumeric
keypad for frequency and
text entry using 12 but-
www.TELE-audiovision.com — 09-10/2013 — TELE-audiovision International — 全球发行量最大的数字电视杂志
23
tons and lastly the right-side
group of buttons includes
arrow buttons plus an OK
button for confirmation and
ESC and TAB buttons. The
relatively large number of
buttons actually simplifies
operation in that most of
the buttons only have a single function. There’s no unnecessary switching to go
through like there would be
with multi-function buttons.
Aside from that, we definitely
approve the ability to enter
frequencies directly.
On the top side of the
S7000 is the HF input in the
form of an “F” connector.
Two male-male “F” adapters are included in the package. Of course, other types
of connectors can be used
such as the type needed for
a typical CATV antenna jack.
Unfortunately, the required
connector adapters are not
included as accessories with
the S7000 although any
practicing technician would
already have these adapters.
On the left side of the an-
24 TELE-audiovision International — The World‘s Largest Digital TV Trade Magazine — 09-10/2013 — www.TELE-audiovision.com
alyzer is the outlet for the
cooling fan and the carrying case has a mesh cutout
in the same location so that
the analyzer can also be operated and even recharged
in its carrying case without
giving it a second thought.
These details are evidence of
Deviser’s attention to detail.
Additional connections can
be found on the right side of
the analyzer: a USB port for
the GPS antenna and USB
storage device, an RJ-45
port as well as a connection
for the power supply. Further
up is the HDMI jack so that
the display can also be routed to an external monitor;
this could be useful, for example, in a training environment. The carrying case has
the necessary Velcro flaps to
cover the inputs.
The rechargeable battery
can be swapped out by the
user and can be accessed
from the rear panel. There’s
also another highlight of
this professional analyzer:
an ASI input and output.
It’s very unusual yet excellent for measuring real professional systems. There’s
even a Common Interface
(CI) available and with the
proper CAM even encrypted
channels can be analyzed.
The built-in speaker is also
mounted on the rear side.
The housing on the front
is made out of light plastic
although it certainly doesn’t
have a cheap feel to it; on
the contrary, the analyzer
is extremely solid and firm.
The housing doesn’t warp
26 TELE-audiovision International — The World‘s Largest Digital TV Trade Magazine — 09-10/2013 — www.TELE-audiovision.com
at all when it is squeezed;
the sides and bottom of the
analyzer are metallic. A light
blue rubber cover protects
it from accidental bumps
and also if it should fall to
the floor. Throughout our
tests we really didn’t have
to worry about the S7000;
we could focus on our work
expert
TECHNICAL
DATA
OPINION
without having to constantly
keep an eye on the analyzer.
After turning the S7000
on, it needs only 18 seconds
before it’s ready to be used.
The Main menu appears
from which you can switch
between SAT and CATV/terrestrial mode with the help
of the menu buttons on the
side. The IPTV option can
be added for an additional
charge whereby even IPTV in
a network could then also be
measured and analyzed. This
option was not available in
our test analyzer.
The S7000 comes shipped
with transponder lists from
numerous satellites as well
as the frequency tables for
cable and terrestrial TV.
Additionally, the analyzer
permits the administration of
various channel lists that are
created from an automatic
channel scan. They can also
be manually edited and managed.
At this point it’s important
to point out that the S7000
can analyze a signal unusually fast and can automatically set the corresponding reception parameters.
In SAT mode you can very
quickly get used to driving to
the desired transponder and
directly take measurements
in a real-time spectrum. The
signal is correctly locked on
to within 1-3 seconds, even
with non-standard symbolrates. There’s no other analyzer known that can accomplish this as fast. Of course
DXers will be excited about
this since feeds can then be
found so much faster.
It’s not a coincidence
that the S7000 is labeled
TV Analyzer”. It actually
contains a complete transponder stream analyzer. It
can not only display MPEG2
and MPEG4 video with audio
(analog video and audio too),
it also shows a variety of parameters and PIDs. Added to
this are powerful functions
to fully analyze and measure
transport streams.
Up until now, these kinds
of functions have never
been found in analyzers in
this price class. Absolutely
ideal is the ability to store
the transponder stream on a
USB storage device so that it
can be analyzed more closely or documented later on in
the office.
We can’t help but reveal
our opinion at this point: as
a passionate DXer, feedhunting is a piece of cake with
this analyzer! It has never
been so simple using a realtime spectrum to select the
typical transponder peaks of
feeds (they’re much narrower than normal transponders
and are also typically lower
in power) and then push the
TV button. In just seconds
the
S7000
automatically
processes the reception parameters and simultaneously
makes it possible to completely analyze the received
transponders.
So much for the Deviser
S7000’s introduction. It’s become clear that this is no ordinary combination meter for
satellite, cable and terrestrial TV; it’s a complete TV analyzer that can perform every
conceivable
measurement
and signal analysis and yet
is still small and lightweight,
has a high-resolution display
and can operate for up to five
hours on its own.
In part two of this report
in the next issue of TELEaudiovision, we will present
the results of our tests.
The S7000 had to compete
against our TELE-audiovision upper-class reference
units to prove its measurement accuracy. We will also
show how this analyzer can
be controlled via a network
from a PC and what tricks
came to mind. Just to whet
your appetite a little: the analyzer passed our tests with
flying colors!
Manufacturer
Deviser S7000
RECOMMENDED
PRODUCT BY
Deviser Electronics Instrument Co., Ltd.
Fax+86-22-27645002
[email protected]
Web pagewww.devisertek.com
ModelS7000
Vitor Martins
Augusto
Test Center
Portugal
+ Professional Analyzer for analogue, DVB-S/S2, DVB-C, DVB-T/
T2/H, ATSC and DTMB Signals
Complete Transport Stream Analyser
MPEG2 & MPEG4 Decoder
Waterfall Diagram for Spectrum display
Advanced measurements like: Echo, MER vs. Carrier, Constellation Diagram, etc.
Can record Transport Stream for offline analysis
Features ASI Input/Output
– none
More about this company
www.TELE-satellite.com/TELE-satellite-1107/eng/deviser.pdf
Function
Professional TV Signal Anaylzer
Display
7” TFT LCD, 800×480 pixels
AC/DC Adapter
AC 100-240V/50-60Hz - DC 12 V / 5 A
Battery
Li-ion, 7.4 V/13Ah
Charge Time
around 5 Hours
Working Time
>5 Hours
Remote Feeding
5/13/15/18/21 V, Max. 5 W
22 kHz ControlYes
DiSEqC
DiSEqC 1.0, 1.1, 1.2 and SaTCR
Dimension (W×H×L)
245mm × 194mm × 105 mm
Weight
2.8 kg
Working Temperature
-100C ~ +500C
Storage Temperature
-200C ~ +700C
Spectrum Analyser
Frequency Range
5 - 1050 MHz(TV);
950-2150 MHz (Satellite )
Frequency Span
0 - 1045 MHz (TV);
FULL/600/300/200/100/50/20/10 MHz(Satellite)
Frequency Step
10 kHz (TV), 1 MHz (Satellite )
Resolution Bandwidth (-3 dB)
30 kHz, 100 KHz, 300 kHz, 1 MHz, 3 MHz(TV );
1 MHz, 3 MHz(Satellite )
Level Measurement Range
10-120 dBµV (TV);
30-120 dBµV (Satellite)
Accuracy of Measurements
±1.5 dB
Measurement Detector
Peak, sample, AVG
Reference Level
30-120 dBµV
Markers2
B/G, I, D/K, L/L, M/N
Colour Standards
PAL, SECAM, NTSC
Hum Measurement
> 50 dB
C/N
> 50 dB
Level Measurement Range
30 - 120 dBµV
Accuracy Of Measurements
±1.5 dB
Level Resolution
0.1 dB
Digital CATV Measurement
Modulation Type
16/32/64/128/256QAM, ITU-T, J.83,
ANNEX A/B/C
Symbol Rate
4.0-7.0 MS/s
Power Level Range30-110dBµV
Level Resolution
www.TELE-audiovision.com/13/07/deviser
0.1 dB
Power Level Accuracy
±1.5 dB(C/N>20dB )
MER Measurement
40 dB
MER Accuracy
±2.0 dB
BER Measurement
1E-3~ 1E-9
ConstellationYes
ATSC Measurement
Modulation Type
8 VSB
Power Level Range
25-110 dBµV
Level Resolution
0.1 dB
Power Level Accuracy
±1.5 dB (C/N>20dB )
MER Measurement
> 35 dB
MER Accuracy
±2.0 dB
BERYes
ConstellationYes
DTMB Measurement
TELE-audiovision’s first report on signal analyzer manufacturer Deviser appeared in the 06-07/2011 issue. After moving into a
completely new production and administration facility, a follow-up
report appeared in the 07-08/2013 issue.
28 TELE-audiovision International — The World‘s Largest Digital TV Trade Magazine — 09-10/2013 — www.TELE-audiovision.com
Carriers
C=1 - 3780
Power Level Range
-83- +2 dBm
Level Resolution
0.1 dB
Power Level Accuracy
±1.5 dB (C/N>20dB )
MER Measurement
> 28 dB
MER Accuracy
±2.0 dB
BERYes
ConstellationYes
Echo PatternYes
DVB-S/S2 Measurement
Modulation TypeQPSK,8PSK
Symbol Rate
2 -45 MS/s (DVB-S )
1 – 45MS/s (QPSK DVB-S2)
1 – 45MS/s (8PSK DVB-S2)
Power Level Range
40-110 dBµV
Level Resolution
0.1 dB
Power Level Accuracy
±1.5 dB (C/N>20dB )
MER Measurement
> 25 dB
MER Accuracy
±2.0 dB
CBER/LBER (VBER for DVB-S)Yes
ConstellationYes
Video/Audio Decoder
Video
MPEG2/4, H.264
Video Resolution
1080i, 720p, 576i
Audio
MPEG1/2, AAC
CAM Module
EN50221 (DVB-CI) PCMCIA interface
TS-ASI Input and OutputYes
TS RecordYes
Analogue TV Measurement
Standards
DVB-T/H Measurement
Modulation Type
QPSK, 16 QAM, 64 QAM
Power Level Range
25 - 110 dBµV
Level Resolution
0.1 dB
Power Level Accuracy
±1.5 dB (C/N>20 dB )
MER Measurement
> 30 dB
MER Accuracy
±2.0 dB
CBER/VBER Yes
ConstellationYes
MER Versus CarriersYes
Echo PatternYes
DVB-T2 Measurement
Modulation Type
QPSK, 16 QAM, 64 QAM, 256 QAM
Power Level Range
25 - 110 dBµV
Level Resolution
0.1 dB
Power Level Accuracy
±2 dB (C/N>20dB )
MER Measurement
> 30 dB
MER Accuracy
±2.0 dB
CBER/LBERYes
ConstellationYes
Echo PatternYes
TS Analyser
Interface
EN 50083-9 (DVB SPI, ASI)
DVB-ASI Interface
75Ω BNC
DVB-ASI Clock
270 MHz
DVB-ASI Max Data Rate
0 to 72 Mbps
DVB-ASI Output Signal Level
1.0 Vp-p nominal
DVB-ASI Return Response
>15 dB
DVB-ASI Input Level
800 mV +/- 10 %
Real-time Decoder
Display the real television pictures
(through CA system), including program numbers,
program names, provider information,
video & audio PIDs.
TR101290 Monitor
TR101 290 three levels real time monitor
Base Information
Count the PIDs percent according to the type of
the streams: Video, Audio, PSI/SI, Null Packages
PID List
Display all the PIDs in current stream
Program Information
Detailed info’s about a program (if it isn‘t be encrypted).
Video resolution and audio compress rate.
PCR Monitor
Calculate PCR interval and PCR accuracy
PSI/SI List
Display the PSI/SI info’s by tree view. Including
PAT, PMT, CAT and, when available, NIT, SDT,
RST, TDT, EIT.
Program InfoEPG
PID Capture
Capture a specified PID by its type: Video, Audio,
PSI (PAT, PMT, NIT, TDT, RST, SDT, EIT) and
display the data in HEX format.
TS Record and Replay
8 GB disk for Transport Stream record
Interface
RF Input
75Ω F-Type
HDMI Output1x
USB
1x USB 2.0
LAN
1x 10/100 MBit/s
CAM
1x PCMCIA
TS-ASI Input/Output
2x 75 Ω BNC
DC Supply Input
12 V / 5A
GPS InputUSB
www.TELE-audiovision.com — 09-10/2013 — TELE-audiovision International — 全球发行量最大的数字电视杂志
29
1
2
3
6
Satellite Modes
1. The S7000’s Main menu is nicely organized. The function buttons
to the right select the desired mode: cable, terrestrial or SAT (IPTV
optional). The File Manager can also be accessed here. The arrow
buttons are used to switch between measurement, constellation
diagram, spectrum analyzer, Sat Finder and DiSEqC.
2. A push of the SETUP button brings up the correct LNB configuration page.
3, 4, 5, 6. In just 2-3 seconds a signal lock is achieved and all
the reception parameters are displayed. As expected, for digital signals the measurement screen displays the level, MER and
BER whereby BER is divided into CBER and LBER. BER (Bit Error
Rate) shows the bit error ratio, that is, the number of faulty bits
compared to the number of received bits in the same time interval.
Since the received bits go through an error correction process,
professional analyzers display the BER before and after error
correction. Depending on the modulation method, different error
correction algorithms are used. Our modulation table compiles
all of the important details together.
Modulation Table
4
5
Modulation
Algorithmus
of Error
Correction
Recommended
Threshold BEFORE
Error Correction
Recommended
Threshold AFTER
Error Correction
DVB-S
VITERBI
CBER = <1E-6
VBER = <1E-8
DVB-S2
LDPC+BCH
CBER = <1E-7
PER = <1E-8
DVB-C
Reed-Solomon
PRE-BER = <1E-6
POST-BER = <1E-8
DVB-C2
LDPC+BCH
CBER = <1E-7
LBER = <1E-8
DVB-T/H
VITERBI
CBER = <1E-6
VBER = <1E-8
DVB-T2
LDPC+BCH
CBER = <1E-7
LBER = <1E-8
For DVB-S signals, the S7000 shows the BER measurements in
QPSK modulation in CBER (Channel Bit Error Rate – before error
correction) and VBER (Viterbi Bit Error Rate – after Viterbi error
correction). With DVB-S2 signals using 8PSK modulation, BER is
shown as CBER and LBER since in this case LPDC+BCH error correction is used.
It is extremely helpful to have the BER measurements displayed in
this way in that for one thing you want to receive a signal that is
as error-free as possible and secondly, any errors would be totally
corrected by error correction.
The first function button is labeled VIEW. This highlights that these
analyzers were designed by technicians for technicians since with
this button you can switch between measurements whereby the
currently selected measurement is prominently displayed in the
upper part of the screen numerically and as a bar graph. This makes
it easy to read from a distance even when outside working on the
antenna.
We also appreciated some of the smaller details like, for example,
the ability of the S7000 to show the transponder frequency simultaneously in satellite IF form and actual downlink frequency. You no
longer have to convert the frequency (for example, the conversion
in the Ku-band with a universal LNB is like this: up to 11700 the
IF = transponder frequency – 9875 and from 11700 and up the IF =
transponder frequency – 10600). We should mention that the transponder bandwidth is also displayed.
30 TELE-audiovision International — The World‘s Largest Digital TV Trade Magazine — 09-10/2013 — www.TELE-audiovision.com
7
12
8
13
9
10
7. Without any detours you end
up in the constellation diagram.
Here Deviser utilizes the highresolution display and provides
an excellent method to diagnose
problems caused by faulty components.
8. Next is the Spectrum Analyzer mode. First of all we liked
that the spectrum can be displayed with a 1200 MHz span
in real time. Real time simply
means that the spectrum display is renewed multiple times
per second. In this way you can
instantly recognize how, for
example, an antenna needs to be
adjusted to receive the best possible signal. And just the highresolution of the spectrum itself
is a plus point – closely spaced
narrow-bandwidth transponders
are clearly resolved.
9. The representation of the
spectrum can be switched using
the DISPLAY function button
located in the second row of
function buttons. Instead of displaying the spectrum as a single
line, it can also be shown with
the area below the line filled in.
11
10. Push the DISPLAY button a
second time and the spectrum
is then shown as a waterfall
diagram. You can easily follow
transponders over a period of
time and since it‘s possible to
send out DiSEqC 1.2 commands
while in this mode, aligning
motorized antennas becomes
easy as pie. If you want to learn
more about how to use waterfall
diagrams you may read my articles in TELE-audiovision issues
12-01/2012 and 02-03/2012.
11. That Deviser actually put
some thought into this and didn‘t
simply implement the waterfall
diagram carelessly can be seen
32 TELE-audiovision International — The World‘s Largest Digital TV Trade Magazine — 09-10/2013 — www.TELE-audiovision.com
when the DISPLAY function
button is pressed again. Just
as can be seen in the demonstration software, the spectrum is
now displayed in parallel to the
waterfall diagram. In this way
you can clearly recognize the
transponders in the spectrum
and measure the levels using
the obligatory markers (available in all display modes) while
the waterfall simultaneously
documents the evolution of
the signal. The otherwise standard peak-hold function (that,
of course, is also available) will
now only seldom be used thanks
to the waterfall diagram.
12. If the function button labeled DRIVE is pressed, the up/
down buttons can then be used
to switch between the DiSEqC
1.2 modes MOVE and STEP whereby the left/right buttons move
the
motor
correspondingly.
The spectrum is still displayed
in real-time and thanks to the
waterfall diagram it‘s easy to
obtain the best possible alignment. Aside from that, you can
also see how many and which
satellites can be received between the east and west limits
of the antenna. You simply drive
the antenna from east to west (or
vice versa) and using the waterfall diagram you can clearly
recognize each satellite and with
a little experience you’ll also be
able to identify them.
13. The S7000 supports a variety
of DiSEqC and single cable SCR
standards with a single DiSEqC
menu. These can be selected in
the Main menu or at any other
time using the function buttons.
14
14. Switching from SaTCR
(SCR - Single Cable Routing)
and DiSEqC. In SCR mode
the individual frequency windows of the antenna jacks can
flexibly be edited so that the
S7000 can be harmonized with
practically every SCR switch.
15. In DiSEqC mode DiSEqC
1.0 and 1.1 multiswitches can
be controlled (for up to 4 or
16 LNB inputs) as well as a
DiSEqC 1.2 positioner. Simple
tone-burst switches can also
be controlled.
15
16
17
18
16. The Sat Finder function
shows the active satellite‘s
selected transponder signal
level. If needed, an audio tone
can also be turned on so the
antenna can be aligned without having to look at the analyzer. The arrow buttons can
be used to switch satellites
without having to leave the
current display screen.
The specialty of this feature
is the automatic calculation
of azimuth, elevation and LNB
skew. This data is obtainable
thanks to the GPS antenna;
the current position is of
course also shown. If for some
reason the current geographical position can‘t be obtained
from the GPS, this information
can also be entered manually.
At first this might not seem
all that critical; the antennas
are always mounted outdoors.
But what if the installer wants
to pre-align the antenna in
his workshop so that he can
install it more quickly at the
customer? Then it could be
very practical to enter the
customer‘s position in ahead
of time.
17, 18, 19. The S7000 can
automatically
recognize
reception
parameters
like
symbolrate, FEC and modulation. Many instruments fail
at this seemingly simple task
and therefore need current
and specially setup channel
lists. Not true with the Deviser S7000: it recognizes these
parameters on its own and in a
very short time. Sure enough,
markers can be used to select
a desired transponder (or the
frequency can be directly
entered) and in measurement
mode the S7000 determines a
variety of reception parameters in 1-3 seconds and also
simultaneously shows these
values.
In just a few seconds the live
picture of an unencrypted
channel is displayed and you
can quickly switch between
channels via the transponder
service list. The S7000 shines
with channel switching times
of 1-3 seconds depending on
the type of signal and modulation.
25. In this mode the Deviser
S7000 even has a complete
transponder stream analyzer available. This function is
geared more towards technicians that are responsible for
head-end stations, transmission or reception systems. All
analyzer functions are available for each received transponder stream regardless if
they originate from the internal DVB-S/S2, DVB-C, DVBT/H tuners, from the ASI input
or, for example, from an external transponder stream file.
The first picture shows the
transponder stream‘s primary
data. The bandwidth is shown
as well as NIT information and
the stream‘s basic statistical
data.
26. In the second picture,
EVENT INFO, additional information on the quality of the
transport stream is shown.
19
24
20
25
21
26
22
27
23
28
27. The third screen, PID
VIEW, shows the assignment
of the different PIDs. This data
is also important for installers
because it can provide important error conclusions with
the setup of smaller head-end
stations and IPTV servers, for
example, if the wrong PIDs
were accidentally configured.
28. The fourth screen, PROG
GRAPH, displays details on
the selected channel within
the
transponder
stream.
These parameters provide
important information on the
resolution and, above all, the
CODECs in use. If a customer complains, for example,
that a specific channel can‘t
be played back by a receiver,
then the reason could be that
the channel is encoded with
professional equipment using
4:2:2 Chroma, instead of the
standard receiver based 4:2:0
Chroma.
20, 21, 22, 23, 24. Naturally, the
S7000 can also play audio and
video and includes the corresponding decoders for analog
and digital signals in MPEG2
and MPEG4. This mode can
be accessed at any time with
the TV button. If the signal
has not yet been locked on
to, because perhaps in spectrum mode the marker was just
placed on top of a transponder, the analyzer determines
the corresponding reception
parameters on its own, just
like in measurement mode.
34 TELE-audiovision International — The World‘s Largest Digital TV Trade Magazine — 09-10/2013 — www.TELE-audiovision.com
www.TELE-audiovision.com — 09-10/2013 — TELE-audiovision International — 全球发行量最大的数字电视杂志
35
29
30
34
35
31
36
32
37
33
38
29. The fifth screen contains a
PCR measurement. PCR stands
for Program Clock Reference
and serves to determine the
transit time delay between the
received signal and the receiver
clock (27 MHz). A PCR is periodically added to the transport
stream. The Deviser S7000 reads
this PCR and shows how precisely synchronized the internal
27 MHz clock is with the PCR
signal. The difference should
normally be no more than +/500ns. Since the PCR bytes
themselves are generated with a
27 MHz clock and embedded in
the transport stream, the resolution is limited to 37ns. The accuracy shown in the upper graphic
highlights the timing error within
the multiplexer, but not any runtime delays that were generated
within the network. As you can
see, a perfectly synchronized
transport stream is being received indicating that no errors
existed in the clocks of various
multiplexers and modulators
at the headend. If the delays
are longer than 500ns, then the
receiver could have problems.
In the lower graphic the timing
offset between the PCR bytes
is shown. Run-time delays that
were generated within the network can be derived. And here
too everything is in the green.
Even though small delays are
visible, they don‘t yet have any
influence on the reception quality. It is therefore an extremely
important measurement when it
comes to maintaining head stations and broadcasting systems
.
30. The PROG LIST shows the
provider‘s channels. This information, as long as it‘s correctly
entered into the NIT by the provider, makes possible a faster
channel scan for receivers since
known transponders do not have
to be scanned separately. Unfortunately, many broadcasters
don‘t stick with the standards
and all too often don‘t include
the correct NIT information in
the stream. Thus a transponder
would show the wrong satellite
name or even no name at all.
And then there‘s the case where
the name of the satellite, bouquet, etc., is spelled wrong or
non-uniform upper/lower case
lettering is used. Here the responsible technician should definitely have an S7000 placed in
his hands!
31, 32, 33, 34. The seventh menu
screen PSI/SI lets you navigate
within the complete TS table.
All data can easily be analyzed,
PAT, PMT, CAT, NIT, SDT, TDT
and MIP. The arrow buttons let
you navigate within the individual branches of the table giving
you information on the smallest
detail. It‘s an indispensable aid
when working with multiplexers
and you want to make sure that
all the parameters are correctly
configured.
35, 36. The transport stream
analyzer‘s eighth menu screen
is a highlight of the S7000: here
individual
transport
stream
packets can be stored and dis-
36 TELE-audiovision International — The World‘s Largest Digital TV Trade Magazine — 09-10/2013 — www.TELE-audiovision.com
played. After recording, these
data packets can be displayed
byte-by-byte.
39
37. In the last menu screen the
transport stream‘s reception
parameters can be read and
edited. This permits the simulation of different situations; the
S7000 can be configured like
similar receivers. There is no
other known signal analyzer that
can do this.
38, 39. If you insert a USB storage device into the S7000, the
transport stream can be recorded if it is in transport stream
analysis mode. The streams
are recorded in *.ts format, a
format compatible with many
PC processing programs such
as TS Reader, VLC or TransEdit.
Of course, recorded transport
streams can be played back on
the S7000. In this case all of the
listed analysis tools are available. In other words, you can
record a transport stream on a
receiver or computer and then
analyze it with the S7000.
40. The currently displayed
image on the screen can be
saved in JPG format to the
analyzer‘s internal memory by
pressing the Store button. If you
happen to be in one of the various measurements modes, the
analyzer will ask you if want to
save the current screen or the
displayed data. If the latter is
chosen, the data can be recalled
offline on a PC and if desired
can be displayed and edited,
for example, with the marker.
Using the analyzer‘s File Manager (accessible from the Main
menu), the data stored in the
analyzer can be displayed, deleted, edited or saved to a USB storage device.
40
41
42
41. The active transponder
can be edited and stored in a
special channel configuration
screen. In this way the channel
list can also be managed and
updated directly on the S7000.
This process is actually quite
comfortable so that you don‘t
necessarily need to refer to the
Settings Editor on the included
CD.
42. Back in the Configuration
menu the TS INTERFACE makes
it possible to activate or deactivate the ASI input. This interface
lets you stream transponders
to other devices or take the ASI
streams from other devices and
scrutinize them with the S7000‘s
transport stream analyzer.
43
43. The Configuration menu
is divided into five sections:
ABOUT, GENERAL, MEASURE,
CHANNEL and INTF. In the first
section a variety of analyzer
information is displayed, for
example, the version number
and the different modules.
www.TELE-audiovision.com — 09-10/2013 — TELE-audiovision International — 全球发行量最大的数字电视杂志
37
44
49
45
50
46
51
47
52
48
44. In the second GENERAL section
the network interface can be configured.
45, 46. Outstanding: the Ping command can be used to test the network connection. This alone is very
useful when, for example, a socalled Triple Play CATV connection
is being installed and, in addition
to telephone and digital cable TV,
the Internet connection needs to be
tested.
47. Display and power consumption
can also be configured, such as,
how much inactivity time should
elapse before the S7000 turns itself
off.
38 TELE-audiovision International — The World‘s Largest Digital TV Trade Magazine — 09-10/2013 — www.TELE-audiovision.com
48. The date and time can be set.
49. A variety of skins can be selected.
50. Of course, a variety of menu languages are also available.
51. The submenu OPERATOR is
very interesting: different technicians can log in here and even the
company name can be left behind.
This allows the analyzer to be operated by different users whereby it
would be easy to determine who is
responsible for a particular measurement.
52. Retrieving the analyzer‘s default
settings.
53
58
61
64
54
59
62
65
55
60
63
66
56
53. In the submenu HUM the user
can select whether the line voltage uses 50 or 60 Hz. The corresponding measurement can
therefore properly recognize and
display any hum.
54. Under LEVEL UNIT the desired units can be selected for
signal level and power measurements. The standard is dBµV although measurements can also
be displayed in dBmV or dBm.
The S7000 can also offset the
measurements from -3.0 dB to
+3.0 dB so that comparisons can
be made with other analyzers.
57
55. TP COMPENSATION allows
you to add two additional compensation values. The first field
lets you add a general dB value
that is then added to the measured signal. In the second field
an additional dB value can be
entered that is also added to
the signal; the intention here
is to compensate for the probe.
Only positive values can be
entered in both fields (0 dB to
40.0 dB). This is always useful
when, for example, different
cables or adapters with varying
attenuations are used between
the S7000 and the antenna jack.
In this way it‘s possible with
40 TELE-audiovision International — The World‘s Largest Digital TV Trade Magazine — 09-10/2013 — www.TELE-audiovision.com
a table to compensate for the
attenuation in different cables.
Now the first field makes sense:
here you can enter the compensation of the analyzer or
other passive/active elements
in the network (such as, multiswitches, amplifiers or filters)
to make sure that other instruments will provide the exact
same measured values
.
56. Choosing the PID number
representation in the transport
stream analyzer. A decimal display is the more popular choice
with most users but others might
be more used to hexadecimal
format in that it has the advantage that all bytes, regardless of
their value, have precisely two
characters.
57. Since the S7000 supports
both ATSC and DVB, the desired mode can be selected in the
appropriate menu. This only
affects the transponder stream
analyzer which displays the
received stream. Sure enough,
there‘s very little you can do
wrong here; the S7000 processes the reception parameters
automatically, even if these were
predefined incorrectly.
58. In the last submenu the correct analog signal standard
can be selected. All standards
are supported: PAL-BG, PAL-I,
PAL-M, PAL-N, PAL-DK, NTSC-M,
NTSC-N, NTSC-433, SECAM-BG,
SECAM-DK and SECAM-L, and,
of course, 50 or 60 Hz. There‘s no
doubt, no matter where you are
in the world, this analyzer can be
used to measure TV signals.
59. Another highlight: channel
lists can be created not only with
the editor that can be found on
the CD, but also directly here on
the analyzer.
60. Last but not least, there‘s
also a dedicated menu for configuring the GPS antenna. If it‘s
active, the current position will
be displayed. If there‘s no GPS
antenna or if you want to enter
in another position, such as the
customer‘s location, this can be
done manually.
In the firmware of the analyzer
that we tested, the GPS antenna
is used to only show the current
position and to calculate the
azimuth, elevation and skew.
An upgrade to the firmware that
would allow the continuous
recording of measurement parameters together with the geographical position would be nice.
Such a recording of the recep-
tion parameters along with the
geographical position could be
used, for example, in conjunction with Google Maps to create
regional footprints of Single Frequency Networks.
67
Waterfall
61. The Deviser S7000 is the
first combined TV analyzer that
features the waterfall diagram
to show the spectrum. In this
picture you can see the result
of rotating our motorized dish.
Notice the different satellites
and their transponders. Can you
guess the satellites? With a bit
of experience you will be able to
recognize the satellites.
62. Deviser not only implemented the waterfall diagram – they
seriously thought about it and
realized a combined spectrum
and waterfall display mode. This
is really useful, since the spectrum is in high resolution, while
the waterfall will keep track of
the spectrum over a period of
time.
63. Here we were optimizing our
dish for the reception of exotic
satellites… notice how the reception level varies on the waterfall
diagram. After using this display
mode, you‘ll never go back to
anything else.
CATV and
Terrestrial
TV Modus
64. If you switch to Cable and terrestrial TV mode from the Main
menu, two new symbols will
appear in place of the Sat Finder
and DiSEqC symbols for the
measurement of angular position
and Barscan.
65, 66, 67, 68. Based on the active
channel list, the analyzer automatically selects CATV or terrestrial reception.
Once again the S7000 automatically recognizes the reception parameters and in record
time. Just like in Sat mode, in
the upper part of the screen the
power, MER, CBER or VBER can
be enlarged and displayed with
bar graphs.
www.TELE-audiovision.com — 09-10/2013 — TELE-audiovision International — 全球发行量最大的数字电视杂志
41
68
69
70
71
72
69, 70, 71. In DVB-T/H mode,
the constellation diagram is
enormously useful in identifying errors. The Deviser S7000
comes with all the expected
functions like Zoom, to magnify
quadrants. Also interesting is
the ability to focus the constellation diagram onto single carriers in the transponder. This lets
you analyze, for example, the
influence of a narrow bandwidth
interference signal on a single
carrier. Fantastic!
72, 73. And just like in Sat mode,
the spectrum in DVB-T/H mode
can also be displayed in various
forms, including a waterfall diagram. The 50 MHz to 1000 MHz
spectrum is clearly refreshed at
a much slower rate than in Sat
mode and this is obviously due
to other signal modulations and
smaller spectrum frequency
bandwidths being used. However, Deviser gives the user
the ability to edit the spectrum
frequency bandwidth in increments. Depending on the setting, the spectrum is displayed
in more detail or presented
much faster.
74. You don‘t want to analyze
the spectrum across the entire
frequency span here anyway it would be good enough if you
find out ahead of time on what
frequencies signals can be
found. It‘s critical here to enter
small enough ranges that would
allow a precise measurement of
the signal-to-noise ratio. There
are two markers available in this
mode for that purpose and the
S7000 automatically determines
this ratio in MHZ and dB.
75. An ECHO measurement
should be included in every
modern DVB-T/H signal analyzer. This type of measurement
is critical for Single Frequency
Networks (SFN). The idea here
is that various transmitters
in a region all broadcast on
the same frequency. This has
numerous advantages; for one
thing the rest of the frequency
band remains clear for other
uses and secondly, receivers
can be transported within a
region (such as in cars) without
having to reset the reception
frequency.
Unfortunately, SFN transmissions also come with a huge disadvantage: if the receiver finds
itself between two transmitters,
the signal will be received from
both transmitters. Since the distance of the receiver to both of
the transmitters is likely to be
different, the result is a shift in
the arrival times of both signals
known as ECHO.
The DVB-T/H standard provides
for a so-called Guard interval
that automatically compensates for this time shift if it
is small enough, that is, lies
within the Guard interval. If the
ECHO is too large, it will inevitably lead to reception problems even though a simple
signal analyzer will show a high
signal level!
42 TELE-audiovision International — The World‘s Largest Digital TV Trade Magazine — 09-10/2013 — www.TELE-audiovision.com
The S7000 has mastered these
ECHO measurements and automatically displays these measured ECHOs graphically and
in a table. For each ECHO the
corresponding level as well as
the delay in microseconds/kilometers is shown. This will allow
the installer to determine which
transmitter is causing the interfering ECHO and properly align
the antenna especially if he has
documentation showing the
regional distribution of these
transmitters.
73
A trick would be to use the sloping roof of a house to block the
unwanted signal from a distant
transmitter.
74
78
75
79
76
80
77
81
78, 79, 80. The Deviser S7000
doesn’t differentiate between
CATV and terrestrial TV. The
advantage here is that the channel list doesn’t need to be divided and you don’t have to go
through complicated menus to
change modes. The S7000 recognizes the modulation, regardless if it’s analog, DVB-C or
DVB-T/H.
With analog channels the
audio/video levels are displayed and the offset is auto-
matically calculated.
81. Naturally, analog channels
can be presented with picture
and sound while the analyzer
simultaneously shows added
information
such
as
the
video standard. Just like with
the presentation of digital
transponders, the TV picture
can be shown in full-screen
mode by simply pushing the OK
button.
76. Another relatively new measurement that is found in very
few professional analyzers is
the MER vs. carrier measurement. Here the Modulation Error
Rate (MER) is not shown as an
average value of all carriers
within a transponder, instead
it is shown for each individual
carrier.
These values are presented in
a graphic that resembles the
spectrum and consequently,
also in a waterfall diagram. The
marker allows the navigation
within the many carriers that
make up the transponder and
the analyzer will show the respective matching MER value in
dB.
This measurement serves to
identify the smallest interference such as that from audio/
video broadcasters in the VHF/
UHF range. But even LTE and
other services could interfere
with a DVB-T/H transponder.
With a basic MER measurement
this interference might not be
detected since the average
value is hardly affected. Nevertheless, it could be enough
to totally interfere with a few
carriers such that a considerable portion of the transponder
stream can no longer be correctly received.
The simultaneous display as a
waterfall diagram is truly oneof-a-kind; it allows you to catch
and document even intermittent
and momentary interference.
77. Just like in Sat mode, the
TS Analyzer can be accessed
at any time. In just seconds a
signal lock is achieved and the
reception parameters are read.
Thanks to the implementation
of many standard and also nonstandard CODECs, channels
such as the Portuguese TDT
(Televisão Digital Terestre digital terrestrial television)
can be displayed even though,
despite DVB-T modulation, the
video and audio are compressed
in MPEG H-264 and MPEG4 AAC,
respectively, as can be seen in
the PROG GRAPH screen.
www.TELE-audiovision.com — 09-10/2013 — TELE-audiovision International — 全球发行量最大的数字电视杂志
43
82
87
83
88
84
89
85
86
82. With analog signals there are
of course additional measurements possible, for example, the
signal-to-ratio. What’s unusual
is all of the information that can
be displayed at the same time
thanks to the high-resolution
screen. Even from a distance
you’d be able to read on a bar
graph the numerical values, for
example, for the signal level and
the signal-to-noise ratio while at
the same time, for example, the
channel number and frequency
are displayed.
83. The S7000 can also perform
hum measurements. This makes
it possible to measure the influence of hum that originates from
the power grid and are present
on analog channels. Naturally
you can choose in the configuration menu whether the power
grid operates on 50Hz or 60Hz.
84. And another surprise: in
order to actually find every possible error, the analog video
lines can be presented in an
oscillator mode. In this way, for
example, problems in the blanking intervals that are critical for
picture synchronization can be
recognized.
44 TELE-audiovision International — The World‘s Largest Digital TV Trade Magazine — 09-10/2013 — www.TELE-audiovision.com
85. The spectrum mode when
used in CATV and terrestrial
modes has the capabilities to
position two markers whereby
the level offset is automatically
displayed.
86. A peak-hold function is,
of course, also available. This
would be useful, for example,
when an amplifier needs to be
adjusted.
87. A preamplifier is integrated into the Deviser S7000 and,
when necessary, can be activated.
88. Digital CATV channels can
also be measured and once
again the S7000 processes the
necessary reception parameters
in record time. It was surprising
that throughout the entire testing process it was not necessary to use the Settings editor
to setup the channel lists ahead
of time.
89. With digital signals the
power and signal-to-noise ratio
is displayed in the measurement
screen. Thanks to the large
screen all of the critical measurements and parameters such
as MER, Pre and Post BER and
frequency can all be viewed at
the same time.
90
95
98
100
91
96
99
101
92
97
93
94
90. Just like with the handheld
signal analyzer DS2400T introduced in the 1209 issue of TELEaudiovision, a long duration bit
error rate (BER) measurement is
also available. The time interval
can be selected and from that
point on a graphic shows the
progression of BER and MER.
This helps to identify intermittent problems.
91. An additional measurement
for DVB-C signals is available,
namely the EVM or Error Vector
Magnitude. This measurement
resembles the MER measurement but here a different reference is used: while the RMS
value of a QAM signal is used
for determining the MER, for
the EVM measurement the peak
value of the QAM signal is used
as a reference. The EVM measurement presents the ratio of the
error vector amplitude versus an
ideal vector amplitude and helps
with the identification of interference in signals under the QAM
mask.
92. The so-called Tilt measurement shows the bars for each
channel in increasing frequency
from the left to the right so that
the line connecting the first bar
46 TELE-audiovision International — The World‘s Largest Digital TV Trade Magazine — 09-10/2013 — www.TELE-audiovision.com
associated audio level is shown
in yellow. Digital channels are
shown in blue. Here too the
channels are arranged in increasing frequency and once again
it’s obvious that there’s a problem on this antenna jack. The
digital channels to the right
clearly have a lower level than
the others.
to the last bar shows the tilt. Ideally, the line should be as horizontal as possible. A large tilt in
the line suggests attenuation in
the upper frequency range (or
lower frequency range) and can,
for example, be compensated
for with the proper amplifier.
93. For the Barscan measurement up to 16 channels can be
selected – you can choose only
analog, only digital or a combination of analog and digital
channels.
97, 98. The Deviser S7000 supports all the standard CATV
modulators and can display the
constellation diagram without
any problems regardless if it’s
64QAM or 256QAM.
99, 100. The S7000 can perform
a channel scan for terrestrial
TV and CATV. The user can
choose if only analog channels,
digital channels or both should
be searched for. The threshold
values can be predefined in the
configuration menu.
101. For satellite mode the desired satellite simply needs to
be selected from the list and
it’s even possible to enter new
satellites into the analyzer. The
preprogrammed satellite list
contains nearly every satellite
from around the world along
with their current transponders.
■ TELE-audiovision's Technical
Editor Vitor Martins Augusto
using the Deviser S7000
94. Here only analog channels
were used for the Barscan measurement.
95. Digital channels were now
measured (in blue) at the same
port. It’s obvious that the signal
is falling off for the four digital
channels on the right side. The
attenuation is too high.
96. The so-called Barscan measurement is nearly self-explanatory and is where the level and
power of the selected channels
are displayed as a bar graph.
With analog channels the video
level is shown in green and the
www.TELE-audiovision.com — 09-10/2013 — TELE-audiovision International — 全球发行量最大的数字电视杂志
47