1
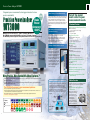
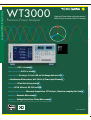
Precision Power Analyzer
Basic Accuracy
0.01% of reading
Basic Power Accuracy
Good Readability
0.02% of reading
The Large, 8.4-inch LCD and the Range Indicator LEDs
Simultaneous Measurement with 2 Units (8 Power Input Elements)
Store Function
Interface
50 ms Data Storing Interval
GP-IB, Ethernet, RS-232 and USB
Advanced Computation Function
Waveform Computation, FFT Analysis, Waveform sampling Data Saving
IEC61000-3-2
Harmonic Measurement
IEC61000-3-3
Voltage Fluctuation/ Flicker Measurement
* As of February 2007, for power meter accuracy in three-phase power meter (as investigated by Yokogawa).
(WT3000)
Bulletin 7603-00E
www.yokogawa.com/tm/
High-end Power Meter with top precision*
Basic Power Accuracy: 0.02% of reading
Visit our website to sign up for email updates.
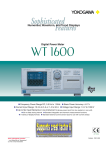
Precision Power Analyzer WT3000
WT3000
Precision Power Analyzer WT3000
Yokogawa’s power measurement technology provides best-in-class*1
precision and stability
Better Efficiency in Power Measurements
APEX
Basic
Power
Accuracy:
±0.02%
With basic power accuracy of ± 0.02% of reading, DC and 0.1
Hz–1 MHz measurement bandwidths, and up to four input elements,
the WT3000 provides higher-accuracy measurement for inverter I/O efficiency.
In developing the WT3000, Yokogawa focused on improving
efficiency in two basic areas. One goal was to obtain highly
precise and simultaneous measurements of the power
conversion efficiency of a piece of equipment. The other
objective was to improve equipment evaluation efficiency by
making simultaneous power evaluations and tests easier
and faster.
Select the model
most suited to your
measurement needs.
Standard Version
夹High Accuracy and Wide Frequency Range
New Innovations to Enhance the Reliable
Measurement Technology
With the WT3000, we made further improvements to the
basic performance specifications for even better
functionality and reliability. We are confident users will
appreciate these improvements to power and efficiency
measurements thanks to the new power control
technologies we have introduced.
Basic Power Accuracy
±(0.02% of reading + 0.04% of range)
Frequency Range
DC, 0.1 Hz to 1 MHz
夹Low Power Factor Error
Power factor influence when cosø=0
0.03% of S
S is reading value of apparent power
ø is phase angle between voltage and current
夹Current Range
A Variety of External Interface Choices
The WT3000 is the first model in the
WT Series which is standardequipped with a PC card slot (ATA
flash card slot). The WT3000 is also
standard-equipped with a GP-IB port.
In addition, a serial (RS-232) port,
Ethernet port, USB port for peripheral,
and USB port for connection to PC
are available as options. The variety
of interface choices allows customers
to use the best interfaces for a wide
variety of equipment, media, and
network environments.
More Precise. More Bandwidth. More Features.*2
• The WT3000 is a truly innovative measurement solution, combining top-level measurement accuracy
with special functions. *2
• The large, 8.4-inch liquid crystal display and the range indicator LEDs ensure good readability and
make the system easy to use.
The WT3000 is the answer to your measurement problems.
Have you had problems or questions such as these?
• When working with efficiency-improvement evaluation data for a high-efficiency motor, improvements cannot be seen
unless measurements are taken with very high precision.
• Measurement efficiency is poor during power measurements and power supply quality measurements.
For answers to these questions, see page 6.
Yokogawa’s highest-precision power meter *2
The WT3000 has the highest precision of the Yokogawa power
meters in the WT Series. The models in the WT Series are
designed to meet a wide variety of user needs. The WT200
Series is a high price-performance series which is very popular
in production line applications. The WT1600 allows
measurement data to be viewed in a variety of ways, including
numerical value display, waveform display, and trend display
capabilities.
WT3000
±0.02%
Features
Voltage
range
Current
range
External
sensor
range
Frequency
power
range
Crest
factor
Display
4 input
elements
Standard feature
Option
Inputs
Basic
Power
Accuracy
Normal
harmonics
Wideband
harmonics
IEC
harmonics
FET
computation
Waveform
computation
Data
updating
interval
Delta
calculation
Frequency
measurement
Internal
Memory
USB
memory
Motor
evaluation
WT1600
As fast as
50 ms
Sampling
data saving
Cycle
Fricker
PCcard
slot
±0.10%
Printer
Software (sold separately)
WT210/WT230
DAoutput
VGA
Comm
Comm
Comm
Comm
USB
2
Software
Software
Software
±0.10%
Direct Input
0.5/1/2/5/10/20/30 [A] *
5m/10m/20m/50m/100m/200m/500m/1/2 [A] *
External Input
50m/100m/200m/500m/1/2/5/10 [V] *
夹Voltage Range
15/30/60/100/150/300/600/1000 [V] *
* Voltage range and current range are for crest factor 3
夹Continuous Maximum Common Mode
Voltage (50/60 Hz)
1000 [Vrms]
夹Data Update rate: 50 ms to 20 sec
夹Effective input range: 1% to 130%
夹Simultaneous measurement with 2 Units
夹Standard PC Card Slot
夹Storage Function (Approximately 30MB
internal memory)
Motor Version
In addition to the functions of the standard version, the
models offer powerful motor/inverter evaluation
functions.
夹Motor Efficiency and Total Efficiency
Measurement
Analog or pulse signal from
rotating sensor and torque
meter can be input, and
allows calculation of torque,
revolution speed,
mechanical power,
synchronous speed, slip,
motor efficiency, and total
efficiency in a single unit.
*1 As of February 2007, for power accuracy in a three-phase power meter
(as investigated by Yokogawa)
*2 As compared to Yokogawa’s products
*reading error
3
Precision Power Analyzer WT3000
FUNCTIONS
䉴 WT3000 Controls:
Simple to Use, Easy to View
The WT3000 was designed with user-friendly functions and controls
in response to user requests for a simpler range setting operation
and more user-friendly parameter setting display process.
Simpler range settings
Item pages make it easy to set the data you want to view for each experiment
Range settings using direct key input
Using item pages to set display preferences
The range indicator on the WT3000 is a seven-segment green LED, so the set
range can be monitored at all times. The range can easily be switched using the
up and down arrows.
The WT3000 has nine numeric item pages for displaying measurement values.
Once you set the measurement parameters you want displayed on a particular
item page, you can easily switch between entire groups of displayed parameters.
Easily switch between multiple item pages
䉴 A wide range of standard functions
Formats for viewing waveforms as well as numerical values
A Variety of display formats
User-defined function
The WT3000 lets you display input signal waveforms in addition to numerical value
data. This means you don’t need to connect a special waveform analyzer just to
check signal waveforms.*1
In addition, the optional advanced computation function lets you display vectors
and bar graphs for
enhanced visual
presentation.
*1 Waveforms up to
approximately
10 kHz can be displayed
accurately.
*2 Excludes single phase model.
As many as twenty user-defined formulas can be set in the WT3000. These
equations can be used to calculate various parameters, such as mean active
power (see “A variety of integration functions” below).
An easier way to input efficiency calculation formulas
Efficiency calculation function
This function can be used to set up to four efficiency calculation formulas.
Apparent power integration and reactive power integration
Vector display*2
High-speed measurement to capture rapid data fluctuations
50ms data updating intervals
Fast updating allows you to precisely capture rapidly changing transient states in
the measurement subject.
* The WT3000 switches between two different calculation systems depending on
the data updating interval. See page 19 for details.
Compensates for the loss
Compensation functions
This function compensates for the loss caused by the wiring of each element. The
WT3000 has the following three types of correction functions to measure the
power and efficiency.
• Wiring Compensation
This function compensates for the loss caused by the wiring of each element.
• Efficiency Compensation
The power measurement on the secondary side of a power transformer such as
an inverter includes loss caused by the measurement instrument. This loss
appears as error in the efficiency computation. This function compensates for this
loss.
• Compensation for the Two-Wattmeter Method*
In the two-power wattmeter method, an error results when current flows through
the neutral line. This function computes the currents that flows through the
neutral line for measurements using the two-wattmeter method with a threephase, three wire (3V3A) system and adds the compensation value to the
measured power. *Requires the delta computation option (/DT).
Storing measurement data*
Store Function
Voltage, current, power, and other measured data can be stored to the unit’s
approximately thirty megabytes of internal memory. These data can be saved in
binary or ASCII format on a PC card or USB memory *. *requires the /C5 option
A Variety of integration functions
• Active power, current, apparent power, reactive power
In addition to the active power integration function (WP) and current integration
function (q) included in earlier models, the WT3000 also has a new apparent
power integration function (WS) and reactive power integration function (WQ).
• A wide effective input range for high-precision integration
The WT3000 has a wide effective input range, from 1% to 130% of the
measurement range.
• Average active power (using user-defined settings)
Average active power can be calculated over an integration interval. This feature
is useful for evaluating the power consumed by intermittent-control instruments in
which the power value fluctuates.
Average active power =
Integrated power (WP)
Integrated elapsed time (H)
Instantaneous power value
Power value
Trend display
4
A way to add user-defined measurement parameters
Time
Average active power value
OPTIONS
䉴 A wide variety of optional functions make it easy to perform
sophisticated power evaluations.
When you purchase a WT3000 from Yokogawa, you get to select just the options you need. This approach lets
you maximize performance at a lower cost.
Checking harmonic components and total harmonic distortion (THD)
Advanced Computation (/G6)
Output graphics at the touch of a button
Built-in printer (/B5)
The advanced calculation function (/G6 option) meets these measuring needs with
advanced, powerful features for making power analysis measurements more efficient.
• Harmonic Measurement in Normal Measurement Mode
You can measure harmonic data while in normal measurement mode. This is effective
for observing values from normal measurements and harmonic data at the same time.
• Wide Bandwidth Harmonic Measurement
This dedicated harmonic measurement function is distinct from the harmonic
measurements that can be taken in normal measurement mode. The function is
useful for ascertaining the distortion factor and harmonic components in strain
measurements of fundamental frequencies from 0.1 Hz to 2.6 kHz. It allows wide
bandwidth measurements of signals that include high frequency waves, such as from
power supplies and acceleration of motor revolution.
• Waveform Computation
You can perform computations on measured waveforms, and display power
(instantaneous voltage × instantaneous current) and other waveforms on screen.
• FFT
You can analyze and display a waveform’s individual frequency components. You can
also check signal components other than the integer multiples of the fundamental wave.
• Waveform Sampling Data Saving
You can save sampling data of input waveforms, waveform computations, and FFT
computations. The data is available for any kind of computation by PC software.
The optional built-in printer is installed on the
front side of the WT3000, so it is easy to use
even if the WT3000 is mounted on a rack. The
printer can be used to print data and waveform
memos.
Capturing cycle-by-cycle fluctuations
Cycle by Cycle Measurement (/CC)
The function takes measurements of
parameters such as voltage, current, and active
power for each cycle, then lists the data on
screen in a time series. Input frequencies from
0.1 Hz to 1000 Hz can be measured. Up to
3000 data can be saved in CSV format. Also,
with the WTViewer software (model 760122,
sold separately), data can be displayed in
graphs by cycle.
Measurement data display
Checking the frequencies of all inputs
Added Frequency Measurement (/FQ)
Input signal and FFT data
In addition to the standard two channels of frequency measurement, a six-channel
frequency measurement option is also available. This option provides frequency
measurement of voltage and current on all eight channels (with input elements 1
through 4 installed). This is necessary when you want to measure voltage and
current frequency from the instrument’s I/O as well as voltage and current frequencies
of multiple items under test at the same time.
Input signal and power waveform
Performing IEC harmonic standards tests
IEC harmonic measurement mode (/G6)
Outputting measurement values as analog signals
Harmonic measurement software* can be used in this dedicated mode for harmonic
measurement that supports international standards. This allows confirmation of
whether or not home electronics, office automation equipment, or other devices
conform with harmonic standards.
* IEC standard compliant harmonic measurement requires the model 761922 harmonic
measurement software.
Voltage Fluctuation and Flicker Measurement (/FL)
Enables voltage fluctuation/flicker measurement conforming to IEC61000-3-3.
The following values related to voltage fluctuation that are stipulated by the IEC610003-3 standard can be calculated from the measured data: dc (relative steady-state
voltage change), dmax (maximum relative voltage change), dt (relative voltage
change time), short-term flicker value Pst, long-term flicker value Plt, instantaneous
flicker sensation, and others. In this mode, you can judge whether voltage fluctuations
in the item under test relative to a specified minimum value are within the standard.
* The flicker test can also be performed with the WT3000 alone. Using the model 761922
harmonic/flicker measurement software (sold separately), you can display trend graphs,
CPF graphs, or reports of the dc, dmax, and IFS (instantaneous flicker sensation) values
in addition to the WT3000 judgment results.
* The range is 0V to 5V for some functions, such as frequency measurement.
Video output for viewing on a larger screen
VGA output (/V1)
The VGA port can be used to connect an external monitor in order to view numerical
value data and waveforms on a larger screen. This capability is useful if you want to
simultaneously check large amounts of data on a separate screen, or view data in a
separate location.
USB Port (Peripheral) Option (/C5)
Checking phase voltage when you measure line voltage
Delta Calculation (/DT)
You can save voltage, current, power, and other kinds of data that are stored in the
WT3000 to a USB Memory. The data can be saved in binary or ASCII format. You
can also connect a keyboard for easy input of user-defined math expressions.
This function allows you to calculate individual phase
voltages from the line voltage measured in a three-phase,
three-wire (3V3A) system. R-S line voltage can be
calculated in systems measured from a three-phase,
three-wire method (using two elements).
This is useful when you want to determine the phase
voltage in motors and other items under test with no
neutral lines.
Note: This function cannot be used for products with only one
element.
D/A Output (/DA)
• 20 Channels
Measured values and calculated value by user-defined function can be output as ± 5V
FS DC voltages from the D/A output connector on the rear panel.
• D/A zoom
This function allows the any input signal range to be scaled to between -5V and 5V* in
the D/A output as Upper and Lower ranges. This makes it possible to enlarge input signal
fluctuations for observation using a recorder or logger.
R phase
T phase
S phase
Note: When taking measurements that incorporate measuring instrument options, certain functions, displays, and measuring functions may be limited depending on the measurement mode.
For example, waveform and FFT computations may not be used simultaneously.
5
Precision Power Analyzer WT3000
Variety of Communication Functions (GP-IB Comes Standard)
USB Port (PC) Option (/C12) * Select USBport (PC) or RS-232
The USB port (type B connector) on the rear panel of the WT3000 allows data
communications with a PC1.
1. USB driver required for USB communications. A USB driver is available from our Web
site.
Ethernet port (/C7)
The optional Ethernet port (100BASE-TX/10BASE-T) allows you to connect the
WT3000 to a LAN. Once connected, images and numerical value data saved on the
WT3000 can be transferred to a PC using FTP server software or other utilities.
Serial (RS-232) (/C2) * Select USBport (PC) or RS-232
APPLICATIONS
Measurement Applications to Utilize WT3000’s Capabilities
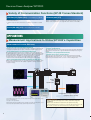
Measurement of Inverter Efficiency
• Measuring Efficiency with High Precision:
Simultaneous Measurement of Input and Output
The WT3000 offers up to four input elements capable of simultaneous measurement
of single-phase input/three-phase output, or three-phase input/three-phase output.
• Accurate Measurement of Fundamental PWM Voltage
Motor drive technology has become more complex in recent years; pure sinewavemodulated PWM is less common, and cases in which the voltage mean differs greatly
from the fundamental voltage waveform arise frequently. With the optional harmonic
measurement function of the WT3000, accurate measurements of commonly
measured values such as active power and the fundamental or harmonic
components can be taken simultaneously without changing measuring modes.
• High Frequency and Harmonic Measurements
(Requires the /G6 Option)
The fundamental frequencies of motors have become faster and faster. The WT3000
allows harmonic measurements of signals with fundamental frequencies as high as
2.6 kHz.
• Evaluation of Torque Speed Characteristics
(Requires motor version, the /CC Option)
Torque speed can be evaluated based on the torque and revolution speed data
measured with the motor version. Also, you can confirm the cycle-by-cycle voltage,
current, and power fluctuations that occur such as when starting the motor.
• Phase Voltage Measurement without a Neutral Line (/DT option)
With the delta computation function, an object under test without a neutral line can be
measured in a three-phase three-wire (3V3A) configuration, allowing calculation of
each phase voltage.
inverter
input signal
output signal
You can take measurements in excess of 30 A by using a 2 A input element together with the model
751574* current transducer.
*See page 10 of the specifications.
When measuring three-phase input/three-phase output with a three-phase four-wire system, you can
measure input and output simultaneously by synchronizing between two units.
6
motor
load
torque
and
speed meter
trend display of torque and rpms
(requires motor version)
• Related applications
Power conversion technologies such as those used in EVs and power
conditioners
High-precision, simultaneous measurements are required in measuring
conversion efficiency in the conversion of a converter's three-phase input to a DC
bus, and the conversion from an inverter's DC bus to three-phase output.
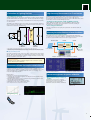
Evaluation of Lighting Devices
High Accuracy Measurements of Transformers
• Simultaneous Measurement of Voltage, Current, and THD
(Total Harmonic distortion)
Testing of lighting devices often involves measurement of voltage, current, and THD,
a parameter that indicates the quality of power. This is because distortion in voltage
and current waveforms is becoming more prevalent due to the increasing complexity
of control systems.
The WT3000 can simultaneously measure voltage and current with THD, eliminating
these inconveniences and allowing for more accurate and rapid measurements of an
instrument’s characteristics and fluctuations.
• High Accuracy Even at Low Power Factors
The WT3000 represents great improvement over previous models in terms of power
factor error (it is approximately three times more accurate). With improved
measurement accuracy in the lower power factors—such as with transformers, active
power values can be measured with higher precision.
• Simultaneous Measurement of RMS and MEAN of Voltage
Voltage RMS (the true RMS value) and voltage MEAN (rectified mean value
calibrated to the rms value) can be measured at the same time, allowing for
measurement of corrected power (Pc).
• Phase Voltage Confirmation
V
A
Measuring Conversion Efficiency of Power Conditioner
Flourescent
lamp
V
Ballast
The delta computation function (/DT option) allows both star-delta and delta-star
conversion.
• Conversion Efficiency Measurement
V
Renewable energy source of photovoltaic power generation and wind power is
converted dc to ac using power conditioner. The WT3000 Precision Power Analyzer
provides measurement with world-class DC and AC signal accuracies.
DC100V to 250V
A
DC300V
AC100V
A
Secondary current
booster
converter
Cathode current
* THD stands for total harmonic distortion. In other words, the distortion factor.
* Please be aware that during lighting testing, the measured values and efficiencies may not be
stable since the power conversion efficiency fluctuates over time due to the emission of heat.
Lamp Current Measurement
Since lamp current flows inside of fluorescent tubes, normally it cannot be measured
directly. However, lamp current can be displayed by measuring secondary current
and cathode current and finding the difference in their instantaneous values using
the delta computation function (/DT option).
DC/AC
converter
Load
Solar cell module
Power Link
Example of Overview of a Photovoltaic Power Conditioner
• Related applications
Evaluation of power quality in equipment designed to be connected in a system,
such as UPSs and power conditioners
Measurement of Power Consumption in Mobile Phones
You can measure power consumption in mobile phones, batteries, and other
equipment powered by dry cells. You can perform a variety of operation tests for
reducing power consumption by using the current or power integration function. This
offers a powerful means of evaluating instruments, such as for checking control
modes for lengthening battery life.
Major Features
• 5mA range for very low current measurements
• Checking power consumption integration of mobile phones when switching modes
(using integration functions)
• Visually observing trends in power consumption using trend display functions that
allow checking of temporal fluctuations
• Checking the waveform of the consumed current
• Null function can be used to subtract the DC offset
Use the 2A input element for small current consumption.
Measure the DC voltage, DC current,
and power conversion efficiency
Since images can be saved, they can be pasted
as-is into reports as evaluation and test data.
Reference equipment for power calibration
• Basic power accuracy of ±0.02% of
reading
The WT3000 can be used as a reference
instrument for periodic in-house calibration of
general-purpose power measurement
instruments, such as the WT210 and WT230.
Temperature- and humidity-controlled
calibration room
Example of integration graph display
Current consumption in mobile phones
7
Precision Power Analyzer WT3000
SOFTWARE
Utility Software
WTViewer 760122
WTFileReader (free)
WTViewer is an application software tool that reads numeric, waveform, and
harmonic data measured with the WT3000 Precision Power Analyzer.
Communications:GP-IB, Serial (RS-232, /C2), USB(/C12), or Ethernet (/C7)
• Numeric Data
• Measuring Harmonics*
WTViewer can simultaneously display
voltage, current, power and various
other measured parameters for one to
four elements individually, and for ∑A
and ∑B calculations.
WTViewer can numerically or graphically
display the results of measured
harmonics up to the 100th order for such
parameters as voltage, current, power
and phase angle.
• Waveform
• Viewing Trends
Voltage and current waveforms can be
monitored on the PC screen. You can
confirm the voltage-current phase
difference, waveform distortion, and
other phenomena.
You can capture and view various data,
measured with the WT3000 on your PC
in a graphical trend format. This feature
lets you monitor power supply voltage
fluctuations, changes in current
consumption and other time-based
variations.
WT1600/WT3000 File Reader Software (off-line)
WTFileReader software can load and display data measured by the WT3000
Precision Power Analyzer or WT1600 Digital Powermeter that has been saved to a
memory medium. That data can also be saved in CSV format.
* requires / G6 option
Can be downloaded free from our Web site:
http://www.yokogawa.com/tm/wtpz/wtfree/tm-wtfree_04.htm
WTFileReader (free)
You can download this software program from our
web site
* LabVIEW is a registered trademark of National
Instruments Corporation.
Harmonic Measurement / Voltage Fluctuation and Flicker Measurement Software (761922)
• Harmonic Measurement (/G6 option)
The Harmonic Analysis Software (Model 761922) loads data measured by the
WT3000 and performs harmonic analysis that complies with IEC61000-3-2 edition
2.2. You can use the model 761922 harmonic measurement software to perform
harmonic measurement tests conforming to IEC 61000-4-7 edition 2 (window width is
10 cycles of 50 Hz and 12 cycles of 60 Hz) with WT3000.
Communications: GP-IB, Ethernet (/C7)
Harmonic Current Measurement Value List and Bar Graph
Enables PASS/FAIL evaluations of harmonic measurement results in line with
standard class divisions (A, B, C, D). Displays lists of measurement values, as well
as bar graphs that let you compare the measured value and standard limit value for
each harmonic component.
Measurement Mode
Three modes are available for harmonic
measurement.
• Harmonic observation: Lets you view
current, voltage, and phase angle for
each order in a bar graph.
• Waveform observation: Lets you view
measured signals to confirm the
suitability of the range and other factors.
• Harmonic measurement (standards
testing): For conducting standards tests
and making the associated judgments.
Efficiency is gained by performing tests
after checking the waveform in
Observation mode.
Harmonic bar graph display in harmonic
observation mode
• Flicker Measurement (/FL option)
This function enables voltage fluctuation
and flicker measurements in compliance
with EN61000-3-3 (Ed1:1995).
Low distortion
power supply
Tested product
* The flicker test can also be performed with the
WT3000 alone. Using the model 761922
harmonic/flicker measurement software (sold
separately), you can display trend graphs, CPF
graphs, or reports of the dc, dmax, and IFS
(instantaneous flicker sensation) values in
addition to the WT3000 judgment results.
Note) This software cannot communicate with the WT using a serial (RS-232) interface (/C2)
or USB port (PC) (/C12).
8
REAR PANEL
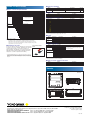
䉴 Rear Panel
Standard features
Optional features
Voltage input terminals
Current external sensor input terminals
Current direct input terminals
GP-IB port
BNC connector for two-system
synchronized measurement
Serial (RS-232) port (option/C2)
or USB port (PC) (option/C12)
Ethernet port(100BASE-TX/10BASE-T)
(option/C7)
VGA port (option/V1)
D/A output (option/DA)
Torque and speed input terminals
(motor version)
CHARACTERISTICS
䉴 Example of basic characteristics showing the WT3000’s high
precision and excellent stability
Total power error with rated range input
for an arbitrary power factor (50/60Hz, 30A input element)
Example of frequency versus power accuracy characteristic
20
1.000%
15
100 V/5A range
WT2000
Total Error (% of range)
Error (% of reading)
10
5
0.0
–5
–10
0.100%
WT3000
0.010%
–15
–20
10
100
1,000
10,000
Frequency (Hz)
100,000
0.001%
1,000,000
0.01
0.1
1
Power factor
Example of frequency characteristic
Effect of common mode voltage on reading value
15
10
100 V/5A range
10
8
5
Error (% of range)
Error (% of range)
0.01
0
-5
6
15 V range
500 mA range
4
2
0
-10
–2
-15
10
100
1,000
10,000
Frequency (Hz)
100,000
1,000,000
1
10,000
Frequency (Hz)
100,000
9
Precision Power Analyzer WT3000
ACCESSORIES
䉴 Related products
Current Sensor Unit
Current Transducer
Current Clamp on Probe
758917
758921
751521,751523
Current
Output
Current Sensor Unit
DC to 100kHz/600Apk
• Wide dynamic range:
-600 A to 0 A to +600 A (DC)/600 A peak (AC)
• Wide measurement frequency range:
DC to 100 kHz (-3 dB)
• High-precision fundamental accuracy:
±(0.05% of rdg + 40 µA)
• Superior noise withstanding ability and CMRR
characteristic due to optimized casing design
*751521/751523 do not conform to CE Marking
751574
Current
Output
Current Transducer
DC to 100 kHz/600Apk
• Wide measurement frequency range:
DC and up to 100 kHz (-3 dB)
• High-precision fundamental accuracy:
±(0.05% of reading + 40 µA)
• Wide dynamic range:
0-600 A (DC)/600 A peak (AC)
• ±15 V DC power supply, connector, and load resistor required.
For detailed information, see Power Meter Accessory Catalog Bulletin
7515-52E.
For detailed information, see Power Meter Accessory Catalog Bulletin
7515-52E.
751552
Current
Output
Current Clamp on Probe
AC1000Arms (1400Apeak)
• Measurement frequency range:
30 Hz to 5 kHz
• Basic accuracy: ±0.3% of reading
• Maximum allowed input:
AC 1000 Arms, max 1400 Apk (AC)
• Current output type: 1 mA/A
A separately sold fork terminal adapter set (758921), measurement
leads (758917), etc. are required for connection to WT3000. For detailed
information, see Power Meter Accessory Catalog Bulletin 7515-52E.
Adapters and Cables
758917
758922
758929
758923*1
758931*1
758921
Measurement leads
Small alligator adapters
Large alligator adapters
Safety terminal adapter set
Safety terminal adapter set
Fork terminal adapter
Two leads in a set. Use 758917
in combination with 758922 or
758929.
Total length: 75 cm
Rating: 1000 V, 32 A
For connection to measurement
leads (758917). Two in a set.
Rating: 300 V
For connection to measurement
leads (758917). Two in a set.
Rating: 1000 V
(spring-hold type) Two adapters
in a set.
Screw-fastened adapters. Two
adapters in a set. 1.5 mm Allen
wrench included for tightening.
Two adapters (red and black) to
a set. Used when attaching
banana plug to binding post.
Due to the nature of this product, it is possible to touch its
metal parts. Therefore, there is a risk of electric shock, so
the product must be used with caution.
701959
366924/25*2
B9284LK*3
Safety mini-clip set (hook Type) Conversion adapter
758924
BNC cable
External Sensor Cable
2 pieces (red and black) in one
set. Rating 1000V
(BNC-BNC 1m/2m)
For connection the external input
For connection to simultaneously of the WT3000 to current sensor.
measurement with 2 units, or for Length:50cm
input external trigger signal.
For conversion between male
BNC and female banana plug
*1 Maximum diameters of cables that can be connected to
the adapters
758923 core diameter: 2.5 mm or less;
sheath diameter: 4.8 mm or less
758931 core diameter: 1.8 mm or less;
sheath diameter: 3.9 mm or less
*2 Use with a low-voltage circuit (42V or less)
*3 The coax cable is simply cut on the current sensor side.
Preparation by the user is required.
Connecting Diagram
Connecting the Measurement Cables and Adapters
Equipment
under voltage
measurement
Connecting Diagram for Current Transducer
Equipment
undercurrent
measurement
701959
751574
Connector
B8200JQ
Load resistors
B8200JR
(4 in parallel)
Current Input
Terminal of
The Power Meter
Connecting Diagram for Clamp-on Probe
Equipment
under current
measurement
EXT Input
Terminal of
The Power Meter
758917
758921
758921
751552
758917
758922
DC source
758923
758929
Voltage Input
Terminal of
the Power Meter
Product
Part no.
Specifications
Output connector B8200JQ D-SUB 9-pin, with 2 screws
758931
Order quantity
1
10 Ω, 0.25 W × 4
Load resistors B8200JR Connect 4 in parallel to set
resistance to 2.5 Ω.
10
Current output
Accessories (sold separately)
1
Current Input
Terminal of
The Power Meter
* Don’t connect and use the current input terminal
and EXT terminal simultaneously.
SUPPORTS Crest Factor 6
The crest factor is the ratio of the waveform peak value and the RMS value.
waveform
peak
RMS value
waveform peak
RMS value
Crest factor
=
(CF, peak factor)
When checking the measurable crest factor of our power measuring instruments,
please refer to the following equation.
{measuring rangeCF setting (3 or 6)}
measured value (RMS)
Crest factor (CF) =
* However, the peak value of the measured signal must be less than or equal to the continuous maximum allowed input
* The crest factor on a power meter is specified by how many
times peak input value is allowed relative to rated input value.
Even if some measured signals exist whose crest factors are
larger than the specifications of the instrument (the crest
factor standard at the rated input), you can measure signals
having crest factors larger than the specifications by setting a
measurement range that is large relative to the measured
signal. For example, even if you set CF = 3, CF5 or higher
measurements are possible as long as the measured value
(RMS) is 60% or less than the measuring range. Also, for a
setting of CF = 3, measurements of CF = 300 are possible with
the minimum effective input (1% of measuring range).
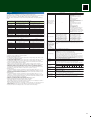
Comparison of Specifications and Functions in WT3000, Other WT Series Models, and PZ4000
Basic power accuracy (50/60 Hz)
Measurement power bandwidth
Input elements
WT3000
WT2000
WT1600
PZ4000
0.02% of reading + 0.04% of range
0.04% of reading + 0.04% of range
0.1% of reading + 0.05% of range
0.1% of reading + 0.025% of range
DC, 0.1 Hz to 1 MHz
DC, 2 Hz to 500 kHz (voltage, current) DC, 2 Hz to 300 kHz (power)
DC, 0.5 Hz to 1 MHz
DC, 0.1 Hz to 1 MHz
1, 2, 3, 4
1, 2, 3
1, 2, 3, 4, 5, 6
15/30/60/100/150/300/600/1000[V] (when crest factor is 3)
Voltage range
7.5/15/30/50/75/150/300/500[V] (when crest factor is 6)
Select from 0.5/1/2/5/10/20/30[A] or
Range
Direct input
Current range
Select from 0.25/0.5/1/2.5/5/10/15[A] or
Guaranteed accuracy range for voltage and current ranges
50m/100m/200m/500m/1/2/5/10[V] (when crest factor is 3)
25m/50m/100m/250m/500m/1/2.5/5[V] (when crest factor is 6)
1% to 130%
30/60/120/200/300/600/1200/2000[Vpk]
750m/1.5/3/5/7/5/15/30/50/75/150/300/500[V] (when crest factor is 6)
or 1/2/5/10/20/50[A] (when crest factor is 3)
5m/10m/25m/50m/100m/250m/500m/1/2.5[A]
5A module: 0.1/0.2/0.4/1/2/4/10[Apk] (5Arms)
20A module: 0.1/0.2/0.4/1/2/4/10[Apk] (5Arms)
1/2/4/10/20/40/100[Apk] (20Arms)
or 0.5/1/2.5/5/10/25[A] (when crest factor is 6)
50m/100m/200m[V] (for crest factors 3 and 6)
10% to 130%
50m/100m/250m/500m/1/2.5/5/10[V] (when crest factor is 3)
0.1/0.2/0.4/1[Vpk]
25m/50m/125m/250m/500m/1.25/2.5/5[V] (when crest factor is 6)
5% to 70%
1% to 110%
Voltage, current, active power, reactive power, apparent power, power factor, phase angle, peak voltage, peak current, crest factor
Main measurement parameters
Peak hold (instantaneous maximum value hold)
✓
✓
✓
MAX hold
✓
✓
✓
Voltage RMS/MEAN simultaneous measurement
✓
(custom-made)
✓
✓
RMS/MEAN/AC/DC simultaneous measurement
✓ (ASSP)
✓
✓
✓ (user-defined function)
✓(user-defined function)
Mean active power
Active power amount (WP)
Measurement
Apparent power amount (WS)
parameters
Reactive power amount (WQ)
✓
✓
✓
✓
✓
Frequency
2 channels (up to 8 channels with option /FQ)
One from voltages or currents on installed input elements
Up to three from voltages or currents on installed input elements
All installed voltages and currents (up to 8 channels)
Efficiency
✓
✓
✓
✓
Phase angle between phases (fundamental wave)
Motor evaluation
(/G6)(opt.)
✓
✓
Torque, rotating speed input (motor version)(opt.)
Torque and rotational velocity input(opt.)
Torque and rotational velocity input (requires sensor input module 253771)(opt.)
✓ (4)
✓ (4)
✓
FFT spectral analysis
(/G6)(opt.)
User-defined functions
✓ (20 functions)
Voltage, current, power
600,000
50,000
60,000
99,999 or 999,999
Power amount, current amount
999,999
500,000
999,999
No integration function
99,999
199,999
99,999
99,999
8.4-inch TFT color LCD
7-segment display
6.4-inch TFT color LCD
6.4-inch TFT color LCD
Numerical values, waveforms, trends, bar graphs, vectors
Numerical values (4 values)
Numerical values, waveforms, trends, bar graphs, vectors
Numerical values, waveforms, trends, bar graphs,vectors, X-Y
Approximately 200 kS/s
Approximately 110 kS/s
Approximately 200 kS/s
Maximum 5 MS/s
Harmonic measurement
(/G6)(opt.)
(opt.)
✓
✓
Harmonic measurement in normal measurement mode
(/G6)(opt.)
IEC standards-compliant harmonic measurement
(/G6)(opt.)(10cycle/50Hz, 12cycle/60Hz)
(opt.)(16cycle)
(/FL)(opt.)
(opt.)
✓(diff are not supported)
✓
Frequency
Display
Display
1/2/5/10/20/30 [A] (for crest factors 3 and 6)
1, 2, 3, 4
1.5/3/6/10/15/30/60/100/150/300/600/1000[V] (when crest factor is 3)
Select from 10m/20m/50m/100m/200m/500m/1/2/5[A]
5m/10m/20m/50m/100m/200m/500m/1/2 [A] (when crest factor is 3)
2.5/5m/10m/25m/50m/100m/250m/500m/1 [A] (when crest factor is 6)
External sensor
input
Display
resolution
10/15/30/60/100/150/300/600[V] (for crest factors 3 and 6)
Display format
Sampling frequency
Flicker measurement
Measurement/
Cycle by cycle measurement
functions
Compensation function
Delta calculation function
DA output
Synchronized operation
(/CC)(opt.)
✓
(/DT)(opt.)
20 channels (/DA)(opt.)
14 channels
30 channels(opt.)
✓
✓
✓
None, but acquisition memory has 100 kW/channel
Storage (internal memory for storing data)
Approximately 11MB
approximately 30MB
(up to 4 MW/channel can be installed with option)
Other
features
Interfaces
GP-IB; RS-232 (/C2)(opt.); USB (/C12)
VGA output (/V1)(opt.); Ethernet (/C7)(opt.)
Communication command compatibility
Communication command standards
Data updating interval
Removable storage
Printer
GP-IB or RS-232;
GP-IB; RS-232;
SCSI(opt.); Ethernet(opt.); VGA output
Centronics; SCSI(opt.)
GP-IB or RS-232
None (communication commands vary from product to product)
Commands in IEEE488.2 standard
IEEE standard 488.2 or earlier command system and IEEE488.2 commands
Commands in IEEE488.2 standard
Commands in IEEE488.2 standard
50m/100m/250m/500m/1/2/5/10/20[S]
250m/500m/2[S]
50m/100m/200m/500m/1/2/5[S]
Depends on waveform acquisition length and calculations
FDD
FDD
Built-in printer (front side)(opt.)
Built-in printer (front side)(opt.)
Built-in printer (top side)(opt.)
PC card interface; USB (/C5)(opt.)
Built-in printer (front side) (/B5)(opt.)
There are limitations on some specifications and functions. See the individual product catalogs for details.
(opt.):Optional
11
Precision Power Analyzer WT3000
WT3000 SPEC
WT3000 Specifications
Inputs
Item
Input terminal type
Specification
Voltage
Plug-in terminal (safety terminal)
Current
• Direct input: Large binding post
• External sensor input: Insulated BNC connector
Input type
Voltage
Floating input, resistive potential method
Current
Floating input, shunt input method
Measurement range
Voltage
(rated value)
15 V, 30 V, 60 V, 100 V, 150 V, 300 V, 600 V, 1000 V (for crest
factor 3)
7.5 V, 15 V, 30 V, 50 V, 75 V, 150 V, 300 V, 500 V (for crest factor
6)
Current (2A input element)
• Direct input:
5mA, 10mA, 20mA, 50mA, 100mA, 200mA, 500mA, 1A, 2A (for
crest factor 3)
2.5mA, 5mA, 10mA, 25mA, 50mA, 100mA, 250mA, 500mA, 1A
(for crest factor 6)
• External sensor input:
50 mV, 100 mV, 200 mV, 500 mV, 1 V, 2 V, 5 V, and 10 V (for
crest factor 3)
25 mV, 50 mV, 100 mV, 250 mV, 500 mV, 1 V, 2.5 V, and 5 V (for
crest factor 6)
Current (30A input element)
• Direct input:
500 mA, 1 A, 2 A, 5 A, 10 A, 20 A, and 30 A (for crest factor 3)
250 mA, 500 mA,1 A, 2.5 A, 5 A, 10 A, and 15 A (for crest factor
6)
• External sensor input:
50 mV, 100 mV, 200 mV, 500 mV, 1 V, 2 V, 5 V, and 10 V (for
crest factor 3)
25 mV, 50 mV, 100 mV, 250 mV, 500 mV, 1 V, 2.5 V, and 5 V (for
crest factor 6)
Input impedance
Voltage
Input resistance: Approx. 10 MΩ, input capacitance: Approx. 5 pF
Current (2A input element)
• Direct input: Approx. 500 mΩ + approx. 0.07 µ H
• External sensor input: Input resistance: Approx. 1 MΩ, input
capacitance: Approx. 40 pF
Current (30A input element)
• Direct input: Approx. 5.5 mΩ + approx. 0.03 µ H
• External sensor input: Input resistance: Approx. 1 MΩ, input
capacitance: Approx. 40 pF
Instantaneous maximum Voltage
allowable input
Peak value of 2500 V or RMS value of 1500 V, whichever is less.
(1s or less)
Current (2A input element)
• Direct input: Peak value of 9 A or RMS value of 3 A, whichever is
less.
• External sensor input: Peak value less than or equal to 10 times
the measurement range.
Current (30A input element)
• Direct input: Peak value of 150 A or RMS value of 50 A,
whichever is less.
• External sensor input: Peak value less than or equal to 10 times
the measurement range.
Continuous maximum Voltage
allowable input
Peak value of 1600 V or RMS value of 1100 V, whichever is less.
Current (2A input element)
• Direct input: Peak value of 6 A or RMS value of 2.2 A, whichever
is less.
• External sensor input: Peak value less than or equal to 5 times
the measurement range.
Current (30A input element)
• Direct input: Peak value of 90 A or RMS value of 33 A, whichever
is less.
• External sensor input: Peak value less than or equal to 5 times
the measurement range.
Continuous maximum common mode voltage (50/60 Hz)
1000 Vrms
Influence from common mode voltage
Apply 1000 Vrms with the voltage input terminals shorted and the
current input terminals open.
• 50/60 Hz: ±0.01% of range or less
• Reference value up to 200 kHz
Voltage:
±3/range × f% of range or less. However, 3% or less.
Current direct input and current sensor input:
± (max. range/range)× 0.001 × f% of range or less.
However, 0.01% or more. The units of f are kHz. The max. range
within equations is 30 A or 2 A or 10 V.
12
Line filter
Frequency filter
A/D converter
Select OFF, 500 Hz, 5.5 kHz, or 50 kHz.
Select OFF, or ON
Simultaneous voltage and current conversion and 16-bit resolution.
Conversion speed (sampling rate): Approximately 5 µs. See
harmonic measurement items for harmonic display.
Can be set for each input element.
Increasing range value
• When the measured values of U and I exceed 110% of the range
rating
• When the peak value exceeds approximately 330% of the range
rating (or approximately 660% for crest factor 6)
Decreasing range value
• When the measured values of U and I fall to 30% or less of the
range rating, and Upk and Ipk are 300% or less of the lower
range value (or 600% for crest factor 6)
Range switching
Auto range functions
Display
Display
8.4-inch color TFT LCD monitor
Total number of pixels* 640 (horiz.) x 480 (vert.) dots
Waveform display resolution
501 (horiz.) x 432 (vert.) dots
Same as the data update rate.
Exceptions are listed below.
• The display update interval of numeric display (4, 8, and 16 items) is 250 ms when the
data update rate is 50 ms or 100 ms.
• The display update interval of numeric display (ALL, Single List, and Dual List) is 500 ms
when the data update rate is 50 ms to 250 ms.
• The display update rate of the trend display, bar graph display, and vector display is 1 s
when the data update rate is 50 ms to 500 ms.
• The display update interval of the waveform display is approximately 1 s when the data
update rate is 50 ms to 1 s. However, it may be longer depending on the trigger setting.
* Up to 0.02% of the pixels on the LCD may be defective.
Calculation Functions
UΣ
IΣ
[V]
[A]
PΣ
SΣ
[W]
[VA]
3 phase, 3 wire
Single-phase, 3 phase, 3 wire
(3 voltage 3 current)
3 wire
(U1+U2+U3)/3
(U1+U2)/2
(I1+I2+I3)/3
(I1+I2)/2
QΣ
[var]
TYPE1
TYPE2
PcΣ
WPΣ
WP+Σ
WP–Σ
qΣ
q+Σ
q–Σ
[W]
[Wh]
[Wh]
[Wh]
[Ah]
[Ah]
[Ah]
WQΣ
[varh]
WSΣ
[VAh]
P1+P2+P3
P1+P2
TYPE1, S1+S2
TYPE2
TYPE3
3 phase, 4 wire
3
(S1+S2)
2
3
(S1+S2+S3)
3
S1+S2+S3
PΣ2+QΣ2
Q1+Q2
Q1+Q2+Q3
SΣ2–PΣ2
TYPE3 Q1+Q2
Pc1+Pc2
WP1+WP2
WP+1+WP+2
WP–1+WP–2
q1+q2
q+1+q+2
q–1+q-2
1
Q1+Q2+Q3
Pc1+Pc2+Pc3
WP1+WP2+WP3
WP+1+WP+2+WP+3
WP-1+WP-2+WP-3
q1+q2+q3
q+1+q+2+q+3
q-1+q-2+q-3
N
Σ | QΣ(n) | ×Time
N n=1
QΣ(n) is the nth reactive power Σ function , and N is the number of data updates.
λΣ
1 N
Σ SΣ(n)×Time
N n=1
SΣ(n) is the nth apparent power Σ function, and N is the number of data updates.
PΣ
SΣ
ØΣ
[˚]
cos-1 (
PΣ
)
SΣ
Note1) The instrument’s apparent power (S), reactive power (Q), power factor (l), and phase
angle (Ø) are calculated using measured values of voltage, current, and active power.
(However, reactive power is calculated directly from sampled data when TYPE3 is
selected.) Therefore, when distorted waveforms are input, these values may be different
from those of other measuring instruments based on different measuring principals.
Note 2) The value of Q in the QΣ calculation is calculated with a preceding minus sign (-) when
the current input leads the voltage input, and a plus sign when it lags the voltage input,
so the value of QΣ may be negative.
η [%]
Set a efficiency calculation up to 4
User-defined functions
F1–F20
Create equations combining measurement function symbols, and calculate up to
twenty numerical data.
Waveform Display (WAVE display)
Waveform display items
Voltage and current from elements 1 through 4
Motor version torque and waveform of revolution speed
Accuracy
Voltage/current
[Conditions] *These conditions are all accuracy condition in this section.
Temperature: 23±5°C, Humidity: 30 to 75%RH, Input waveform: Sine wave, Common mode
voltage:0 V, Crest factor: 3, Line filter: OFF, λ (power factor): 1, After warm-up.
After zero level, compensation or range value change while wired. f is frequency (kHz), 6month
30A input element, 2A input element (500mA, 1A, 2A range), Voltage input
Voltage/current
DC
Power
0.05% of reading+0.05% of range (U, 30A, Sensor) 0.05% of reading+0.1% of range
0.05% of reading+0.05% of range+2uA (2A) 0.05% of reading+0.1% of range+2µAU reading (2A)
0.1Hzf30Hz
0.1% of reading+0.2% of range
0.2% of reading+0.3% of range
30Hzf45Hz
0.03% of reading+0.05% of range
0.05% of reading+0.05% of range
45Hzf66Hz
0.01% of reading+0.03% of range
0.02% of reading+0.04% of range
66Hzf1kHz
0.03% of reading+0.05% of range
0.05% of reading+0.05% of range
1kHzf10kHz
0.1% of reading+0.05% of range
0.15% of reading+0.1% of range
10kHzf50kHz
0.3% of reading+0.1% of range
0.3% of reading+0.2% of range
50kHzf100kHz
0.012f% of reading+0.2% of range
0.014f% of reading+0.3% of range
100kHzf500kHz
0.009f% of reading+0.5% of range
0.012f% of reading+1% of range
500kHzf1MHz
(0.022f–7)% of reading+1% of range
(0.048f–19)% of reading+2% of range
U: Voltage, sensor: external sensor input, 2A: 500mA, 1A, 2A range of 2A direct current input, 30A: 30A direct current input
2A input element (5mA, 10mA, 20mA, 50mA, 100mA, 200mA range)
Current
DC
Power
0.05% of reading+0.05% of range (sensor)
0.05% of reading+0.1% of range (sensor)
0.05% of reading+0.05% of range+2uA (direct)
0.05% of reading+0.1% of range+2uAV reading (direct)
0.1Hzf30Hz
0.1% of reading+0.2% of range
0.2% of reading+0.3% of range
30Hzf45Hz
0.03% of reading+0.05% of range
0.05% of reading+0.05% of range
45Hzf66Hz
0.03% of reading+0.05% of range
0.05% of reading+0.05% of range
66Hzf1kHz
0.03% of reading+0.05% of range
0.05% of reading+0.05% of range
1kHzf10kHz
0.1% of reading+0.05% of range
0.15% of reading+0.1% of range
10kHzf50kHz
0.3% of reading+0.1% of range
0.3% of reading+0.2% of range
50kHzf100kHz
0.012f% of reading+0.2% of range
0.014f% of reading+0.3% of range
100kHzf500kHz
0.009f% of reading+0.5% of range
0.012f% of reading+1% of range
500kHzf1MHz
(0.022f–7)% of reading+1% of range
(0.048f–19)% of reading+2% of range
U: Voltage, sensor: external sensor input, direct: direct current input
* The units of f in the reading error equation are kHz.
30A input element/2A input element
• For temperature changes after zero level compensation or range change, add 0.2mA/°C to the
DC accuracy of the 30A input element.
• For temperature changes after zero level compensation or range change, add 2uA/°C to the DC
accuracy of the 2A input element.
• For temperature changes after zero-level compensation or range change on the external
current sensor input, add 0.02 mV/°C to the DC accuracy of the external current sensor input.
• Accuracy of waveform display data, Upk and Ipk
Add 3% of range to the accuracy above. However, add 3% of range +5mV for external
input(reference value). Effective input range is within ±300% (within ±600% for crest factor 6)
• Influenced by changes in temperature after zero level correction or range value changes.
Add 50ppm of range/°C to the voltage DC accuracy, 0.2 mA/°C to the 30A input current DC
accuracy, 3µA/°C to the 2A current accuracy, 0.02 mV/°C to the external current DC accuracy,
and influence of voltage times influence of current to the power DC accuracy.
30A input element
For self-generated heat caused by current input on an DC input signal, add 0.00002 I2% of
reading + 3 I2uA to the current accuracy. I is the current reading (A). The influence from selfgenerated heat continues until the temperature of the shunt resistor inside the WT3000 lowers
even if the current input changes to a small value.
2A input element
For self-generated heat caused by current input on an DC input signal, add 0.004 I2% of
reading + 6 I2uA to the current accuracy. I is the current reading (A). The influence from selfgenerated heat continues until the temperature of the shunt resistor inside the WT3000 lowers
even if the current input changes to a small value.
• Additions to accuracy according to the data update rate
Add 0.05% of reading when it is 100 ms, and 0.1% of reading when 50ms.
• Range of guaranteed accuracy by frequency, voltage, and current
All accuracies between 0.1 Hz and 10 Hz are reference values.
If the voltage exceeds 750 V at 30 kHz–100 kHz, or exceeds {2.2 x 10⁴/ f(kHz)}V at 100 kHz–1
MHz, the voltage and power values are reference values.
If the current exceeds 20 A at DC, 10 Hz–45Hz, or 400 Hz–200 kHz; or if it exceeds 10 A at 200
kHz–500 kHz; or exceeds 5 A at 500 kHz–1 MHz, the current and power accuracies are
reference values.
• Accuracy for crest factor 6: Range accuracy of crest factor 3 for two times range.
Total power error with
respect to the range for
an arbitrary power
factor λ (exclude λ = 1)
—
Power
When λ=0 (500mA to 30A range)
Apparent power reading×0.03% in the 45
to 66 Hz range
All other frequencies are as follows
(however, these are only reference
values):
Apparent power reading×
(0.03+0.05×f(kHz))%
When λ=0 (5mA to 200mA range)
Apparent power reading×0.1% in the 45
to 66 Hz range
All other frequencies are as follows
(however, these are only reference
values):
Apparent power reading×
(0.1+0.05×f(kHz))%
0 < λ < 1 (45 Hz to 66 Hz)
(Power reading) × [(power reading error
%) + (power range error %) × (power
range /apparent power indication value) +
[tanϕ × (influence when λ = 0) %}. ϕ is the
phase angle between the voltage and
current.
When cutoff frequency is 500 Hz
When cutoff frequency is 500 Hz
"45 to 66Hz: Add 0.2% of reading
"45 to 66Hz: Add 0.3% of reading
Under 45 Hz: Add 0.5% of reading"
Under 45 Hz: Add 1% of reading"
When cutoff frequency is 5.5 kHz
When cutoff frequency is 5.5 kHz
Influence of line filter
"66Hz or less: Add 0.2% of reading
"66Hz or less: Add 0.3% of reading
66 to 500Hz: Add 0.5% of reading"
66 to 500Hz: Add 1% of reading"
When cutoff frequency is 50 kHz
When cutoff frequency is 50 kHz
"500Hz or less: Add 0.2% of reading
"500Hz or less: Add 0.3% of reading
500 to 5kHz: Add 0.5% of reading"
500 to 5kHz: Add 1% of reading"
The phase lead and lag are detected correctly when the voltage and current signals
Lead/Lag Detection (d
(LEAD)/G (LAG) of the are both sine waves, the lead/lag is 50% of the range rating (or 100% for crest factor
6), the frequency is between 20 Hz and 10 kHz, and the phase angle is ± (5˚ to 175˚)
phase angle and
symbols for the reactive or more.
power Q∑ calculation)
* The s symbol shows
the lead/lag of each
element, and "-"
indicates leading.
Temperature coefficient ±0.02% of reading/˚C at 5–18˚ or 28–40 ˚C.
Udc and Idc are 0 to ±130% of the measurement range
Urms and Irms are 1 to 130%* of the measurement range (or 2%–130% for crest
factor 6)
Umn and Imn are 10 to ±130% of the measurement range
Urmn and Irmn are 10 to ±130%* of the measurement range
Power is 0 to ±130%* for DC measurement, 1 to 130%* of the voltage and current
Effective input range
range for AC measurement, and up to ±130%* of the power range.
However, when the data update rate is 50 ms, 100 ms, 5 sec, 10 sec, or 20 sec, the
synchronization source level falls below the input signal of frequency measurement.
* 110% for maximum range of direct voltage and current inputs. The accuracy at 110
to 130% of the measurement range is the reading error ×1.5.
Max. display
140% of the voltage and current range rating
Urms and Irms are up to 0.3% relative to the measurement range (or up to 0.6% for a
crest factor of 6).
Min. display
Umn, Urmn, Imn, and Irmn are up to 2% (or 4% for a crest factor of 6).
Below that, zero suppress. Current integration value q also depends on the current
value.
Data update rate
50ms 100ms 250ms 500ms 1s
2s
5s
10s
20s
Measurement lower
Measurement lower 45Hz 25Hz 20Hz 10Hz 5Hz 2Hz 0.5Hz 0.2Hz 0.1Hz
limit frequency
limit frequency
Accuracy of apparent
Voltage accuracy + current accuracy
power S
Accuracy of
Accuracy of apparent power
reactive power Q
+( (1.0004–λ2) – (1–λ2) ) ×100% of range
± [(λ–λ/1.0002)+ |cosØ–cos{Ø+sin-1(influence of power factor of power when
Accuracy of power factor
λ=0%/100)}|] ±1digit when voltage and current is at rated input of the measurement
λ
range. Ø is the phase difference of voltage and current.
Accuracy of phase
± [|Ø–cos-1 (λ/1.0002)| + sin–1 {(influence of power factor of power when λ=0%)/100}]
difference Ø
deg ±1digit when voltage and current is at rated input of the measurement range
One-year accuracy
Add the accuracy of reading error (Six-month) × 0.5 to the accuracy
six-month
13
Precision Power Analyzer WT3000
Functions
Measurement method
Crest factor
Digital multiplication method
3 or 6 (when inputting rated values of the measurement
range), and 300 relative to the minimum valid input. However,
1.6 or 3.2 at the maximum range (when inputting rated values
of the measurement range), and 160 relative to the minimum
valid input.
Measurement period
Interval for determining the measurement function and
performing calculations.
Period used to determine and compute the measurement
function.
• The measurement period is set by the zero crossing of the
reference signal (synchronization source) when the data
update interval is 50 ms, 100 ms, 5 s, 10 s, or 20 s (excluding
watt hour WP as well as ampere hour q during DC mode).
• Measured through exponential averaging on the sampled
data within the data update interval when the data update
interval is 250 ms, 500 ms, 1 s, or 2 s.
• For harmonic measurement, the measurement period is from
the beginning of the data update interval to 9000 points at the
harmonic sampling frequency.
Wiring
You can select one of the following five wiring settings.
1P2W (single phase, two-wire), 1P3W (single phase, 3 wire),
3P3W (3 phase, 3 wire), 3P4W (3 phase, 4 wire),
3P3W(3V3A) (3 phase, 3 wire, 3 volt/3 amp measurement).
However, the number of available wiring settings varies
depending on the number of installed input elements. Up to
four, or only one, two, or three wiring settings may be
available.
Compensation Functions
• Efficiency Compensation
Compensation of instrument loss during efficiency calculation
• Wiring Compensation
Compensation of instrument loss due to wiring
• 2 Wattmeter Method Compensation (/DT option)
Compensation for 2 wattmeter method
Scaling
When inputting output from external current sensors, VT, or
CT, set the current sensor conversion ratio, VT ratio, CT ratio,
and power coefficient in the range from 0.0001 to 99999.9999.
Input filter
Line filter or frequency filter settings can be entered.
Averaging
• The average calculations below are performed on the normal
measurement parameters of voltage U, current I, power P,
apparent power S, reactive power Q. Power factor l and
phase angle Ø are determined by calculating the average of P
and S.
Select exponential or moving averaging.
• Exponential average
Select an attenuation constant of 2, 4, 8, 16, 32, or 64.
• Moving average
Select the number of averages from 8, 16, 32, 64, 128, or 256.
• The average calculations below are performed on the
harmonic display items of voltage U, current I, power P,
apparent power S, reactive power Q. Power factor l is
determined by calculating the average of P and Q.
Only exponential averaging is performed. Select an
attenuation constant of 2, 4, 8, 16, 32 or 64
Data update rate
Select 50 ms, 100 ms, 250 ms, 500 ms, 1 s, 2 s, 5 s, 10 s, or
20 s.
Response time
At maximum, two times the data update rate (only during
numerical display)
Hold
Holds the data display.
Single
Executes a single measurement during measurement hold.
Zero level compensation/Null Compensates the zero level.
Integration
Mode
Timer
Count over
Accuracy
Time accuracy
Remote control
Select a mode of Manual, Standard, Continuous (repeat),
Real Time Control Standard, or Real Time Control Continuous
(Repeat).
Integration can be stopped automatically using the integration
timer setting. 0000h00m00s~10000h00m00s
If the count over integration time reaches the maximum
integration time (10000 hours), or if the integration value
reaches max/min display integration value (±999999 M), the
elapsed time and value is saved and the operation is stopped.
± [power accuracy (or current accuracy) + time accuracy]
± 0.02% of reading
EXT START, EXT STOP, EXT RESET, EXT HOLD, EXT
SINGLE and EXT PRINT (all input signal) / INTEG BUSY
(output signal). Requires /DA option.
• Numerical display function
Display resolution
600000
Number of display items
Select 4, 8, 16, all, single list, or dual list.
14
501
Peak-peak compressed data
Range from 0.5 ms–2 s/div. However, it must be 1/10th of the
data update rate.
Edge type
Select Auto or Normal. Triggers are turned OFF automatically
during integration.
Select voltage, current, or external clock for the input to each
input element.
Select (Rising), (Falling), or (Rising/Falling).
When the trigger source is the voltage or current input to the
input elements. Set in the range from the center of the screen
to ±100% (top/bottom edge of the screen). Setting resolution:
0.1%
When the trigger source is Ext Clk, TTL level.
Voltage and current input to the waveform vertical axis zoom
input element can be zoomed along the vertical axis.
Set in the range of 0.1 to 100 times.
ON/OFF can be set for each voltage and current input to the
input element.
You can select 1, 2, 3 or 4 splits for the waveform display.
Select dot or linear interpolation.
Select graticule or cross-grid display.
Upper/lower limit (scale value), and waveform label ON/OFF.
When you place the cursor on the waveform, the value of that
point is measured.
Trigger Source
Trigger Slope
Trigger Level
Vertical axis Zoom
ON/OFF
Format
Interpolation
Graticule
Other display ON/OFF
Cursor measurements
Zoom function
No time axis zoom function
* Since the sampling frequency is approximately 200 kHz, waveforms that can be
accurately reproduced are those of about 10 kHz.
• Vector Display/Bar Graph Display
Vector display
Vector display of the phase difference in the fundamental
waves of voltage and current.
Bar graph display
Displays the size of each harmonic in a bar graph.
• Trend display
Number of measurement channels Up to 16 parameters
Displays trends (transitions) in numerical data of the
measurement functions in a sequential line graph.
• Simultaneous display
Two windows can be selected (from numerical display,
waveform display, bar graph display, or trend display) and
displayed in the upper and lower parts of the screen.
Saving and Loading Data
Settings, waveform display data, numerical data, and screen image data can be saved to
media.*
Saved settings can be loaded from a medium.
* PC card, USB memory (/C5 option)
Store function
Internal memory size
Approximately 30 MB
Store interval (waveform OFF) Maximum 50msec to 99 hour 59 minutes 59 seconds.
Guideline for Storage Time (Waveform Display OFF, Integration Function OFF)
Number of
measurement
channels
Measured Items
(Per CH)
Storage Interval
Storable Amnt. of Data
2ch
2ch
4ch
4ch
3
10
10
20
50 ms
1 sec
50 ms
1 sec
Approx. 10 hr 20 m
Approx. 86 hr
Approx. 2 hr 30 m
Approx. 24 hr
Note: Depending on the user-defined math, integration, and other settings, the actual
measurement time may be shorter than stated above.
Store function can’t use in combination with auto print function.
Motor Evaluation Function (-MV, Motor Version)
Measurement Function
Method of Determination, Equation
Rotating speed
When the input signal from the revolution sensor is DC voltage (analog signal)
Input voltage from revolution sensor x scaling factor
Scaling factor: Number of revolutions per 1 V input voltage
When the input signal from the revolution sensor is number of pulses
Number of input pulses from revolution sensor per minute
Number of pulses per rotation
Torque
SyncSp
Display
• Waveform display items
No. of display rasters
Display format
Time axis
Triggers
Trigger Type
Trigger Mode
Slip[%]
Motor output
Pm
×Scaling factor
When the type of input signal from the torque meter is DC voltage (analog signal)
Input voltage from torque meter x scaling factor
Scaling factor: Torque per 1 V input voltage
When the type of input signal from the torque is number of pulses
Enter N·m equivalent to upper- and lower-limit frequencies to determine an
inclination from these two frequencies, and then multiply the number of pulses.
120 x freq. of the freq. meas. source
motor’s number of poles
SyncSp-Speed
×100
SyncSp
2π×Speed×Torque
×scaling factor
60
Integrated Value
Revolution signal, torque signal
• When revolution and torque signals are DC voltage (analog input)
Connector type
Insulated BNC connector
Input range
1 V,2 V,5 V,10 V,20 V
Effective input range
0%–±110% of measurement range
Input resistance
Approximately 1 MΩ
Continuous maximum allowed input ±22 V
Continuous maximum common mode voltage ±42 Vpeak or less
Accuracy
±(0.1% of reading+0.1% of range)
Temperature coefficient
±0.03% of range/°C
• When revolution and torque signals are pulse input
Connector type
Insulated BNC connector
Frequency range
2 Hz–200 kHz
Amplitude input range
±12 Vpeak
Effective amplitude
1 V (peak-to peak) or less
Input waveform duty ratio
50%, square wave
Input resistance
Approximately 1 MΩ
Continuous maximum common mode voltage ±42 Vpeak or less
Accuracy
±(0.05% of reading+1mHz)
D/A output
Approx. 7.0 V
5.0V
Other Items
Printing method
Dot density
Paper width
Effective recording width
Recorded information
Auto print function
Displayed value [%]
Approx. –7.0 V
Approx. –7.5 V
Item
Measured source
Format
Frequency range
PLL source
U1, U2, U3: Line voltage that can be computed for a three phase,
U1, U2, U3: Neutral line voltage that can be computed for a threephase, four-wire system
I1: Differential current determined by computation
Phase current that are not measured but can be computed
FFT data length
FFT processing word
length
Window function
Anti-aliasing filter
Neutral line current
D/A Output (/DA Optional)
D/A conversion resolution
Output voltage
Update rate
Number of outputs
Accuracy
16 bits
±5 V FS (max. approximately ±7.5 V) for each rated value
Same as the data update rate on the main unit.
20 channels (each channel can be set separately)
± (accuracy of a given measurement function + 0.1% of FS)
FS = 5V
D/A zoom
Setting maximum and minimum values.
Continuous maximum common mode voltage ±42Vpeak or less
Minimum load
100 kΩ
Temperature coefficient
±0.05% of FS/°C
Remote control
EXT START, EXT STOP, EXT RESET, EXT HOLD, EXT
SINGLE and EXT PRINT (all input signal) / INTEG BUSY
(output signal) Requires /DA option
Frequency (Simplified Figure Below)
D/A output
Approx. 7.5 V
15-pin D-Sub (receptacle)
VGA compatible
Advanced Calculation (/G6 optional)
three-wire (3V3A) system
Neutral line current
Thermal line-dot
8 dots/mm
112 mm
104 mm
Screenshots, list of measured values, harmonic bar graph
printouts, settings
Measured values are printed out automatically.
However, auto print function can’t use in combination with
store function.
• Wide Bandwidth Harmonic Measurement
phase, three-wire system
Specifications
All installed elements
PLL synchronization method (when the PLL source is not set to
Smp Clk) or external sampling clock method (when the PLL source
is set to Smp Clk)
• PLL synchronization method
Fundamental frequency of the PLL source is in the range of 10
Hz to 2.6 kHz.
• External sampling clock method
Input a sampling clock signal having a frequency that is 3000
times the fundamental frequency between 0.1 Hz and 66 Hz of
the waveform on which to perform harmonic measurement. The
input level is TTL. The input waveform is a rectangular wave with
a duty ratio of 50%.
• Select the voltage or current of each input element (external
current sensor range is greater than or equal to 500 mV) or the
external clock (Ext Clk or Smp Clk).
• Input level
Greater than or equal to 50% of the measurement range rating
when the crest factor is 3
Greater than or equal to 100% of the measurement range rating
when the crest factor is 6
• Turn the frequency filter ON when the fundamental frequency is
less than or equal to 440 Hz.
9000
32 bits
Rectangular
Set using a line filter (OFF, 500 Hz, 5.5 kHz, or 50 kHz).
Sample rate (sampling frequency), window width, and upper limit of measured order
PLL source synchronization method
Fundamental
Sample Rate
Window Width against
Upper Limit of the
Frequency of the
(S/s)
the FFT Data Length
Measured Order
PLL Source
(Frequency of the
(Hz)
Fundamental Wave)
10 to 20
f × 3000
3
100
20 to 40
f × 1500
6
100
40 to 55
f × 900
10
100
55 to 75
f × 750
12
100
75 to 150
f × 450
20
50
150 to 440
f × 360
25
50
440 to 1100
f × 150
60
50
1100 to 2600
f × 60
150
20
External sampling clock method
5.0V
2.5V
0.5V
0.5Hz 1Hz
100140
RGB Video Signal (VGA) Output Section (/V1 Optional)
Connector type
Output format
U1: Line voltage that are not measured but can be computed for a three-
DELTA→STAR
STAR→DELTA
0
–5.0 V
Built-in Printer (/B5 Optional)
U1: Differential voltage determined by computation u1 and u2
Current (A) difference
3P3W→3V3A
–140–100
Note that PF and deg are not output beyond the range of ±5.0 V.
If an error occurs, approximately ±7.5 V are output.
0° to 360° are output at 0 to 5.0 V; LAG180° to LEAD180° are
output at -5.0 V to 5.0 V.
Specifications
STAR→DELTA
Integration time
D/A output
Approx. 7.5 V
Approx. 7.0 V
5.0 V
Output
Approx. 7.0 V
5.0 V
0V
–5.0 V
Approx. –7.0 V
Displayed Value
140%
100%
0%
–100%
–140%
Delta Calculation Function (/DT Optional)
DELTA→STAR
to
t0:Rated time of integrated D/A output for manual integration mode,
specified time of timer for normal integration and repetitive
(continuous) integration modes
Added Frequency Measurement (/FQ Optional)
Item
Rated input
0
Device under measurement Select up to two frequencies of the voltage or current input to
the input elements for measurement. If the frequency option (/
FQ) is installed, the frequencies of the voltages and currents
being input to all input elements can be measured.
Measurement method
Reciprocal method
Measurement range
Data Update Rate
Measuring Range
50ms
45Hzf1MHz
100ms
25Hzf1MHz
250ms
10Hzf500kHz
500ms
5Hzf200kHz
1s
2.5Hzf100kHz
2s
1.5Hzf50kHz
5s
0.5Hzf20kHz
10s
0.25Hzf10kHz
20s
0.15Hzf5kHz
Accuracy
±0.05% of reading
When the input signal levels are greater than or equal to 25
mV (current external sensor input), 1.5mA (current direct input
of 2A input element) and 150 mA (current direct input of 30A
input element) respectively, and the signal is greater than or
equal to 30% (0.1 Hz–440 Hz, frequency filter ON), 10% (440
Hz–500 kHz), or 30% (500 kHz–1 MHz) of the measurement
range. However, when the measuring frequency is smaller or
equal to 2 times of above lower frequency, the input signal is
greater than or equal to 50%.
Add 0.05% of reading when current external input is smaller
than or equal to 50 mV input signal level for each is double for
crest factor 6.
Voltage(V) difference
3P3W→3V3A
Input that is 140% of the rating
10Hz 100Hz 1kHz 10kHz 100kHz 1MHz
Displayed value
Fundamental
Frequency of the
PLL Source
(Hz)
0.1 to 66
Sample Rate
(S/s)
f × 3000
Window Width against
the FFT Data Length
(Frequency of the
Fundamental Wave)
3
Upper Limit of the
Measured Order
100
15
Precision Power Analyzer WT3000
Accuracy
Frequency
Measurement range
Display update
• When the line filter (500 Hz) is ON
Frequency
Voltage and Current
±(reading error +
measurement range error)
0.7% of reading + 0.3% of range
0.1 Hz f 10 Hz
0.7% of reading + 0.3% of range
10 Hz f 30 Hz
0.7% of reading + 0.05% of range
30 Hz f 66 Hz
Power
±(reading error + measurement
range error)
1.4% of reading + 0.4% of range
1.4% of reading + 0.4% of range
1.4% of reading + 0.1% of range
• When the line filter (5.5 kHz) is ON
Frequency
Voltage and Current
±(reading error + measurement
range error)
0.25% of reading + 0.3% of range
0.1 Hz f 10 Hz
0.25% of reading + 0.3% of range
10 Hz f 30 Hz
0.3% of reading + 0.05% of range
30 Hz f 66 Hz
0.6% of reading + 0.05% of range
66 Hz f 440 Hz
1% of reading + 0.05% of range
440 Hz f 1 kHz
2.5% of reading + 0.05% of range
1 kHz f 2.5 kHz
8% of reading + 0.05% of range
2.5 kHz f 3.5 kHz
Power
±(reading error + measurement
range error)
0.5% of reading + 0.4% of range
0.5% of reading + 0.4% of range
0.45% of reading + 0.1% of range
1.2% of reading + 0.1% of range
2% of reading + 0.1% of range
5% of reading + 0.15% of range
16% of reading + 0.15% of range
• IEC Harmonic Measurement
If the fundamental frequency is between 1 kHz and 2.6 kHz
Add 0.5% of reading to the voltage and current accuracy for frequencies greater than 1
kHz.
Add 1% of reading to the power accuracy for frequencies greater than 1 kHz.
• When the line filter (50 kHz) is ON
Frequency
Voltage and Current
±(reading error + measurement
range error)
0.25% of reading + 0.3% of range
0.1 Hz f 10 Hz
0.25% of reading + 0.3% of range
10 Hz f 30 Hz
0.3% of reading + 0.05% of range
30 Hz f 440 Hz
0.7% of reading + 0.05% of range
440 Hz f 1 kHz
0.7% of reading + 0.05% of range
1 kHz f 5 kHz
3.0% of reading + 0.05% of range
5 kHz f 10 kHz
Power
±(reading error + measurement
range error)
0.45% of reading + 0.4% of range
0.45% of reading + 0.4% of range
0.45% of reading + 0.1% of range
1.4% of reading + 0.1% of range
1.4% of reading + 0.15% of range
6% of reading + 0.15% of range
If the fundamental frequency is between 1 kHz and 2.6 kHz
Add 0.5% of reading to the voltage and current accuracy for frequencies greater than 1
kHz.
Add 1% of reading to the power accuracy for frequencies greater than 1 kHz.
• When the line filter is OFF
Frequency
0.1 Hz f 10 Hz
10 Hz f 30 Hz
30 Hz f 1 kHz
1 kHz f 10 kHz
10 kHz f 55 kHz
Voltage and Current
±(reading error + measurement
range error)
0.15% of reading + 0.3% of range
0.15% of reading + 0.3% of range
0.1% of reading + 0.05% of range
0.3% of reading + 0.05% of range
1% of reading + 0.2% of range
PPL Timeout value
Power
±(reading error + measurement
range error)
0.25% of reading + 0.4% of range
0.25% of reading + 0.4% of range
0.2% of reading + 0.1% of range
0.6% of reading + 0.15% of range
2% of reading + 0.4% of range
• If the fundamental frequency is between 400 Hz and 1 kHz
Add 1.5% of reading to the voltage and current accuracy for frequencies greater than 10
kHz.
Add 3% of reading to the power accuracy for frequencies greater than 10 kHz.
• If the fundamental frequency is between 1 kHz and 2.6 kHz
Add 0.5% of reading to the voltage and current accuracy for frequencies greater than 1
kHz and less than or equal to 10 kHz.
Add 7% of reading to the voltage and current accuracy for frequencies greater than 10
kHz.
Add 1% of reading to the power accuracy for frequencies greater than 1 kHz and less than
equal to 10 kHz.
Add 14% of reading to the power accuracy for frequencies greater than 10 kHz.
However, all the items below apply to all tables.
• When the crest factor is set to 3
• When λ (power factor) = 1
• Power figures that exceed 440 Hz are reference values.
• For external current sensor range, add 0.2 mV to the current accuracy and add (0.2 mV/
external current sensor range rating)×100% of range to the power accuracy.
• For 30A direct current input range, add 0.2 mA to the current accuracy and add (0.2 mA/
direct current input range rating)×100% of range to the power accuracy.
• For 2A direct current input range, add 2 µA to the current accuracy and add (2 µA/direct
current input range rating) × 100% of range to the power accuracy.
• For nth order component input, add {n/(m+1)}/50% of (the nth order reading) to the n+mth
order and n-mth order of the voltage and current, and add {n/(m+1)}/25% of (the nth order
reading) to the n+mth order and n-mth order of the power.
• Add (n/500)% of reading to the nth component of the voltage and current, and add (n/
250)% of reading to the nth component of the power.
• Accuracy when the crest factor is 6: The same as when the range is doubled for crest
factor 3.
• The accuracy guaranteed range by frequency and voltage/current is the same as the
guaranteed range of normal measurement.
Item
Measured source
Format
Frequency range
PLL source
FFT data length
FFT processing word
length
Window function
Anti-aliasing filter
Interharmonic
measurement
Specifications
Select an input element or an Σ wiring unit
PLL synchronization method
Fundamental frequency of the PLL source is in the range of 45 Hz
to 66 Hz.
• Select the voltage or current of each input element (external
current sensor range is greater than or equal to 500 mV) or the
external clock (fundamental frequency).
• Input level
Greater than or equal to 50% of the measurement range rating
when the crest factor is 3
Greater than or equal to 100% of the measurement range rating
when the crest factor is 6
• Be sure to turn the frequency filter ON.
9000
32 bits
Rectangular
Set using a line filter (5.5 kHz).
Select OFF, Type1, or Type2.
Sample rate (sampling frequency), window width, and upper limit of measured order
Fundamental
Frequency of the
PLL Source
(Hz)
45 to 55
55 to 66
Sample Rate
(S/s)
f × 900
f × 750
Window Width against
the FFT Data Length
(Frequency of the
Fundamental Wave)
10
12
Upper Limit of the
Measured Order
50
50
Accuracy
• When the line filter (5.5 kHz) is ON
Frequency
Voltage and Current
±(reading error + measurement
range error)
0.2% of reading + 0.04% of range
45 Hz f 66 Hz
0.5% of reading + 0.05% of range
66 Hz f 440 Hz
1% of reading + 0.05% of range
440 Hz f 1 kHz
2.5% of reading + 0.05% of range
1 kHz f 2.5 kHz
8% of reading + 0.05% of range
2.5 kHz f 3.3 kHz
Power
±(reading error + measurement
range error)
0.4% of reading + 0.05% of range
1.2% of reading + 0.1% of range
2% of reading + 0.1% of range
5% of reading + 0.15% of range
16% of reading + 0.15% of range
However, all the items below apply.
• When the crest factor is set to 3
• When λ (power factor) = 1
• Power figures that exceed 440 Hz are reference values.
• For external current sensor range, add 0.03 mV to the current accuracy and add (0.03 mV/
external current sensor range rating)×100% of range to the power accuracy.
• For 30A direct current input range, add (0.1 mA/direct current input range rating)× 100% of
range to the power accuracy.
• For 2A direct current input range, add (1 µA/direct current input range rating) × 100% of
range to the power accuracy.
• For nth order component input, add {n/(m+1)}/50% of (the nth order reading) to the n+mth
order and n-mth order of the voltage and current, and add {n/(m+1)}/25% of (the nth order
reading) to the n+mth order and n-mth order of the power (only when applying a single
frequency).
• Accuracy when the crest factor is 6: The same as when the range is doubled for crest
factor 3.
• The accuracy guaranteed range by frequency and voltage/current is the same as the
guaranteed range of normal measurement.
Frequency
Measurement range
Display update
45 Hz f 1 MHz
Depends on the PLL source
(Approximately 200 ms when the frequency of the PLL source is 45
Hz to 66 Hz.)
• Waveform Computation Function
Item
Computed source
Equation
Operator
Sampling clock
Display update
16
• PLL synchronization method: 2.5 Hz f 100 kHz
• External sampling clock method: 0.15 Hz f 5 kHz
Depends on the PLL source
• PLL synchronization method: 1 s or more
• External sampling clock method: 20 s or more
Depends on the PLL source
• PLL synchronization method: 5 s or more
• External sampling clock method: 40 s or more
Specifications
Voltage, current, and active power of each input element; torque
(analog input) and speed (analog input) of motor input; and motor
output
Two equations (MATH1 and MATH2)
+, –, *, /, ABS (absolute value), SQR (square), SQRT (square root),
LOG (natural logarithm), LOG10 (common logarithm), EXP
(exponent), NEG (negation), AVG2, AVG4, AVG8, AVG16, AVG32,
AVG64 (exponential average).
Fixed to 200 kHz
Data update interval + computing time
• FFT Function Specifications
Item
Computed source
Specifications
Voltage, current, active power, and reactive power of each input
element.
Active power and reactive power of an Σ wiring unit.
Torque and speed signals (analog input) of motor input (option).
Type PS (power spectrum)
Number of computations Two computations (FFT1 and FFT2)
Maximum frequency of 100 kHz
analysis
Number of points
20,000 points or 200,000 points
Measurement period for 100 ms or 1 s
the computation
Frequency resolution
10 Hz or 1 Hz
Window function
Rectangular, Hanning, or Flattop
Anti-aliasing filter
Set using a line filter (OFF, 500 Hz, 5.5 kHz, or 50 kHz).
Sampling clock
Fixed to 200 kHz
Display update
Data update rate or (measurement period of the FFT + FFT
computing time), whichever is longer
* The measurement period is 1 s when the number of FFT points is 200 k (when the frequency
resolution is 1 Hz).
The measurement period is 100 ms when the number of FFT points is 20 k (when the
frequency resolution is 10 Hz).
• Harmonic Measurement in Normal Measurement
Item
Measured source
Format
Frequency range
PLL source
FFT data length
FFT processing word
length
Window function
Anti-aliasing filter
Note)
Specifications
All installed elements
PLL synchronization method
Range in which the fundamental frequency of the PLL source is 10
Hz to 2600 Hz
• Select the voltage or current of each input element (external
current sensor range is greater than or equal to 500 mV) or the
external clock (Ext Clk).
• Input level
Greater than or equal to 50% of the measurement range rating
when the crest factor is 3
Greater than or equal to 100% of the measurement range rating
when the crest factor is 6
• Turn the frequency filter ON when the fundamental frequency is
less than or equal to 440 Hz.
9000
32 bits
Rectangular
Set using a line filter (5.5 kHz or 50 kHz).
To measure and display harmonic data requires a data update rate of 500 ms or
more
Sample rate (sampling frequency), window width, and upper limit of measured order during
PLL synchronization
On models with the advanced computation (/G6) option
Fundamental
Sample Rate
Window Width against
the PLL Source
(S/s)
the FFT Data Length
(Hz)
(Frequency of the
Fundamental Wave)
10 to 20
f × 3000
3
20 to 40
f × 1500
6
40 to 55
f × 900
10
55 to 75
f × 750
12
75 to 150
f × 450
20
150 to 440
f × 360
25
440 to 1100
f × 150
60
1100 to 2600
f × 60
150
Upper Limit of the
Measured Order
• When the line filter (50 kHz) is ON
Frequency
Voltage and Current
±(reading error + measurement
range error)
0.25% of reading + 0.3% of range
10 Hz f 30 Hz
0.2% of reading + 0.15% of range
30 Hz f 440 Hz
1% of reading + 0.15% of range
440 Hz f 2.5 kHz
2% of reading + 0.15% of range
2.5 kHz f 5 kHz
3.5% of reading + 0.15% of range
5 kHz f 7.8 kHz
If the fundamental frequency is between 1 kHz and 2.6 kHz, add 0.5% of reading to the
voltage and current accuracy and 1% of reading to the power accuracy when the frequency
exceeds 1 kHz.
• When the line filter is OFF
Frequency
10 Hz f 30 Hz
30 Hz f 440 Hz
440 Hz f 2.5 kHz
2.5 kHz f 5 kHz
5 kHz f 7.8 kHz
Voltage and Current
±(reading error + measurement
range error)
0.15% of reading + 0.3% of range
0.1% of reading + 0.15% of range
0.6% of reading + 0.15% of range
1.6% of reading + 0.15% of range
2.5% of reading + 0.15% of range
Power
±(reading error + measurement
range error)
0.25% of reading + 0.4% of range
0.2% of reading + 0.15% of range
1.2% of reading + 0.2% of range
3.2% of reading + 0.2% of range
5% of reading + 0.2% of range
If the fundamental frequency is between 1 kHz and 2.6 kHz, add 0.5% of reading to the
voltage and current accuracy and 1% of reading to the power accuracy when the frequency
exceeds 1 kHz.
However, all the items below apply to all tables.
• When averaging is ON, the averaging type is EXP, and the attenuation constant is greater
than or equal to 8.
• When the crest factor is set to 3
• When λ (power factor) = 1
• Power exceeding 440 Hz are reference value.
• For external current sensor range, add 0.2 mV to the current accuracy and add (0.2 mV/
external current sensor range rating)×100% of range to the power accuracy.
• For 30A direct current input range, add 0.2 mA to the current accuracy and add (0.2 mA/
direct current input range rating)×100% of range to the power accuracy.
• For 2A direct current input range, add 2 µA to the current accuracy and add (2 µA/direct
current input range rating) × 100% of range to the power accuracy.
• For nth order component input, add {n/(m+1)}/50% of (the nth order reading) to the n+mth
order and n-mth order of the voltage and current, and add {n/(m+1)}/25% of (the nth order
reading) to the n+mth order and n-mth order of the power.
• Add (n/500)% of reading to the nth component of the voltage and current, and add (n/
250)% of reading to the nth component of the power.
• Accuracy when the crest factor is 6: The same as when the range is doubled for crest
factor 3.
• The accuracy guaranteed range by frequency and voltage/current is the same as the
guaranteed range of normal measurement.
If the amplitude of the high frequency component is large, influence of approximately 1%
may appear in certain orders. The influence depends on the size of the frequency
component. Therefore, if the frequency component is small with respect to the range rating,
this does not cause a problem.
• Waveform Sampling Data Saving Function
Parameters
100
100
100
100
50
15
7
3
Power
±(reading error + measurement
range error)
0.45% of reading + 0.4% of range
0.4% of reading + 0.15% of range
2% of reading + 0.2% of range
4% of reading + 0.2% of range
6% of reading + 0.2% of range
Data type
Storage
Voltage waveform, current waveform, analog input waveform of
torque and speed waveform calculation, FFT performing data
CSV format, WVF format
PCMCIA, USB memory (/C5 option)
* Waveform calculation function (MATH) cannot be used with FFT
calculation at the same time.
Accuracy
• When the line filter (5.5 kHz) is ON
Frequency
Voltage and Current
±(reading error + measurement
range error)
0.25% of reading + 0.3% of range
10 Hz f 30 Hz
0.2% of reading + 0.15% of range
30 Hz f 66 Hz
0.5% of reading + 0.15% of range
66 Hz f 440 Hz
1.2% of reading + 0.15% of range
440 Hz f 1 kHz
2.5% of reading + 0.15% of range
1 kHz f 2.5 kHz
8% of reading + 0.15% of range
2.5 kHz f 3.5 kHz
Power
±(reading error + measurement
range error)
0.5% of reading + 0.4% of range
0.4% of reading + 0.15% of range
1.2% of reading + 0.15% of range
2% of reading + 0.15% of range
6% of reading + 0.2% of range
16% of reading + 0.3% of range
If the fundamental frequency is between 1 kHz and 2.6 kHz, add 0.5% of reading to the
voltage and current accuracy and 1% of reading to the power accuracy when the frequency
exceeds 1 kHz.
17
Precision Power Analyzer WT3000
Voltage Fluctuation/Flicker Measurement (/FL optional)
• Normal Flicker Measurement Mode
Item
Specifications
Measurement Items
dc
Relative steady-state voltage change
(Measurement Functions) dmax Maximum relative voltage change
d(t)
The time during which the relative voltage change during a
voltage fluctuation period exceeds the threshold level
The maximum value within a observation period is displayed for
the items above.
Pst
Short-term flicker value
Plt
Long-term flicker value
One observation period 30 min to 15 s
Observation period count 1 to 99
• Measurement of dmax Caused by Manual Switching Mode
Item
Measurement
(Measurement Functions)
One observation period
Observation period count
Averaging
Specifications
dmax Maximum relative voltage change
1 minute
24
Average of 22 measured dmax values excluding the maximum and
minimum values among 24 values
• Items Common to Measurement Modes
Item
Target voltage/frequency
Measured item
Measured source input
Flicker scale
Display update
Specifications
230 V/ 50 Hz or 120 V/60 Hz
All installed elements
Voltage (current measurement function not available)
0.01 to 6400P.U. (20%) divided logarithmically into 1024 levels.
2 s (dc, dmax, and d(t))
For every completion of a observation period (Pst)
Communication output dc. dmax, d(t), Pst, Plt, instantaneous flicker sensation (IFS), and
cumulative probability function (CPF)
Printer output
Screen image
External storage output Screen image
Accuracy
dc, dmax: 4% (at dmax = 4%)
Pst: ±5% (at Pst = 1)
Conditions for the accuracy above
• Ambient temperature: 23 ± 1°C
• Line filter: OFF
• Input voltage range
220V to 250V at the 300V measuring range (50Hz)
110V to 130V at the 150V measuring range (60Hz)
Cycle-by-cycle measurement (/CC optional)
Synch source
Number of measurements
Timeout time
Synch source frequency range
Accuracy
Select an external source of U1, I1, U2, I2, U3, I3,
U4, or I4.
(the above parameters are measured continuously
for each cycle of the one sync source signal)
10-3000
0, 1-3600 seconds (set in units of seconds), 0(approximately
24 hours)
1 Hz to 1000 Hz (for U and I)
0.1 Hz to 1000Hz (for external sync source)
U, I, P: Add [(0.3+2*f) % of reading+ ((0.05+0.05*f)
% of range] to the accuracy for normal
measurement. For external sensor input,
Add (100+100*f) uV to the accuracy.
Freq
Add [(0.3+2*f)% of reading to the accuracy
for normal measurement.
*f is kHz
GP-IB Interface
Encoding
Mode
Address
Clear remote mode
Use one of the following by NATIONAL INSTRUMENTS:
• AT-GPIB
• PCI-GPIB and PCI-GPIB+
• PCMCIA-GPIB and PCMCIA-GPIB+
Use driver NI-488.2M version 1.60 or later.
Conforms electrically and mechanically to IEEE St’d 488-1978
(JIS C 1901-1987).
Functional specification SH1, AH1, T6, L4, SR1, RL1, PP0,
DC1, DT1, and C0.
Conforms to protocol IEEE St’d 488.2-1987.
ISO (ASCII)
Addressable mode
0–30
Remote mode can be cleared using the LOCAL key (except
during Local Lockout).
Ethernet Communications (/C7 Optional)
Number of communication ports 1
Connector type
RJ-45 connector
Electrical and mechanical specifications Conforms to IEEE 802.3.
Transmission system
Ethernet 100BASE—TX/10BASE-T
Transmission rate
10 Mbps/100Mbps
Protocol
TCP/IP
Supported Services
FTP server,FTP client (network drive),LPR client (network
printer), SMTP client (mail transmission), Web server, DHCP,
DNS, Remote control
Connector Type
RJ-45connector
18
Serial (RS-232) Interface (/C2 Optional)
Connector type
Electrical specifications
Connection type
Communication mode
Synchronization method
Baud rate
* Select USBport (PC) or RS-232
9-pin D-Sub (plug)
Conforms with EIA-574 (EIA-232 (RS-232) standard for 9-pin)
Point-to-point
Full duplex
Start-stop synchronization
Select from the following.
1200,2400,4800,9600,19200 bps
USB port(PC) (/C12 Optional)
* Select USBport (PC) or RS-232
Connector
Type B connector (receptacle)
Electrical and Mechanical Specifications Conforms to USB Rev.1.1
Speed
Max. 12 Mbps
Number of Ports
1
Supported service
Remote control
Supported Systems
Models with standard USB ports that run Windows 2000 or
Windows XP with USB port as a standard. (A separate device
driver is required for connecting to a PC.)
USB port(Peripheral) (/C5 Optional)
Connector
Type A connector (receptacle)
Electrical and Mechanical Specifications Conforms to USB Rev.1.1
Speed
Max. 12 Mbps
Number of Ports
2
Supported keyboards
104 keyboard (US) and 109 keyboard (Japanese) conforming
to USB HID Class Ver.1.1devices
Supported USB memory devices
USB (USB memory) flash memory
Power supply
5 V, 500 mA (per port)
However, device whose maximum current consumption
exceeds 100 mA cannot be connected simultaneously to the
two ports.
External I/O
I/O Section for Master/Slave Synchronization Signals
Connector type
BNC connector: Both slave and master
External Clock Input Section
Connector type
BNC connector
Input level
TTL
Inputting the synchronization source as the Ext Clk of normal measurement.
Frequency range
Same as the measurement range for frequency measurement.
Input waveform
50% duty ratio square wave
Inputting the PLL source as the Ext Clk of harmonic measurement.
Frequency range
10 Hz to 2.5 kHz
Input waveform
50% duty ratio square wave
Inputting the external sampling clock (Smp Clk) of wide bandwidth harmonic measurement.
Frequency range
3000 times the frequency of 0.1 Hz to 66 Hz
Input waveform
50% duty ratio square wave
For Triggers
Minimum pulse width
Trigger delay time
1 µs
Within (1 µs + 1 sample rate)
PC Card Interface
TYPE II (Flash ATA card)
General Specifications
Warm-up time
Operating temperature:
Operating humidity:
Approximately thirty minutes.
5–40°C
20–80% (when printer not used), 35 to 80% RH (when printer
is used)
(No condensation may be present)
Operating altitude
2000 m or less
Storage environment:
-25–60°C (no condensation may be present)
Storage humidity:
20 to 80% RH (no condensation)
Rated supply voltage
100–240 VAC
Allowed supply voltage fluctuation range
90–264 VAC
Rated supply frequency
50/60 Hz
Allowed supply frequency fluctuation
48 to 63 Hz
Maximum power consumption 150 VA (when using built-in printer)
Weight
Approximately 15 kg (including main unit, 4 input elements,
and options)
Battery backup
Setup information and internal clock are backed up with the
lithium battery
DESCRIPTION
Automatically select the appropriate calculation for each data updating period
AC signals have waveforms that fluctuate repeatedly when viewed instantaneously.
Therefore, measuring the power values of AC signals requires averaging for each period in
a repeated interval, or averaging the data of several periods using a filtering process. The
WT3000 automatically selects the appropriate calculation method (one of the above two
methods) based on the data updating period. This approach ensures fast response and high
stability as suitable for the particular measurement objective.
data updating period is short or when measuring the efficiency of low-frequency signals.
This method will not provide correct measurement values unless the period of the set
synchronous source signal is accurately sensed. Therefore, it is necessary to check whether
the frequency of the synchronous source signal has been accurately measured and
displayed. See the user’s manual for notes on the synchronous source signal and frequency
filter settings.
When the data updating period is 50ms, 100ms, 5s, 10s, or 20s
Measurement values are determined by applying an Average for the Synchronous Source
Period (ASSP) calculation to the sample data within the data updating period. (Note that this
excludes power integrated values WP, as well as current integrated value q in DC mode).
With ASSP, a frequency measurement circuit is used to detect the input signal period set as
the synchronous source. Sample data corresponding to an interval which is an integer
multiple of the input period are used to perform the calculation. Based on its fundamental
principles, the ASSP method allows measurement values to be obtained simply by
averaging an interval corresponding to a single period, so it is useful in cases where the
When the data updating period is 250ms, 500ms, 1s, or 2s
Measurement values are determined by applying an Exponential Average for Measuring
Period (EAMP) calculation to the sample data within the data updating period. With EAMP,
the sample data are averaged by applying a digital filtering process. This method does not
require accurate detection of the input period. EAMP provides excellent measurement value
stability.
* See page 12 of the specifications for information on the relationship between the data updating
period and the lowest measurement frequency.
Selecting formulas for calculating apparent power and reactive power
There are several types of power––active power, reactive power, and apparent
power. Generally, the following equations are satisfied:
Active power P = UIcosØ (1)
Reactive power Q = UIsinØ (2)
Apparent power S = UI (3)
In addition, these power values are related to each other as follows:
2
2
2
(Apparent power S) = (Active power P) + (Reactive power Q) (4)
TYPE1 (method used in normal mode with older WT Series models)
With this method, the apparent power for each phase is calculated from equation (3), and reactive
power for each phase is calculated from equation (2). Next, the results are added to calculate the
power.
Active power:
PΣ=P1+P2+P3
Apparent power: SΣ=S1+S2+S3(=U1×I1+U2×I2+U3×I3)
Reactive power: QΣ=Q1+Q2+Q3 (= (U1×I1)2-P12 + (U2×I2)2-P22 + (U3×I3)2-P32
*S1, S2, and S3 are calculated with a positive sign for the leading phase and a negative sign for the lagging phase.
U: Voltage RMS
I: Current RMS
Ø: Phase between current and voltage
Three-phase power is the sum of the power values in the individual phases.
These defining equations are only valid for sinewaves. In recent years, there has
been an increase in measurements of distorted waveforms, and users are
measuring sinewave signals less frequently. Distorted waveform measurements
provide different measurement values for apparent power and reactive power
depending on which of the above defining equations is selected. In addition,
because there is no defining equation for power in a distorted wave, it is not
necessarily clear which equation is correct. Therefore, three different formulas for
calculating apparent power and reactive power for three-phase four-wire
connection are provided with the WT3000.
TYPE2
The apparent power for each phase is calculated from equation (3), and the results are added together
to calculate the three-phase apparent power (same as in TYPE1). Three-phase reactive power is
calculated from three-phase apparent power and three-phase active power using equation (4).
PΣ=P1+P2+P3
Active power:
Apparent power: SΣ=S1+S2+S3(=U1×I1+U2×I2+U3×I3)
Reactive power: QΣ= S Σ2 -PΣ2
TYPE3 (method used in harmonic measurement mode with WT1600 and PZ4000)
This is the only method in which the reactive power for each phase is directly calculated using
equation (2). Three-phase apparent power is calculated from equation (4).
PΣ=P1+P2+P3
Active power:
Apparent power: SΣ= PΣ2 +QΣ2
Reactive power: QΣ=Q1+Q2+Q3
Accessories
Instrument Carts.
701960
701961
Compact Instrument Cart
Deluxe Instrument Cart
500 × 560 × 705 mm (WDH)
/A: Keyboard and mouse mount
570 × 580 × 839 mm (WDH)
/A: Keyboard and mouse mount
Equipment not exceeding 450 (W) × 450 (D) × 400 (H) mm
Top shelf
Equipment not exceeding 450 (W) × 450 (D) × 300 (H) mm
Top shelf
Middle shelf
Equipment not exceeding 450 (W) × 450 (D) × 300 (H) mm
Bottom shelf Equipment not exceeding 450 (W) x 450 (D) × 400 (H) mm
Bottom shelf Equipment not exceeding 450 (W) × 450 (D) × 240 (H) mm
* W: Width D: Depth H: Height
Maximum load: 50 kg on each shelf
*The photo shows the mount holding a DL7400.
* W: Width D: Depth H: Height
Maximum load: 20 kg on each shelf
701962
External dimensions of Yokogawa power meters
All-purpose Instrument Cart
467 × 693 × 713 mm (WDH)
Top shelf
Equipment not exceeding 457 (W) × 683 (D) mm
Drawer
Equipment not exceeding 610 (W) × 380 (D) mm
Slide table
Equipment not exceeding 380 (W) × 440 (D) mm
* W: Width D: Depth
Maximum load: 50 kg on each shelf
WT3000
WT1600
WT210
WT230
PZ4000
(excluding protrusions)
Width (mm)
Height (mm)
Depth (mm)
Compact mount
701960
Deluxe mount
701961
General-purpose
mount 701962
426
426
213
213
426
177
177
88
132
177
450
400
379
379
450
✓
✓
✓
✓
✓*1
✓
✓
✓
✓
✓*1
✓
✓
✓
✓
✓*1
*1 The back-side inputs protrude beyond the back shelves of the mounts.
* These mount do not conform to CE marking.
19
쮿Application Software
Model and Suffix Codes
Model
760122
쮿Precision Power Analyzer WT3000
Model
Suffix Codes
760301
760302
760303
760304
Element number -01
-02
-03
-04
-10
-20
-30
-40
-SV
Version
-MV
-M
Power cord
Options
/G6
761922
Description
WT3000 1 input element model
WT3000 2 input elements model
WT3000 3 input elements model
WT3000 4 input elements model
2A input element
Standard Version
Motor Version
UL/CSA standard
Advanced Computation
(IEC standard testing*, harmonic, FFT, Waveform computation)
Built-in Printer
/B5
/DT
Delta Calculation
Add-on Frequency Measurement
/FQ
20ch D/A output
/DA
VGA Output
/V1
/C2 Select Serial (RS-232) Interface
/C12 one USB port (PC)
/C5
USB port (Peripheral)
/C7
Ethernet function
/CC Cycle by Cycle
/FL Voltage Fluctuation, Flicker
* requires 761922 software
Note: Mixing of the 30 A and 2 A input elements is not supported, whether purchasing a new unit or reworking
an existing one. Also, the unit cannot be modified to change the current range.
Adding input modules after initial product delivery will require rework at the factory.
Please choose your models and configurations carefully, and inquire with your sales
representative if you have any questions.
쮿Standard accessories
Safety terminal adapter
Power cord, Spare power fuse, Rubber feet, current input 758931
protective cover, User’s manual, expanded user’s manual,
communication interface user’s manual, printer roll
paper(provided only with /B5), connector (provided only
with /DA) Safety terminal adapter 758931(provided two
adapters in a set times input element number)
* Cable B9284LK (light blue) for external current sensor input is
sold separately. Safety terminal adapter 758931 is included with
the WT3000. Other cables and adapters must be purchased by
the user.
Description
Data acquisition software
Order Q’ty
1
Standard-compliant measurement
1
쮿Rack Mount
for 760301 model
for 760302 model
for 760303 model
for 760304 model
for 760301 model
for 760302 model
for 760303 model
for 760304 model
30A input element
Product
WTViewer Software
Harmonic/Voltage fluctuation/Flicker
Measurement Software
Model
751535-E4
751535-J4
Product
Rack mounting kit
Rack mounting kit
Description
For EIA
For JIS
쮿Accessory (sold separately)
Description
Order Q’ty
A set of 0.8m long, red and black test leads 1
Rated at 300V and used in a pair
1
Rated at 1000V and used in a pair
1
(spring-hold type) Two adapters to a set. 1
(screw-fastened type) Two adapters to a 1
set. 1.5 mm hex Wrench is attached
758921
Fork terminal adapter
Banana-fork adapter. Two adapters to a set 1
Safety mini-clip
Hook type. Two in a set
1
701959
Conversion adapter
BNC-banana-jack(female) adapter
1
758924
366924
*
BNC-BNC cable
1m
1
BNC-BNC cable
2m
1
366925
*
External sensor cable
Current sensor input connector. Length 0.5m 1
B9284LK
B9316FX
Printer roll pager
Thermal paper, 10 meters (1 roll)
10
Due to the nature of this product, it is possible to touch its metal parts. Therefore, there is a risk of electric
shock, so the product must be used with caution.
* Use these products with low-voltage circuits (42V or less).
Model/parts number
758917
758922
758929
758923
758931
Product
Test read set
Small alligator-clip
Large alligator-clip
Safety terminal adapter
Safety terminal adapter
쮿Mounts
Model
701960
Suffix and codes
Description
Compact mount
/A
701961
Deluxe mount
/A
General-purpose mount
701962
Description
500*560*705mm(W, D, H)
Key board and mouse table
570*580*839mm(W, D, H)
Key board and mouse table
467*693*713mm(W, H, D)
쮿Current Sensor Unit
Suffix code Description
Single-phase
DC to 100 kHz (-3 dB). -600 A to 0 A to +600 A (DC)
-10
Three-phase U, V
Basic accuracy:⫾(0.05% of rdg* + 40 mA) Superior noise
withstanding
ability and CMRR characteristic due to
-20
Three-phase U, W
optimized casing design
-30
Three-phase U, V, W
Supply voltage
-1
100 V AC (50/60 Hz)
-3
115 V AC(50/60 Hz)
-7
230 V AC(50/60 Hz)
Power card
-D
UL/CSA standard
-F
VDE standard
-R
SAA standard
-J
BS standard
-H
GB standard
* 751523-10 is designed for WT3000, PZ4000 and WT1600. 751523-20 is designed for the WT2000, and
WT200 Series.
* 751521/751523 do not conform to CE Marking.
Model
751521
751523
쮿Clamp on Probe / Current transducer
Model
Product
Description
751552
Clamp-on probe
30 Hz to 5 kHz, 1400Apk (1000Arms)
751574
Current transducer
DC to 100 kHz (-3dB), 600Apk
* For detailed information, see Power Meter Accessory Catalog Bulletin 7515-52E
Exterior
unit : mm
426
13
32
427
32
20
177
13
YOKOGAWA ELECTRIC CORPORATION
Communication & Measurement Business Headquarters /Phone: (81)-422-52-6768, Fax: (81)-422-52-6624
E-mail: [email protected]
YOKOGAWA CORPORATION OF AMERICA Phone: (1)-770-253-7000, Fax: (1)-770-251-6427
YOKOGAWA EUROPE B.V.
Phone: (31)-33-4641858, Fax: (31)-33-4641859
YOKOGAWA ENGINEERING ASIA PTE. LTD. Phone: (65)-62419933, Fax: (65)-62412606
Subject to change without notice.
[Ed : 03/b] Copyright ©2004
Printed in Japan, 702(KP)
MS-16E