1
FLUE GAS ANALYSER
GA-40T plus
Operating manual
11/2000
E
L
E
C
T
R
O
N
I
C
S
GA-40 T plus
1
2
3
4
5
CONTENTS
INTRODUCTION ....................................................................................................................................7
1.1 USE OF THIS OPERATING MANUAL ..........................................................................................7
1.2 SYMBOLS USED ...........................................................................................................................7
MAINTENANCE......................................................................................................................................8
2.1 Gas sensors....................................................................................................................................8
2.2 Gas system.....................................................................................................................................8
2.3 Battery ...........................................................................................................................................8
2.4 Service intervals.............................................................................................................................8
2.5 Errors during operation.................................................................................................................8
2.6 Switching off after use....................................................................................................................8
GENERAL INFORMATION...................................................................................................................10
CONSTRUCTION..................................................................................................................................11
4.1 Elements of gas circuit.................................................................................................................11
4.1.1 Gas probe with in-line filter..................................................................................................11
4.1.2 Gas pump .............................................................................................................................11
4.1.3 Gas chamber ........................................................................................................................11
4.2 Measurement system ....................................................................................................................11
4.2.1 Gas sensors ..........................................................................................................................11
4.2.2 Ambient air temperature sensor............................................................................................12
4.2.3 Flue gas temperature sensor.................................................................................................12
4.2.4 Gas chamber temperature sensor..........................................................................................12
4.2.5 Differential pressure sensor..................................................................................................12
4.2.6 Analogue inputs....................................................................................................................12
4.2.7 Analogue outputs..................................................................................................................14
4.3 Data input/output systems ............................................................................................................14
4.3.1 Keyboard..............................................................................................................................14
4.3.2 Warning lights......................................................................................................................15
4.3.3 Display.................................................................................................................................15
4.3.4 Printer..................................................................................................................................15
4.3.5 Interface RS 232C ................................................................................................................15
4.4 Power supply ...............................................................................................................................16
OPERATION .........................................................................................................................................17
5.1 USE OF THE KEYBOARD ..........................................................................................................17
5.1.1 Description of the keys..........................................................................................................17
5.1.2 Selecting Menu Options ........................................................................................................17
5.1.3 Entering Numbers.................................................................................................................18
5.1.4 Editing Text..........................................................................................................................18
5.2 Basic operating instructions.........................................................................................................19
5.2.1 Setting-up the analyser .........................................................................................................19
5.2.2 Switching on .........................................................................................................................19
5.2.3 Switching off / Standby .........................................................................................................19
5.2.4 Initial Calibration ................................................................................................................20
5.2.5 Measurement Parameters .....................................................................................................20
5.2.5.1 Fuel...............................................................................................................................21
5.2.5.2 Average Time ................................................................................................................23
5.2.5.3 Reference Oxygen parameter.........................................................................................23
5.2.5.4 Boiler Parameter...........................................................................................................23
5.2.5.5 Content of NO in NOx ...................................................................................................24
5.3 Displaying the measurement results .............................................................................................24
5.3.1 Current Values .....................................................................................................................24
5.3.2 Averaged Values...................................................................................................................25
5.3.3 The Averaging Process .........................................................................................................26
5.4 Pressure/Draft Measurements ......................................................................................................26
5.5 Soot (smoke) Contents Measurement............................................................................................27
3
GA-40 T plus
5.6
5.7
5.8
5.9
6
7
8
9
4
Graphic .......................................................................................................................................28
Flow measurement (option)..........................................................................................................29
Analogue outputs (option)............................................................................................................30
Options........................................................................................................................................30
5.9.1 Device Info ...........................................................................................................................31
5.9.2 Sensors.................................................................................................................................31
5.9.2.1 CO range ......................................................................................................................31
5.9.2.2 O2 Cell calibration .......................................................................................................31
5.9.2.3 External channels..........................................................................................................32
5.9.2.3.1 Gas temperature sensor - TH GAS.........................................................................32
5.9.2.3.2 Ambient temperature sensor - PT AMB. .................................................................32
5.9.2.3.3 External thermocouple- - T1 EXT and T2 EXT.......................................................33
5.9.2.3.4 External resistance thermometer - T3 EXT and T4 EXT.........................................33
5.9.2.3.5 External Voltage/Current inputs - U/I1 EXT and U/I2 EXT....................................33
5.9.2.4 Sensor calibration.........................................................................................................33
5.9.3 Settings ................................................................................................................................34
5.9.3.1 Backlighting..................................................................................................................35
5.9.3.2 Contrast........................................................................................................................35
5.9.3.3 Date/time ......................................................................................................................35
5.9.3.4 Printer settings..............................................................................................................36
5.9.3.5 Language/Country ........................................................................................................37
5.9.3.6 Acoustic Warning..........................................................................................................37
5.9.3.7 Soot Test .......................................................................................................................38
5.9.3.8 Standard .......................................................................................................................38
5.9.4 Control list...........................................................................................................................38
5.9.5 madur Service ......................................................................................................................38
5.10 Storing of Results.........................................................................................................................38
5.10.1 Reports.................................................................................................................................39
5.10.1.1 Storing measurement reports.........................................................................................39
5.10.1.2 Report table ..................................................................................................................40
5.10.1.3 Header (Notice) edition.................................................................................................41
5.10.1.4 Erasing Reports ............................................................................................................42
5.10.2 Continuous storing of results................................................................................................42
5.10.2.1 Banks Table ..................................................................................................................43
5.10.2.2 Erasing Banks...............................................................................................................44
5.11 Data-Logger ................................................................................................................................44
5.12 Printer .........................................................................................................................................45
5.12.1 Printing the contents of a screen...........................................................................................45
5.12.2 Printing of all results............................................................................................................45
BASIC PRINCIPLES OF CALCULATING RESULTS ............................................................................47
6.1 Quantities obtained from direct measurements (O2, CO, NO, SO2) .............................................47
6.2 Calculating the concentration of carbon dioxide..........................................................................47
6.3 Calculating the concentration of nitrogen oxides NOx .................................................................47
6.4 Concentration of "undiluted" carbon monoxide COundil .............................................................47
6.5 Mass concentrations of gas components.......................................................................................48
6.5.1 Absolute mass concentration of gas components...................................................................48
6.5.2 Mass concentrations relative to the concentration of oxygen in combustion gases ................49
6.6 Calculating combustion parameters.............................................................................................49
6.7 Fuel parameters...........................................................................................................................51
6.8 The influence of fuel parameters on the accuracy of result calculations .......................................52
BLOCK DIAGRAM................................................................................................................................53
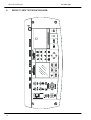
FRONT VIEW WITH KEYBOARD.........................................................................................................54
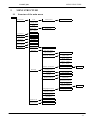
MENU STRUCTURE.............................................................................................................................55
9.1 Structure of the main menu ..........................................................................................................55
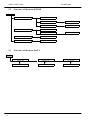
9.2 Structure of the menu STORE ......................................................................................................56
GA-40 T plus
9.3
Structure of the menu DATA ........................................................................................................56
5
GA-40 T plus
INTRODUCTION
1
INTRODUCTION
Congratulations on your purchase of the microprocessor-controlled flue gas analyser
GA-40 T plus
It is a high quality instrument produced using the latest technical discoveries. The GA-40 T plus is
easy to use. You also have the possibility of using the extra capabilities of this analyser, of examining
measurement results, checking service intervals and many others. Please read the operating manual
carefully. It contains valuable tips and information for problem-free operation. Regular maintenance
will help to keep your analyser ready for use at all times.
1.1
USE OF THIS OPERATING MANUAL
Keep this manual with the analyser GA-40 T plus, and take it with you when carrying out measurements.
Here is a short description of the sections of this manual.
2 MAINTENANCE
This section contains important information designed to keep your analyser working and to save you time and
trouble.
3 GENERAL INFORMATION
This describes the most important characteristics of your new analyser.
4 CONSTRUCTION
A knowledge of the hardware of the analyser will help you to use the instrument correctly and to avoid
unnecessary down-time.
6 OPERATION
This section explains the use of the analyser with detailed descriptions of the various functions. It is important
to read the sections 6.1 and 5.2 first. The other sections can be read as and when required.
6 BASIC PRINCIPLES OF CALCULATING RESULTS
Here you will find all the necessary theory and formulas used in the calculations carried out by your analyser
1.2
SYMBOLS USED
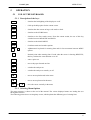
MENU
-
press the key shown
, (5.6.1 Theme)
-
Further information to this theme is available in the operating manual
{
-
ATTENTION important information
Information or instructions marked so can be skipped if not immediately needed.
7
MAINTENANCE
2
GA-40 T plus
MAINTENANCE
2.1
Gas sensors
The following points are important for maximising the operational life of the cells and achieving measurements
without errors:
G do not exceed the rated concentration;
G all the gas cells may react unpredictably to the presence of substances which are not usually
found in flue gases. For this reason, the analyser may not be cleaned with chemical solvents.
If organic solvents enter the gas chamber, the cells may become unstable or even suffer
permanent damage;
G some cells require the presence of a bias voltage when not in use. Do not allow the battery to
become fully discharged;
G do not switch the analyser off before the system is purged of remaining flue gas;
G store the analyser in a cool place to reduce the ageing of the cells.
2.2
Gas system
The gas system of the analyser is protected by a heated filter. The filter element will become dirty with use and
should be changed when necessary. The water vapour present in the flue gases condenses in the cooler of the
dryer and is pumped out automatically.
2.3
Battery
The rechargeable battery used in the analyser is maintenance-free. An acoustic warning signal is given when
the voltage drops below 11 V. The GA-40 T plus will switch off automatically if the voltage drops below 10.5
V. The analyser will operate for about 5 hours from the battery.
{
2.4
Some parts of the analyser draw current even when the device is switched off. If
the analyser is not being used then the battery should be charged fully at least
once a month.
Service intervals
The parameters of the electrochemical cells change with time, and therefore it is necessary to carry out a
service periodically. This service should include re-calibration of the gas sensors using test gases. The
recommended service interval is 800 operating hours or 6 months, whichever comes first. The analyser is fitted
with an operating hour counter and automatically shows when a service is necessary.
The operating time and the number of hours until the next service are shown in SERVICE/DEVICE INFO.
2.5
Errors during operation
The analyser checks all circuitry continuously. Should an error become evident, then this is signalled
acoustically and by the message "ERROR" on the screen. The error can be found shown on the screen
OPTIONS/SERVICE/CONTROL LIST.
2.6
Switching off after use
The operating life of the electrochemical cells is dependent on the usage of the instrument. The wear and tear
on the cells is greater when the cell is exposed to the gas for longer or the concentration is higher. The gas cell
is hence "used up" during measurements.
For this reason, the analyser should not be switched off until all the gas tubing has been completely
cleared of flue gases and the gas cells have been purged with fresh air for several minutes.
8
GA-40 T plus
MAINTENANCE
The GA-40 T plus will not normally allow the instrument to be switched off if there are still traces of flue gas
in the system. The analyser will continue to operate until the signals from the gas cells are nearly zero. This
activity is shown by the message "VENTILATION REMOVE PROBE FROM FLUE".
The [OFF] key must be pressed twice to switch the instrument off completely. Pressing the key once will put
the analyser in the standby mode and the instrument will remain in this mode until it is activated again by
pressing "C" or switched off completely.
{
Certain conditions, such as strong electro-magnetic fields can cause the analyser
to become "hung-up". The only solution to this problem is to switch the
instrument off. It is, however, possible that the analyser will no longer react to
the keyboard and can not be switched off.
Pressing the [OFF] key for a period of about
three seconds will always switch the analyser
off.
9
GENERAL INFORMATION
3
GA-40 T plus
GENERAL INFORMATION
The GA-40 T plus is a multi-functional flue gas analyser. Electrochemical sensors are used for the
measurement of gas concentration. The instrument can be fitted with between 3 and 6 of these sensors. All
analysers are fitted with O2, CO and NO sensors, further gas cells must be chosen when the instrument is
ordered.
The following description is based on an analyser containing 3 cells, the third one being an NO sensor.
G Oxygen, O2
G Carbon monoxide CO
G Nitric oxide NO
G Carbon dioxide CO2
G Nitrogen oxides NOx
The first three gases (O2, CO, NO) are measured directly using the electrochemical cells. The remaining
components are calculated. The concentrations of oxygen and carbon dioxide are shown in percent. The
concentrations of the remaining gases is shown as follows:
G volume concentration in [ppm]
G absolute mass concentration in [mg/m3]
G mass concentration relative to the oxygen content in [mg/m3]
G mass concentration relative to the energy output in [mg/MJ]
In addition, the air inlet or ambient temperature and flue gas temperature are measured. Using the measured
temperatures, gas concentrations and the known fuel parameters the analyser calculates a variety of
combustion parameters such as Stack Loss - SL, Efficiency - η, Excess Air - λ, Loss through Incomplete
Combustion - IL.
The GA-40 T plus also measures differential pressure.. This can be used to measure the draught or pressure
in the flue gas channel and, using an appropriate Pitot tube, the flow velocity of the gases. The instrument is
also equipped for the soot test according to Bacharach.
The analyser is also fitted as a 6 channel data logger, capable of measuring two voltages or current channels
together with four temperatures using a variety of thermocouples and thermoresistors.
The instrument can be used at as broad range of ambient temperatures (0 - 50°C). It is fitted with a
rechargeable battery making it independent of the mains power supply.
Hence, the GA-40 T plus is ideally suited for all those involved in the construction, maintenance and
adjusting of heating systems.
The keyboard of the instrument can be wiped clean if necessary.
The GA-40 T plus is controlled by a microprocessor. The easy-to-read LCD display, the comprehensive
keyboard and the built-in printer allow the operator to communicate with the instrument easily and to
document the measurements on the spot. The EEPROM memory used in the GA-40 T plus allows large
quantities of data to be stored without fear of data loss should the instrument be switched off or should the
battery be accidentally run down. The GA-40 T plus comes complete with programmed data for the 16 most
common fuels. A further 10 fuels can be programmed by the operator to cover all eventualities.
The RS232C interface fitted to the GA-40 T plus allows all stored data to be read for later treatment or the
instrument can be used on-line with the computer.
10
GA-40 T plus
4
CONSTRUCTION
CONSTRUCTION
The picture on page 53 shows a block diagram of the GA-40 T plus.
plus
Here is a description of the individual components.
4.1
Elements of gas circuit
4.1.1 Gas probe with in-line filter
The flue gas is sampled with the probe pipe (typical lengths: 150 mm, 300 mm, 750 mm and 1500 mm) and
drawn through the heated filter. This filter removes the solid material and dust from the flue gas and, due to
the heating, ensures that the water vapour does not condense on the filter. The flter maintains the flue gas
temperatureabove 95 °C. The clean gases are then passed through the heated hose into the cooler block. The
heated hose is likewise designed to prevent condensation in the flue gases.
The cooler of the dryer condenses the water vapour in the flue gases and it is automatically removed by a
peristaltic pump. The dry flue gases pass through a three way valve and the membrane pump, after whichthe
gas stream is split, with part going to the O2, NO and optional sensors, and the other part going through
a non-return valve to the CO sensor.
The gas chamber has been designed to ensure that an over-range of the CO sensor will not lead to an
interruption of the measurements carried out by the other sensors. The automatic operation of the purging
pump will only flush the CO sensor with fresh air.
4.1.2 Gas pump
The internal gas pump draws the gas into the GA-40 T plus and passes it through the gas chambers. The selfcleaning pump is a high quality item and is known to be extremely reliable.
The gas cells operate best with a flow rate of 90 l/h, which is set at the factory and compensates automatically
for flow restrictions or changes in battery voltage.
4.1.3 Gas chamber
The gas chamber is fitted with between three and six gas sensors. Oxygen, carbon monoxide and nitric oxide
sensors are fitted as standard equipment. The other cells are chosen when the instrument is ordered. The gas
chamber of the GA-40 T plus system is characterised by minimal dead capacity, which leads to low inertia of
the analyser indications. In addition to the gas sensors, there is a temperature sensor placed in the chamber for
temperature compensation of the sensors.
4.2
Measurement system
4.2.1 Gas sensors
The oxygen concentration is measured using an electrochemical cell. The sensor signal is directly proportional
to the oxygen volume concentration. The oxygen sensor needs no calibration with standard gases - it is fully
calibrated during the initial calibration when a point corresponding with the contents of oxygen in clean air
(20.95%) is determined.
The toxic gases are also measured using electrochemical cells
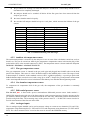
Table 1 presents all the gas sensors available. Any of them can be used in GA-40 T plus system.
To guarantee long-lasting, trouble-free function of electrochemical sensors the following points are important:
G the stated maximum measuring range of the sensor should not be exceeded.
G all the gas sensors can react unpredictably to certain chemicals which are not typical for
combustion gas composition. For this reason, i t i s a b s o l u t e l y f o r b i d d e n
to wash the parts of the gas line with chemical
s o l v e n t s . The vapours from such solvents can get inside the gas chamber and result in
destabilisation or even permanent damage of the gas sensors.
11
CONSTRUCTION
GA-40 T plus
G
the gas sensors are working even when the analyser is switched off - so the battery should never be
disconnected or completely discharged.
G
the analyser should not be switched off before all the flue gases have been removed from the
analyser gas circuit.
G
the sensor chamber must be kept dry.
G
the switched off analyser should be kept in a cool place, which increases the lifetime of the gas
sensors.
Gas
O2
CO
CO
CO
NO
NO2
SO2
H2S
H2
HxCy
CO2
Cell type
2FO
A3E/D
3F/D
3M/F
3NF/F
3ND
3SF
3H
3HYT
PELLISTOR
IR
Range [ppm]
0 - 20.9 %
0 - 4000
0 - 20 000
0 - 10 %
0 - 5 000
0 - 1000
0 - 5000
0 - 1000
0 - 2000
0-3%
0 - 50 %
Tab. 1 Available measuring cells and ranges
4.2.2 Ambient air temperature sensor
The ambient temperature is measured by the analyser for use in some of the calculations carried out, such as
Stack Loss. This can be carried out either by the temperature compensation sensor built into the plug of the
probe holder (INT) or the external connector T3 (EXT). The temperature sensor is chosen under the suboption
OPTIONS / SENSORS / ANALOGUE INPUTS.
4.2.3 Flue gas temperature sensor
Flue gas temperature sensor is situated in the gas probe pipe and plugged into PROBE socket on the front
panel of the analyser. This sensor is a NiCr-Ni thermocouple in the standard probe version. The range of such
a thermocouple is 50-800oC in the standard version (1100°C available optionally). A special gas probe with
PtRh-Pt thermocouple can also be used, with a range up to 1600oC. Proper flue gas temperature measurement
is the most important factor for correct calculation of the chimney loss and other heat engineering results.
4.2.4 Gas chamber temperature sensor
To compensate for temperature drift of the gas cells, the temperature of the gas chamber is constantly
monitored.
4.2.5 Differential pressure sensor
The GA-40 T plus is fitted with a precise semiconductor differential pressure sensor. Stubs marked +/PRESSURE situated on the left side of the front panel are used to measure pressure. Negative pressure in flue
gas channel (chimney draught) can be measured with the one stub only; differential pressure measurement is
possible using both stubs. The measuring range of the pressure sensor is +/-50 hPa. This sensor can also be
used for measurement of the flow rate in the stack.
4.2.6 Analogue inputs
The six analogue inputs installed can be used to measure voltage or current on two channels (U/I1 and U/I2),
temperature using thermocouples (T1 EXT and T2 EXT) and temperature using thermistors (T3 EXT and T4
EXT). The values measured can be viewed on the screen or stored in the EEPROM memory.
12
GA-40 T plus
CONSTRUCTION
Tables 2 and 3 show the technical data for the analogue inputs.
Parameter
U1, U2
Range
-10 V ÷ 10 V
Input resistance
100 kW
Resolution
10 mV
I1, I2
-10 mA ÷ 10 mA
100 W
10 µA
Tab. 2 Parameters for current and voltage channels
Parameter
Thermocouple
Ni-CrNi: 0 ÷ 1300 °C
Pt-RhPt: 0 ÷ 1600 °C
Fe-CuNi: 0 ÷ 700 °C
1 °C
Range
Resolution
Thermistor
Pt 100: 0 ÷ 200 °C
Pt 500: 0 ÷ 100 °C
KTY-2k: 0 ÷ 100 °C
1 °C
Tab. 3 Parameters for temperature channels
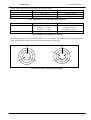
The analogue inputs are connected to the sockets U/I1, U/I2, TEMP1 and TEMP2 on the front of the analyser.
Table 4 shows the use of the pins in the sockets (seen from the socket side).
2
3
2
1
3
4
1
5
Picture 2 Socket for analogue inputs/outputs
13
CONSTRUCTION
GA-40 T plus
SOCKET
Pin No. Signal
1
GND
U/I1
2
I1+
3
U1+
4
5
1
GND
U/I2
2
I2+
3
U2+
4
5
1
T3 EXT +
TEMP. 1
2
T1 EXT +
3
GND
1
T4 EXT +
TEMP. 2
2
T2 EXT +
3
GND
* - The negative sides are all connected to ground
Description
common I1(-), U1(-)*
current I1 (+)
voltage U1 (+)
Analogue output (option)
Analogue output (option)
common I2(-), U2(-)*
current I2 (+)
voltage U2 (+)
Analogue output (option)
Analogue output (option)
Thermistor 1(+)
Thermocouple 1(+)
common (-)*
Thermistor 2(+)
Thermocouple 2(+)
common(-)*
Tab. 4 Connections to analogue inputs
4.2.7 Analogue outputs
This function is not part of the standard instrument
4.3
Data input/output systems
4.3.1 Keyboard
A film keyboard is used in the GA-40 T plus analyser which is durable, washable and highly resistant to
external agents. The keys are modern membrane keys with perceptible stroke.
Each press of a key is accompanied by an acoustic signal. The keyboard is shown in picture B (page 54) and
consists of the following elements:
HEATED LINE - Socket for electrical connection to the heated hose
14
GAS
- Connector for the gas sample line
PRESSURE +/-
- Connectors for the differential pressure sensor
RS 232 C
- Socket for the RS232C connector
TEMP. 1
- Socket for the temperature channels 1 & 3
TEMP. 2
- Socket for the temperature channels 2 & 4
U/I 1
- Socket for the current/voltage channel 1
U/I 2
- Socket for the current/voltage channel 2
Mains
- Socket for the mains power connection
Condensate
- Outlet tube for condensate from the analyser
Function keys
-
STORE
DATA
MENU
Function keys
-
LIGHT
HELP
ZOOM
Arrow keys
-
À
Á
Â
ENTER
Ã
GA-40 T plus
CONSTRUCTION
Printer keys
-
PRINT
PAPER
ON/OFF keys
-
ON
OFF
numerals
-
0
to
9
.
C
4.3.2 Warning lights
The warning LED's above the keyboard inform the user about the state of the most important sections of the
analyser. If the instrument is working correctly then only the lights READY and CHARGING should be lit.
The meaning of the individual lights:
CHARGING
- Mains power connected, battery charging.
READY
- Instrument ready for use. The light will flash on and off until the instrument is
ready (zero calibration, cooling down, STANDBY).
DRYER
- Cooler has not yet reached operating temperature.
BATTERY LOW!
- Battery nearly empty. Charging necessary.
CHECK PROBE!
- Electrical connection to the probe not functioning.
FLOW TOO LOW! - The gas flow rate is too low. Either tubing blocked or pump defective.
4.3.3 Display
The GA-40 T plus has a LCD display with graphic capabilities. To improve the read-out quality, contrast
regulation for the display and backlighting are used. Measurement results, calculation results, diagrams, text
information, menu options and others appear on the display.
4.3.4 Printer
The GA-40 T plus is fitted with an EPSON dot matrix printer capable of printing the data as graphic or in
the form of tables. All the screens seen on the analyser may be printed.
Printing speed is about 2.5 lines per second. The printer uses normal paper, 57 mm wide.
4.3.5 Interface RS 232C
The GA-40 T plus is fitted with a serial RS232C interface. The socket is mounted on the front of the
instrument and marked RS232C. The interface allows the GA-40 T plus to communicate with a PC and the
software WINFGA is available for carrying out extensive analysis of the stored results.
2
3
1
4
Picture 3 RS 232 socket
Picture 3 shows the pins of the interface socket seen from the front. Table 5 shows the connections to the
socket.
15
CONSTRUCTION
SOCKET
Pin No.
1
2
3
4
RS 232
GA-40 T plus
Signal
RTS
RxD
GND
TXD
DESCRIPTION
control
Receive Data - RS 232C
ground
Transmit Data - RS 232C
Tab. 5 RS232 connections
Picture 4 shows the correct connection between the GA-40 T plus and a PC.
TxD
GND
RxD
RTS
4
3
2
1
3
7
2
4
RxD
GND
TxD
RTS
20
5
RS 232 socket on analyser
RS 232 plug on the computer
(numbered for the 25 pin plug of the
IBM computer standard)
2
5
3
7
RxD
GND
TxD
RTS
4
8
RS 232 plug on the computer
(numbered for the 9 pin plug of the IBM
computer standard)
Picture 4
4.4
Power supply
The analyser GA-40 T plus can be used powered by the internal battery or connected to the mains. The battery
will only operate the basic analyser, the following parts will only work when the instrument is connected to the
mains.
•
Heated filter,
•
Heated hose,
•
Gas dryer,
•
Heated probe holder (for soot test).
The socket for the mains cable is on the left side of the keyboard. It is not advisable to connect or disconnect
the mains supply whilst the analyser is in use. The analyser automatically switches to battery operation if the
mains supply is interrupted.
The maintenance-free battery has a capacity of 2.6 Ah/12 V.
If the battery voltage drops below a set level, the analyser will give an acoustic signal and the warning light
will illuminate. If the battery voltage continues to drop, then the analyser will switch off automatically after
about 15 minutes to prevent damage to the battery.
The battery is charged by connecting the analyser to the mains, regardless of whether the instrument is
switched on or off. The battery voltage can be seen on the screen during the initial calibration phase, and at
other times can be found under OPTIONS/DEVICE INFO.
16
GA-40 T plus
5
OPERATION
OPERATION
5.1
USE OF THE KEYBOARD
5.1.1 Description of the keys
LIGHT
- Switches the backlighting of the display on or off.
HELP
- Calls up the help option for the current screen.
ZOOM
- Switches the data screens to large scale mode or back.
STORE
- Switches to the STORE menu
DATA
- Switches to the first results screen. From the current results, the use of this key
switches between MEASURE and HOLD.
MENU
- Switches to the MAIN MENU
ENTER
- Confirms entries and switches options
0 to
9
- Alphanumeric keyboard for entering data and for fast movement between MENU
options
.
-
Decimal point when entering data. If used when the screen is showing RESULTS,
this key switches the zoom function on or off.
PRINT
- starts a print-out
PAPER
- moves the paper forward one line
ON
- switches the analyser on
OFF
- switches the analyser to stand-by or off
À
- moves one step backwards in the menu
Á
- moves one step forward in the menu
Â
and
Ã
- move the cursor vertically in the menu
5.1.2 Selecting Menu Options
The menu structure is shown at the end of the manual. The various displayed menus are leading the user
through the structure.
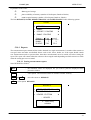
The following picture shows an imaginary screen, which explains the different types of existing lines.
17
OPERATION
GA-40 T plus
PARAMETER
œ
1
2
3
4
FUEL
STORE
O2R
FOOTER
Title line
•
11 %
YES
Option line
Command line
Data line
Switch line
Here is an explanation of the movement between the various menu options:
Â
and
Ã
- move the cursor vertically in the menu
À
- is the cursor (À) on the left side of the Title line, the key moves one step
backwards in the menu
Á
- is the cursor (Á) on the right side of the Option line or the Title line, the key leads
to the displayed Option .
ENTER
- executes the displayed function (starts data storage for example ), in the Command
line
starts or ends the respective edit function (setting the average time for example ) in
the Data line
switches (i.e. YES/NO) in the Switch line
0 to
9
- for fast movement between MENU options
If a displayed line carries a function, then there will be a number (1 to 8) on the left side of the line. Press the
number of the option you want to select, and the cursor (beam) will "jump" to the selected line and open the
option. If number 4 is pressed in the above demo screen the beam would move to FOOTER.
5.1.3 Entering Numbers
Numbers are edited as follows:
0 to
À
9
.
and
Á
C
- digital keys enter corresponding numbers
- move the cursor within the line
- erases whole number (zero on each position)
- Confirms and ends the entry
ENTER
5.1.4 Editing Text
Text is edited as follows:
Â
À
Ã
18
- switches the keyboard into either digital or alphabetical mode. When in digital mode
the cursor has a block form on the screen, in the alphabetical mode it has the shape
of an underlining
and
Á
- move the cursor within the text line
- erases the whole text line
GA-40 T plus
0 to
9
.
OPERATION
- the alphanumeric keys enter numbers in digital mode or letters in alphabetical mode.
Each key has a three letter designation. The first press enters the first letter, the next
presses the second and the third letter. Key presses in alphabetical mode does not
move the cursor.
0
- (SPACE) prints 0 number in digital and the space character in alphabetical mode.
The space moves all the next characters one position to the right..
C
- (DEL) erases the character above cursor position. This moves all the following
characters one position to the left.
ENTER
- ends the entering of a text (if only one line is edited - e.g. the name of a fuel) or
moves the cursor down to the next line (if there are several lines in the edited text e.g. the report header)
STORE
- end the editing of a header or footer - it enables the storage of edited text. If you do
not need to store the contents of header or footer you should leave the screen by
pressing the MENU key.
5.2
Basic operating instructions
5.2.1 Setting-up the analyser
Connect the components of the analyser system
G Attach the hose to the connector GAS. The plug from the heated hose connects to the socket
HEATED LINE.
G Ensure that the gas flow from the base of the analyser is free of obstructions.
If a soot test is to be carried out, then the folowing is also needed:
G heated probe holder
G soot filters
G soot comparison scale
5.2.2 Switching on
Before use, the condition of the analyser should be checked:
G Check the filter element. Clean or replace as necessary.
G Check the state of charge of the battery if the analyser is to be operated from the internal
battery. This is carried out by switching on and reading the battery voltage or charge from
the initial screen, or from the screen MENU/OPTIONS/DEVICE INFO.
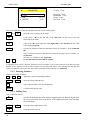
5.2.3 Switching off / Standby
Pressing the key [OFF] once will switch the analyser to the STANDBY mode.
In STANDBY mode the power consumption is drastically reduced. Amongst others the pump and the
backlight are switched off. Only the sensors remain supplied to be ready to operate immediately after the
instrument is switched on again.
The analyser does not switch to STANDBY mode if [OFF] is pressed in case:
G the key is being pressed during initial calibration. In that case the instrument notes the action,
but will switch to STANDBY only after the calibration is finished.
G the key is pressed while there is still a high gas concentration detected in the gas chamber. In
this case the instrument will automatically switch to FLOODING WITH AMBIENT AIR
mode and switch to STANDBY later on.
19
OPERATION
GA-40 T plus
The following screen is shown in the STANDBY mode.
** STANDBY **
m a d u r
TIME:
1h 23min
OFF
C
By pressing [OFF] the instrument can be switched off completely. If [C] is pressed the instrument switches
ON again. Is the instrument in STANDBY mode for more than 8.5 hours it switches off automatically. It is
highly recommended to carry out a calibration of the oxygen sensor when re-activating the instrument.
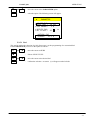
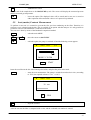
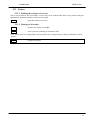
5.2.4 Initial Calibration
After the instrument is switched on it carries out an initial calibration for 2 minutes.
Initial calibration is of basic importance for measurement correctness and it must not be interrupted before it is
finished automatically.
During this time the oxygen sensor is calibrated to 20.95% using ambient air, and the other sensors (CO,
NO,...) will be zeroed.
m a d u r
GA-40 T plus
CALIBRATION 42 sec
DATE
TIME
BATTERY
17.10.96
13:42.27
12.6 V
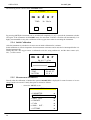
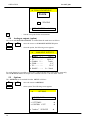
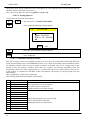
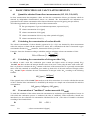
5.2.5 Measurement Parameters
Directly after the calibration is finished the option PARAMETER is displayed for control reasons or in case
changes need to be carried. Usually the option is selected as follows:
MENU
- selects the MENU screen
* MENU *
20
1
PARAMETER
•
2
PRESSURE
•
3
SOOT TEST
•
4
GRAPHIC
•
5
FLOW
•
6
ANAL. OUT.
•
7
OPTIONS
•
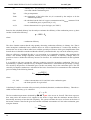
GA-40 T plus
Â
and
Ã
Á
OPERATION
- move the cursor to the PARAMETER option
- select the option. The following screen will appear:
œ
1
2
3
4
5
PARAMETER
SELECT FUEL
AVER.TIME :
O2R <NORM>:
BOILER PAR:
NO in Nox.:
10 sec
3 %
95 %
•
•
NATURAL GAS
CO2max:
15.5 %
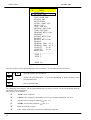
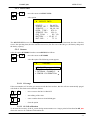
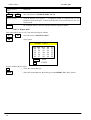
5.2.5.1 Fuel
This option enables the selection of a fuel (if necessary), or the programming of a customised fuel.
From PARAMETER you move to the option as follows::
Â
and
Ã
Á
Â
ENTER
- move the cursor to FUEL
- choose SELECT FUEL
and
Ã
- move the cursor to the desired fuel
- confirm the selection - an asterix (*) will appear on the left side
21
OPERATION
GA-40 T plus
FUELS
LIGHT OIL
* NATURAL GAS
TOWN GAS
COKE-OVEN GAS
LIQUID GAS
BIO-DIESEL
EXTRA LIGHT OIL
HEAVY OIL
COAL-TAR OIL
NATURAL GAS/FAN
TOWN GAS/FAN
PROPANE WITH FAN
PROPANE
BUTANE WITH FAN
BUTANE
BIOGAS WITH FAN
BIOGAS
MINERAL COAL 31.5
MINERAL COAL 30.3
LIGNITE
8.16
LIGNITE
9.34
WOOD DRY
-------------------FREE 1
FREE 2
.
.
FREE 10
œ
Each fuel of this screen is defined through various parameters. To view them proceed as follows:
Â
and
Ã
- move the cursor to the desired fuel
Á
- displays the fuel parameters , or gives the opportunity to enter fuel data for the
programmable fuels.
À
- back to option FUEL
The following screen appears. The pre-programmed fuels can only be viewed. For the user definable fuels all
parameters can be programmed.
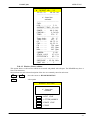
The variables are as follows:
22
G
NAME - Name of the fuel
G
CO2max - the maximum concentration of CO2 (for complete combustion, O2=0 %)
G
A1, B - factors for Siegert's formula , (Sec. 6.7)
G
ALPHA - fuel specific parameter , (Sec. 6.7)
G
O2R - the reference oxygen
G
Vatr - volume of the flue gas at perfect combustion of the fuel
GA-40 T plus
OPERATION
G
Hu - Heating value of the fuel
G
UNIT - unit in which the fuel is measured
œ
DEFINE FUEL
NAME
2 CO2max
[%]
15.8
3 A1
0.500
4 B
0.007
5 ALPHA
33
6 O2R
[%]
3
7 VAtr [m3/l]
5
8 Hu
[m3/l]
7
9 UNIT
kg
1
5.2.5.2 Average Time
To select the average time proceed as follows:
Â
and
Ã
- select Average Time editing
ENTER
0 to
9
- select the time ( 1 to 60 )
- confirm the number
ENTER
Â
- move the cursor to Average Time
and
Ã
- select min or sec
- confirm the selection
ENTER
5.2.5.3 Reference Oxygen parameter
To select the reference oxygen proceed as follows:
Â
and
Ã
- switches between a pre-programmed standard value <NORM> and a freely
programmable one, called the manual value.
ENTER
0 to
- move the cursor to O2R
9
- if "manual" was selected, a number from 1 to 20 can be entered
- confirms and ends editing
ENTER
5.2.5.4 Boiler Parameter
This option enables the user to have the relevant boiler parameters printed on the Report printout for exact
documentation.
Â
ENTER
Á
and
Ã
- move the cursor to BOILER-PARAMETER
- select with YES/NO whether or not the boiler parameters shall appear on the
printout, or be stored in a Report
- if YES was selected, this key moves to the Boiler Parameter menu. The boiler
parameters can be entered in the screen shown below:
23
OPERATION
GA-40 T plus
œ
1
2
3
BOILER PARAMETER
POWER :
CONSUM.:
TEMP. :
G
Boiler Power shown in kW
G
Boiler Consumption in m3/h or kg/h
G
Boiler Temperature in °C
22.4 kW
34.5 m3/h
350 °C
5.2.5.5 Content of NO in NOx
The expected content of NO in NOx is entered here in percent. The value is, according to experience, pre-set
to 95%. Special applications may require different settings. For these applications the factor can be set in a
range of 40 % to 100 %.
To change the calculation parameter proceed as shown below:
Â
and
ENTER
5.3
- move the cursor to NO in NOx
- select editing
ENTER
0 to
Ã
9
- enter the desired value from 40 to 100 (%)
- confirms the entered value and stores it
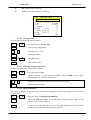
Displaying the measurement results
Select the measurement screen by pressing DATA. The measurement results are displayed on three screens,
either as Current Values or as Averaged Values.
5.3.1 Current Values
DATA
- select the first screen
CURRENT VALUES •
NATURAL GAS
TEMP.GAS
357 °C
TEMP.AMBIENT
23 °C
O2
5.31
%
CO2
11.24
%
CO
438 ppm
NOx
128 ppm
SL
24
%
ETA
76
%
LAMBDA
1.73
Á
24
- call the next screen
GA-40 T plus
OPERATION
œ CURRENT VALUES •
VOL.
Rel.
GAS
[ppm] Ÿ 3% O2
CO
COu
NO
--NOx
-----
438
475
128
--185
-----
511
624
194
--366
-----
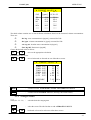
The third column contains one of four different calculations based on the measured volume concentrations.
These are:
G
Rel. mg - mass concentration in [mg/m3], corrected for O2R
G
Rel. ppm - volume concentration in [ppm], corrected for O2R
G
Abs. mg/m3 - absolute mass concentration in [mg/m3]
G
Emi. Mg/MJ - Emission in [mg/MJ]
Choose the desired values as folows:
Â
and
Ã
- move to the appropriate calculation
switch between the screens
À
and
Á
- moves backwards or forwards to one of the three screens
œ
CURRENT VALUES •
TEMP1
TEMP2
TEMP3
TEMP4
U/I1
U/I2
EXT.
EXT.
EXT.
EXT.
EXT.
EXT.
PRESSURE
SOOT
57
23
31
43
1.25
4.64
°C
°C
°C
°C
V
V
7.12
3
hPa
ENTER
- switches between AVERAGED VALUES and CURRENT VALUES
DATA
- switches On/Off the HOLD function ("freezing" the current values )
5.3.2 Averaged Values
, (Sec. 5.2.5.2)
- select the screen. The title line has to read AVERAGED VALUES
DATA
À
- select the desired averaging time
and
Á
- backward or forward to select one of the three screens
25
OPERATION
GA-40 T plus
- switches between AVERAGED VALUES and CURRENT VALUES
ENTER
C
- the display on the AVERAGED VALUES screen gets "synchronised" (a row of
strokes appears instead of the values) and a new averaging session starts. The
measurement results are displayed after the whole cycle is finished.
DATA
- switches on/off the HOLD function ("freezing" the current values )
{
If a continuous storage recording is taking place the analyser won't synchronise
the averaging process ( not to interfere with the continuity of storage )
5.3.3 The Averaging Process
The analyser is capable to display all results, measured or calculated, either as current value or as averaged
value. The averaging time can be selected in a range of 10 seconds to 60 minutes. If a time of 1 min was set,
the averaged results over that time would be shown on the display. During the averaging process a row of
strokes appears on the screen, since there are no results to display.
If measurement parameters are changed during the averaging process, the averaging cycle has to be re-started.
In case the data storage is activated it is stopped as well.
The following incidents cause an interruption of the averaging cycle.
G change of averaging time
G change of reference Oxygen
G change of fuel
G switching the instrument to STANDBY mode
G pressing "C"
5.4
Pressure/Draft Measurements
It is possible to measure differential pressure with the GA-40 T plus . To do so the stubs PRESSURE (-) and
(+) on the front plate are used. The measurement is performed as follows:
- select the main MENU
MENU
Â
Á
and
Ã
- move the cursor to PRESSURE
- select the option. The following screen appears
PRESSURE
œ
[hPa]
[mm H2O]
[PSI.]
GAS TEMP.:
C
12.54
128
5.25
563 °C
- ZEROING
The current pressure and gas temperature are displayed on the screen. The last line shows the command
ZEROING. By pressing this key the sensor is set to zero, e.g. the current value will be taken as zero
value.Please be aware that the sensor has to be zeroed before the measurement.
26
GA-40 T plus
C
OPERATION
- ZEROING the sensor
Connect end of the sample hose to the PRESSURE(+) stub. The screen will display the measured pressure
and the measured gas temperature.
À
5.5
- leaves the option. The displayed value will be stored until a new one is stored or
either a printout of the measured values or of a protocol is performed.
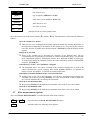
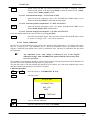
Soot (smoke) Contents Measurement
To perform a soot test it is essential to prevent the flue gas from condensing on the filter. Therefore it is
necessary to use a heated probe holder. This is available as an option with the analyser. It is only possible to
perform a soot test if the instrument is connected to the mains.
The soot test is done by means of the Bacharach comparison method.
- select the main MENU
MENU
Â
Á
and
Ã
- move the cursor to SOOT TEST
- select the option, the pump is switched off and the following screen appears:
SOOT TEST
œ
1/3
›
INSERT FILTER
ENTER
– START
Insert the soot filter in the slit of the heated probe holder, and place the probe in the stack.
ENTER
- starts the soot measurement. The pump is switched on and sucks in 60 s (according
to. TÜV) the required volume of 1.63 +/-0.07 l
œ
SOOT TEST
32 sec
C - STOP
C
- stops the soot test
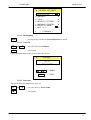
After the soot test the filter is compared with a scale, and the evaluated soot number is entered.
27
OPERATION
GA-40 T plus
SOOT TEST
œ
SOOT NUMBER: 5
ENTER THE SOOT NUMBER
0 to
9
- enter the detected soot number
ENTER
-
confirm the soot number
,
If the analyser is set for thre soot tests
(5.9.3.7), then you will be prompted to carry out the remaining
measurements. The result that appears is an average of the three values.
The soot number that is shown when the option is left remains stored until a new one is entered or the results
are either printed or stored as a report.
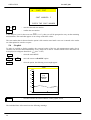
5.6
Graphic
To make it possible to display graphics, the averaged results of the last 100 measurement results (for 10
variables) are stored in the RAM memory. Every single one of the 10 variables which form a data block can
be displayed in a diagram. Data block , (Sec. 5.10.2 )
- select the main MENU
MENU
Â
Á
and
Ã
- move the cursor to GRAPHIC option
- select the option, the following screen might appear
Tamb
[°C]
30
0. Tamb
[°C]
NORMAL
AUTO
28
26
24
22
20
0h
MENU
30h
- switches ON/OFF the inserted MENU on the graphic screen
The individual lines of the menu have the following meanings:
28
GA-40 T plus
OPERATION
Number (0..9) and name of the measured value
1.
CO
unit on the Y-axis
[ppm]
type of graphic (NORMAL or FAST)
NORMAL
scale of the Y-axis (AUTO or MANUAL)
MANUAL
final value on Y-axis
Y=
90
y=
40
first value on Y-axis
principles for the use of the graphic menu:
move the selection bar in the menu with the [Â] and the [Ã] key. The parameters of the menu are defined as
follows:
select the variable to be drawn
G There are two ways of changing the currently displayed variable. By selecting the number on
the keyboard corresponding to the number of the variable (0..9), or by moving the selection
bar to the first line of graphic menu and pressing the [ENTER] key until the desired variable
appears.
change the Y-axis units
G Some of the variables can be presented on a diagram in two different units. The gas
concentrations may be presented on a diagram as volume concentration [ppm] or as absolute
mass concentration [mg/m3]. Furthermore pressure an be displayed in [hPa] or [mm H2O].
To make a unit change on a diagram you have to set the selection bar in the second menu line
and press [ENTER] key.
switch between "FAST" and "NORMAL" diagrams
G The instrument stores the values according to the selected averaging time as well as the
values calculated for a given averaging time of two seconds. Therefore it is possible to
display or print "fast graphic" (2 seconds) or normal graphic data.
switch between manual/automatic of the Y-axis selection mode
G Scaling of the Y-axis can be done automatic, or by the user. Switching between manual and
automatic can be done by pressing [ENTER]. Is a value selected which is either to high or to
low it will be automatically corrected by the instrument.
select the Y-axis maximum value
G By pressing [ENTER] t(in the fifth line) he maximum value of the Y-axis can be edited.
select the Y-axis minimum value
G By pressing [ENTER] (in the sixth line) he minimum value of the Y-axis can be edited.
5.7
Flow measurement (option)
The screen FLOW MEASUREMENT is reached from the main menu as follows:
Â
Á
and
Ã
- move the cursor to FLOW MEASUREMENT option
- select the option, the following screen appears:
29
OPERATION
GA-40 T plus
œ FLOW MEASUREMENT
0 m/s
C - ZEROING
CORR. FACTOR : 0.10
1
C
5.8
- Sets the zero point for the measurement
Analogue outputs (option)
The screen ANALOGUE OUTPUTS is reached from the main menu as follows:
Â
and
Ã
Á
- move the cursor to ANALOGUE OUTPUTS option
- select the option, the following screen appears:
œ
ANALOGUE OUTPUTS
CHANN. 1 :
FROM.....:
TO.......:
CHANN. 2 :
FROM.....:
TO.......:
1
2
3
5
6
7
9 RANGE....:
Tgas
0°C
1000°C
Tamb
0°C
50°C
0..20mA
For each channel it is possible to choose the variable and the range of the display separately.
The line RANGE enables the output to be switched between 0...20 mA and 4...20 mA.
5.9
Options
The OPTIONS can be reached from the MENU as follows:
Â
Á
and
Ã
- move the cursor to OPTIONS
- select option. The following screen appears
œ
6
30
OPTIONS
1
DEVICE INFO
•
2
SENSORS
•
3
SETTINGS
•
4
CONTROL LIST
•
"madur" SERVICE
•
GA-40 T plus
OPERATION
5.9.1 Device Info
Â
and
Ã
Á
- move the cursor to DEVICE INFO
- select option.
œ
DEVICE INFO
DEVICE....: GA-40Tp
SERIAL NO.: 20123014
SERVICE...: 18.01.94
OPER. TIME:
670 h
SERVICE IN:
130 h
GAS FLOW :
90 l/h
BATTERY...: 12.65 V
BAT.CAP. :
75 %
The DEVICE INFO screen shows the type of instrument, the serial no. of the instrument, the date of the last
service, the operating time, the time until the next service, the flow rate of the flue gas , the battery charge and
the battery capacity.
5.9.2 Sensors
select the option SENSORS from the screen OPTIONS as follows:
Â
and
Á
Ã
- move the cursor to SENSORS
- select the option. The following screen appears
œ
1
2
3
4
SENSORS
CO RANGE
1000
O2 CELL CALIBR.
•
EXTERNAL CHANNELS •
SENSOR CALIBRATION •
5.9.2.1 CO range
If the concentration of CO in the gas stream exceeds the limit set here, then the cells are automatically purged
with fresh air.This limit can be altered as follows:
 and Ã
ENTER
0 to
ENTER
- move cursor to the line CO RANGE
-
9
start editing of the value
- enter a number between 0 and 20000 ppm
-
close the option
5.9.2.2 O2 Cell calibration
To increase the accuracy of the O2 sensor during measurements over a longer period of time the GA-40T plus
allows the sensor to be calibrated with ambient air.
31
OPERATION
GA-40 T plus
Take the probe out of the stack !
Â
and
Ã
Á
- move the cursor to O2 CELL CALIBRATION
- select the option. The following screen appears
O2 CELL CALIBR.
œ
CALIBRATES THE O2
SENSOR AT 20.95%
O2 = 20.25%
ENTER
- CONFIRM
- confirms the calibration
ENTER
5.9.2.3 External channels
Get from the screen SENSORS to the option EXTERNAL CHANNELS as follows:
Â
and
Ã
Á
- move the cursor to EXTERNAL CHANNELS
- select option.
œ EXTERNAL CHANNELS
1
2
3
4
5
6
8
9
Â
ENTER
and
Ã
TH
PT
T1
T2
T3
T4
GAS....:
AMB....:
EXT....:
EXT....:
EXT....:
EXT....:
U/I1 EXT. :
U/I2 EXT. :
Ni-CrNi
Pt 500
Ni-CrNi
Pt-RhPt
Pt 100
Pt 500
* U *
* I *
- move the cursor to the line to be changed
- change the setting
5.9.2.3.1 Gas temperature sensor - TH GAS
ENTER
- default setting: NiCr-Ni. For special applications (temperatures up to +1600°C) the
setting can be changed to PtRh-Pt thermocouple. Of course that would need the use
of the respective thermocouple as well.
5.9.2.3.2 Ambient temperature sensor - PT AMB.
32
GA-40 T plus
OPERATION
- default setting: Pt 500. The ambient temperature can either be measured with an
internal sensor placed in the probe plug (Pt500), or with an external sensor (Pt500),
connected to the TEMP1 (T3 EXT.) socket.
ENTER
5.9.2.3.3 External thermocouple- - T1 EXT and T2 EXT
- Select the desired temperature sensor. The T1 EXT and T2 EXT inputs can be
defined as Ni-CrNi, Pt-RhPt or Fe-CuNi thermocouples
ENTER
5.9.2.3.4 External resistance thermometer - T3 EXT and T4 EXT
- Select the desired temperature sensor. The inputs T3 EXT and T4 EXT can be
defined Pt100, Pt500 or KTY-2k thermistors.
ENTER
5.9.2.3.5 External Voltage/Current inputs - U/I1 EXT and U/I2 EXT
Select the desired signal in the respective line by pressing [ENTER]
- Select the desired input signal . On both of the sockets U/I1 and U/I2 either current
(0-10 mA) or voltage (-10V - +10V) can be measured.
ENTER
5.9.2.4 Sensor calibration
Besides O2 every electrochemical sensor needs to be calibrated with calibration gas. To calibrate the sensors
they are fed one by one with calibration gas of a known concentration. After a few minutes the sensor
supplies a stabilised signal which can be stored as calibration value. The order of calibration does not effect
the calibration.
{
Any calibration screen value change is followed by loss of the original
calibration settings. Thus CALIBRATION option should be selected only when
it is to be carried out.
The standard gas concentration should be similar to that usually met during measurement and it should not be
less than 10% of the required measuring range of a given sensor
The time the sensor is fed with standard gas should not be less than 4 min. After each calibration the sensors
should be flooded with ambient air for at least 15 minutes.
Calibration procedure
Â
Á
and
Ã
- move the cursor to CALIBRATION W. GAS
- select the option
œ
ATTENTION
CALIBRATION!
ARE YOU
SURE
ENTER
ENTER
À
- CONTINUE
- carry on with the calibration
- abort the calibration, move back to SENSORS
33
OPERATION
GA-40 T plus
œ
WITH CO
WITH NO
1
2
Â
and
Ã
Á
CALIBRATION
GAS
GAS
•
•
- move the cursor to the sensor to be calibrated
- select the gas
The individual lines have the following meanings:
G
SIGNAL - the actual signal, supplied by the sensor
G
STORED -the signal value stored at the last calibration
G
GAS [ppm] - the concentration of the standard gas
œ CALIBRATION:
NO
Sensor Signal Stored
CO
21
22
NO
1206
1208
GAS [ppm]:
* STORE *
- in the GAS [ppm] line, starts editing of the standard gas concentration
ENTER
0 to
402
9
- enter the concentration of the standard gas [ppm]in the line GAS [ppm]
- in the GAS [ppm] line. Confirm standard gas concentration.
ENTER
Supply the instrument with standard gas for about 4 min.
- in the STORE line, as soon as the value has stabilised, stores the measured value as
calibration value.
ENTER
Disconnect the standard gas and flood the instrument for at least 15 min with ambient air
À
- return to select the next gas, or end the calibration
5.9.3 Settings
This option allows the user to adjust some of the standard settings.
Â
Á
34
and
Ã
- move the cursor to the option DEVICE SETTINGS
- select the option
GA-40 T plus
OPERATION
œ
DEVICE SETTINGS
1
BACKLIGHTING
2
CONTRAST
•
3
CLOCK
•
4
PRINTER SETTINGS
•
5
LANGUAGE/COUNTRY
ACOUSTIC WARN.
SOOT 1/3:
•
6
7
1
* STANDARD *
9
5.9.3.1 Backlighting
- pressing the key switches the BACKLIGHTING on and off
ENTER
5.9.3.2 Contrast
:
Â
and
Ã
Á
- move the cursor to CONTRAST
- select option
Follow the explanations on the screen to adjust the contrast
CONTRAST
œ
50 %
À Á
ENTER
- CHANGE
- STORE
5.9.3.3 Date/time
This option allows the internal clock to be set.
Â
Á
and
Ã
- move the cursor to DATE/TIME
- select option
35
OPERATION
GA-40 T plus
DATE/TIME
œ
12:34
TIME
DATE
1
2
DATE FORMAT:
4
Â
and
Ã
d-m-y
- move the cursor to desired line
- opens editing
ENTER
0 to
: 17.34.54
: 23.10.96
9
- set date and time. The time is entered in the following sequence: TIME HH:MM.SS,the date as indicated in the line DATE FORMAT.
- confirms settings
ENTER
5.9.3.4 Printer settings
This option allows the printer (printout) settings to be defined.
Â
and
Ã
Á
- move the cursor to PRINTER SETTINGS
- select option
œ PRINTER SETTINGS
1
2
3
4
SHORT FORM
:
AUTOM. PRINTOUT:
NO. OF COPIES :
ADDRESS NO.
:
- Address -
©
©
1
3
4 - lines
freely editable
SHORT FORM
ENTER
- switches between YES/NO. If the option is activated, then a print-out of the current
values will show only the volume concentrations of the gases, not the mass
concentrations in mg/m³. A stored report will still have all the information as usual.
AUTOMATIC PRINTOUT
ENTER
36
- switches between YES/NO. If the option is activated, automatic printouts will be
carried out according to the programmed average time, provided the time is not less
than 2 min. If the average time is shorter than 2 min. only one printout will be
performed.
GA-40 T plus
OPERATION
NUMBER OF COPIES
- switches between 1/2/3.
ENTER
ADDRESS NO.
The instrument can store up to 50 addresses. Number one is already stored and can
not be changed. If address 0 is selected, no address will be on the printout. The
addresses 2 to 50 are freely programmable.
- activates address selection
ENTER
Â
and
Ã
- select the address(number)
- confirms the selection.
ENTER
ENTER ADDRESS
This option allows the user to edit the address(es) under the number defined in the above option ADDRESS
NO. An address can consist of up to 4 lines of 20 characters.
Á
- select option. Edit the address according to the on-screen instructions.
- stores the edited address as displayed.
STORE
À
- by pressing this key the edit-screen is left without storing changes if the cursor is
positioned in the upper left corner of the screen.
5.9.3.5 Language/Country
The instrument enables the user to select between 4 languages and carry out a number of country specific
settings
Â
and
Ã
Á
- move the cursor to LANGUAGE/COUNTRY
- select option
œ
M DEUTSCH
ENGLISH
FRANCAIS
ITALIANO
1
2
3
4
6
7
8
9
Â
ENTER
and
Ã
LANGUAGE
TEMPERATURE:
DEC. POINT :
PRESS. UNIT:
SL + 9.9% :
[°C]
.
hPa
- move the cursor to the selected language
- confirms the selection
The four lowerlines contain some country specific settings
ENTER
-
switches the desired settings
5.9.3.6 Acoustic Warning
ENTER
- select YES/NO whether or not an acoustic alarm warns if an error occurs.
37
OPERATION
GA-40 T plus
5.9.3.7 Soot Test
- select whether 1 or 3 soot tests shall be performed
ENTER
5.9.3.8 Standard
- sets the instrument to default settings
ENTER
5.9.4 Control list
The option CONTROL LIST displays a list of all the parts of the analyser. The list shows which
subassembly functions correctly (OK), or which is defective (ERROR) and the current signal or value
measured.
Â
and
Á
Ã
- move the cursor to CONTROL LIST
- select option
CONTROL LIST
œ
CO I
CO II
: OK
: OK
NO
:
:
:
:
:
:
:
:
:
:
:
:
:
:
:
:
O2
PRESSURE
TH GAS
PT AMB.
T1 EXT
T2 EXT
T3 EXT
T4 EXT
NTC
BATTERY
U/I1 EXT
U/I2 EXT
OK
OK
OK
OK
OK
OK
OK
OK
OK
OK
OK
OK
OK
5.9.5 madur Service
This option is for service engineers only. A code is needed to enter the menu - exit with [MENU] key.
5.10 Storing of Results
Since the measured results can be stored in the EEPROM memory, it is possible to read them out later for
treatment using the WINFGA software. Data can be stored in two separate forms. Up to 30 measurement
reports and up to 10 banks from continuous measurements containing a total of 1024 sets of results. Using an
averaging time of 30 minutes, this would allow the results of over 21 days of measurements to be stored
(please be aware that for measuring sessions of that length a proper gas conditioning system is absolutely
necessary)
STORE
38
- selects the menu STORE
GA-40 T plus
OPERATION
Explanation of the Table:
G
Store -type of storage
G
free - availability of memory (number of free Reports, Banks or Blocks)
G
used -occupied memory (number of free Reports, Banks or. Blocks)
The lines REPORTS, BANKS, REPORT ERASING and BANKS ERASING lead to following options:
STORE
1
REPORTS
2
BANKS
•
3
REPORTS ERASING
•
4
BANKS ERASING
•
Store
free
REPORTS. 28
BANKS
7
BLOCKS
700
•
used
2
3
324
5.10.1 Reports
The measurement report contains all the results obtained in a single measurement. It contains either current or
averaged values and other user-defined factors such as fuel, footer, header etc. If the report should contain
soot measurement results or pressure data, then these measurements must be carried out before storing the
report. The report will contain either the current or the averaged results depending on which screen was visible
when the storing process was started.
5.10.1.1 Storing measurement reports
Store REPORTS as follows
- the measured values are displayed. Do you want to print the displayed values
proceed as follows
DATA
- select option . The measured values are stored in a buffer memory
STORE
Â
Á
and
Ã
- move the cursor to REPORTS
-select option REPORTS
REPORTS
1
STORE REPORT NO.: 12
2
REPORT TABLE
•
3
HEADER EDITION
•
- HEADER 4 - lines freely
editable
39
OPERATION
, (5.10.1.3)
Â
and
Ã
, (5.10.1.4)
GA-40 T plus
- edit header
- move the cursor to STORE REPORT NO. XX
- if all 30 Reports are occupied, -- is displayed instead of a number and it is not
possible to store the Report. At least one Report has to be erased before a new one
can be stored.
- the "buffered" data are stored in a Report with the displayed number.
ENTER
5.10.1.2 Report table
This option allows one to view, print and erase Report contents.
Â
Á
and
Ã
- move the cursor to REPORT TABLE
- select option
REPORT TABLE
M 01 M 02 M 03
06
11
16
21
26
07
12
17
22
27
ENTER
C
08
13
18
23
28
04
09
14
19
24
29
05
10
15
20
25
30
- SHOW
- ERASE
Reports without [M] are empty.
C
ENTER
40
- erases the selected Reports
- shows the selected Reports, the following screen REPORT NO.: XX is opened
GA-40 T plus
OPERATION
œ REPORT NO.: 12
11:23.52
16.01.94
-------------------4 - lines free
editable
-------------------FUEL
O2R.........: 3 %
AVERAGE TIME: 10 min
-------------------POWER :
40.0 kW
CONSUM.:
1.5m3/h
TEMP. :
270 °C
-------------------Temp Amb:
21 °C
Temp Gas:
327 °C
O2 .....:
16.72 %
CO2.....:
11.23 %
CO .....:
734 ppm
NO .....:
125 ppm
NOx.....:
145 ppm
-------------------LAMBDA
1.00
STACK LOSS
17.6 %
EFFICIENCY
92.7 %
-------------------PRESSURE : 12.34 hPa
SOOT NO. :
5
5.10.1.3 Header (Notice) edition
This option allows to edit a notice which can be stored and printed with a Report. The HEADER may have 4
lines of 20 characters.
Measurement site and/or short description of the site are commonly stored in such notes.
Â
Á
and
Ã
- move the cursor to HEADER EDITION
- select option
HEADER EDITION
4 - lines free
editable
ENTER
-NEXT LINE
ž
-LETTER/NUMBER
Ÿ
-ERASE LINE
STORE
-STORE
41
OPERATION
GA-40 T plus
The pictures show screens without text.The screen appears as it was when the report was stored. How the text
should be edited is described in section 5.1.4.
This screen can be left at any time using [MENU] and [DATA].
5.10.1.4 Erasing Reports
All protocols can be erased in that option.
Â
and
Á
Ã
- move the cursor to ERASING REPORTS
- select option, the following warning appears
œ
ATTENTION !
ALL REPORTS
WILL BE ERASED
ENTER
À
- YES
- leaves the screen without erasing the Reports
ENTER
- erases all Reports
5.10.2 Continuous storing of results
This type of storing involves the continuous storing of a set of up to 10 measurement results (ONE BLOCK)
during a measurement session. The EEPROM can store up to a total of 1024 blocks freely dividable between
10 measuring sessions. These 10 sets of results are known as BANKS. The size of a single bank is only
limited by the free memory available. Each bank also contains all necessary information about the
measurement (fuel, time, O2R, averaging time etc.). All the results stored are average results for the time set.
If the analyser is switched off, and under certain circumstances, the storing of averaged results will stop
automatically.
This is signalled by a single long warning tone.
The following table shows the contents of a data block.
LZ
1
2
3
4
1
2
3
4
5
6
7
8
9
10
42
Measured Value
TEMP. AMBIENT
TEMP. GAS
SENSOR 1 - O2
SENSOR 2 - CO
SENSOR 3
SENSOR 4
SENSOR 5
SENSOR 6
TEMP1 EXT
TEMP2 EXT
TEMP3 EXT
TEMP4 EXT
U/I 1 EXT
U/I 2 EXT
Description
These parameters can not be changed,
they will be stored in each block,
together with the results from all other
Out of these parameters, the ones activated
will be stored with the data block,
assuming that there are channels free
GA-40 T plus
OPERATION
Starting the continuous storing of results (in Banks)
- call the STORE menu
STORE
check whether enough free memory is available for the measurement. If not, one or more banks must be
erased. The option ERASE ALL BANKS can be used.
Â
and
Ã
Á
, (05.10.2.2)
- move the cursor to the option BANKS
- open the option BANKS
Â
and
Ã
- move the cursor to the line STORAGE
Set or check the averaging time.
, (5.2.5.2)
ENTER
- start the storing, the word ACTIVE appears
DATA
- the measured/calculated values are shown, storage is active
Stopping the continuous storing of results
- call the STORE menu
STORE
Â
and
Ã
Á
and - move the cursor to the option BANKS
- open the option BANKS
Â
and
Ã
- move the cursor to the line STORAGE
- storage is stopped, the word ACTIVE disappears
ENTER
5.10.2.1 Banks Table
The option BANKS TABLE provides information about the stored Banks.
Â
and
Á
Ã
- move the cursor to the option BANKS TABLE
- select the option BANKS TABLE.
BANKS TABLE
NO.
1
2
3
4
5
6
7
DATE
07.10.96
09.10.96
15.10.96
SIZE
73
180
124
The column headings have the following meanings:
G
No. - Bank No. from 1 - 10
G
Date - Date (DD.MM.YY) - shows when the storage took place
G
Size. - Bank size - the number of already in the respective Bank stored Blocks
43
OPERATION
GA-40 T plus
The last bank can be erased in the BANKS TABLE screen (the Bank may not be active)
Â
and
Ã
C
- move the cursor to the last stored Bank
- erase Bank
5.10.2.2 Erasing Banks
The option ERASE BANKS allows to erase all Banks.
Â
and
Á
Ã
- move the cursor to ERASE BANKS
- select the option ERASE BANKS
œ
ATTENTION !
ALL BANKS
WILL BE
ERASED
ENTER
À
- YES
- leaves the screen without erasing BANKS
ENTER
- erases all BANKS
5.11 Data-Logger
A data-logger is a instrument that measures variables that have been converted to an electrical signal and
stores them for later evaluation.
The inclusion of analogue inputs as shown below and the possibility of storing these results enables the
GA-40 Tplus
plus to operate as a data-logger as well.
The analyser is fitted with the following inputs:
G two currents or voltages (V / mA)
G two thermocouples (Ni-CrNi / Pt-RhPt / Fe-CuNi)
G two resistance thermometers (Pt100 / Pt500)
The signals registered by the analogue inputs can either be read from the DATA screen or be stored
continuously in a bank, if there are channels free.
The WINFGA software can then be used for further treatment of these results.
{
44
The ground (GND) of all analogue inputs is connected to the instrument
ground.
GA-40 T plus
OPERATION
5.12 Printer
5.12.1 Printing the contents of a screen
This is not possible for the screen (D1). A screen may not be printed whilst data is being entered using the
alphanumeric keyboard until this activity has been ended.
PRINT
- prints the contents of a screen
5.12.2 Printing of all results
DATA
- open the first results screen (D1)
PRINT
- start a print-out containing all measured results
If the current values are displayed they will be printed; if the averaged values are displayed then these will be
printed.
PAPER
- transports the paper
45
OPERATION
GA-40 T plus
m a d u r
GA-40 T plus
19.12.93
13:23.41
-----------------------FLUE:
NATURAL GAS
O2R
3 %
AVERAGE TIME: 30 min
-----------------------POWER
:
42.0 kW
CONSUMPTION.:
8.4 l/h
TEMP........:
230 °C
-----------------------TA
21 o C TG
168 o C
O2
8.2% CO2 7.60 %
-----------------------CO
100ppm
125mg/m3
NO
46ppm
78mg/m3
NOx
48ppm
123mg/m3
COu
99ppm
-----------------------CO rel
xxxxx mg/m3
NO rel
xxxxx mg/m3
NOxrel
xxxxx mg/m3
-----------------------EXCESS AIR...:
2.2
STACK LOSS...:
14.5 %
ETA........:
84.2 %
ETA*.......:
82.9 %
-----------------------PRESSURE..:
16.21 hPa
SOOT NO...:
4
-----------------------m
a
d
u
r
E L E C T R O N I C S
A-1220 WIEN, VOITGASSE 4
T:2584502
F:258450222
46
GA-40 T plus
6
BASIC PRINCIPLES OF CALCULATING RESULTS
BASIC PRINCIPLES OF CALCULATING RESULTS
6.1
Quantities obtained from direct measurements (O2, CO, NO, SO2)
In direct measurements the temperature values and also the concentration of those gas elements which are
detected by independent electrochemical sensors are obtained. The electrochemical cell indications are
proportional to the volume concentration of the detected elements expressed in [ppm] (parts per million).
The following quantities are obtained by means of direct measurement:
G flue gas temperature T gas and ambient temperature, expressed in [oC]
G volume concentration of CO [ppm]
G volume concentration of NO [ppm]
G volume concentration of SO2 (or any other optional cell) [ppm]
G volume concentration of O2 [%]
6.2
Calculating the concentration of carbon dioxide
The volume concentration of carbon dioxide (expressed in [% vol]) is not obtained by direct measurement
unless the analyser is fitted with the optional CO2 sensor, but is calculated on the basis of measured oxygen
concentration and the CO2max parameter, characteristic for the given fuel.
Formula 1 shows the formula according to which the analyser calculates volume concentration of CO2:
Œ
CO2 = CO2max • 1−
6.3
O2meas [%]
20.95%
Calculating the concentration of nitrogen oxides NOx
In addition to nitric oxide NO, combustion gases contain also higher oxides of nitrogen (mainly NO2)
GA-40 T plus does not have the nitrogen dioxide sensor in its basic version, only the nitric oxide sensor NO.
But it is possible to calculate the NO2 contents on the basis of the measured NO. It is generally assumed that
nitric oxide NO contained in combustion gases makes up about 95% of the total amount of nitrogen oxides
NOx. GA-40 T plus calculates the total concentration of nitrogen oxides NOx according to the following
formula:
NO X [ppm] =
•
NO[ppm]
0.95
If the optional sensor of the GA-40 T plus analyser is the NO2 sensor there is no need to calculate the amount
of NO2. Then the NOx concentration is calculated by the analyser as a simple sum of measured NO and NO2
concentrations.
NO X [ppm] = NO[ppm] + NO2 [ppm]
Ž
6.4
Concentration of "undiluted" carbon monoxide COundil
To make the calculation of the carbon monoxide concentration in combustion gases independent of excess air
with which the combustion process is conducted, the idea of "undiluted" carbon monoxide COundil was
introduced (it is also called the CO concentration calculated for 0% O2 ). The value of COundil is calculated
according to the formula below:
COundil = CO ⋅ λ
•
where:
CO
- volume concentration CO[ppm]
47
BASIC PRINCIPLES OF CALCULATING RESULTS
λ
GA-40 T plus
− excess air number
As can be seen, the concentration of "undiluted" CO is the hypothetical concentration that would have been
formed if the same amount of carbon monoxide had appeared in combustion gases when burning without
excess air (where λ = 1, so O2 = 0%).
6.5
Mass concentrations of gas components
GA-40 T plus also makes calculations of mass concentration expressed in [mg/m3] from the concentration
expressed in [ppm]. Mass concentration of gas elements depends on the gas pressure and temperature. To
make comparison of results possible, the idea of standard conditions was introduced, that is standard
temperature and pressure values at which the mass concentration of the elements is calculated. In the
GA-40 T plus system standard conditions of 1000 hPa and 0oC were taken.
The analyser indicates two different values expressed in [mg/m3], they are the so called absolute mass
concentration and mass concentration relative to oxygen. These values are often confused - in the next section
the way they are calculated and the differences between them are explained.
6.5.1 Absolute mass concentration of gas components
Absolute mass concentration defines how many milligrams of a given gas is contained in 1m3 of combustion
gas at standard conditions (1000 hPa, 0oC). The concentration value is calculated from the concentration
expressed in [ppm] using the factor A from table 6. The following formula shows how the absolute mass
concentration is calculated (here CO concentration):
mg
CO
= CO[ppm] ⋅ A CO
m3
•
where:
CO[mg/m3]
- absolute CO mass concentration in combustion gas (at standard conditions).
CO[ppm]
- absolute CO volume concentration in combustion gas (from measurement).
ACO
- correction factor from table 6.
Gas
mg
m * ppm
A
3
CO
1.250
NO
1.340
SO2
2.860
NO2, NOx
H2S
2.056
H2
0.089
1.520
Tab. 6: Factors to correct concentration in [ppm] into mass concentration in [mg/m3] (at standard
conditions 1000 hPa, 0oC).
Note:
mass concentration of nitrogen oxides (NOx) is calculated by the analyser
(according to the standards) using the nitrogen dioxide (NO2) factor.
Mass concentration calculated by GA-40 T plus is comparable with the results obtained by other methods (or
different types of analysers) only when b o t h c a l c u l a t i o n s h a v e b e e n c a r r i e d o u t
based on the same standard conditions.
48
GA-40 T plus
BASIC PRINCIPLES OF CALCULATING RESULTS
6.5.2 Mass concentrations relative to the concentration of oxygen in combustion
gases
As well as absolute mass concentration, the mass concentration relative to oxygen concentration in the
combustion gases is calculated. The concentration of a given component in relation to oxygen concentration is
expressed by the following formula (as an example for CO value):
20.95% - O2ref
mg
mg
⋅ CO m3
COrel m3 =
20.95% - O2meas
‘
where:
COrel
- CO concentration in relation to oxygen expressed in [mg/m3]
O2ref
- reference oxygen, conventional parameter (chosen by selecting fuel or entered
independently from keyboard) expressed in [% vol]
O2meas
20.95%
- the measured concentration of O2 in combustion gases expressed in [% vol]
CO
- oxygen concentration in pure air
- the measured concentration of CO in combustion gases expressed in [mg/m3]
(absolute mass concentration)
Using similar formulae, the concentrations in relation to oxygen concentration of sulphur dioxide SO2,
nitrogen oxides NOx and other gases are calculated. The concentration related to oxygen concentration was
introduced to make the evaluated concentration independent of the way the combustion process is carried out.
The absolute value (expressed in [ppm]) can be lowered artificially in the combustion process with an increase
in excess air (large amount of O2 in combustion gases). It does not have to be a decrease of the total emission.
The formula which calculates concentration related to oxygen takes into account the oxygen concentration of
the combustion gases, making the results independent of the excess air factor.
The parameter O2ref - reference oxygen is a standard value. Standards recommend different values of this
parameter for various types of fuel. In the system GA-40 T plus the value of reference oxygen can be accepted
automatically in the process of fuel selection (the so-called a u t o m a t i c reference oxygen choice) or
entered by the operator from the keyboard (the so-called m a n u a l selection of reference oxygen). Relative
mass concentration calculated from two different measurements are comparable only if t h e s a m e
r e f e r e n c e o x y g e n a n d t h e s a m e s t a n d a r d c o n d i t i o n s have been used.
Note:
6.6
If O2meas < O2ref then relative concentration COrel calculated from formula ‘ is
less than absolute concentration. I n s u c h a c a s e , t h e a n a l y s e r
replaces the value of relative concentration with the
value of absolute mass concentration.
Calculating combustion parameters
Beside calculating gas component concentrations the analyser calculates some parameters describing the
combustion process. The formulas for calculating combustion parameters are empirical formulas. The
GA-40 T plus analyser calculates the parameters of the combustion process according to the principles laid
out in DIN standards.
The most important parameter is the amount of heat convected by combustion gases to the environment - the
so-called chimney loss (stack loss) SL. Chimney loss in calculated on the basis of the empirical formula known
as Siegert's formula:
’
A1
•
S = T
−T
+ B
L gas
amb CO
2
where:
49
BASIC PRINCIPLES OF CALCULATING RESULTS
GA-40 T plus
SL
- chimney loss - the percentage of heat produced in combustion process, which is
convected with the combustion gases.
Tgas
- flue gas temperature
Tamb
- the temperature of the boiler inlet air (it is assumed by the analyser to be the
ambient temperature)
CO2
- the calculated (on the basis of oxygen concentration and CO2max) amount of CO2
in combustion gases, expressed in [% vol]
A1, B
- factors characteristic for a given fuel type (see Table 7)
Based on the calculated chimney loss the analyser estimates the efficiency of the combustion process η (don't
confuse it with boiler efficiency)
η = 100% - S
L
“
where:
η
- combustion efficiency
The above formula assumes that the only quantity decreasing combustion efficiency is chimney loss. Thus it
omits incomplete combustion losses, radiation losses etc. Such a simplification is a result of the inability to
measure the size of most of these other losses with the gas analyser. Because of this gross simplification in the
formula above it should be remembered that the efficiency calculated in this way can not be treated as precise.
However, efficiency calculated like this is very convenient as a comparable parameter when regulating the
furnace. The formula, though simplified, reflects precisely the tendencies of efficiency change, thus it is
possible to observe whether the efficiency increases or decreases. It is sufficient information for the regulation
process.
It is possible to take into account the efficiency reduction caused by incomplete combustion. This loss is
represented by a quantity called the loss by incomplete combustion IL. It determines the percentage of energy
loss caused by the presence of flammable gases (in this case mainly CO) in the combustion gases. The loss
caused by incomplete combustion is calculated on the basis of measured CO concentration in the combustion
gases according to the following formula:
IL =
”
α • CO[%]
CO[%] + CO 2 [ %]
where:
CO, CO2
- volume concentrations of CO and CO2 in the combustion gases
α
- the factor specific for a given fuel
Calculating IL enables correction of the previously calculated (formula 8) combustion efficiency. Then the socalled corrected efficiency η* is calculated:
η* = η − IL
The last combustion parameter calculated by GAGA- 40 T plus is the excess air factor ë. This factor expresses
how many times the amount of air supplied to the boiler is larger than the minimum amount which is
theoretically necessary to burn the fuel completely. The system calculates the excess air factor on the basis of
the known CO2max value for the given fuel and the calculated concentration of CO2 in the combustion gases
using the formula:
•
50
λ=
CO
CO
2max
2meas
GA-40 T plus
BASIC PRINCIPLES OF CALCULATING RESULTS
The above formula may be transformed with the use of formula Œ
•λ =
6.7
into the form:
20.95%
20.95% − O2meas [%]
Fuel parameters
The basis for correctly determining the quantities describing the combustion process is the knowledge of fuel
parameters. GA-40 T plus analyser has stored parameters for several standard fuels. Table 7 presents
parameters for all the analyser fuels.
No
Fuel type
CO2max
A1
B
α
0.5000
0.3700
0.3500
0.2900
0.4200
0.4567
0.5900
0.6100
0.6500
0.4600
0.3800
0.5000
0.4750
0.5000
0.4750
0.7800
0.7100
0.6830
0.6720
1.1130
0.9880
0.6500
0.007
0.009
0.011
0.011
0.008
0.005
0
0
0
0
0
0
0
0
0
0
0
0
0
0
0
0
52
32
32
32
32
52
52
52
52
32
32
32
32
32
32
32
32
69
69
69
69
69
[%]
1.
Light oil
2.
3.
4.
5.
6.
7.
8.
9.
10.
11.
12.
13.
14.
15.
16.
17.
18.
19.
20.
21.
22.
Natural gas
Town gas
Coke-oven gas
Liquid gas
BIO-Diesel
Extra light oil
Heavy oil
Coal-tar oil
Natural gas with fan
Town gas with fan
Propane with fan
Propane
Butane with fan
Butane
Biogas with fan
Biogas
Mineral coal HV 31.5
Mineral coal HV 30.3
Lignite HV 8.2
Lignite HV 9.4
Dry wood
O2ref
[%]
15.4
11.7
13.1
10.2
14.0
15.7
15.3
15.9
18.0
12.1
10.0
13.7
13.7
14.1
14.1
11.7
11.7
18.8
18.5
19.1
19.1
19.4
3
3
3
3
3
3
3
3
3
3
3
3
3
3
3
3
3
11
11
11
11
11
Vatr
[m³]
Hu
[MJ/UNIT]
42.70
35.90
16.10
17.40
93.20
41.80
41.80
41.00
37.70
35.90
16.10
93.20
93.20
123.80
123.80
35.90
35.90
31.50
30.30
8.16
9.34
15.60
Unit
kg
m³
m³
m³
m³
kg
kg
kg
kg
m³
m³
m³
m³
m³
m³
m³
m³
kg
kg
kg
kg
kg
Tab. 7: Parameters of fuels stored in the memory of GA-40 T plus analyser.
Table 7. shows the following parameters:
CO2max
- the maximum concentration of carbon dioxide in the combustion gas, a quantity
specific for a given type of fuel. The parameter determines the amount of carbon
dioxide in the combustion gases if the combustion process is carried out with
excess air factor l equal 1.
A1, B
- factors which appear in Siegert's empirical formula
α
- the factor used to calculate loss caused by incomplete combustion.
It should be assumed
α = 69 for solid fuels
α = 52 for liquid fuels
α = 32 for gaseous fuels
51
BASIC PRINCIPLES OF CALCULATING RESULTS
6.8
GA-40 T plus
O2ref
-reference oxygen - the parameter used to calculate relative concentrations of
components (formula 4). It is a standard quantity. In the table, it has been assumed
that as in DIN standards that it is: 11% - for solid fuels and 3% for gaseous and
liquid ones.
HV
- fuel quality - the amount of energy emitted during complete combustion of 1
kilogram (or 1m3 in case of gas) of fuel.
The influence of fuel parameters on the accuracy of result calculations
As has already been mentioned, GA-40 T plus does not measure the concentration of carbon dioxide, but
calculates it from the measured oxygen concentration and the CO2max parameter. On basis of CO2
concentration calculated in this way, the chimney loss, combustion efficiency and loss by incomplete
combustion are calculated. Obviously, the fuel parameters (especially CO2max), have a fundamental influence
on calculations of combustion processes. The following results calculated by GA-40 T plus are affected by
fuel parameters:
CO2 contents
- depends on CO2max
SL chimney loss
η and η*
- depends on CO2max, A1 and B
- depends on CO2max , A1 and B
IL loss by incomplete combustion - depends on CO2max and α.
As formula • shows, t h e v a l u e o f t h e e x c e s s a i r f a c t o r i s i n d e p e n d e n t o f
f u e l p a r a m e t e r s . The calculated results of gas quantities (except CO2) and the results of
temperature measurements and power quantities do not depend on fuel parameters either.
Please note that fuel quality HV does not appear in any formula. This parameter d o e s
influence
any
measurement
result
shown
by
GA-40 T
52
not
plus.
plus
GA-40 T plus
7
FRONT VIEW WITH KEYBOARD
BLOCK DIAGRAM
Heating
PROBE PIPE
HEATED FILTER
HEATED HOSE
PRESSURE
+
Condensate
outlet
U1
U2
I1
I2
Pt1
Pt2
Th1
Th2
PRINTER
RS 232
Display
Dryer
inlet
KEYB.
PERISTALTIC
PUMP
GAS COOLER
FILTERS
VALVE
CPU
PURG. PUMP
Analog
VALVE
MAIN PUMP
O2
NO
SO2
CO
T
Thermistor NTC
BATTTERY
Supply
220 V ACC
Analyser
outlet
53
BLOCK DIAGRAM
8
54
FRONT VIEW WITH KEYBOARD
GA-40 T plus
GA-40 T plus
9
MENU STRUCTURE
MENU STRUCTURE
9.1
Structure of the main menu
MENU
Parameter
Fuel
Choose fuel
V iew/define
Average time
O2R
Boiler Par.
Parameter
N O in NOx
Pressure
Pressure
Soot test
Soot test
G raphic
G raphik
Flow meas.
Flow meas.
An. outputs
An. outputs
Options
Device info.
V iew data
Sensors
C O c e ll range
O2 cell calibr.
Calibrate
External channels
Temp. Gas
Temp. Amb.
T1ext. - T4ext.
U/I1 - U/I2
Sensor calibration
Settings
Choose gas
Calibrate
Backlighting
Contrast
Set contrast
C lock
Set date/time
Printer settings
Shortform
Automatic printing
No. of copies
Choose footer
Language/country
Edit
Language 1 - 4
Acoustic alarm
Soot test 1/3
Standard
Control List
V iew Data
md Service
Code ?
55
MENU STRUCTURE
9.2
GA-40 T plus
Structure of the menu STORE
STORE
Reports
Store Report No.
Data Banks
List of Reports
View Report
Edit Header
Edit
Activate/Lock
List of Banks
9.3
Erase Reports
Erase All
Erase Banks
Erase All
View List
Structure of the menu DATA
DATA
56
Screen D1
Screen D2
Screen D3
[.]
[.]
[.]
Screen D1 - ZOOM
Screen D2 - ZOOM
Screen D4 - ZOOM
E
L E
C T
R
O
N
Vienna - Austria
I
C
S