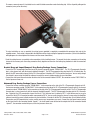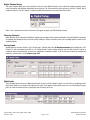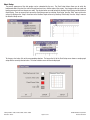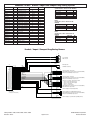
1
EDELBROCK QWIKDATA SYSTEMS
Catalog #91001 - Basic Package
Catalog #91003 - Bracket Drag Racing Package
Catalog #91004 - Advanced Drag Racing Package
Catalog #91005 - Import / Compact Drag Racing Package
Catalog #91007 - Circle Track / Road Racing Package
Catalog #91009 - Advanced Pro System Package
This QwikGuide manual has been included to provide all the information you need to get your QwikData Package
installed and running quickly and easily.
For more detailed information about the QwikData system, refer to the QwikData Reference Manual on the
QwikData CD ROM.
Table of Contents
SYSTEM INSTALLATION
Included Parts . . . . . . . . . . . . . . . . . . . . . . . . . . . . . . . . . . . . . . . . . . . . . . . . . . . . . . . . . . . . . . . . . . . . . . . . . . . . . . . .1
Basic Package . . . . . . . . . . . . . . . . . . . . . . . . . . . . . . . . . . . . . . . . . . . . . . . . . . . . . . . . . . . . . . . . . . . . . . . . . . . . . .1
Bracket Drag Racing Package . . . . . . . . . . . . . . . . . . . . . . . . . . . . . . . . . . . . . . . . . . . . . . . . . . . . . . . . . . . . . . . . . .1
Advanced Drag Racing Package . . . . . . . . . . . . . . . . . . . . . . . . . . . . . . . . . . . . . . . . . . . . . . . . . . . . . . . . . . . . . . . .1
Import/Compact Drag Racing Package . . . . . . . . . . . . . . . . . . . . . . . . . . . . . . . . . . . . . . . . . . . . . . . . . . . . . . . . . . . .2
Circle Track/Road Racing Package . . . . . . . . . . . . . . . . . . . . . . . . . . . . . . . . . . . . . . . . . . . . . . . . . . . . . . . . . . . . . . .2
Advanced Pro System Package . . . . . . . . . . . . . . . . . . . . . . . . . . . . . . . . . . . . . . . . . . . . . . . . . . . . . . . . . . . . . . . . .2
Installation of the QwikData Data Logger Unit . . . . . . . . . . . . . . . . . . . . . . . . . . . . . . . . . . . . . . . . . . . . . . . . . . . . . . . .3
Pressure Sensors . . . . . . . . . . . . . . . . . . . . . . . . . . . . . . . . . . . . . . . . . . . . . . . . . . . . . . . . . . . . . . . . . . . . . . . . . . . . .3
Temperature Sensors . . . . . . . . . . . . . . . . . . . . . . . . . . . . . . . . . . . . . . . . . . . . . . . . . . . . . . . . . . . . . . . . . . . . . . . . . .3
Exhaust Gas Temperature Sensors . . . . . . . . . . . . . . . . . . . . . . . . . . . . . . . . . . . . . . . . . . . . . . . . . . . . . . . . . . . . . . . .4
TK-4 Thermocouple Converter Installation . . . . . . . . . . . . . . . . . . . . . . . . . . . . . . . . . . . . . . . . . . . . . . . . . . . . . . . . . .4
Wheel/Shaft Speed Sensors . . . . . . . . . . . . . . . . . . . . . . . . . . . . . . . . . . . . . . . . . . . . . . . . . . . . . . . . . . . . . . . . . . . . .4
Wiring Harness Installation and Connection . . . . . . . . . . . . . . . . . . . . . . . . . . . . . . . . . . . . . . . . . . . . . . . . . . . . . . . .4-5
Bracket Drag and Import/Compact Drag Racing Package Sensor Connections . . . . . . . . . . . . . . . . . . . . . . . . . . . . . . .5
Advanced Drag Racing Package Sensor Connections . . . . . . . . . . . . . . . . . . . . . . . . . . . . . . . . . . . . . . . . . . . . . . . . . .5
Connection To Battery Power . . . . . . . . . . . . . . . . . . . . . . . . . . . . . . . . . . . . . . . . . . . . . . . . . . . . . . . . . . . . . . . . . . . .6
Engine RPM Connection . . . . . . . . . . . . . . . . . . . . . . . . . . . . . . . . . . . . . . . . . . . . . . . . . . . . . . . . . . . . . . . . . . . . . . . .6
Data Logging On/Off Switch . . . . . . . . . . . . . . . . . . . . . . . . . . . . . . . . . . . . . . . . . . . . . . . . . . . . . . . . . . . . . . . . . . . . .6
SOFTWARE INSTALLATION . . . . . . . . . . . . . . . . . . . . . . . . . . . . . . . . . . . . . . . . . . . . . . . . . . . . . . . . . . . . . . . . . . . . .6-8
FIRST TIME POWER-UP . . . . . . . . . . . . . . . . . . . . . . . . . . . . . . . . . . . . . . . . . . . . . . . . . . . . . . . . . . . . . . . . . . . . . .8-10
Initializing the QwikData Setup . . . . . . . . . . . . . . . . . . . . . . . . . . . . . . . . . . . . . . . . . . . . . . . . . . . . . . . . . . . . . . .10-11
Sensor Calibration . . . . . . . . . . . . . . . . . . . . . . . . . . . . . . . . . . . . . . . . . . . . . . . . . . . . . . . . . . . . . . . . . . . . . . . . . . . .11
Digital Sensor Calibration . . . . . . . . . . . . . . . . . . . . . . . . . . . . . . . . . . . . . . . . . . . . . . . . . . . . . . . . . . . . . . . . . . . . . .11
Digital Channel Setup . . . . . . . . . . . . . . . . . . . . . . . . . . . . . . . . . . . . . . . . . . . . . . . . . . . . . . . . . . . . . . . . . . . . . . . . .12
Choosing Channel . . . . . . . . . . . . . . . . . . . . . . . . . . . . . . . . . . . . . . . . . . . . . . . . . . . . . . . . . . . . . . . . . . . . . . . . . . . .12
Analog Inputs . . . . . . . . . . . . . . . . . . . . . . . . . . . . . . . . . . . . . . . . . . . . . . . . . . . . . . . . . . . . . . . . . . . . . . . . . . . . . . .12
Digital Inputs . . . . . . . . . . . . . . . . . . . . . . . . . . . . . . . . . . . . . . . . . . . . . . . . . . . . . . . . . . . . . . . . . . . . . . . . . . . . .12-13
Logic Signal . . . . . . . . . . . . . . . . . . . . . . . . . . . . . . . . . . . . . . . . . . . . . . . . . . . . . . . . . . . . . . . . . . . . . . . . . . . . . . .13
Grounding Type Switch . . . . . . . . . . . . . . . . . . . . . . . . . . . . . . . . . . . . . . . . . . . . . . . . . . . . . . . . . . . . . . . . . . . . . .13
Low to High Signal . . . . . . . . . . . . . . . . . . . . . . . . . . . . . . . . . . . . . . . . . . . . . . . . . . . . . . . . . . . . . . . . . . . . . . .13-17
Channel Enable . . . . . . . . . . . . . . . . . . . . . . . . . . . . . . . . . . . . . . . . . . . . . . . . . . . . . . . . . . . . . . . . . . . . . . . . . . . . . .17
Channel Calibration . . . . . . . . . . . . . . . . . . . . . . . . . . . . . . . . . . . . . . . . . . . . . . . . . . . . . . . . . . . . . . . . . . . . . . . . . . .17
Zero Analog Channels . . . . . . . . . . . . . . . . . . . . . . . . . . . . . . . . . . . . . . . . . . . . . . . . . . . . . . . . . . . . . . . . . . . . . . . . .18
Zero Accelerometers . . . . . . . . . . . . . . . . . . . . . . . . . . . . . . . . . . . . . . . . . . . . . . . . . . . . . . . . . . . . . . . . . . . . . . . . . .19
Logging Setup . . . . . . . . . . . . . . . . . . . . . . . . . . . . . . . . . . . . . . . . . . . . . . . . . . . . . . . . . . . . . . . . . . . . . . . . . . . .19-20
Lap Trigger Channel . . . . . . . . . . . . . . . . . . . . . . . . . . . . . . . . . . . . . . . . . . . . . . . . . . . . . . . . . . . . . . . . . . . . . . . . . .20
Starting Trigger . . . . . . . . . . . . . . . . . . . . . . . . . . . . . . . . . . . . . . . . . . . . . . . . . . . . . . . . . . . . . . . . . . . . . . . . . . . . . .20
Digital Starting Triggers . . . . . . . . . . . . . . . . . . . . . . . . . . . . . . . . . . . . . . . . . . . . . . . . . . . . . . . . . . . . . . . . . . . . . . . .21
Analog Starting Triggers . . . . . . . . . . . . . . . . . . . . . . . . . . . . . . . . . . . . . . . . . . . . . . . . . . . . . . . . . . . . . . . . . . . . . . .21
Stopping Trigger . . . . . . . . . . . . . . . . . . . . . . . . . . . . . . . . . . . . . . . . . . . . . . . . . . . . . . . . . . . . . . . . . . . . . . . . . . . . .22
Digital Stopping Triggers . . . . . . . . . . . . . . . . . . . . . . . . . . . . . . . . . . . . . . . . . . . . . . . . . . . . . . . . . . . . . . . . . . . . . . .22
Analog Stopping Triggers . . . . . . . . . . . . . . . . . . . . . . . . . . . . . . . . . . . . . . . . . . . . . . . . . . . . . . . . . . . . . . . . . . . . . .22
Digital Outputs . . . . . . . . . . . . . . . . . . . . . . . . . . . . . . . . . . . . . . . . . . . . . . . . . . . . . . . . . . . . . . . . . . . . . . . . . . . . . .23
Graphing Setup . . . . . . . . . . . . . . . . . . . . . . . . . . . . . . . . . . . . . . . . . . . . . . . . . . . . . . . . . . . . . . . . . . . . . . . . . . . . . .23
Channel Colors . . . . . . . . . . . . . . . . . . . . . . . . . . . . . . . . . . . . . . . . . . . . . . . . . . . . . . . . . . . . . . . . . . . . . . . . . . . . . .24
Advanced Options . . . . . . . . . . . . . . . . . . . . . . . . . . . . . . . . . . . . . . . . . . . . . . . . . . . . . . . . . . . . . . . . . . . . . . . . . . . .24
Chart Setup . . . . . . . . . . . . . . . . . . . . . . . . . . . . . . . . . . . . . . . . . . . . . . . . . . . . . . . . . . . . . . . . . . . . . . . . . . . . . .25-26
Save Setup . . . . . . . . . . . . . . . . . . . . . . . . . . . . . . . . . . . . . . . . . . . . . . . . . . . . . . . . . . . . . . . . . . . . . . . . . . . . . . . . .26
Load Setup . . . . . . . . . . . . . . . . . . . . . . . . . . . . . . . . . . . . . . . . . . . . . . . . . . . . . . . . . . . . . . . . . . . . . . . . . . . . . . . . .27
Download Setup . . . . . . . . . . . . . . . . . . . . . . . . . . . . . . . . . . . . . . . . . . . . . . . . . . . . . . . . . . . . . . . . . . . . . . . . . . . . .27
Upload Setup . . . . . . . . . . . . . . . . . . . . . . . . . . . . . . . . . . . . . . . . . . . . . . . . . . . . . . . . . . . . . . . . . . . . . . . . . . . . . . .28
Using Realtime Graphing to Assist in System Checkout . . . . . . . . . . . . . . . . . . . . . . . . . . . . . . . . . . . . . . . . . . . . . . . .28
Normal Analog Sensors . . . . . . . . . . . . . . . . . . . . . . . . . . . . . . . . . . . . . . . . . . . . . . . . . . . . . . . . . . . . . . . . . . . . . . . .28
Position Sensors . . . . . . . . . . . . . . . . . . . . . . . . . . . . . . . . . . . . . . . . . . . . . . . . . . . . . . . . . . . . . . . . . . . . . . . . . . . . .28
RPM Inputs . . . . . . . . . . . . . . . . . . . . . . . . . . . . . . . . . . . . . . . . . . . . . . . . . . . . . . . . . . . . . . . . . . . . . . . . . . . . . . . . .28
Pure Digital Inputs . . . . . . . . . . . . . . . . . . . . . . . . . . . . . . . . . . . . . . . . . . . . . . . . . . . . . . . . . . . . . . . . . . . . . . . . . . . .28
SYSTEM OPERATION
Viewing Real Time Data . . . . . . . . . . . . . . . . . . . . . . . . . . . . . . . . . . . . . . . . . . . . . . . . . . . . . . . . . . . . . . . . . . . . .28-29
Reset Memory . . . . . . . . . . . . . . . . . . . . . . . . . . . . . . . . . . . . . . . . . . . . . . . . . . . . . . . . . . . . . . . . . . . . . . . . . . . . . . .29
Manual Stop/Start . . . . . . . . . . . . . . . . . . . . . . . . . . . . . . . . . . . . . . . . . . . . . . . . . . . . . . . . . . . . . . . . . . . . . . . . . . . .29
Choosing Channels for Display . . . . . . . . . . . . . . . . . . . . . . . . . . . . . . . . . . . . . . . . . . . . . . . . . . . . . . . . . . . . . . . . . .29
Setting the Window Width . . . . . . . . . . . . . . . . . . . . . . . . . . . . . . . . . . . . . . . . . . . . . . . . . . . . . . . . . . . . . . . . . . . . . .29
Uploading Data . . . . . . . . . . . . . . . . . . . . . . . . . . . . . . . . . . . . . . . . . . . . . . . . . . . . . . . . . . . . . . . . . . . . . . . . . . . . . .30
Viewing Historical Data . . . . . . . . . . . . . . . . . . . . . . . . . . . . . . . . . . . . . . . . . . . . . . . . . . . . . . . . . . . . . . . . . . . . .30-31
Measuring the Length of Time Between Events . . . . . . . . . . . . . . . . . . . . . . . . . . . . . . . . . . . . . . . . . . . . . . . . . . . . . .31
Changing the Channels Displayed . . . . . . . . . . . . . . . . . . . . . . . . . . . . . . . . . . . . . . . . . . . . . . . . . . . . . . . . . . . . . . . .32
Viewing Data by Time or Distance . . . . . . . . . . . . . . . . . . . . . . . . . . . . . . . . . . . . . . . . . . . . . . . . . . . . . . . . . . . . . . . .32
Viewing Data by Lap . . . . . . . . . . . . . . . . . . . . . . . . . . . . . . . . . . . . . . . . . . . . . . . . . . . . . . . . . . . . . . . . . . . . . . .32-33
Viewing Data as Lap Dependent or Cumulative . . . . . . . . . . . . . . . . . . . . . . . . . . . . . . . . . . . . . . . . . . . . . . . . . . . . . .33
Zoom In / Zoom Out . . . . . . . . . . . . . . . . . . . . . . . . . . . . . . . . . . . . . . . . . . . . . . . . . . . . . . . . . . . . . . . . . . . . . . .33-34
Scroll or Pan the Graph . . . . . . . . . . . . . . . . . . . . . . . . . . . . . . . . . . . . . . . . . . . . . . . . . . . . . . . . . . . . . . . . . . . . . . . .34
Overlaying a Secondary File . . . . . . . . . . . . . . . . . . . . . . . . . . . . . . . . . . . . . . . . . . . . . . . . . . . . . . . . . . . . . . . . .34-37
Cropping Data Files . . . . . . . . . . . . . . . . . . . . . . . . . . . . . . . . . . . . . . . . . . . . . . . . . . . . . . . . . . . . . . . . . . . . . . . . . . .38
Obtaining a Histogram . . . . . . . . . . . . . . . . . . . . . . . . . . . . . . . . . . . . . . . . . . . . . . . . . . . . . . . . . . . . . . . . . . . . . . . .39
Printing a Graph . . . . . . . . . . . . . . . . . . . . . . . . . . . . . . . . . . . . . . . . . . . . . . . . . . . . . . . . . . . . . . . . . . . . . . . . . . . . .39
Export Data File to Text File . . . . . . . . . . . . . . . . . . . . . . . . . . . . . . . . . . . . . . . . . . . . . . . . . . . . . . . . . . . . . . . . . . . . .40
Restore Default Setup . . . . . . . . . . . . . . . . . . . . . . . . . . . . . . . . . . . . . . . . . . . . . . . . . . . . . . . . . . . . . . . . . . . . . . . . .41
Update Firmware . . . . . . . . . . . . . . . . . . . . . . . . . . . . . . . . . . . . . . . . . . . . . . . . . . . . . . . . . . . . . . . . . . . . . . . . . . . .41
Connector Pin Out: Bracket/Import and Compact Drag Racing Systems . . . . . . . . . . . . . . . . . . . . . . . . . . . . . . . . . . .42
Connector Pin Out: Circle Track/Road Racing and Advanced Systems . . . . . . . . . . . . . . . . . . . . . . . . . . . . . . . . . .43-44
Pin Assignments, Maximum Configuration . . . . . . . . . . . . . . . . . . . . . . . . . . . . . . . . . . . . . . . . . . . . . . . . . . . . . . . . . .45
Qwikdata Jumper Configuration . . . . . . . . . . . . . . . . . . . . . . . . . . . . . . . . . . . . . . . . . . . . . . . . . . . . . . . . . . . . . . . . .46
Sensor and Option Part Numbers . . . . . . . . . . . . . . . . . . . . . . . . . . . . . . . . . . . . . . . . . . . . . . . . . . . . . . . . . . . . . . . .47
Sensor Calibration Values . . . . . . . . . . . . . . . . . . . . . . . . . . . . . . . . . . . . . . . . . . . . . . . . . . . . . . . . . . . . . . . . . . . . . .47
SYSTEM INSTALLATION
Included Parts
Unpack all the parts supplied with the package and verify that there are no parts missing.
Basic Package #91001
Your QwikData Basic Package should include the following items:
Part Description
Qty
1
1
1
2
1
1
Part No.
. . . . . . . . . . . . . . . . . . . . . . . . . . . . . . . . . . . . . . .Basic QwikData Data Logger . . . . . . . . . . . . . . . . . . . . . . . . . . . . . . . . . .91100
. . . . . . . . . . . . . . . . . . . . . . . . . . . . . . . . . . . . . . . . . . . .Wiring Harness . . . . . . . . . . . . . . . . . . . . . . . . . . . . . . . . . . . . . . .91103
. . . . . . . . . . . . . . . . . . . . . . . . . . . . . . . . . . . . . . .Wheel/Shaft Speed Sensor . . . . . . . . . . . . . . . . . . . . . . . . . . . . . . . . . . .91116
. . . . . . . . . . . . . . . . . . . . . . . . . . . . . . . . . . . . . . . . .Speed Sensor Magnets . . . . . . . . . . . . . . . . . . . . . . . . . . . . . . . . . . . .91117
. . . . . . . . . . . . . . . . . . . . . . . . . . . . . . . .USB to Serial Port Adapter Cable & Driver CD . . . . . . . . . . . . . . . . . . . . . . . . . . . .91147
. . . . . . . . . . . . . . . . . . . . . . . . . . . . . . . . . .QwikData Software & Documentation CD . . . . . . . . . . . . . . . . . . . . . . . . . . . .37-91127
Bracket Drag Racing Package #91003
Your QwikData Bracket Racing Drag Racing Package should include the following items:
Qty
1
1
2
2
2
1
2
1
2
1
1
Part Description
Part No.
. . . . . . . . . . . . . . . . . . . . . . . . . . . . . . . . . . . . . . .Basic QwikData Data Logger . . . . . . . . . . . . . . . . . . . . . . . . . . . . . . . . . .91100
. . . . . . . . . . . . . . . . . . . . . . . . . . . . . . . . . . . . . . . . . . . .Wiring Harness . . . . . . . . . . . . . . . . . . . . . . . . . . . . . . . . . . . . . . .91103
. . . . . . . . . . . . . . . . . . . . . . . . . . . . . . . . . . . . . . .0-100 psi Pressure Sensors . . . . . . . . . . . . . . . . . . . . . . . . . . . . . . . . . .91112
. . . . . . . . . . . . . . . . . . . . . . . . . . . . . . . . . . . .Exhaust Gas Temp. Thermocouples . . . . . . . . . . . . . . . . . . . . . . . . . . . . . . . .91109
. . . . . . . . . . . . . . . . . . . . . . . . . . . . . . . . . . . . .General Purpose Thermocouples . . . . . . . . . . . . . . . . . . . . . . . . . . . . . . . . .91110
. . . . . . . . . . . . . . . . . . . . . . . . . . . . . . . . . . . .TK-4 Thermocouple Converter Box . . . . . . . . . . . . . . . . . . . . . . . . . . . . . . . .91108
. . . . . . . . . . . . . . . . . . . . . . . . . . . . . . . . . . . . .Thermocouple Extension Cables . . . . . . . . . . . . . . . . . . . . . . . . . . . . . . . . .91111
. . . . . . . . . . . . . . . . . . . . . . . . . . . . . . . . . . . . . . .Wheel/Shaft Speed Sensor . . . . . . . . . . . . . . . . . . . . . . . . . . . . . . . . . . .91116
. . . . . . . . . . . . . . . . . . . . . . . . . . . . . . . . . . . . . . . . .Speed Sensor Magnets . . . . . . . . . . . . . . . . . . . . . . . . . . . . . . . . . . . .91117
. . . . . . . . . . . . . . . . . . . . . . . . . . . . . . . .USB to Serial Port Adapter Cable & Driver CD . . . . . . . . . . . . . . . . . . . . . . . . . . . .91147
. . . . . . . . . . . . . . . . . . . . . . . . . . . . . . . . . .QwikData Software & Documentation CD . . . . . . . . . . . . . . . . . . . . . . . . . . . .37-91127
Advanced Drag Racing Package #91004
Your QwikData Advanced Drag Racing Package should include the following items:
Qty
1
1
2
1
1
8
3
3
3
2
4
1
1
Part Description
Part No.
. . . . . . . . . . . . . . . . . . . . . . . . . . . . . . . . . . . . .Advanced QwikData Data Logger . . . . . . . . . . . . . . . . . . . . . . . . . . . . . . . .91101
. . . . . . . . . . . . . . . . . . . . . . . . . . . . . . . . . . . . . . . . . . . .Wiring Harness . . . . . . . . . . . . . . . . . . . . . . . . . . . . . . . . . . . . . . .91104
. . . . . . . . . . . . . . . . . . . . . . . . . . . . . . . . . . . . . . .0-100 psi Pressure Sensors . . . . . . . . . . . . . . . . . . . . . . . . . . . . . . . . . .91112
. . . . . . . . . . . . . . . . . . . . . . . . . . . . . . . . . . . . . .0-500 psi Pressure Transducer . . . . . . . . . . . . . . . . . . . . . . . . . . . . . . . . .91113
. . . . . . . . . . . . . . . . . . . . . . . . . . . . . . . . . . . . .0-2500 psi Pressure Transducer . . . . . . . . . . . . . . . . . . . . . . . . . . . . . . . . .91114
. . . . . . . . . . . . . . . . . . . . . . . . . . . . . . . . . . . .Exhaust Gas Temp. Thermocouples . . . . . . . . . . . . . . . . . . . . . . . . . . . . . . . .91109
. . . . . . . . . . . . . . . . . . . . . . . . . . . . . . . . . . . . .General Purpose Thermocouples . . . . . . . . . . . . . . . . . . . . . . . . . . . . . . . . .91110
. . . . . . . . . . . . . . . . . . . . . . . . . . . . . . . . . . . .TK-4 Thermocouple Converter Box . . . . . . . . . . . . . . . . . . . . . . . . . . . . . . . .91108
. . . . . . . . . . . . . . . . . . . . . . . . . . . . . . . . . . . . .Thermocouple Extension Cables . . . . . . . . . . . . . . . . . . . . . . . . . . . . . . . . .91111
. . . . . . . . . . . . . . . . . . . . . . . . . . . . . . . . . . . . . . .Wheel/Shaft Speed Sensor . . . . . . . . . . . . . . . . . . . . . . . . . . . . . . . . . . .91116
. . . . . . . . . . . . . . . . . . . . . . . . . . . . . . . . . . . . . . . . .Speed Sensor Magnets . . . . . . . . . . . . . . . . . . . . . . . . . . . . . . . . . . . .91117
. . . . . . . . . . . . . . . . . . . . . . . . . . . . . . . .USB to Serial Port Adapter Cable & Driver CD . . . . . . . . . . . . . . . . . . . . . . . . . . . .91147
. . . . . . . . . . . . . . . . . . . . . . . . . . . . . . . . . .QwikData Software & Documentation CD . . . . . . . . . . . . . . . . . . . . . . . . . . . .37-91127
Catalog #91001, 91003, 91004, 91005, 91007, 91009
Rev. 9/06 - RS/mc
Page 1 of 47
©2006 Edelbrock Corporation
Brochure #63-0282
Import / Compact Drag Racing Package #91005
Your QwikData Import / Compact Drag Racing Package should include the following items:
Part Description
Qty
1
1
2
4
1
1
2
1
1
Part No.
. . . . . . . . . . . . . . . . . . . . . . . . . . . . . . . . . . . . . . .Basic QwikData Data Logger . . . . . . . . . . . . . . . . . . . . . . . . . . . . . . . . . .91100
. . . . . . . . . . . . . . . . . . . . . . . . . . . . . . . . . . . . . . . . . . . .Wiring Harness . . . . . . . . . . . . . . . . . . . . . . . . . . . . . . . . . . . . . . .91103
. . . . . . . . . . . . . . . . . . . . . . . . . . . . . . . . . . . . . . .0-100 psi Pressure Sensors . . . . . . . . . . . . . . . . . . . . . . . . . . . . . . . . . .91112
. . . . . . . . . . . . . . . . . . . . . . . . . . . . . . . . . . . .Exhaust Gas Temp. Thermocouples . . . . . . . . . . . . . . . . . . . . . . . . . . . . . . . .91109
. . . . . . . . . . . . . . . . . . . . . . . . . . . . . . . . . . . .TK-4 Thermocouple Converter Box . . . . . . . . . . . . . . . . . . . . . . . . . . . . . . . .91108
. . . . . . . . . . . . . . . . . . . . . . . . . . . . . . . . . . . . . . .Wheel/Shaft Speed Sensor . . . . . . . . . . . . . . . . . . . . . . . . . . . . . . . . . . .91116
. . . . . . . . . . . . . . . . . . . . . . . . . . . . . . . . . . . . . . . . .Speed Sensor Magnets . . . . . . . . . . . . . . . . . . . . . . . . . . . . . . . . . . . .91117
. . . . . . . . . . . . . . . . . . . . . . . . . . . . . . . .USB to Serial Port Adapter Cable & Driver CD . . . . . . . . . . . . . . . . . . . . . . . . . . . .91147
. . . . . . . . . . . . . . . . . . . . . . . . . . . . . . . . . .QwikData Software & Documentation CD . . . . . . . . . . . . . . . . . . . . . . . . . . . .37-91127
Circle Track / Road Racing Package #91007
Your QwikData Circle Track / Road Racing Package should include the following items:
Part Description
Qty
1
1
1
4
1
1
2
4
1
1
Part No.
. . . . . . . . . . . . . . . . . . . . . . . . . . . . . . . . . . . . .Advanced QwikData Data Logger . . . . . . . . . . . . . . . . . . . . . . . . . . . . . . . .91101
. . . . . . . . . . . . . . . . . . . . . . . . . . . . . . . . . . . . . . . . . . . .Wiring Harness . . . . . . . . . . . . . . . . . . . . . . . . . . . . . . . . . . . . . . .91129
. . . . . . . . . . . . . . . . . . . . . . . . . . . . . . . . . . . . . . . . . .String Potentiometer . . . . . . . . . . . . . . . . . . . . . . . . . . . . . . . . . . . . .91123
. . . . . . . . . . . . . . . . . . . . . . . . . . . . . . . . . . . . . . . . . .Linear Potentiometer . . . . . . . . . . . . . . . . . . . . . . . . . . . . . . . . . . . . .91124
. . . . . . . . . . . . . . . . . . . . . . . . . . . . . . . . . . .Throttle Position Linear Potentiometer . . . . . . . . . . . . . . . . . . . . . . . . . . . . . . .91127
. . . . . . . . . . . . . . . . . . . . . . . . . . . . . . . . . . . . . . .0 - 500 psi Pressure Sensor . . . . . . . . . . . . . . . . . . . . . . . . . . . . . . . . . .91113
. . . . . . . . . . . . . . . . . . . . . . . . . . . . . . . . . . . . . . .Wheel/Shaft Speed Sensor . . . . . . . . . . . . . . . . . . . . . . . . . . . . . . . . . . .91116
. . . . . . . . . . . . . . . . . . . . . . . . . . . . . . . . . . . . . . . . .Speed Sensor Magnets . . . . . . . . . . . . . . . . . . . . . . . . . . . . . . . . . . . .91117
. . . . . . . . . . . . . . . . . . . . . . . . . . . . . . . .USB to Serial Port Adapter Cable & Driver CD . . . . . . . . . . . . . . . . . . . . . . . . . . . .91147
. . . . . . . . . . . . . . . . . . . . . . . . . . . . . . . . . .QwikData Software & Documentation CD . . . . . . . . . . . . . . . . . . . . . . . . . . . .37-91127
Advanced Pro System Package #91009
Your QwikData Advanced Drag Racing Package should include the following items:
Qty
1
1
8
3
3
3
2
2
1
1
Part Description
Part No.
. . . . . . . . . . . . . . . . . . . . . . . . . . . . . . . . . . . . .Advanced QwikData Data Logger . . . . . . . . . . . . . . . . . . . . . . . . . . . . . . . .91101
. . . . . . . . . . . . . . . . . . . . . . . . . . . . . . . . . . . . . . . . . . . .Wiring Harness . . . . . . . . . . . . . . . . . . . . . . . . . . . . . . . . . . . . . . .91104
. . . . . . . . . . . . . . . . . . . . . . . . . . . . . . . . . . . .Exhaust Gas Temp. Thermocouples . . . . . . . . . . . . . . . . . . . . . . . . . . . . . . . .91109
. . . . . . . . . . . . . . . . . . . . . . . . . . . . . . . . . . . . .General Purpose Thermocouples . . . . . . . . . . . . . . . . . . . . . . . . . . . . . . . . .91110
. . . . . . . . . . . . . . . . . . . . . . . . . . . . . . . . . . . .TK-4 Thermocouple Converter Box . . . . . . . . . . . . . . . . . . . . . . . . . . . . . . . .91108
. . . . . . . . . . . . . . . . . . . . . . . . . . . . . . . . . . . . .Thermocouple Extension Cables . . . . . . . . . . . . . . . . . . . . . . . . . . . . . . . . .91111
. . . . . . . . . . . . . . . . . . . . . . . . . . . . . . . . . . . . . . .Wheel/Shaft Speed Sensor . . . . . . . . . . . . . . . . . . . . . . . . . . . . . . . . . . .91116
. . . . . . . . . . . . . . . . . . . . . . . . . . . . . . . . . . . . . . . . .Speed Sensor Magnets . . . . . . . . . . . . . . . . . . . . . . . . . . . . . . . . . . . .91117
. . . . . . . . . . . . . . . . . . . . . . . . . . . . . . . .USB to Serial Port Adapter Cable & Driver CD . . . . . . . . . . . . . . . . . . . . . . . . . . . .91147
. . . . . . . . . . . . . . . . . . . . . . . . . . . . . . . . . .QwikData Software & Documentation CD . . . . . . . . . . . . . . . . . . . . . . . . . . . .37-91127
Catalog #91001, 91003, 91004, 91005, 91007, 91009
Rev. 9/06 - RS/mc
Page 2 of 47
©2006 Edelbrock Corporation
Brochure #63-0282
Installation of the QwikData Data Logger Unit:
Important Notice: When installing data log unit avoid RF and or EMI signal interference and make sure all grounds are connected
as described in “Connection to Battery Power” on Page 6. Keep sensor wiring away from ignition wires. Try to keep all data log unit
wiring as far as possible from CD boxes and wiring. Do not mount the data log next to ignition box or ignition coils. You will want as
much distance between the data logger and these devices as possible. Thermocouples and thermocouple extension must also be kept
away from ignition wires, ignition box and coils. If wires have to cross, try to have them cross at a right angle. Avoid paralleling Data
logger wires with any ignition wiring (Primary or Secondary).
As the QwikData accelerometers are mounted inside the data logger unit, the unit must be mounted in a particular orientation to obtain
accurate acceleration data. The unit must be mounted approximately level and horizontal with the QwikData logo parallel to the
centerline of the car. If possible, the box should be mounted along the centerline at the center of gravity of the car. Mounting in the
cockpit in front of the shifter is often a convenient location. Mounting QwikData with the connectors facing the front of the car will
display left turns and longitudinal acceleration as positive numbers (right turns and braking are displayed as negative numbers). Don't
be overly concerned if you cannot meet these criteria as the measurement errors induced are not great and in general you should be
more concerned with relative acceleration figures, not the absolute numbers. Although not required, some sort of vibration isolation
is usually desirable to prevent noisy accelerometer readings due to vibration. Mount using high-density foam rubber under mounting
screws. Velcro tape is also a good alternative as it allows the box to be easily removed and provides some vibration dampening.
Pressure Sensors
Five pressure sensors are available in pressure ranges:
1 (-15) Vacuum Transducer
2 0-15 psi pressure sensors (Fuel pump) etc.
3 0 - 100 psi pressure sensors (Oil) etc.
4 0-500 psi pressure sensor (Trans Pressure) etc.
5 0-2500 psi pressure sensor (Brakes or Nitrous) etc.
The sensors are provided with a male 1/8 NPT fitting that is compatible with most vehicles (pipe adapters can be used if a different
thread size is needed). Note: Pressure sensors should not be mounted directly to the engine, as excessive vibration can destroy the
sensors. Mount the sensors remotely with an aluminum block, and connect to the engine with small, flexible tubing.
Temperature Sensors
The temperature sensors provided in some QwikData packages are high quality thermocouple devices. Three thermocouples are
provided to measure temperatures such as oil temperature and coolant temperature. These thermocouples are provided with 1/8 NPT
compression fittings that can easily be installed in a similarly threaded hole. To install these thermocouples, thread the compression
fitting into the hole and tighten the base of the fitting (not the compression nut) to prevent leaks. Insert the thermocouple into the hole
and then tighten the compression nut until the thermocouple is secured in place. Connect a thermocouple couple extension cable to
each thermocouple temperature sensor.
Exhaust Gas Temperature Sensors
The exhaust gas temperature (EGT) thermocouples are typically mounted in each of the exhaust header pipes close to the header
flange (usually about 3" away). The exact location is not critical but you should try to mount all the EGTs at approximately the same
location in each header for consistent measurements. The EGT thermocouples are supplied with a compression fitting similar to the
general purpose thermocouples. The compression fitting consists of four parts; a bung, an adapter, a ferrule, and a compression nut.
To install the EGT thermocouples, you need to drill a 9/16” clearance hole in the exhaust header and then weld the bung into the
header.
NOTE: The bung is threaded with a 1/8” NPT and MUST be mounted with the inside taper facing out.
Once the bung has been welded in place, thread the adapter into the bung and tighten. Place the ferrule into the adapter and loosely
thread the compression nut onto the adapter. Insert the EGT thermocouple into the compression fitting and tighten the compression
nut to secure the thermocouple. Insert the EGT thermocouple into the compression fitting until the tip is approximately in the center
of the header. Secure by tightening the compression nut.
Catalog #91001, 91003, 91004, 91005, 91007, 91009
Rev. 9/06 - RS/mc
Page 3 of 47
©2006 Edelbrock Corporation
Brochure #63-0282
TK-4 Thermocouple Converter Installation
The TK-4 thermocouple converter unit is required to provide signal conditioning of the thermocouple signals. The thermocouple cables
provided with the thermocouples are four feet long. When installing the thermocouple converter unit, make sure it is within reach of
all the thermocouple cables. Mount the TK-4 thermocouple converter unit using the four mounting holes in the mounting flanges. The
converter unit can be mounted anywhere within reach on the thermocouples including under the hood. If the unit is mounted under
the hood, avoid locations very close to the exhaust headers to prevent excessive temperatures. Also try to mount the converter unit
vertically with the thermocouple connectors pointing down to prevent water accumulation in the converter unit (The converter unit
enclosure is splash proof except for the thermocouple connectors). If the converter unit is mounted in a protected location such as
the interior of the vehicle, then the unit can be mounted in any orientation. Once the TK-4 thermocouple converter unit and the
thermocouples are installed, connect the thermocouples to the converter unit. The general purpose thermocouples have a male
thermocouple connector attached for easy disconnection and removal. These thermocouples are provided with a four-foot
thermocouple extension cable. Connect the female connector on the extension cable to the thermocouple and the male connector to
the TK-4 Thermocouple Converter unit.
Wheel / Shaft Speed Sensors
These sensors are supplied with two rare earth magnets and a sensor pickup and can be used to measure either wheel speed or shaft
speeds. The two magnets are mounted equally spaced around the rotating object (wheel or shaft) and the pickup is mounted on a
stationary object. For proper operation, the magnets must pass within a maximum of 1/4 inch of the pickup. Because of this
restriction, it is very important to mount the pickup on something that moves very little relative to the magnets.
For example, if the magnets are mounted on the drive shaft, they should be either mounted close to the transmission end or close to
the final drive, and the pickup should be mounted directly to the transmission or the final drive respectively. Similarly, if the magnets
are mounted to a wheel, the pickup must be mounted to a suspension piece that moves with the wheel. The magnets can be either
epoxied in place or taped in place with duct tape.
NOTE: As supplied by the factory, these sensors are configured to measure RPM as they are typically used to measure
input shaft and output shaft RPM. If one of these sensors is used to measure vehicle speed, the sensor must be
calibrated accordingly. The calibration of the speed sensor is unique to each installation. (Refer to the Sensor
Calibration section.)
Wiring Harness Installation and Connection
To provide a splash-proof system and make installation as easy as possible, QwikData uses high-grade waterproof connectors and an
external wiring harness instead of having terminals on the box. Push the wiring harness connector(s) onto the mating male plug(s) on
the QwikData box until you hear a “click”. If your package included the Advanced QwikData unit, there will be two connectors on the
QwikData box. The harness with the DB9 connector is connected to the right hand plug (as viewed from the plugs on the QwikData
unit). Refer to the pictures below.
Catalog #91001, 91003, 91004, 91005, 91007, 91009
Rev. 9/06 - RS/mc
Page 4 of 47
©2006 Edelbrock Corporation
Brochure #63-0282
To remove a connector once it is installed, insert a small flat blade screwdriver under the locking clip. Lift the clip while pulling on the
connector (never pull on the wires).
To make installation as easy as possible, the wiring harness provided is completely assembled with connectors that mate to the
supplied sensors. Each sensor is connected to the QwikData unit by simply mating the appropriate connectors. (Refer to the QwikData
wiring diagrams for a description of the harness and the sensor connections.)
Route the wiring harness as needed to make connections to the installed sensors. To connect the circular connectors on the wiring
harness to the sensors, push the mating connectors firmly together and then turn the locking ring clockwise to lock the connectors
together.
Bracket Drag and Import/Compact Drag Racing Package Sensor Connections
Connect the TK4 Thermocouple Converter box to the harness connector labeled “THERM CONV”. The TK-4 Thermocouple Converter
box is a four-channel unit, with the channels labeled A through D. The EGT Thermocouples then plug into the TK-4 Converter box. By
default, the EGT connected to channel A of the TK-4 Converter box is labeled as EGT 1 in the software and so on. You can easily change
the channel’s names using the QwikData software to match the correct cylinder numbers for your installation.
Connect the shaft speed sensor located on the drive shaft to the connector labeled “SPEED”, the connector marked “FUEL PRESS” to
the fuel pressure sensor, etc.
Advanced Drag Racing Package Sensor Connections
Connect the harness connector marked “THERM CONV 1” to the connector on the side of the TK-4 Thermocouple Converter unit #1,
the harness connector marked “THERM CONV 2” to the connector on the side of the TK-4 Thermocouple Converter unit #2, the harness
connector marked “THERM CONV 3” to the connector on the side of the TK-4 Thermocouple Converter unit #3. The TK-4 Thermocouple
Converter box is a four channel unit, with the channels labeled A through D. The EGT Thermocouples then plug into the TK-4 Converter
box. By default, the EGT connected to channel A of the #1 TK-4 Converter box is labeled as EGT 1 in the software and so on up to
channel D of the #2 TK-4 Converter box which corresponds to EGT 8. You can easily change the channel’s names using the QwikData
software to match the correct cylinder numbers for your installation. Channels A and B of TK-4 Converter box #3 are labeled as Water
Temperature and Oil Temperature but can be used to measure any temperatures you want. Connect the shaft speed sensor located
on the input shaft to the connector labeled “Speed 1”, the shaft speed sensor located on the output shaft to the connector labeled
“Speed 2”, the connector marked fuel press, to the fuel pressure sensor, etc.
Catalog #91001, 91003, 91004, 91005, 91007, 91009
Rev. 9/06 - RS/mc
Page 5 of 47
©2006 Edelbrock Corporation
Brochure #63-0282
Connection To Battery Power
Power is connected to the QwikData box using the red and black wires on the wiring harness. Connect the red wire to a switched 12V
source (e.g. output of ignition switch) and the black wire to a good ground. The recommended grounding point for most installations
is the ground bolt located on the back of the right side cylinder head. The black wire in the wiring harness is supplied with a terminal
to fit this grounding bolt. Do not connect the red wire directly to the battery, as this will put an unnecessary current draw on your
battery (approximately 250 ma) when the ignition switch is off. QwikData does not need continual battery to preserve data and
configuration settings.
Note: A good system ground is very important for proper operation of the QwikData system. Whenever possible, connect the ground
as described above. It is also very important to have a good ground strap between the engine and the chassis.
Engine RPM Connection
Two un-terminated wires are provided on the main harness for RPM input. Most electronic ignition systems provide a tach output and
these wires should be connected directly to this output. The purple wire should be connected to the tach signal (+) and the black wire
should be connected to a good ground or (-) signal terminal if provided by the ignition system.
WARNING!!!: THIS INPUT SHOULD NOT BE CONNECTED DIRECTLY TO THE IGNITION COIL.
NOTE: The RPM input is calibrated for a typical 8 cylinder application in the default setup but this may require
calibration depending on the installation, (see Reference manual on the QwikData CD ROM for details).
Data Logging On/Off Switch
With the QwikData system, data logging can be started and stopped either automatically based on sensor values or manually with a
switch (default configuration). If manual-logging control is desired, a single pole on/off toggle switch must be installed in the vehicle
and connected to the two logging control wires (yellow and black) labeled “LOG ON/OFF” in the main wiring harness. One wire should
be connected to each terminal on the toggle switch. Data logging will start when the toggle switch is turned on (connecting the black
and yellow wires together) and stop when the switch is turned off. If automatic data logging is used, these wires are not needed.
SOFTWARE INSTALLATION
The PC software utilizes a standard Windows installation program. As a precaution, you should shut down any other applications that
may be currently running before starting the QwikData installation. Insert the QwikData CD into your CD-ROM drive.
To run the QwikData analysis software, you must install the software on a PC with the following minimum requirements:
Processor: . . . . . . . . . . . . . . . . . . . . . . . . . . . . . . . . . . . . . . . . . .Pentium
System Speed: . . . . . . . . . . . . . . . . . . . . . . . . . . . . . . . . . . . . . .166 mHz
Memory: . . . . . . . . . . . . . . . . . . . . . . . . . . . . . . . . . . . . . . . . . . .32 MB RAM
Operating System: . . . . . . . . . . . . . . . . . . . . . . . . . . . . . . . . . . . .Windows 95 / 98 / 2000 / XP / NT 4.0
Free Disk Space: . . . . . . . . . . . . . . . . . . . . . . . . . . . . . . . . . . . . .16 MB
The QwikData installation program should auto-start when you insert the CD into your CD ROM drive. If the program does not autostart, select “Run” from the Windows “File” menu and enter "D:\AUTORUN.EXE" in the dialog box (replace “D” with the drive letter of
your CD-ROM drive).
Catalog #91001, 91003, 91004, 91005, 91007, 91009
Rev. 9/06 - RS/mc
Page 6 of 47
©2006 Edelbrock Corporation
Brochure #63-0282
The QwikData CD ROM startup screen will be displayed.
Click the “Setup (Win 95/98/NT)” icon to begin the software installation.
Click the 'Next' button and follow the on screen instructions for installation.
Catalog #91001, 91003, 91004, 91005, 91007, 91009
Rev. 9/06 - RS/mc
Page 7 of 47
©2006 Edelbrock Corporation
Brochure #63-0282
When the “Installation Type” screen is displayed, click on the QwikData package that you are using and click on the “Next” button to
proceed.
Follow the on-screen instructions to complete the software installation.
NOTE: The setup program must always be utilized if installing the software on a different machine. Simply copying the ".exe" program
over will not work.
FIRST TIME POWER-UP
Connect QwikData to one of your PC's spare serial ports using the gray serial cable with the 9 pin "D" type computer connector (Note:
This is not waterproof, so keep this stowed in a dry place during operation). If your computer only has a 25-pin connector, then you
must purchase a 9 to 25 pin adapter (available anywhere computer products are sold). If you have only a USB port, use the supplied
USB to Serial Port Adapter and install the drivers on the supplied CD. The QwikData Analysis software automatically searches all the
available COM ports on your PC to find the QwikData unit. The first time you connect the QwikData unit to your PC, this search process
may take some time. Once communications with the QwikData unit is established, the software remembers the COM port. The next
time you start the program, it will check this COM port first and unless you connect the QwikData unit to a different COM port,
communications will be established quickly.
USB Adapter Installation: The drivers for the USB-Serial Port adapter cable are located on the supplied “DRIVER” CD.
Microsoft® Windows Installation
1. For Microsoft® Windows operating systems, insert the disc into your CD-ROM drive and click on the “Install USB-toDB9 Serial Adapter Driver”.
a. If the CD does not Auto Run, navigate to your CD-ROM drive and double click on the file named “Install USB-toDB9 Serial Adapter Driver”.
2. When the InstallShield Wizard opens, click “Next”. The Wizard will automatically install the driver.
3 Upon completion of the installation, click “Finish” to close the InstallShield Wizard.
NOTE: You may use the same program to un-install the driver if desired. Run the “PL-2303 Driver Installer”
program again and follow the prompts to un-install the driver.
Catalog #91001, 91003, 91004, 91005, 91007, 91009
Rev. 9/06 - RS/mc
Page 8 of 47
©2006 Edelbrock Corporation
Brochure #63-0282
Troubleshooting: If the adapter is not communicating after installation of the driver, follow the troubleshooting
suggestions below.
• Many serial devices will not operate on a COM port higher than 4. If the COM port is higher than 4, change it to a
lower number using the Device Properties.
• To change the assigned COM number, go to the Start menu, click Control Panel then System. Select the Hardware
tab and then Device Manager. Select the category “Ports (COM & LPT)” and right click the device “USB-to-Serial
(COM x)” (Or a similar name. “X” represents the assigned COM number). Click the Port Settings tab, then the
Advanced button. A box will be in the lower left corner to assign a different COM port to the adapter.
NOTE: This procedure applies only to Windows ME, 2000, and XP.
• Additional Troubleshooting directions are located on the supplied CD. Insert the CD, and open the “USB TO SERIAL
CABLE V1.1” folder, and then the “User manual” folder. Select the appropriate Word document for your operating
system.
NOTE: If you are using the QwikData Analysis software to analyze previously logged data that has been stored on you
PC hard drive (historical data) and the QwikData unit is not connected to your PC, simply click on the QwikData logo
with the left mouse button to bypass the auto-search function. The program will start-up shortly thereafter.
If you get the flashing red message "Not Connected" then the PC program could not communicate with the QwikData unit. Ensure
that the QwikData unit is receiving 12 volts and that the QwikData unit is connected to an available COM port on your computer. Then
either re-start the program or select “Re-initialize Comm” from the “Tools” menu.
After communications has been established, the PC program will display the message "Uploading Setup" and a progress bar will
appear.
Catalog #91001, 91003, 91004, 91005, 91007, 91009
Rev. 9/06 - RS/mc
Page 9 of 47
©2006 Edelbrock Corporation
Brochure #63-0282
Initializing the QwikData Setup
To initialize the QwikData unit to the factory default setup, select the “Load Setup” from the “File” menu.
Highlight the file named “default.sup” and click the “OK” button.
Catalog #91001, 91003, 91004, 91005, 91007, 91009
Rev. 9/06 - RS/mc
Page 10 of 47
©2006 Edelbrock Corporation
Brochure #63-0282
Now select the “Download Setup” option from the “Setup Menu” and click “OK”
If the QwikData unit has any data stored in its memory, this data will be erased and the warning message “Downloading will erase all
saved data. Continue?” will be displayed.
Click on the “OK” button to proceed and the downloading progress bar will appear.
Once the download is complete, the setup information is permanently stored in the QwikData unit and you do not have to download
the setup information again unless you change the setup.
Sensor Calibration
If you are using the sensors provide in the QwikData package, then the default setup file already has all the calibration information for
the sensors. The only exception is if you want to use the drive shaft speed sensor to measure the vehicle speed (the default setup file
calibrates this sensor in RPM). The calibration of this sensor for vehicle speed will be unique for every vehicle.
To calibrate this sensor for vehicle speed, select “Digital Channels” from the “Setup” menu to display the Digital Channel Setup Screen.
Digital Sensor Calibration
QwikData configuration is performed in the “Setup” menu:
NOTE: After making any setup changes, the new setup must be downloaded to the QwikData unit using the “Download
Setup” option in the “Setup” menu before the changes are effective.
Catalog #91001, 91003, 91004, 91005, 91007, 91009
Rev. 9/06 - RS/mc
Page 11 of 47
©2006 Edelbrock Corporation
Brochure #63-0282
Digital Channel Setup
This menu selection allows you to select whether or not each of the digital channels is to be enabled for viewing or logging, and to
enter in descriptive and calibration information for each channel. For each channel that you intend to use, click the “Channel” Box to
enable that channel. Until the channel is enabled, no additional information can be entered for that channel.
Name: Enter a descriptive name for each channel (will appear on graph) e.g. RPM.Choosing Channels
Choosing Channels
While QwikData offers tremendous flexibility by allowing you to configure each channel individually, the standard QwikData packages
are provided pre-configured and you will not need to modify the channel selections unless you are adding optional sensors to the
standard package.
Analog Inputs
Analog Inputs can measure signals in the 0-10 volt range. Voltages above 10V (24 Absolute maximum) will be displayed as 10V.
Channel 16 , will read voltages up to 20V via a 2: I Voltage Divider. Factory settings configure your unit with Channels 9 and 10 to
reading the internal accelerometers, Channel 16 is configured to read battery voltage. If you do not want to take these readings and
require the extra channels, see the jumper page #43.
Digital lnputs
These are inputs that can measure a digital (on/off) signal. As well as strictly reading if a signal is on or off (such as monitoring a brake
light switch), QwikData can measure the frequency of a signal (Tach. output or wheel speed sensor), the on or off period (fuel injector
pulse), or count the number of times a signal goes from on to off (or off to on).
Catalog #91001, 91003, 91004, 91005, 91007, 91009
Rev. 9/06 - RS/mc
Page 12 of 47
©2006 Edelbrock Corporation
Brochure #63-0282
There are 3 types of Digital Inputs. You must correctly identify your inputs before proceeding!!!
Logic signal
Channels 1 and 6 are configured to measure signals that switch between a high (12 or 5 volts) and low (ground) voltage by themselves.
This may be a tach. signal, a signal generated from another electronic device (1TL or CMOS level), an injector input etc.
WARNING!!!
Do not connect any digital input directly to an ignition coil as the electrical noise may cause improper operation of
QwikData or damage the unit (Use MSD tachometer adapter #8132 to connect to the negative side of a coil).
Grounding Type Switch
Channels 2,3, and 5 are configured with a pull-up resistor so that a grounding type switch can be read, e.g. when using one of our
wheel speed sensors the normal reading is 12 V due to the pull-up resistor, then the signal goes to ground level when the switch passes
by the magnet.
Low to high signal
Channel Four (4), is configured with a pull-down resistor in the basic
QwikData unit to allow it to read signals with either the presence or absence
of 12V. e.g. when monitoring an ignition switch the signal is either a 12V
signal or an open circuit (not ground) when the switch is off. Digital Input
Channels can be changed to be any of the 3 types listed above by changing
internal jumper settings. See the “QwikData Jumper Configuration” on
page 46.
Proceed with caution when changing the digital channel
Jumper settings.
Type: Select Input type from pull-down menu.
Pure Digital
Select when you simply want to .determine status of a two state input (e.g. Brake light on/off).
Duty High
Used mostly for computer cars, E.g. to measure the percentage of time an input (e.g. injectors) is high.
Duty Low
Used mostly for computer cars, E.g. to measure the percentage of time an input (e.g. injectors) is low.
On Time
Used mostly for computer cars, E.g. to measure the absolute time (in milliseconds) an input (e.g. injectors) is
high.
Off Time
Used mostly for computer cars, E.g. to measure the absolute time (in milliseconds) an input (e.g. injectors) is
low.
Frequency Rise
Used to measure the frequency of an input (e.g. Tach, signal, wheel speed sensor) by measuring the rising edge
of a signal. The units for frequency are Hz x 100.
Frequency Fall
Used to measure the frequency of an input (e.g. Tach. signal, wheel speed sensor) by measuring the falling edge
of a signal. The numbers generated by using this setting are usually the same as those measured by selecting
“Frequency Rise”, but this setting may be preferable with certain types of signals (e.g. those with lots of
electrical noise). The units for frequency are Hz x 100.
Counter Rise
Used to count the number of transitions from low to high of a variable. This is an alternate setting for inputs
such as “lap beacons”.
Catalog #91001, 91003, 91004, 91005, 91007, 91009
Rev. 9/06 - RS/mc
Page 13 of 47
©2006 Edelbrock Corporation
Brochure #63-0282
This 6-element table allows you to calibrate your sensor to provide the right MPH, RPM etc. read out. Having 6 elements allows you
to calibrate some non-linear sensors (e.g. GM mass air flow meter with frequency output), but for most applications (linear sensors),
you will only need to utilize the left two elements. The lower numbers in gray are the raw digital inputs, the numbers in white are the
corresponding display numbers you are interested in.
RPM Example
Before entering any numbers, you must first find out the calibration constants for the input you will be using. Let’s look at a tach input
for a V8. The maximum RPM for the calibration table should be higher than you will ever see. Let’s take the default example of 9000
RPM. A standard tach. signal provides 1 pulse every time a cylinder fires. At 9000 RPM, this is 600 pulses per second, or 600 Hz. The
input type is set as “Frequency Rise”. The first element contains the numbers (0), (0). This means that for a frequency of “0”, the RPM
should be “0”. The second element has the numbers (6), (9000). This signifies that for an input frequency of 600 (6 times 100), the
RPM should be 9000. The next number pair is (0), (0) which lets QwikData know that this is the end of the calibration data entry.
You may also use the calculators included in the manual section of your QwikData CD-ROM to determine the sensor calibration for
various ignition types. The calculators are located under “View QwikData Manual”. Select your QwikData system under “Qwik Guide”,
then select “RPM Calibration Calculator”.
Catalog #91001, 91003, 91004, 91005, 91007, 91009
Rev. 9/06 - RS/mc
Page 14 of 47
©2006 Edelbrock Corporation
Brochure #63-0282
Shaft Speed Example
The following calibration values should be used to measure shaft speeds on a shaft with two magnets (i.e. 2 pulses per revolution).
This will result in a frequency of one half the tach signal in the prior example.
Thus, assuming the same 9000 max RPM, the input frequency is only 300 Hz. Thus the second element contains the numbers (3),
(9000). The third element is (0), (0) which indicates to QwikData that this is the end of the calibration table data.
MPH Example (Measured at Driveshaft)
The input type should be set to “Frequency Rise”. To measure the vehicle speed, you need to calibrate a speed sensor mounted on
the output drive shaft.
To complete the calibration, you must know the rolling radius of your rear tire and the Final Drive Gear Ratio. To determine the rolling
radius of your rear tire, measure the distance from the center of the wheel to the ground with the car fully loaded and on level ground.
Use the following formula to determine appropriate table value to enter into the calibration table. (See the Manuals section of the
QwikData CD-ROM).
Example:
No. of Magnets x Max MPH x Final Ratio x No. of Turns/Mile
Calib. Value =
360000
63360 (Inches/Mile)
Turns/Mile =
Rollout (2 .x Tire Radius x 3.14)
Max MPH =
200
Tire Radius =
12.5
Final Drive Ratio =
4.10
No. of Magnets =
2
Result=
3.67
Note: Choose a Maximum speed higher than the car can achieve. This number does not have to accurately represent the actual top
speed of the car. To simplify the calculations, pick an even number like 200 or 250, etc.
Catalog #91001, 91003, 91004, 91005, 91007, 91009
Rev. 9/06 - RS/mc
Page 15 of 47
©2006 Edelbrock Corporation
Brochure #63-0282
MPH Example (Measured at Driven Wheel)
The input type should be set to “Frequency Rise”. To measure the vehicle speed, you need to calibrate a speed sensor mounted on
the wheel.
To complete the calibration, you must know the rolling radius of the tire being measured, and the number of magnets being used. To
determine the rolling radius of the tire, measure the distance from the center of the wheel to the ground with the car fully loaded and
on level ground. Use the following formula to determine appropriate table value to enter into the calibration table. (See the Manuals
section of the QwikData CD-ROM).
Brake On/Off Example
This is an example of recording a pure digital signal and is the default setting for channel 4. The input type must be set to “Pure
Digital”. The calibration numbers are simply (0), (0) and (I), (I). This means that with the input not triggered (input of “0”), the output
for the graphs read “0”. With the input triggered (Brake lights “on” in the example), the output reading is “I”. The third element is (0),
(0) which indicates to QwikData that this is the end of the calibration table data.
Injector Duty Cycle Example
Duty cycle is the percentage of time that a signal is high or low. Duty cycle is often used to characterize an injector output. The input
type is set for “Duty High” or “Duty Low”. (Duty Low is simply 100-Duty High). The calibration numbers are (0), (0), and (100), (100).
The third element is (0), (0) which indicates to QwikData that this is the end of the calibration table data.
Injector On Time Example
Instead of Duty Cycle, you may want to measure the absolute on or off time of the injectors in milliseconds for each firing cycle. Select
“On Time” or “Off Time” for the input type. Ensure that the maximum length of time of the signal is within the pre-set limits of the
system, See “Advanced Options”. The default setting allows you to measure pulse widths of up to 210.5 ms. This is well within the
range of most injector pulses which are usually in the 1 to 30 ms range. So for this example, the calibration numbers can be (0), (0),
and (30), (30).
Note: (We could use any number up to 210.5). The third element is (0), (0) which indicates to QwikData that this is
the end of the calibration table data.
Catalog #91001, 91003, 91004, 91005, 91007, 91009
Rev. 9/06 - RS/mc
Page 16 of 47
©2006 Edelbrock Corporation
Brochure #63-0282
Lap Beacon Example
A lap beacon is an example of a digital input that is configured as a counter. Another example may be an Integrating Flowmeter where
each revolution of the turbine in the flowmeter produces a pulse and each pulse corresponds to a set amount of fuel. So by counting
pulses, you may determine the absolute amount of fuel that has passed. (Note: In most cases for racing applications, we are
interested in the fueling rate (gpm) and thus read flowmeters as microseconds QwikData can measure frequencies of up to 6000 Hz,
but the minimum rises to 202 Hz.
Channel Enable
For each channel that you intend
to use, click the “Channel” Box to
enable that channel. Until the
channel is enabled, no additional
information can be entered for
that channel. Channels 9 and 10
are the built-in accelerometers.
These two channels are always enabled as accelerometers unless the Accelerometer Enable boxes on the right side of the form are
de-selected and two jumpers are changed as shown on the jumper table.
Channel Name and Units
Enter a descriptive name for each channel (this will appear on your graphs) e.g. Oil Pressure and an abbreviation for the engineering
units of the variable e.g. “psi”. These are the units that will appear on your graph.
Channel Calibration
Analog channels have a six (6), element table that allows you to calibrate your sensor to provide the right EGT, oil pressure etc., read
out. Having 6 elements allows you to calibrate some non-linear sensors (e.g. NGK wide range oxygen sensor), but for most applications
(linear sensors), you will only need to utilize the left two elements. The lower numbers in gray are the raw voltage inputs, the numbers
in white are the corresponding display numbers you are interested in.
Fuel Pressure Example
Before entering in the
calibration constants for an
analog input you must find
out the calibration of the
sensor. The pressure sensors that are sold with QwikData have a 1 to 5 volt linear output over the chosen pressure range of the sensor.
The default for Channel 11 is a 0 to 100-psi sensor. The calibration is thus (1)(0) (1-volt equals 0 psi) and (5)(100) (5 volts equals 100
psi). The third element is (0), (0) which indicates to QwikData that this is the end of the calibration table data.
EGT Example
The EGT converters supplied with QwikData have an output of 0-10 volts over a temperature range of 32° to 1809°. F (0-987°. C).
The calibration is thus (0)(32) (0 volts equals 32°. F) and (10)(1809) (10 volts equals 1809°. F). The third element is (0), (0) which
indicates to QwikData that this is the end of the calibration table data.
Catalog #91001, 91003, 91004, 91005, 91007, 91009
Rev. 9/06 - RS/mc
Page 17 of 47
©2006 Edelbrock Corporation
Brochure #63-0282
Zero Analog Channels
The QwikData program allows you to zero selected analog channels at any time. This effectively changes the calibration values so that
the current value being read on the channel is assigned as the zero point for the sensor and all readings will then be displayed as plus
and minus values referenced to this zero point. This feature is most useful for sensors such as suspension travel sensors. In this case,
the vehicle would be setup at its normal static ride height including full tanks and driver and then the suspension travel channel would
be zeroed. After being zeroed, the suspension travels values would be displayed as plus and minus values relative to the static value.
Note: This screen should not be used to zero the accelerometers that are included in the QwikData unit. To zero the accelerometers,
use the “Zero Accelerometers” selection from the “Tools” menu (see the Zero Accelerometers section below.
To zero analog channels select “Zero Analog Channels” from the “Tools” menu.
Note: the QwikData unit must be on and connected to the PC for this function to be active.
This will display the Zero Analog Channels screen.
Select each channel to be zeroed by checking the check box next to the channel name.
NOTE: Only analog channels that are currently enabled can be zeroed. When you have selected all the channels to be zeroed, click
on the “OK” button.
Catalog #91001, 91003, 91004, 91005, 91007, 91009
Rev. 9/06 - RS/mc
Page 18 of 47
©2006 Edelbrock Corporation
Brochure #63-0282
Zero Accelerometers
After installing the QwikData unit and before operation, this should be selected to automatically zero the accelerometer readings. This
will take into account minor mounting misalignment (i.e. if box is not absolutely level).
Note: The QwikData unit must be powered up and connected to your PC.
Select “Zero Accelerometers” from the “Tools” menu and the system will proceed.
Logging Setup
The “Logging Setup” menu option allows you to configure how and when data is logged and the logic criteria required to trigger the
digital outputs.
Sample Rate
This is the number of times per second that QwikData scans the sensors. The valid numbers are from 0.1 (once every ten seconds)
to 500. All digital and analog channels are scanned at this rate.
Samples/Average
QwikData can average incoming data over multiple samples to smooth noisy signals.
Log Rate
This is the result of dividing the sample rate by the samples/average. The result is the number of times per second that QwikData
actually puts data into memory. It is usually best to sample at a high rate (e.g. 500 samples/sec), then select the samples/average to
give you the actual data storage rate you need. The higher the logging rate is, the better the graphing resolution will be. But memory
is filled more quickly (and the longer the upload times). For road racing, unless you are trying to analyze suspension travel a log rate
of 20 times per second is adequate. 50 or even 100 times per second is probably better for drag racing due to the short runs. The
total logging time or run time depends on the number of channels being logged and the Log Rate.
The Run Time can be calculated from the following formula:
8333
Run Time =
# Channels x Log Rate
Use the run time calculator (On CD-ROM) to estimate your total logging time.
Catalog #91001, 91003, 91004, 91005, 91007, 91009
Rev. 9/06 - RS/mc
Page 19 of 47
©2006 Edelbrock Corporation
Brochure #63-0282
Speed Channel
The historical graphs can display data vs. time, or data vs. distance traveled. If this feature is desired, a vehicle speed sensor must be
installed and you must tell the system which speed sensor will be used for the distance calculations. A list of all enabled digital inputs
is displayed for selection.
Speed Units
The units that the speed sensor is calibrated in must be entered here so that the distances on the graphs can be configured correctly.
Select a value from the pre-configured list.
Lap Trigger Channel
If a lap beacon or driver controlled pushbutton is used to break a session into laps, then this input box is used to identify the digital
channel number to QwikData. A list of all enabled digital inputs is displayed for selection.
Starting Trigger
One of the handiest features of QwikData is the ability to start logging when a certain action occurs, or a sensor reaches a pre-defined
value (e.g. start logging when RPM > 5000). If automatic start/stop triggers are not used, data logging can be started manually from
the Realtime display screen.
First select whether the trigger is digital or analog by clicking on the appropriate button.
Catalog #91001, 91003, 91004, 91005, 91007, 91009
Rev. 9/06 - RS/mc
Page 20 of 47
©2006 Edelbrock Corporation
Brochure #63-0282
Digital Starting Triggers
These allow you to start logging based upon a digital sensor value (e.g. Wheel Speed > 30)
The first box displays a list of all enabled digital channels. Select the channel desired or “none”. The third box allows you to select
whether the trigger occurs on a rise or fall in the value.
The final box allows you to enter the value (e.g. 30). The second box is only used for pure digital signals when you must select whether
the trigger condition is on a high or low value. (The third and fourth boxes do not have any relevance for pure digital signals).
Analog Starting Triggers
Analog Starting Triggers allow you to start logging based upon an analog sensor value, e.g. EGT > 600.
The first box displays a list of all enabled analog channels. Select the channel desired or “none”. The third box allows you to select
whether the trigger occurs on a rise or fall in the value. The final box allows you to enter the value (e.g. 600).
Catalog #91001, 91003, 91004, 91005, 91007, 91009
Rev. 9/06 - RS/mc
Page 21 of 47
©2006 Edelbrock Corporation
Brochure #63-0282
Stopping Trigger
Once QwikData starts logging, it must either wait for the power to be shut off, the “Stop Logging” command to be issued via the Real
Time screen, or the “Stop” logging criteria to be met. The “Stop trigger” operation is similar to that of the “Start Trigger”.
First select whether the trigger is digital or analog by clicking on the appropriate button.
Digital Stopping Triggers
This allows you to stop logging based upon a digital sensor value, e.g. RPM < 200. The first box displays a list of all enabled digital
channels. Select the channel desired or “none”. The third box allows you to select whether the trigger occurs on a rise or fall in the
value.
The final box allows you to enter the value (e.g. 200). The second box is only used for pure digital signals when you must select whether
the trigger condition is on a high or low value. (The third and fourth boxes do not have any relevance for pure digital signals).
Analog Stopping Triggers
This allows you to stop logging based upon an analog sensor value, e.g. Oil Pressure less than 10.
The first box displays a list of all enabled analog channels. Select the desired or “none”.
The third box allows you to select wether the trigger occurs on a rise or fall in the value. The final box allows you to enter (e.g.10)
Catalog #91001, 91003, 91004, 91005, 91007, 91009
Rev. 9/06 - RS/mc
Page 22 of 47
©2006 Edelbrock Corporation
Brochure #63-0282
Digital Outputs
QwikData has two configurable outputs, which can drive a Bosch type automotive relay or a small light (0.5 amps maximum).
Configuration of the digital outputs is accessed from the “Logging Setup” screen. First select whether or not the digital output will be
utilized by checking the appropriate box.
The logic selection process is similar to the start/stop triggers.
Select a sensor for the first logic condition from the list of available channels, whether you want to trigger on a < or > condition, and
the value. E.g. Oil Pressure < 20.
If a second logic condition is desired, enter the appropriate values, then select “And” or “Or” from the middle selection list e.g. Oil
Pressure < 20 or Fuel Pressure < 3.
Graphing Setup
Graphing Setup allows you to choose what variables are displayed on the graph (up to 9 can be graphed at once), what colors they are
displayed in, and the scale at which you want to display the data.
Select if you want the channel displayed or not by clicking on the “Graph” box .
Autoscale
Select if you want the system to automatically detect the minimum and maximum scale data values and set the scales accordingly.
This provides the maximum data resolution, but will result in uneven minimum and maximum scale values.
Catalog #91001, 91003, 91004, 91005, 91007, 91009
Rev. 9/06 - RS/mc
Page 23 of 47
©2006 Edelbrock Corporation
Brochure #63-0282
Min Scale/Max Scale
As an alternative to autoscaling, you can select the minimum/maximum values that you want to display on the screen. For instance,
while the tach signal is calibrated from 0 to 9000 RPM, you may want to concentrate on the 3000 to 6000 range. In this case, enter
3000 as the Min. Scale value and 6000 as the Max. Scale value.
Channel Colors
To change the graph color of a channel, double click on the corresponding color box to bring up the color selection window.
Choose one of the pre-defined colors from the Basic Colors palette, or create a custom color from the palette. Click on “OK” to exit
the window and select the chosen color.
Advanced Options
If Advanced Options is selected from the “Tools” menu, two more options appear for each channel; “Average”
and “Lookup”. Normally you would not need to change any of these settings.
Average determines whether the data averaging selected in the “Logging” setup is utilized in Realtime display
mode. If “Average” is not selected, each value displayed in the Realtime Graph is the last “Raw” analog value.
Depending on the log rate and what the actual signal looks like, averaged and raw data may look quite
different.
“Lookup” determines whether or not the real time values displayed utilize the data calibration tables or are
passed as raw values (0-10 Volts) to the realtime display.
Catalog #91001, 91003, 91004, 91005, 91007, 91009
Rev. 9/06 - RS/mc
Page 24 of 47
©2006 Edelbrock Corporation
Brochure #63-0282
Chart Setup
The general appearance of the data graphs can be customized by the user. The Chart Setup feature allows you to select the
background color of the chart, the color of the grid and axes lines, and the colors of the cursors. Any changes made are saved and
become permanent until new changes are made. The selected colors are used for both the Realtime Graph Display and the Historical
Graph Display. There are several way to access the Chart Setup screen; by selecting “Chart Setup” from the “Tools” menu on the main
screen, by clicking on the “Setup” menu item on the Realtime Graph screen or by selecting “Chart Setup” from the “Setup” menu on
the Historical Graph screen.
To change a chart color, click on the corresponding color box. The box on the left of the Chart Setup screen shows a sample graph
setup with the currently selected colors. The color selection screen will then be displayed.
Catalog #91001, 91003, 91004, 91005, 91007, 91009
Rev. 9/06 - RS/mc
Page 25 of 47
©2006 Edelbrock Corporation
Brochure #63-0282
Select the desired color and click on the “OK” button to return to the “Chart Setup” screen.
Save Setup
After you have entered all the Setup data you should save it to a file using the “Save Setup” item in the “File” menu of the main tool
bar.
After selecting this item, the standard Windows file load/save dialog box will open up.
Choose the file location, type in a descriptive name with the file extension of .sup, and then click on the “OK” button.
Catalog #91001, 91003, 91004, 91005, 91007, 91009
Rev. 9/06 - RS/mc
Page 26 of 47
©2006 Edelbrock Corporation
Brochure #63-0282
Load Setup
This option allows you to retrieve a previously saved Setup from disk. You may want to have separate Setups for different applications
(i.e. one Setup for the vehicle, another when dynamometer testing the engine), or when using QwikData on different vehicles. Select
“Load Setup” from the “File” menu.
After selecting this item, the standard Windows file load dialog box will be displayed.
Locate the desired setup file and double click on the file name to load the selected setup file.
Download Setup
After entering and saving the Setup data, select this option from the “Setup” menu to download your Setup data to the QwikData box.
The box must be powered up and connected before proceeding.
Downloading will erase any previously saved data in the box. Selecting “Download Setup” is a convenient way to clear the memory
in preparation for logging new data.
Catalog #91001, 91003, 91004, 91005, 91007, 91009
Rev. 9/06 - RS/mc
Page 27 of 47
©2006 Edelbrock Corporation
Brochure #63-0282
Upload Setup
An upload is automatically performed whenever the PC establishes communications with the QwikData box.
You can manually instruct the system to upload the contents of the box by choosing this selection from the “Setup” menu.
Using Realtime Graphing to Assist in System Checkout
After wiring and configuring your system, you will want to check that each channel is correctly installed.
Normal Analog Sensors
Analog sensors are the simplest case and in most cases can be checked out without even starting the vehicle. Use a torch or heat gun
to heat up the area around each EGT and watch that the response is as expected on the Realtime graphs. Oil pressure sensors can
be checked out by priming or cranking the engine.
Position Sensors
These can be can be checked by physically moving the elements and watching the Realtime graphs. If you want to calibrate the
sensors (e.g. calibrate throttle position to read between 0 and 100 percent) -go back to the “Analog Channel Menu” and select and set
each channel so that the output reading is equal to the input . Example - for a 0 to 5 volt sensor, set the output to read 0 to 5. Download
the new setup and go back to the Realtime Graph Display. Move the position sensor between the min and max positions and record
the two values, (which is now a voltage) displayed. Go back to the “Analog Channel Setup” screen and now instead of entering (0), (0)
and (5), (100) as the calibration values, enter new minimum voltage, (0) and new maximum voltage, (100) as the number pairs.
Remember to save your new setup to your hard drive and download it to the QwikData unit.
RPM Inputs
Tach input signals need to be checked with the engine running. Start the engine and verify that the Realtime Graph displays the correct
RPM.
Pure Digital Inputs
Switch the circuit being monitored on and off ( e.g. depress brake pedal for brake on/off input) while watching the Realtime graph.
Check that the graph changes state of Wheel & Shaft Speed Sensors. Since the minimum frequency that can be read with the default
timer resolution is 6 Hz, speed sensor inputs are probably most easily checked out by setting the Digital Channel “Type” as “Pure
Digital” temporarily, then download the setup to the QwikData unit. Go back to the Realtime Graph Display and monitor the display
while slowly rotating the shaft. You should be able to watch the output change when the magnet passes the sensor. After you have
verified the sensor, change the channel “Type” back to the proper type and download the setup to the QwikData unit again.
Viewing Realtime Data
Selecting this item from the “View” menu will bring up the Realtime trend graph and data will
start displaying immediately. Data is updated on the display at approximately 4 times per
second.
Catalog #91001, 91003, 91004, 91005, 91007, 91009
Rev. 9/06 - RS/mc
Page 28 of 47
©2006 Edelbrock Corporation
Brochure #63-0282
The channels displayed and the graph scaling are configured in the “Graphing Setup”. Below the graphs, text boxes display the current
values of each channel.
Reset Memory
As an option to erasing memory via the “Download Setup” command, this may be done by clicking on the “Reset Memory” button. The
Realtime display will freeze and the “Resetting Memory” indicator will be highlighted in red while memory is erased.
Manual Stop / Start
As well as configuring the system to automatically start and stop data logging via the Logging Setup Screen, you may start Logging
Manually by clicking on the “Start Logging” button on the bottom right of the Real Time Data Screen. The “Data Logging” indicator
will be highlighted in red and the button label will change to read “Stop Data Logging”. Click on this button again to stop data logging.
Once data logging is started or stopped manually, the automatic triggers will not be functional until the next time power to the QwikData
box is turned off and on, or a “Download Setup” is performed.
Choosing Channels for Display
If you wish to look at different channels than initially selected:
Close the realtime graph display and enable the desired channels from the Digital Setup Q and Analog Setup Screens.
Use the Graph Setup Screen to select graph colors, labels and scales.
You must Download the setup information to the QwikData unit again before the changes take effect.
Setting the Window Width
If you want to view more or less data at a time, (from 10 -120 Seconds) select the “Window” menu at the top of the graph and select
a new total window time size.
Catalog #91001, 91003, 91004, 91005, 91007, 91009
Rev. 9/06 - RS/mc
Page 29 of 47
©2006 Edelbrock Corporation
Brochure #63-0282
Uploading Data
After historical data is logged, it must be uploaded from the QwikData box to the PC before it can be viewed. Make sure the QwikData
box is powered up and connected to your PC. Select “Upload Data” from “File” menu.
The system will first upload the setup information. It will then determine how many data sessions there are (Every time the start/stop
criteria are met, a new data session is created. Up to 64 sessions can be stored in the box). A standard Windows File Save Dialog box
will then open. Choose where the data will be stored and a file name. If there are multiple sessions, the system will automatically
append a unique 2-digit number to the file name.
Once Data is uploaded, you can clear the memory by selecting “Download Setup” from the “Setup” menu or by clicking on the “Erase
Memory” button on the realtime graph display. If the memory is not cleared, new data will simply be appended to the old. The next
time you “Upload” you may then have some duplicated data.
Viewing Historical Data
Historical data can be viewed at your leisure without having the QwikData box connected. To view data that has already been logged,
double click on “Historical Data” in the “View” menu in the main toolbar.
Catalog #91001, 91003, 91004, 91005, 91007, 91009
Rev. 9/06 - RS/mc
Page 30 of 47
©2006 Edelbrock Corporation
Brochure #63-0282
A standard Windows dialogue box will open. Select the file to be viewed and double click on it. The system will load all the data at
once and compress the entire run on one screen.
The x-axis is normally the time scale (or could be distance as discussed below) and will display time in seconds, minutes, or hours
depending on the amount of data recorded. The y-axis contains up to 9 different scales for each of the 9 channels that can be displayed
on a graph. The colors of the axes correspond to the text boxes below the graph.
The text boxes below the graph show the value of each channel being displayed at each current cursor position. Move the mouse
across the screen and these values will change.
Measuring the Length of Time Between Events
To measure the length of time of an event, move the mouse
to the start of the event in question and click with the left
mouse button. The cursor will change red and freeze in that
position. Move the mouse again and the black cursor will reappear. Move the black cursor to the end of the event in
question and click the left mouse button again. The time
between the cursors will be displayed in the lower left of the
screen (Cursor Span).
Catalog #91001, 91003, 91004, 91005, 91007, 91009
Rev. 9/06 - RS/mc
Page 31 of 47
©2006 Edelbrock Corporation
Brochure #63-0282
Changing the channels Displayed
Choose “Graphing Setup” from the “Setup” menu at the top of the historical data window. The same “Graphing Setup” screen as
described previously will appear. You can select the channels you want displayed (up to 9 at one time), the graph colors, and the
scaling for each variable. Changes take effect immediately as soon as you select “OK” and exit the screen.
Viewing Data by Time or Distance
If a wheel speed sensor was installed and the “Speed Channel” and “Units” were entered in the
“Logging Setup” screen then you may view the graph as a function of distance instead of time (default).
Sometimes it may be more convenient to compare , events at a certain spot on a track (e.g. 1000 feet
down the track) as opposed to a fixed time as time may vary with fast or slow laps (runs). Select either
the “Time” or “Distance” options from the “Display” menu at the top of the historic data window.
Viewing Data by Lap
If a lap beacon or a driver-controlled pushbutton was utilized to break data into laps, and this feature was enabled in the “Logging
Setup” screen, then you may view data from the entire run or individually by laps. In the “Display” menu, select “View by Lap”. (If
there is only one lap to display or the data is not broken up into laps, the “View By Lap” option will be disabled). When “View By Lap”
is selected the “Primary” and “Secondary” menus will be enabled allowing you to select both a primary and a secondary lap to view.
To view a particular lap, click on the “Primary” menu to display a list of all available laps. Then click on the lap that you would like to
view from the list.
Catalog #91001, 91003, 91004, 91005, 91007, 91009
Rev. 9/06 - RS/mc
Page 32 of 47
©2006 Edelbrock Corporation
Brochure #63-0282
To overlay a secondary lap, select the desired lap from the “Secondary” menu. The secondary lap will be represented by dotted lines
on the graph.
The lap times of both the primary and secondary laps will be displayed at the bottom of the screen. You can switch between which
values are displayed at the bottom of the screen (primary or secondary lap) by clicking the right mouse button. The currently active
lap will be shown in red. To remove the secondary lap from the graph select “None” from the “Secondary” menu. To return to viewing
data in a non-lap dependent mode, select “View AU Data” from the “Display Menu”.
Viewing Data as Lap Dependent or Cumulative
When you are viewing lap data, you have the choice of viewing it as “Lap Dependent” or “Cumulative”. If
you view it as lap dependent, the time at the start of the lap will become"0".
If you view it as “Cumulative”, the time will be the actual time into the race.
NOTE: Data will always view as “Lap Dependent” if you are comparing primary and secondary laps.
Zoom In / Zoom Out
There are two basic ways to zoom in or magnify the Historical Graph display. Using the Up arrow key on the keyboard, or clicking on
the up facing arrow on the bottom right of the screen will magnify the graph by two about the center of the screen.
Catalog #91001, 91003, 91004, 91005, 91007, 91009
Rev. 9/06 - RS/mc
Page 33 of 47
©2006 Edelbrock Corporation
Brochure #63-0282
You can also select a portion of the graph to zoom by setting the two cursors around the portion of interest. Next either select “Zoom”
from the “Graph” menu or click the right mouse button and select “Zoom” from the pop-up menu.
To zoom out, press the Down arrow key on the keyboard or click on the down facing arrow at the bottom of the screen.
Scroll or Pan the Graph
If there is more data than is currently being displayed on the graph, you can scroll the graph left or right using the left and right arrow
keys, or by clicking on the left and right facing arrows at the bottom of the screen.
Overlaying a Secondary File
You may also retrieve a secondary data file from disk to be overlaid on the primary file. To load a
secondary file select the ‘Open Secondary File’ option from the ‘Graph’ menu. And select the data
file to be opened from the dialog box.
NOTE: You cannot display data by "Distance" when Viewing by Lap.
Catalog #91001, 91003, 91004, 91005, 91007, 91009
Rev. 9/06 - RS/mc
Page 34 of 47
©2006 Edelbrock Corporation
Brochure #63-0282
The “Secondary File” menu will now be active. Click on this menu to see a list of the available laps from the secondary file and click
on the lap you wish to overlay.
NOTE: This secondary file must have exactly the same Digital and Analog Channel Configuration as the primary file.
The selected lap from the secondary file will now be overlaid on the Historical Graph and represented by dotted lines. To remove the
secondary file lap from the graph select “None” from the “Secondary File” menu. If the selected secondary file is not broken up into
laps, then the “Secondary File” menu will only contain “(None)” and “Secondary Data” as shown below.
Select “Secondary Data” to overlay the secondary file or “(None)” to view only the primary file data.
Aligning Primary and Secondary File Graphs
Two data files such as two drag runs will rarely start at the same time relative to the start of the run. As a result, when comparing
these files by overlaying them on the historical graph, the two files will not “line-up” on the graph. This makes it difficult to accurately
compare the two files. To solve this problem, the program allows you to shift one file relative to another so that the data from the two
files can be aligned.
NOTE: This feature is not active if the data files contain multiple laps. Since lap data requires accurate start and stop times, all the
lap data will automatically align properly.
To align two files, view both files on the Historical Graph by over-laying the Secondary File on the Primary File. Using the first cursor,
select a point from the Primary File (solid graph lines) that you want to use as the reference point.
This point can be any point on the primary graphs such when the vehicle speed first begins to rise or the maximum acceleration point
at launch (used in the example shown).
Catalog #91001, 91003, 91004, 91005, 91007, 91009
Rev. 9/06 - RS/mc
Page 35 of 47
©2006 Edelbrock Corporation
Brochure #63-0282
Next select the corresponding point from the Secondary File (dotted graph lines).
Hint: When setting the two reference points, zoom in on the Historical Graph so you can accurately pick the desired points. If you
don’t get the reference quite right or you decide to change you reference points, you can always select new points and re-align the
files.
To align the two files based on the selected reference points, click the right mouse button to display the pop-up menu. Select “Align
Data Files” from the pop-up menu.
Catalog #91001, 91003, 91004, 91005, 91007, 91009
Rev. 9/06 - RS/mc
Page 36 of 47
©2006 Edelbrock Corporation
Brochure #63-0282
Alternately, you can select “Align Data Files” from the “Graph” menu.
This will shift the data so that the two reference points align with each other on the graph and all the data from each file will be
displayed relative to the reference points and the two files can be easily compared.
To return the two files to their original alignment relative to each other, select “Reset Data File Alignment” from the “Graph” menu.
Catalog #91001, 91003, 91004, 91005, 91007, 91009
Rev. 9/06 - RS/mc
Page 37 of 47
©2006 Edelbrock Corporation
Brochure #63-0282
Cropping Data Files
Sometimes you may log more data than you really wanted. In these cases you can use the crop function to eliminate the unwanted
data. To crop a data file, open the file for viewing in the Historical Graph display. Set the two cursors around the part of the data file
that you want to keep and then select “Crop Datafile” from the “Graph” menu.
After setting the two cursors as desired, you can also click the right mouse button and select “Crop Data” from the pop up menu.
Selecting the Crop function will display the “Save Data File” screen.
Enter a file name to use to save the cropped data file and click the “Save” button to write the cropped file to your disk. The “Crop”
function does not alter the original data file but creates a new file containing only the data of interest.
NOTE: The “Crop” function is not active if the data file contains multiple laps.
Catalog #91001, 91003, 91004, 91005, 91007, 91009
Rev. 9/06 - RS/mc
Page 38 of 47
©2006 Edelbrock Corporation
Brochure #63-0282
Obtaining a Histogram
QwikData allows you to obtain the frequency distribution for any channel over any time period. One useful example may be to obtain
the RPM distribution over one lap, or one run, to help in camshaft selection. Select the desired period using the two cursors, then select
“Histogram” from the “Graph” menu of the Historical Data screen. A list of all available channels will be displayed. If the two cursor
are not set, the histogram is calculated based on the entire data file.
Click on your choice and a histogram will be produced. If you select the “Display” menu on the histogram screen, you have
the option of sending a copy of the histogram to your Windows system printer.
Printing a Graph
Select “Print Window” from the “Graph” menu at the top of the historical data window. The entire graph and everything that is currently
displayed will be sent to your current Windows system printer.
Catalog #91001, 91003, 91004, 91005, 91007, 91009
Rev. 9/06 - RS/mc
Page 39 of 47
©2006 Edelbrock Corporation
Brochure #63-0282
Export Data File to Text File
If you would like to do further analysis of your logged data using a different software package, or simply want to view the raw data,
then this option will export the data to a tab delimited text file.
Once this option is selected, a Windows “Open File” dialogue box will open. Select the file you want to export, then double click on it
or select “OK”. A “Save File” dialogue box will then open. Enter a new file name and extension (the default extension is .txt). The data
is formatted so that it can be viewed or printed from any text editor or word processor. The logging setup information is displayed first
followed by the raw data. The exported file can be directly imported into a spreadsheet program such as Microsoft Excel as a “tab
delimited” text file.
Catalog #91001, 91003, 91004, 91005, 91007, 91009
Rev. 9/06 - RS/mc
Page 40 of 47
©2006 Edelbrock Corporation
Brochure #63-0282
Restore Default Setup
The default setup corresponds to the settings that your QwikData unit was originally shipped with from the factory and correspond to
the standard QwikData Package that you purchased.
To restore the factory default setup, select “Restore Default Setup” from the “Tools” menu
on the main QwikData screen.
Normally you will not ever have to “Restore Defaults”.
Update Firmware
The internal QwikData program code is stored in Flash EPROM and can be updated via the QwikData PC software. This allows you to
upgrade QwikData firmware without having to open the box and change EPROMs. Firmware files have an .S19 extension. Program
Updates will be posted on Edelbrock website for downloading as they become available. Before updating your firmware, be sure to
upload your current setup from the QwikData unit and then save it to your hard drive using the “Save Setup” function.
Once you have downloaded a firmware file from the Web, exit all other Windows programs
that are running. Select “Update Firmware” from the “Tools” Menu.
A standard Windows Open File Dialogue box will appear. Select the file name that you downloaded from the web with the .S19
extension. A warning message will be displayed to remind you to shut down all other programs.
Select “OK”. The system will automatically download the new program and then re-start the QwikData box. Once the firmware update
is complete, load the setup file that you previously saved to your hard drive and then download it to your QwikData unit to restore your
setup.
WARNING: If you do not download a valid setup file to the QwikData unit after updating the firmware, the unit may not
function correctly.
Catalog #91001, 91003, 91004, 91005, 91007, 91009
Rev. 9/06 - RS/mc
Page 41 of 47
©2006 Edelbrock Corporation
Brochure #63-0282
Connector Pin Out : Bracket / Import and Compact Drag Racing Systems
Connector J1
Tx
Rx
Return
Battery
Ground
+5 V Out
Channel 9
Channel 10
Channel 11
Channel 12
Channel 13
Channel 14
Channel 15
Channel 16
Channel 1
Channel 2
Channel 3
Channel 4
Channel 5
Channel 6
+12 V Out
Digital Out 1
Digital Out 2
Pin
1
2
3
4
5
6
7
8
9
10
11
12
13
14
15
16
17
18
19
20
21
22
23
Function
Serial Data To PC
Serial Data From PC
Serial Data Return
+12V System Power
System Ground
Sensor Power, +5V
Accelerometer (Long)
Fuel Pressure
Oil Pressure
Thermocouple Converter
Thermocouple Converter
Thermocouple Converter
Thermocouple Converter
Battery Voltage Monitor
Engine RPM
Wheel Speed
Log Off/On Switch
Sensor Power, +12V
0/5 VDC, (off/on)
0/5 VDC, (off/on)
Connector
J4
J4
J4
Battery
Note 1
Note 2
Pin
2
3
5
J6
J7
J3
J3
J3
J3
2
2
2
3
4
5
J5
2
Note: 1
System Ground is connected to the following
Sensor
Connector
Pin
Battery Minus
Thermocouple Converter
J3
7
Wheel Speed
J5
1
Fuel Pressure
J6
1
Oil Pressure
J7
1
Note: 2
System Power, +5V is connected to the
following
Sensor
Connector
Thermocouple Converter
J3
Fuel Pressure
J6
Oil Pressure
J7
Pin
1
3
3
Note: 2
System Power, +12V is connected to the
following
Sensor
Connector
Pin
Thermocouple Converter
J3
6
Fuel Pressure
J6
4
Oil Pressure
J7
4
Note 3
Bracket / Import / Compact Drag Racing Harness
J4
Tx
Rx
Gnd
1
6
2
7
3
8
4
9
5
To PC Serial Port
DB9F Connector
DB9
Battery
Gnd
J1
Tx
Rx
Gnd
Battery
Gnd
+5V Out
Channel 9
Channel 10
Channel 11
Channel 12
Channel 13
Channel 14
Channel 15
Channel 16
Channel 1
Channel 2
Channel 3
Channel 4
Channel 5
Channel 6
+12V Out
Digital Out 1
Digital Out 2
1
2
3
4
5
6
7
8
9
10
11
12
13
14
15
16
17
18
19
20
21
22
23
Tx
Rx
Gnd
Battery
Gnd
+5VOut
Channel9
Channel10
Channel11
Channel12
Channel13
Channel14
Channel15
Channel16
Channel1
Channel2
Channel3
Channel4
Channel5
Channel6
+12VOut
DigOut1
DigOut2
Red
Orange
Green
Red
Black
Gray
Main Input Power
J8
Star Washer Ground Lug
1
J6
Gnd
Channel10
+5VOut
+12VOut
White/Pink
Blue
White/Brown
Purple/White
White/Green
White/Blue
1
2
3
4
Channel 10 (Analog) - Fuel Pressure
Switchcraft EN3 Series Circular Connector, 4 Pin Female (EN3C4F)
Mating Connector (EN3L4M) on Pressure Sensor
J7
Gnd
Channel11
+5VOut
+12VOut
1
2
3
4
J3
Purple
Green
Yellow
+5VOut
Channel12
Channel13
Channel14
Channel15
+12VOut
Gnd
Pink
1
2
3
4
5
6
7
Channel1
Gnd
Channel 11 (Analog) - Oil Pressure
Switchcraft EN3 Series Circular Connector, 4 Pin Female (EN3C4F)
Mating Connector (EN3L4M) on Pressure Sensor
Channels 12 - 15 (Analog) - Thermocouple Converter
Channel 12 - Exhaust Gas Temperature (Left)
Channel 13 - Exhaust Gas Temperature (Right)
Channel 14 - Oil Temperature
Channel 15 - Coolant Temperature
Switchcraft EN3 Series Circular Connector, 7 Pin Female (EN3C7F)
Mates with Thermocouple Converter
Channel 1 (Digital) - Tach Input (Engine RPM)
J5
Gnd
Channel2
Main Connector
(Connects to Left Connector)
Channel3
Gnd
Catalog #91001, 91003, 91004, 91005, 91007, 91009
Rev. 9/06 - RS/mc
Page 42 of 47
1
2
3
4
Channel 2 (Digital) - Speed (Wheel/Shaft Speed Sensor)
Switchcraft EN3 Series Circular Connector, 4 Pin Female (EN3C4F)
Mating Connector (EN3L4M) on Speed Sensor
Channel 3 (Digital) - Log On/Off (Data Log Start/Stop Switch)
©2006 Edelbrock Corporation
Brochure #63-0282
Connector Pin Out : Circle Track / Road Racing and Advanced Systems
Connector J1
Tx
Rx
Return
Battery
Ground
+5 V Out
Channel 9
Channel 10
Channel 11
Channel 12
Channel 13
Channel 14
Channel 15
Channel 16
Channel 1
Channel 2
Channel 3
Channel 4
Channel 5
Channel 6
+12 V Out
Digital Out 1
Digital Out 2
Gnd
Channel 17
Channel 18
Channel 19
Channel 20
Channel 21
Channel 22
Channel 23
Channel 24
Channel 25
Channel 26
Channel 27
Channel 28
+12 V Out
+12 V Out
+5 V Out
+5 V Out
Channel 29
Channel 30
Channel 31
Channel 32
Gnd
Gnd
Pin
1
2
3
4
5
6
7
8
9
10
11
12
13
14
15
16
17
18
19
20
21
22
23
1
2
3
4
5
6
7
8
9
10
11
12
13
14
15
16
17
18
19
20
21
22
23
Function
Serial Data To PC to J2
Serial Data From PC to J2
Serial Data Return
+12V System Power
Sysytem Ground
Sensor Power, +5V
Accelerometer, (Long)
Accelerometer, (Lat)
Fuel Pressure
Oil Pressure
Transmission Pressure
Brake/Nitrous Pressure
Analog
Battery Voltage Monitor
Engine RPM
Shaft speed 1
Shaft speed 2
Data Log On/Off
Digital input
Digital input
Sensor Power, +12V
0 or +5V (Off or ON)
0 or +5V (Off or ON)
Sensor ground
EGT 1
EGT 2
EGT 3
EGT 4
EGT 5
EGT 6
EGT 7
EGT 8
Oil Temperature
Coolant Temp.
Nitrous Temp.
Temp, Spare
+12 V Sensor Power
+12 V Sensor Power
+5 V Sensor Power
+5 V Sensor Power
Analog
Analog
Analog
Analog
Sensor Ground
Sensor Ground
Connector
J4
J4
J4
Battery Plus
Note 1
Note 2
Pin
2
3
5
J6
J7
J8
J9
(Spare)
2
2
2
2
J5
J3
2
2
(Spare)
(Spare)
Note 3
(Spare)
(Spare)
Note 4
J10
J10
J10
J10
J11
J11
J11
J11
J12
J12
J12
J12
Note 5
J12
Note 6
J12
(Spare)
(Spare)
(Spare)
(Spare)
J12
(Spare)
2
3
4
5
2
3
4
5
2
3
4
5
Note: 1
System Ground (J1 Pin5) is connected to the
following
Note: 4
Sensor Power +12V (J2 Pin14) is connected
to the following
Sensor
Battery Minus
Fuel Pressure
Oil Pressure
Transmission Pressure
Brake/Nitrous Pressure
Shaft Speed 1
Shaft Speed 2
Sensor
Left Rear Susp. Travel
Right Rear Susp. Travel
Connector
Pin
J6
J7
J8
J9
J5
J3
1
1
1
1
1
1
Connector
J11
J12
Pin
4
4
Note: 2
Sensor Power +5V (J1 Pin6) is connected to
the following
Note: 5
Sensor Power +5V (J2 Pin16) is connected
to the following
Sensor
Fuel Pressure
Oil Pressure
Transmission Pressure
Brake/Nitrous Pressure
Sensor
Left Rear Susp. Travel
Right Rear Susp. Travel
Connector
J6
J7
J8
J9
Pin
3
3
3
3
Connector
J11
J12
Pin
3
3
Note: 3
Sensor Power +12V (J1 Pin21) is connected
to the following
Note: 6
Sensor Ground (J2 Pin22) is connected to
the following
Sensor
Fuel Pressure
Oil Pressure
Transmission Pressure
Brake/Nitrous Pressure
Sensor
Left Rear Susp. Travel
Right Rear Susp. Travel
Connector
J6
J7
J8
J9
Pin
4
4
4
4
Connector
J11
J12
Pin
1
1
6
1
7
J2
J1
QwikData Connections (J1 and J2)
Catalog #91001, 91003, 91004, 91005, 91007, 91009
Rev. 9/06 - RS/mc
Page 43 of 47
©2006 Edelbrock Corporation
Brochure #63-0282
Circle Track / Road Racing / Advanced Harness (A)
J4
Tx
Rx
Gnd
1
6
2
7
3
8
4
9
5
To PC Serial Port
DB9F Connector
DB9
Battery
Gnd
Main Input Power
J8
1
Star Washer Ground Lug
J6
Gnd
Channel11
+5VOut
+12VOut
J1
1
2
3
4
5
6
7
8
9
10
11
12
13
14
15
16
17
18
19
20
21
22
23
Tx
Rx
Gnd
Battery
Gnd
+5V Out
Channel 9
Channel 10
Channel 11
Channel 12
Channel 13
Channel 14
Channel 15
Channel 16
Channel 1
Channel 2
Channel 3
Channel 4
Channel 5
Channel 6
+12V Out
Digital Out 1
Digital Out 2
Tx
Rx
Gnd
Battery
Gnd
+5VOut
Channel9
Channel10
Channel11
Channel12
Channel13
Channel14
Channel15
Channel16
Channel1
Channel2
Channel3
Channel4
Channel5
Channel6
+12VOut
DigOut1
DigOut2
Red
Orange
Green
Red
Black
Gray
1
2
3
4
Channel 11 (Analog) - Fuel Pressure
Switchcraft EN3 Series Circular Connector, 4 Pin Female (EN3C4F)
Mating Connector (EN3L4M) on Pressure Sensor
J7
Gnd
Channel12
+5VOut
+12VOut
Blue
White/Brown
Purple/White
White/Green
1
2
3
4
Channel 12 (Analog) - Oil Pressure
Switchcraft EN3 Series Circular Connector, 4 Pin Female (EN3C4F)
Mating Connector (EN3L4M) on Pressure Sensor
J8
Gnd
Channel13
+5VOut
+12VOut
Purple
Green
Yellow
White
1
2
3
4
Channel 13 (Analog) - Transmission Pressure
Switchcraft EN3 Series Circular Connector, 4 Pin Female (EN3C4F)
Mating Connector (EN3L4M) on Pressure Sensor
J9
Pink
Gnd
Channel14
+5VOut
+12VOut
Main Connector
(Connects to Left Connector)
1
2
3
4
Channel1
Gnd
Channel 14 (Analog) - Brake / Nitrous Pressure
Switchcraft EN3 Series Circular Connector, 4 Pin Female (EN3C4F)
Mating Connector (EN3L4M) on Pressure Sensor
Channel 1 (Digital) - Tach Input (Engine RPM)
J5
Gnd
Channel2
1
2
3
4
Channel 2 (Digital) - Speed 1 (Wheel/Shaft Speed Sensor #1)
Switchcraft EN3 Series Circular Connector, 4 Pin Female (EN3C4F)
Mating Connector (EN3L4M) on Speed Sensor
J3
Gnd
Channel3
Channel4
Gnd
1
2
3
4
Channel 3 (Digital) - Speed 2 (Wheel/Shaft Speed Sensor #2)
Switchcraft EN3 Series Circular Connector, 4 Pin Female (EN3C4F)
Mating Connector (EN3L4M) on Speed Sensor
Channel 4 (Digital) - Log On/Off (Data Log Start / Stop Switch)
Circle Track / Road Racing / Advanced Harness (B)
J10
+5VOut
Channel17
Channel18
Channel19
Channel20
+12VOut
Gnd
J2
Gnd
Channel 17
Channel 18
Channel 19
Channel 20
Channel 21
Channel 22
Channel 23
Channel 24
Channel 25
Channel 26
Channel 27
Channel 28
+12V Out
+12V Out
+5V Out
+5V Out
Channel 29
Channel 30
Channel 31
Channel 32
Gnd
Gnd
1
2
3
4
5
6
7
Channels 17 - 20 (Analog) - Thermocouple Converter 1
Exhaust Gas Temperatures 1-4
Switchcraft EN3 Series Circular Connector, 7 Pin Female (EN3C7F)
Mates with TK4 Thermocouple Converter
J11
1
2
3
4
5
6
7
8
9
10
11
12
13
14
15
16
17
18
19
20
21
22
23
Gnd
Channel17
Channel18
Channel19
Channel20
Channel21
Channel22
Channel23
Channel24
Channel25
Channel26
Channel27
Channel28
+12VOut
+12VOut
+5VOut
+5VOut
Channel29
Channel30
Channel31
Channel32
Gnd
Gnd
+5VOut
Channel21
Channel22
Channel23
Channel24
+12VOut
Gnd
Black
Orange
White/Pink
Blue
White/Brown
Purple/White
White/Green
White/Blue
Brown
Purple
Green
Yellow
White
Pink
Pink
Gray
Gray
1
2
3
4
5
6
7
J12
+5VOut
Channel25
Channel26
Channel27
Channel28
+12VOut
Gnd
Black
Main Connector 2
(Connects to Right Connector)
Catalog #91001, 91003, 91004, 91005, 91007, 91009
Rev. 9/06 - RS/mc
Page 44 of 47
1
2
3
4
5
6
7
Channels 21 - 24 (Analog) - Thermocouple Converter 2
Exhaust Gas Temperatures 5-8
Switchcraft EN3 Series Circular Connector, 7 Pin Female (EN3C7F)
Mates with TK4 Thermocouple Converter
Channels 25 - 28 (Analog) - Thermocouple Converter 3
Channel 25 - Oil Temperature
Channel 26 - Coolant Temperature
Channel 27 - Nitrous Bottle Temperature
Channel 28 - Available Temperature Input
Switchcraft EN3 Series Circular Connector, 7 Pin Female (EN3C7F)
Mates with Thermocouple Converter
©2006 Edelbrock Corporation
Brochure #63-0282
Pin Assignments, Maximum Configuration
Connector J1
Tx
Rx
Battery
Power Ground
Ground
+5 V Out
Channel 9
Channel 10
Channel 11
Channel 12
Channel 13
Channel 14
Channel 15
Channel 16
Channel 1
Channel 2
Channel 3
Channel 4
Channel 5
Channel 6
+12 V Out
Digital Out 1
Digital Out 2
Pin
1
2
3
4
5
6
7
8
9
10
11
12
13
14
15
16
17
18
19
20
21
22
23
Connector J2
Gnd
Channel 17
Channel 18
Channel 19
Channel 20
Channel 21
Channel 22
Channel 23
Channel 24
Channel 25
Channel 26
Channel 27
Channel 28
+12 V Out
+12 V Out
+5 V Out
+5 V Out
Channel 29
Channel 30
Channel 31
Channel 32
Gnd
Gnd
Function
Serial Data To PC
Serial Data From PC
+12V System Power
System Power Ground
Sensor Ground, (Note 1)
Sensor Power, +5V, (Note 2)
Accelorometer (Long) (Note 4)
Accelorometer (Lat) (Note 4)
Analog Sensor, 0 - 10 VDC
Analog Sensor, 0 - 10 VDC
Analog Sensor, 0 - 10 VDC
Analog Sensor, 0 - 10 VDC
Analog Sensor, 0 - 10 VDC
Analog Sensor, 0 - 10 VDC
Digital input 0 - 12 VDC
Digital input 0 - 12 VDC
Digital input 0 - 12 VDC
Digital input 0 - 12 VDC
Digital input 0 - 12 VDC
Digital input 0 - 12 VDC
Sensor Power, +12V,, (Note 3)
0 or +5V (Off or ON)
0 or +5V (Off or ON)
Pin
1
2
3
4
5
6
7
8
9
10
11
12
13
14
15
16
17
18
19
20
21
22
23
Function
System ground, (Note 1)
Analog Sensor, 0 - 10 VDC
Analog Sensor, 0 - 10 VDC
Analog Sensor, 0 - 10 VDC
Analog Sensor, 0 - 10 VDC
Analog Sensor, 0 - 10 VDC
Analog Sensor, 0 - 10 VDC
Analog Sensor, 0 - 10 VDC
Analog Sensor, 0 - 10 VDC
Analog Sensor, 0 - 10 VDC
Analog Sensor, 0 - 10 VDC
Analog Sensor, 0 - 10 VDC
Analog Sensor, 0 - 10 VDC
+12 V Sensor Power, (Note 3)
+12 V Sensor Power, (Note 3)
+5 V Sensor Power, (Note 2)
+5 V Sensor Power, (Note 2)
Analog Sensor, 0 - 10 VDC
Analog Sensor, 0 - 10 VDC
Analog Sensor, 0 - 10 VDC
Analog Sensor, 0 - 10 VDC
System ground, (Note 1)
System ground, (Note 1)
Note 1: Sensor Ground is connected to all sensor and is used as a zero reference: See specific user manuals for details
Note 2: Sensor Power +5V , is connected to various sensors as required and is used as a voltage reference. See specific user manuals
for details.
Note 3: +12 V Sensor Power is connected to various sensors as required and is used as a voltage reference. See specific user manuals
for details.
Note 4: Channels 9 and 10 may be used as general purpose analog channels. Reset jumpers accordingly (Page 45).
SWITCHCRAFT EN3 SERIES CONNECTORS
Solder End
EN3C4F
EN3C7F
Pin 1
EN3L7M
Pin 1
Pin 7
Rear View
Key
Key
Pin 7
Pin 4
Rear View
4-Pin Female
Cord Connector
Catalog #91001, 91003, 91004, 91005, 91007, 91009
Rev. 9/06 - RS/mc
Rear View
7-Pin Female
Cord Connector
Page 45 of 47
Key
Pin 1
Rear View
7-Pin Male
Line Connector
©2006 Edelbrock Corporation
Brochure #63-0282
QwikData Jumper Configuration
Basic, Bracket and Import Drag Race Packages
J4
Factory Default Settings
No jumper. (Ch 1)
Alternative Settings
1-2. Pull-up to 12V (Ch 1)
2-3. Pull-down to ground (Ch 1)
J16
J15
J14
J16
1-2 Enable Battery Voltage Measurement
2-3. Enable external input for Ch 10
1-2. Enable Accelerometer 1 (Ch 9)
1-2 Enable Battery Voltage Measurement
2-3. Enable external input for Ch 16
1-2 Enable Accelerometer 2 (Ch 10)
2-3. Enable external input for Ch 9
2-3. Enable external input for Ch 16
J9
J8
1-2. Ch 2 (Has Pull-up to 12V)
No jumper. Ch 6
J7
J6
J5
1-2. Ch 5. (Has Pull-up to 12V)
2-3. Ch 4 (Has Pull-down to Ground)
1-2. Ch 3 (Has Pull-up to 12V)
2-3.
1-2.
2-3.
2-3.
1-2.
2-3.
Pull-down to ground (Ch
Pull-up to 12V (Ch 6)
Pull-down to ground (Ch
Pull-down to ground (Ch
Pull-up to 12V (Ch 4)
Pull-down to ground (Ch
2)
6)
5)
3)
QwikData Jumper Configuration
Advanced Drag Race and Circle Track / Road Race Packages
J4
Factory Default Settings
No jumper. (Ch 1)
Alternative Settings
1-2. Pull-up to 12V (Ch 1)
2-3. Pull-down to ground (Ch 1)
J16
J15
J14
J16
1-2 Enable Battery Voltage Measurement
1-2 Enable Accelerometer 2 (Ch 10)
1-2. Enable Accelerometer 1 (Ch 9)
1-2 Enable Battery Voltage Measurement
2-3. Enable external input for Ch 16
2-3. Enable external input for Ch 10
2-3. Enable external input for Ch 9
2-3. Enable external input for Ch 16
J9
J8
1-2. Ch 2 (Has Pull-up to 12V)
No jumper. Ch 6
J7
J6
J5
1-2. Ch 5. (Has Pull-up to 12V)
1-2. Pull-up to 12V (Ch 4)
1-2. Ch 3 (Has Pull-up to 12V)
2-3. Pull-down to ground (Ch 2)
1-2. Pull-up to 12V (Ch 6)
2-3. Pull-down to ground (Ch 6)
2-3. Pull-down to ground (Ch 5)
2-3. Ch 4 (Has Pull-down to Ground)
2-3. Pull-down to ground (Ch 3)
Catalog #91001, 91003, 91004, 91005, 91007, 91009
Rev. 9/06 - RS/mc
Page 46 of 47
©2006 Edelbrock Corporation
Brochure #63-0282
Sensor and Option Part Numbers
Description
Part No.
Basic QwikData Data Logger....................................................................................................................................................... 91100
Advanced QwikData Data Logger ................................................................................................................................................ 91101
Basic / Bracket / Import Wiring Harness ...................................................................................................................................... 91103
Advanced Wiring Harness............................................................................................................................................................ 91104
Circle Track / Road Racing Wiring Harness .................................................................................................................................. 91129
0-100 psi Pressure Sensors ........................................................................................................................................................ 91112
0-500 psi Pressure Transducer ................................................................................................................................................... 91113
0-2500 psi Pressure Transducer ................................................................................................................................................. 91114
Exhaust Gas Temp. Thermocouples ............................................................................................................................................. 91109
General Purpose Thermocouples ................................................................................................................................................. 91110
TK-4 Thermocouple Converter Box.............................................................................................................................................. 91108
Thermocouple Extension Cables.................................................................................................................................................. 91111
Wheel/Shaft Speed Sensor .......................................................................................................................................................... 91116
Speed Sensor Magnets ............................................................................................................................................................... 91117
Analog Input Extension Harness .................................................................................................................................................. 91106
Desktop Wiring Harness .............................................................................................................................................................. 91107
Non-Contact Thermocouple......................................................................................................................................................... 91120
String Potentiometer ................................................................................................................................................................... 91123
Linear Potentiometer ................................................................................................................................................................... 91124
Fuel Flow Meter .......................................................................................................................................................................... 91125
Throttle Position Linear Potentiometer ......................................................................................................................................... 91127
QwikData Software & Documentation CD .................................................................................................................................... 91127
Sensor Calibration Values
Part No. Description
Part No. Description
91114
0-2500 PSIg Pressure
0
1
2500
5
See Calculator on CD-ROM
91137
-28.9-0 in/Hg Vacuum
-28.9
1
0
5
String Potentiometer 0-5”
0
1
5
5
36020
0-30 PSIa Pressure (Kavlico)
-15
.5
15
4.5
91124
Linear Potentiometer 0-5”
0
1
5
5
91122
Flow Meter -8 AN (Gas)
356
1
3563
10
91138
0-15 PSIg Pressure
0
1
15
5
91125
Flow Meter -10 AN (Gas)
457
1.5
4566
12.5
91112
0-100 PSIg Pressure
0
1
100
5
91126
Flow Meter -12 AN (Gas)
731
2
7306
20
91113
0-500 PSIg Pressure
0
1
500
5
91120
Thermocouple (Non Contact)
91115
Wheel/Shaft Speed
91123
Catalog #91001, 91003, 91004, 91005, 91007, 91009
Rev. 9/06 - RS/mc
32
1
662
5
Page 47 of 47
©2006 Edelbrock Corporation
Brochure #63-0282
Edelbrock Corporation • 2700 California Street • Torrance, CA 90503
EFI Tech Line: 800-416-8628, Option 3 • E-Mail: [email protected]