1
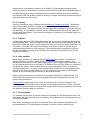
A Remote Automated Water Quality Stream Gauging System Design Aaron Hawdon, Rex Keen and Jamie Vleeshouwer CSIRO Land and Water Science Report 24/09 April 2009 CSIRO Land and Water Science Report series ISSN: 1834-6618 Copyright and Disclaimer © 2008 CSIRO To the extent permitted by law, all rights are reserved and no part of this publication covered by copyright may be reproduced or copied in any form or by any means except with the written permission of CSIRO. Important Disclaimer: CSIRO advises that the information contained in this publication comprises general statements based on scientific research. The reader is advised and needs to be aware that such information may be incomplete or unable to be used in any specific situation. No reliance or actions must therefore be made on that information without seeking prior expert professional, scientific and technical advice. To the extent permitted by law, CSIRO (including its employees and consultants) excludes all liability to any person for any consequences, including but not limited to all losses, damages, costs, expenses and any other compensation, arising directly or indirectly from using this publication (in part or in whole) and any information or material contained in it. Cover Photograph: Description: In-stream sensor cluster located at Scrubby Creek, a monitored sub catchment of the Burdekin River in North Queensland, Australia. This station is located on the Department of Defence Townsville Field Training Area. Photographer: Aaron Hawdon © 2008 CSIRO ACKNOWLEDGEMENTS The authors would like to acknowledge funding from Meat and Livestock Australia, the Department of Defence and the NQ Dry Tropics. We would also like to thank Peter Fitch for the original concept and system programming; David Fanning for the original infrastructure design and installation techniques and Joseph Kemei for his help with installation and maintenance. Lastly, we appreciate the reviewers, Paul Daniel and David Blondeau-Patissier for their constructive comments on this manuscript. A Remote Automated Water Quality Stream Gauging System Design iii EXECUTIVE SUMMARY The decline in the quality of water exported into the Great Barrier Reef (GBR) lagoon is of concern to government, natural resource managers, industry bodies and the community in general. Many of the rivers that flow into the GBR lagoon have seasonal flows driven by widespread rainfall events. Widespread flooding associated with large flows reduce or preclude access for the manual collection of water quality samples. Conversely the time required to access many locations of interest is greater than the duration of smaller flows. CSIRO Land and Water developed a reliable, fully automated system for the collection of water quality samples and data. Stations are controlled by a programmable data logger. The standard configuration enables measurement of water depth, water velocity and temperature, turbidity and rainfall. Each station has an auto sampler that can collect up to 24 one-litre samples. Telemetry is via the mobile network or satellite systems depending on location. The system uses event-based conditions to initiate measurements or sample collection. An event may be defined in many ways. Some examples are by time, a change in water depth, an amount of flow, rainfall, by the number of bottles remaining in the sampler or any other attribute being measured Data is automatically downloaded to a server on a daily schedule. The raw data runs through a number of Data Transformation Services (DTS) where it is ingested into relevant databases. A web report is automatically generated and messages are sent to staff mobile phones and email addresses if alert conditions are met. Thirteen systems have been reliably operating over a period of nine years with minimal maintenance requirements. The scalability and programmability of the standard design offers the capability to customise the system for any particular research requirement. A Remote Automated Water Quality Stream Gauging System Design iv CONTENTS 1. Introduction ......................................................................................................... 1 2. System overview ................................................................................................. 2 2.1. Electronic Components............................................................................................. 2 2.1.1. Data logger ............................................................................................................2 2.1.2. Depth.....................................................................................................................2 2.1.3. Turbidity.................................................................................................................2 2.1.4. Velocity..................................................................................................................3 2.1.5. Rainfall ..................................................................................................................3 2.1.6. Auto Sampler.........................................................................................................3 2.1.7. Power System .......................................................................................................3 2.1.8. Telemetry ..............................................................................................................4 2.1.9. Relays ...................................................................................................................4 2.2. Infrastructure............................................................................................................. 4 2.2.1. Platform Design .....................................................................................................4 2.2.2. Auto Sampler enclosure design.............................................................................5 2.2.3. Data Logger enclosure ..........................................................................................6 2.2.4. Solar Panel Mounting ............................................................................................6 2.2.5. Sensor Mount ........................................................................................................6 2.2.6. Rain gauge Stand..................................................................................................7 3. Installation ........................................................................................................... 7 3.1. In-stream................................................................................................................... 7 3.1.1. Soft substrate ........................................................................................................7 3.1.2. Hard substrate .......................................................................................................8 3.2. Mounting Instrumentation ......................................................................................... 8 3.3. Routing Cable ........................................................................................................... 9 3.4. Platform Assembly .................................................................................................. 11 3.4.1. Infrastructure installation .....................................................................................11 3.5. Rain gauge Stand ................................................................................................... 12 3.6. Power System......................................................................................................... 13 3.7. Electronics Enclosure and Wiring ........................................................................... 13 4. System Programming ....................................................................................... 14 4.1. Initialisation ............................................................................................................. 16 4.2. Non-Event mode ..................................................................................................... 16 4.3. Event modes ........................................................................................................... 16 4.4. Sample collection.................................................................................................... 16 4.4.1. Sample windows..................................................................................................17 4.4.2. Sample window buffers .......................................................................................17 4.4.3. Sample identification ...........................................................................................17 5. Data retrieval...................................................................................................... 18 5.1. Automatic downloading........................................................................................... 18 5.2. Data processing ...................................................................................................... 18 5.2.1. Importing data......................................................................................................18 5.2.2. Alert system.........................................................................................................18 5.2.3. Data retrieval .......................................................................................................18 5.2.4. Web Reports........................................................................................................18 6. Sample Retrieval ............................................................................................... 20 6.1. Collection ................................................................................................................ 20 6.2. Submission ............................................................................................................. 20 A Remote Automated Water Quality Stream Gauging System Design v 7. Conclusion......................................................................................................... 21 8. Appendices ........................................................................................................ 22 Appendix 1 – Modem Setup.............................................................................................. 22 Appendix 2 – Design plans ............................................................................................... 24 Appendix 3 - Wiring Diagram ............................................................................................ 35 Appendix 4 - Stream Gauge State Diagram ..................................................................... 36 References .................................................................................................................. 37 Reports.............................................................................................................................. 37 Technical Documents........................................................................................................ 38 A Remote Automated Water Quality Stream Gauging System Design vi 1. INTRODUCTION The Burdekin River has the second largest catchment (~130,000 km2) that drains into the Great Barrier Reef World Heritage Area (GBRWHA). Approximately 90% of the catchment is used for cattle production. It delivers almost 4 million tonnes of fine sediment into the GBRWHA (Furnas 2003) annually. This is the largest contribution of any catchment draining into the GBRWHA and equates to about 26% percent of the total fine sediment exported into the GBRWHA. Therefore, there is considerable interest in the ability to measure in-situ water quality and collect water quality samples during flow events. The average annual rainfall is variable ranging from below 400 mm in the western areas to over 2 m closer to the coast. Most of the annual precipitation occurs during a pronounced wet season, generally from November – April. Average annual temperatures range between 15 and 30 degrees Celsius. Streams are ephemeral in nature and generally flow only in response to rainfall. This means that stream flow is episodic and has a high temporal variability in frequency and duration. The duration of many flows can be measured in hours, making it difficult to collect manual water samples for all but the largest events. During these events access is restricted due to flooding and associated poor road conditions. It is therefore necessary to have robust, reliable systems that are able to collect water quality data and samples when these flow events occur. Between 2000 and 2007 CSIRO Land and Water designed, constructed and deployed a number of automated stream gauging stations within the Burdekin River catchment in North Queensland, Australia (Fanning et al 2003, Hawkins et al 2004). An additional five stations were designed and deployed in the Douglas Shire Council district (McJannet et al 2005). During and after this period there has been a refinement of both components and system operation that has culminated in the development of a reliable, standardised system for the collection of water quality samples and data that has also been successfully deployed in other tropical environments. The following report details the standard water quality monitoring system developed and implemented by CSIRO Land and Water. A Remote Automated Water Quality Stream Gauging System Design Page 1 2. SYSTEM OVERVIEW The three principal elements that comprise the standard stream gauging station are the electronics, infrastructure and the data-server. The electronic components are the measurement, control and communication devices located at the site of monitoring. Sensors and sampling hoses are installed in the stream channel. The system control and communication components are located on the stream bank above the high water mark. The infrastructure components provide protection and fixed mounting points for electronic components. A platform provides the basic structure which houses the components on the stream bank. A pier oriented mounting system is used for fixing the sensors in the stream channel. The data-server is located in a laboratory and is used to download and process data from the remote sites. 2.1. Electronic components 2.1.1. Data logger All systems are controlled using a CR10X data logger manufactured by Campbell Scientific. The logger uses 12VDC power, is fully programmable and has a number of analogue and digital I/O ports for measurement and control. Communications with the CR10x are possible through a DB9 serial I/O interface either by direct cable connection or via telemetry using a modem and interface. The loggers are supplied with support software that can be used for custom programming, real time viewing of station data and scheduled data collection through telemetry. Programming methodology is discussed later in section 4. 2.1.2. Depth A Greenspan Analytical PS7000 pressure transducer is mounted in-channel to measure water depth which is used to determine when a flow event is occurring. The pressure transducer is cased in stainless steel and is equipped with a 4-20 mA electrical output as standard. The output is measured using a differential channel on the CR10x. A cable length of 10 m is supplied as standard, although lengths of up to 100 m have been used for some installations. A closed venting system, incorporating a vent bag with inbuilt desiccant, compensates for changes in atmospheric pressure and prevents water ingress into the transducer through condensation. Standard ranges for this transducer are between 0 m to 2.5 m and 0 m to 100 m with a reported accuracy of 0.1 % full scale range. The PS7000 can be re-ranged in the field using an optional cable harness and software that allows direct connection via RS232. 2.1.3. Turbidity Turbidity is measured using an Analite NEP390 or NEP180 series sensor from McVan Instruments, depending on the level of turbidity required to be measured. Both sensors are housed in stainless steel, have a small form factor and operate using 12VDC power. The NEP390 series offers an SDI-12 digital interface which allows multiple addressed probes to be measured using a single logger port. The 390 series is available with a detachable cabling connector and an automatic wiper which can be used if bio-fouling is expected. The A Remote Automated Water Quality Stream Gauging System Design 2 probes can be customised to measure up to 3000NTU. In the standard gauging system design this probe is connected to a control port of the CR10x logger and assigned address 0. The NEP180 series is used in installations where turbidity readings greater than 3000NTU are expected. NEP180 probes provide an analogue (voltage) output that is measured using a differential channel on the logger. 2.1.4. Velocity Velocity is measured using a Unidata Starflow Ultrasonic Doppler Instrument. The Starflow also communicates via SDI12. Standard measurements include water depth, velocity and water temperature. The Starflow has an internal logger and is capable of computing flow rate and discharge. It is possible to measure velocity in either direction along an axis parallel to the long axis of the sensor. The sensor is connected to a control port on the data logger and assigned address 1. 2.1.5. Rainfall A Hydrological Services TB3 Tipping Bucket rain gauge is used for measuring rainfall at the stream gauging sites. The unit consists of a 200 mm collector funnel with stainless steel leaf filter and an integrated siphon control mechanism which can measure rainfall intensities up to 700 mm/hr. It includes dual output reed switches with varistor protection as well as dual rainfall discharge outlets for water drainage. The bucket tips when precipitation of 0.2 mm has been collected, activating a reed switch closure which is measured using the CR10x logger pulse channel. 2.1.6. Auto sampler Water quality samples are collected using an ISCO 3700 auto sampler. This device is weather resistant, runs from 12VDC power and can collect 24 one-litre samples. It is connected to a control port on the data logger which is used to trigger sample collection. The unit is powered directly from a 12V battery. A length of 10mm ID Pirtek Ortac non conductive sampling hose with a 2 mm screened aperture is connected between the unit and the instream mounting point. The pump in the sampler alone is sufficient for hose lengths smaller than 30 m with a pump heads below 5 m. At sites with high pump heads or hose lengths beyond 30 m a secondary pump mounted in the channel is used. When using a second pump, the sample line is purged to waste for a defined period. The ISCO waits until that amount of time has passed and collects a sample from the line. The pump is then switched off. A Shurflo 9300 submersible pump is used to push water up to the ISCO sampler. This diaphragm pump has corrosion proof housing and can operate with either 12VDC or 24VDC. A 24V power system is used in this system to provide optimal pumping efficiency and to keep the diameter of power cable to a minimum. 2.1.7. Power system For standard gauging sites, the power system is comprised of a 20 W solar panel and a 120 A/Hr sealed wet type lead acid deep cycle battery. An automatic solar regulator charges and maintains the battery. Sites with a secondary pump have an additional solar panel, regulator and battery of the same specifications. The two batteries are wired in series to create a 24VDC circuit. A Remote Automated Water Quality Stream Gauging System Design 3 2.1.8. Telemetry The telemetry system uses the mobile phone network where available. Where mobile phone coverage is not available, satellite based telemetry is employed. The CR10x data logger is capable of communication using circuit switched data at 9600 baud. A Campbell Scientific SC105 is required to interface between the modem and the data logger. The modems are powered through a relay that can be operated using a control port on the logger. Power is cycled once per day so that the modem is required to search for and reconnect to the network. Satellite modems are powered down until they are required for communication to save battery power. GSM GSM telemetry uses a Wavecom Fastrack modem. 3G The other type of mobile phone based communication uses a Maxon Modmax 6280 3G data modem. Satellite Satellite telemetry is provided by a NAL Research A3LA-D Iridium Satellite Modem. The configuration settings for each type of modem are detailed in Appendix 1 – Modem Setup. 2.1.9. Relays There are two types of relays used to control components of the auto station. An Omron G3R-ODX02SN (G3R) solid-state relay is used for controlling devices that draw less than 2 A, such as the modems. These can be operated using a 5 V output from a control port on the data logger. A dual relay setup is used to control the submersible pump. A G3R is controlled from the wiring panel of the data logger as it can be switched by 5 V. This relay is used to supply 12 V to a 12 V DPDT 10 A power relay which switches 24 V power to the pump. 2.2. Infrastructure There are two primary structural component groups within a standard gauging site, the platform located on the stream bank and the in-stream sensor mount. Design plans for all components are shown in Appendix 2 – Design plans. 2.2.1. Platform design The platform houses the solar panel array, power system and enclosures for the auto sampler and data logger. The platform allows enough room for at least one person to safely access all components. Initially stream gauge platforms were constructed in-situ. This was a labour, resource and time intensive process. This method also posed significant safety issues including but not limited to fire, electrocution and risks associated with working at heights. Two platform designs (Figure 1) were developed to allow this structure to be prefabricated and transported to the installation site. A Remote Automated Water Quality Stream Gauging System Design 4 (a) (b) Figure 1 Examples of small platform design (a) at Thornton Creek and large platform (b) at Keelbottom Creek both located on the Department of Defence Townsville Field Training Area. Small platform The first design (Figure 1a) is for use on high banks where flooding does not pose a risk to equipment. The platform is constructed from 50 mm galvanized square hollow section (SHS) with an expanded mesh floor. It measures 1.2 m wide, 1.8 m long and 1.55 m high. The feet are designed to be encased in concrete, bolted to pre-poured footings or pinned directly into the substrate. Large platform The second design (Figure 1b) is used in areas with the potential for inundation. The elevated stand is designed to withstand overbank flows. The design is similar to that used for flood monitoring by Hawdon et al (2007). The platform is approximately 1.5 m wide, 2.4 m long and 3.0 m high. The frame is constructed of 75 mm galvanised SHS and has an expanded mesh floor. The handrails are made from 25 mm galvanised SHS with two galvanised safety chains fitted across the platform entrance to prevent falling. The structure is fixed to four pre-poured concrete footings using 1 m high, reinforced modular base plates and chemset anchors. 2.2.2. Auto sampler enclosure design The auto sampler enclosure is constructed from 2 mm zinc anneal sheet. It provides a weather proof, ventilated housing for the sampler and the system power supply. It has a lockable door for security and a false wall at the back to allow the storage of excess hose and cable. The sampler enclosure also has a false floor at the height of the door return to allow the sampler to slide out of the enclosure. Without this floor the sampler would have to be lifted over the door return. When full, these units weigh around 30 kg and could cause a manual handling injury if lifting was required. There is a cut-out in one corner of the floor to allow hose and cabling to enter the box through a 50 mm gland. A Remote Automated Water Quality Stream Gauging System Design 5 Ventilation is provided with two weather resistant vents located on either side of the enclosure, these vents have insect proof screen mounted on the inner surface to prevent insects entering the enclosure. Tabs on the bottom edges allow the enclosure to be anchored onto the platform. 2.2.3. Data logger enclosure The logger enclosure is one of the B&R EC range which can be purchased at many electrical supply stores. These enclosures protect internal components against the ingress of dust and water. It has a removable backing plate to allow easy installation of equipment and a removable base plate for the installation of cable glands. The enclosure has four mounting points located on the back. Custom fabricated brackets are used to attach the enclosure to the solar panel mounting pole on both stand types. The size required is somewhat dependant on the telemetry system. For example GSM or 3G systems only require an EC3215 whereas a larger EC4315 enclosure is required to house the larger satellite modem. 2.2.4. Solar panel mounting The solar panel(s) are mounted on top of a pole that rises above all obstructions on the platform. The pole can be rotated to the required direction prior to attachment. A tab is welded to the top of the pole that has an aperture to allow the attachment of a solar panel bracket. All parts of the bracket are bolted together for easy assembly/disassembly. A bracket for a single solar panel can be constructed from a singe piece of 50 mm galvanised angle iron. One side is attached to the panel presenting the upright for attachment to the pole. This provides a pivot point to allow the angle of the panel to be set accordingly. A two panel bracket (Figure 2) is constructed from two lengths of galvanised steel flat bar that are attached across both ends of the short axis of the two panels, joining them together. Two lengths of galvanised angle are attached perpendicular to the flat bar with the vertical wall facing outwards. A single bracket mount is then attached to the centre of between these struts. Figure 2 An example of a two panel bracket. 2.2.5. Sensor mount The sensor mount provides a positive attachment point for the water quality instrumentation and the sample hose intake. It is generally located in the centre of the channel and therefore must be able to withstand the force applied by flowing water and debris build-up. All components are constructed from hot dip galvanised mild steel and are designed to be bolted together to form a clamp around a 125mm x 75mm rectangular hollow section (RHS) pier as shown in Figure 3. A Remote Automated Water Quality Stream Gauging System Design 6 The standard mount is comprised of three components, a forward facing mount for the velocity sensor, a rearward facing mount for the turbidity sensor and sample hose, and the mount for the depth transducer. A bolt-on housing for a shurflo 9300 submersible pump is shown in Figure 5. 2.2.6. Rain gauge stand The rain gauge is generally mounted on a stand that is located away from the platform in an open area free from obstructions. The stand is constructed from a 1.8 m length of 32 mm nominal bore (NB) galvanised pipe and 50 mm x 6 mm galvanised flat bar. The flat bar is welded into a ‘T-piece’ which is then welded onto the top of the pole. The whole structure is then hot dip galvanised. The plate has holes predrilled to allow the attachment to the base of the rain gauge. M8 x 60 mm 316 grade stainless steel bolts with levelling nuts are used to level and secure the rain gauge in place. 3. INSTALLATION 3.1. In-stream The in-stream sensor mount described above is designed to clamp around a pier fixed to the bed of the watercourse. Although every site has unique characteristics, there are two primary methods for the emplacement of this pier. This is largely dependant on the substrate material present at the installation site. Designs for both installations are shown in Appendix 2 – Design plans. 3.1.1. Soft substrate Many river and creek beds in the Burdekin catchment have deep sandy deposits. A doublepier system is used for this type of bed material. This method uses a second shorter pier located upstream of the main mounting pier, a clamp on brace assembly is used to provide support to the mounting pier. The connecting braces also deflect debris from building up around the instrument cluster. After selecting the location for the in-stream instrument cluster a small excavator or backhoe is used to excavate the footing for the piers. The footing size is determined by the size of the channel and expected loads on the cluster. For small channels (up to 15 m in width) a footing measuring approximately 1.5 m long, by 0.8 m wide and 1.5 m deep has been reliable. Lengths of steel pipe or reinforcing are inserted as far a practicable into the bottom and sides of the excavated hole to provide additional anchoring. The footing is filled with enough concrete to allow the two piers to be positioned. To ensure the piers maintain their orientation they are braced using light gauge angle iron welded on both sides below the finished concrete level. The short pier is positioned approximately 0.7 m upstream of the main pier. The footing is then filled with concrete to the bed surface and levelled. The components of the sensor mount can be attached to the main pier when the concrete has cured. A second set of clamps are used for bracing between the Starflow mount and the shorter pier. A Remote Automated Water Quality Stream Gauging System Design 7 Figure 3 Example of a soft substrate installation. 3.1.2. Hard substrate A shallow, hard substrate, such as bedrock, provides the best condition for pier installation. The presence of bedrock allows direct bolting using chemset anchors, providing a strong positive attachment for the instrument pier. Two brackets are fixed using chemset anchors bolted directly into the substrate and then braced. The bracket for the main pier is the same design as a foot clamp for a large platform. The brace clamp assembly from the soft substrate installation is also used placed flat and directly bolted to the rock. The bracing is then attached between the pier and the brace clamp assembly in the same configuration as per the soft substrate installation. The base of the pier and the brace clamp assembly are then encased with concrete to complete the installation. 3.2. Mounting instrumentation The Starflow and turbidity mounts are bolted around the main pier to form a single structure to which the instruments are attached. The forward facing velocity probe is attached to the Starflow mounting plate using the mounting clamp and 6 mm stainless steel bolts with nylon locking nuts supplied with the sensor. The cable is shrouded as shown in Figure 4 and routed around to the back of the mount. A Remote Automated Water Quality Stream Gauging System Design 8 (a) (b) Figure 4 Starflow velocity probe mount (a) and turbidity probe mount (b). The turbidity sensor is encased in 25 mm NB steel pipe integrated into the mounting assembly. A stainless steel grub screw is situated on the underside of the mount which is tightened to hold the sensor in place. The depth sensor mount is directly bolted and glued into the top of the concrete footing or substrate. It is located to one side of and slightly behind the main pier. The axis of the sensor is perpendicular to flow so that the cable end is protected by the sensor mount. The inlet for the sample hose is attached to the underside of the top plate of turbidity sensor mount (Figure 4b). A right angled brass joiner is used to run the hose down the clamp via the attachment guides. A pump housing (Figure 5) is also required for sites with a submersible pump. This component is attached using the bottom bolts joining the Starflow and turbidity mounts. 3.3. Routing cable All exposed cable must be protected against snagging by debris and abrasion from particles in the water. It is also desirable to have 0.5 m to 1 m of excess cable at the mount end to allow the sensors to be removed for maintenance and testing. To achieve this, all cables are covered by conduit, tightly fastened to the mount and routed through a B&R enclosure attached to the concrete base, directly behind the pier (Figure 5). The cables and hose from the mount can be run through a length of 50 mm corrugated conduit terminating with a 50 mm gland. The Starflow cable must be inserted first due to the large size of the interface plug. The required amount of excess cable can be left in this box. A Remote Automated Water Quality Stream Gauging System Design 9 Figure 5 B&R enclosure located to the rear of the pier to store excess cable. After the cables have passed into the box, they are run through 50 mm NB galvanised water pipe to the platform (Figure 6). Steel pipe is preferred as it provides excellent protection against the effect of large flows and floodwaters; it is impervious to trampling and gnawing by animals and provides good protection against fire. The pipe is shaped using a hydraulic pipe bender to conform to the surface of the ground. Lengths of pipe are joined together using barrel unions thus removing the need to rotate the pipes during joining. The pipes are attached to 50mm SHS piers with U-bolts to provide extra support. Installing the pipe on the surface greatly reduces the effort required for maintenance or to install new components by providing easy to access each length of pipe. It also reduces the ingress of soil and moisture into the cable housing which prolongs the life of the cables. The pipe terminates at the bottom of the auto sampler enclosure. A Remote Automated Water Quality Stream Gauging System Design 10 Figure 6 Pipe installation at Keelbottom Creek (left) and Scrubby Creek (right) both located on the Department of Defence Townsville Field Training Area. The pipe is attached to piers located on the downstream side and offers good protection against fire. 3.4. Platform assembly The platform houses the instrument enclosure, auto sampler enclosure and solar panel array. The integration of these components into a single structure allows the attachment points and mounting’s to be pre-fabricated with the platform allowing rapid assembly onsite. 3.4.1. Infrastructure installation Small platform The small platform it is placed into its final position, the location of each leg is marked and the platform is moved aside. Four 250 mm x 250 mm x 300 mm footings are excavated for the legs, the bases of the footings are levelled out to allow the stand sit flat when placed back into the holes. With the stand back in place the footings are backfilled with concrete and allowed to cure before continuing works on the platform. Approximately 300 mm of the leg is buried in concrete footings. Large platform The large platform requires a more robust footing system. The footings are excavated to a depth of 1000 mm using a mini loader fitted with a 600 mm auger. The footings are poured to the same height using a laser level and trowelled flat. After the footings have cured (approx 1 week) the stand can be installed. The large platform has removable feet that are used to attach the stand to the footings. The feet are bolted directly onto the legs in the stand through pre-drilled holes then the whole structure is lifted onto the footings. Once in position, anchor holes are drilled using a 16 mm concrete drill to a depth of 200 mm. The holes are cleared with compressed air prior to fixing. It is recommended that one leg of the stand is fixed at a time to prevent fouling of the holes from debris. Once the holes are drilled and cleaned they are 3/4 filled with Ramset “chemset” construction adhesive and the anchor studs inserted allowing enough protruding thread to attach a nut. Ramset M16 x 190 studs are used which are available in either galvanised (Part# CS16190GH) or 316 Grade stainless steel for high corrosion areas (Part# CS16190SS). A Remote Automated Water Quality Stream Gauging System Design 11 The studs can be tightened after the adhesive has cured. Loading time is approximately 12 hours at 25oC. Auto sampler enclosure Stainless steel bolts are threaded through the tabs on the base of the enclosure and passed through the expanded mesh on the platform. Backing plates are placed on the bolts below the mesh and the bolts are tightened to clamp the enclosure in place. Once in position a 50mm bulkhead fitting can be attached to the bottom of the enclosure to provide an entry point for the cables from the in stream instruments. The auto sampler is installed in the enclosure after the cabling and other works behind the false back panel have been completed as it impedes access to the panel after installation. The sample hose is routed through the 50mm access gland in the back panel return along with the trigger cable from the data logger. Sites with a submersible pump need an additional T-piece and bypass outlet to be installed behind the back panel to allow the bypass system to operate. The length of the cables and hose needs to be sufficient to allow the sampler to be removed from the enclosure for unloading samples and carrying out maintenance without the need to disconnect the sampler. Solar panel array In the case of the small platform the solar panel array is mounted on a separate mounting pole constructed from 32mm NB galvanised pipe. The pole is attached to the platform using two U-bolts bolted through pre-fabricated tabs in the stand frame and is concreted into place in a 200mm deep footing. The large platform design uses a solar panel mounting pole fabricated from 65mm SHS which slides telescopically into the 75mm SHS uprights making up the stand legs. The pole is then secured into place using M12 x 100mm galvanised bolts which pass through both the stand uprights and mounting pole. Electronics enclosure The data logger, telemetry system and other control components for the system are housed in a B&R Weatherproof enclosure which mounts directly above the auto sampler enclosure. On the small platform the solar panel pole provides the mounting point for the enclosure which is attached using backing plates and U-bolts. A separate pole is used to attach the enclosure to the large platform. A 1.5 m long piece of 32 mm NB pipe is attached to the platform handrails with U-bolts. The enclosure is attached to this pole in the same way as for the small platform. The electronics enclosure is located directly over the cavity behind the false back in the sampler enclosure. Once in position, a 50 mm gland is attached to the top of the auto sampler enclosure and 50 mm corrugated conduit is used to join the two components. 3.5. Rain gauge stand The rain gauge stand is installed in an area clear of obstructions which may influence rainfall collection. The stand is inserted into a 250 mm x 250 mm x 300 mm footing which is then filled with concrete. The stand should be levelled before the concrete sets. A trench is excavated between the rain gauge stand and the platform to run the cable. The cable should be buried in conduit to a depth of 200 mm to prevent damage. A Remote Automated Water Quality Stream Gauging System Design 12 A length of light 15 mm steel pipe is attached to the stand to protect the cables in the event of fire. Steel pipe is also used to run the cables up the platform leg for fire resistance. The pipe terminates below ground level where it is connected to the cable conduit. The cables at the platform are protected using 16 mm corrugated conduit which terminates at a gland in the bottom of the electronics enclosure. 3.6. Power system The power system consists of a solar panel array, deep cycle batteries and solar regulator. Cabling from the solar panel(s) is routed through 16 mm corrugated conduit down the solar panel mounting pole and into the sampler enclosure. For the 12 V system the cable is terminated at the solar regulator which is mounted on the inside of the sampler enclosure behind the false wall. A 50 mm gland installed in the return of the false back panel allows cable access to the batteries which are located in the front section of the sampler enclosure. A 24 VDC circuit is created by duplicating the 12 VDC system and connecting the two batteries in series using a common ground. All system components are wired directly to the battery terminals. Most solar regulators offer a 12 V power output however the switching noise generated by the operation of the regulator can lead to noise in analogue measurements. Direct connection to the battery prevents this noise and ensures that power is available to all components even in the event of a regulator failure. 3.7. Electronics enclosure and wiring All electronic components housed within the enclosure are attached to the removal backing plate. Components are positioned to allow easy access and adequate air flow. Relays, fuses and terminal blocks are attached to the backing plate using DIN rail. The closed venting system for the pressure transducer is also mounted in this way. Cabling is routed to the box through a 50 mm gland that is connected to the auto sampler housing. The gland is sealed using a mastic compound to remove any entry points for insects. The cables are then routed through trunking to their final destination. A wiring diagram is shown in Appendix 3 - Wiring Diagram. The antenna cable for the modem is not routed through the auto sampler enclosure and therefore enters the logger enclosure through a separate 16 mm gland. A Remote Automated Water Quality Stream Gauging System Design 13 Figure 7 Example of logger enclosure setup from Myuna station. Silica gel desiccant and camphor based insect deterrent is placed on the floor of the enclosure. 4. SYSTEM PROGRAMMING The two primary objectives of the system are: to collect stream data and to collect water samples. The program measures water depth every program cycle (60 seconds). If the depth is below a threshold, then data from all sensors, including rainfall are logged every hour. If the depth is greater than the threshold, data is logged every program cycle. The program uses water depth, time or a sample counter to determine whether to collect a sample. A simplified flow chart of the standard system program is shown in Figure 8. A Remote Automated Water Quality Stream Gauging System Design 14 Figure 8 Flow chart of monitoring station program. The program actually uses transitions between three primary states (Appendix 4 - Stream Gauge State Diagram) to determine program flow. These are Initialisation, Non-Event and Event. A Remote Automated Water Quality Stream Gauging System Design 15 4.1. Initialisation On initialisation, the program loads the variables used to control operation at that site. This state occurs if the system has lost power or when a new program is uploaded to the logger. Each site is assigned a unique site number based by region/project. For example all identification numbers for stations located in the Mingela region begin from 3000, those on Hervey’s Range from 5000. The four sites at Mingela therefore are assigned 3001, 3002, 3003 and 3004. This not only provides an easy way to recognise related sites but forms the basis for the assignment of water sample identification numbers discussed later in section 4.4.3. 4.2. Non-event mode In this mode, the program tests the event threshold every cycle. Data is logged hourly for diagnostic purposes and to provide a rainfall record. If the program has transitioned from event mode to this mode, the sampling window is also reset. 4.3. Event modes If the water depth (or any other variable) crosses a predefined threshold, the event state is initiated, an event counter is incremented, stream data is logged with a higher temporal resolution and samples are collected (Figure 9). Figure 9 An example hydrograph showing the operation of the sample collection procedure during a flow event in the Bowen River near Collinsville, Australia. Note the increased temporal resolution of data logging after depth rises above the 300mm event threshold. 4.4. Sample collection In event mode, there are three conditions that will trigger a sample to be collected: State 3: Event (Rising). This condition is met when the water depth is rising. If the current depth exceeds the top of the current sample window interval, a sample is collected and the sample window is moved upwards. State 4: Event (Timed sample). This condition is met if there has been no change in the sample window for the specified period of time. A sample is collected but the windows remains in its current position. State 5: Event (Falling). This condition is met when the water depth is falling. If the current depth is lower than the bottom of the current sample window, a sample is collected and the window is moved downwards. Before a sample is collected, the program checks if there are any bottles left in the auto sampler via means of a counter. If the number of bottles remaining is greater than zero, the program will commence the sampling routine. A Remote Automated Water Quality Stream Gauging System Design 16 If a pump is installed at the site, the pump is turned on for a preset period of time prior to sample collection to purge the sample hose. This ensures that fresh water will be collected by the auto sampler. When a sample is required to be collected, the program, pulses the auto sampler, the sample number and bottle number counters are incremented, the bottles remaining counter is decremented and data is logged. The position of the current sampling window is tested and adjusted as required. 4.4.1. Sample windows Sample windows are created by dividing the distance between the river bed and full bank height into equal intervals. A sample is collected when a trigger value falls outside of the range of the current window and the window is adjusted to the next range up or down. For example, if the rising stage sample window is set to 200 mm, then a sample is collected at 200 mm water depth, then the upper limit of the window is moved to 400 mm, then 600 mm etc. The previous upper limit will become the falling stage sample limit if both window sizes are the same. It is possible to set different windows for rising and falling stage sampling. The number of bottles remaining in the auto sampler is used to optimise sampling along the tail of the event hydrograph. If the number of bottles remaining is insufficient to sample the entire falling stage, the program will alter the sample window size accordingly. 4.4.2. Sample window buffers If the water level fluctuates slightly above and below a sample window or event threshold the program would collect a number of samples over a short period of time. If a time constraint is added to the sampling code, a sharp rise in water level would not initiate sampling. To address this, a buffer is added to each window (usually 50% of window size). The water level must cross either above or below this buffer before a new sample window can be initiated. 4.4.3. Sample identification When a sample is collected, the logger will record a timestamp, the sample bottle position, the sample number and the event number. The sample identification number (SampleID) is unique for any given season. It is assigned by combining the site identification number and the sample number at each site. For example, if site 4001 has collected 35 samples, the next SampleID will be 41036. This system allows up to 1000 samples to be collected from any site in one season. The SampleID counter is reset at the end of the financial year. A Remote Automated Water Quality Stream Gauging System Design 17 5. DATA RETRIEVAL 5.1. Automatic downloading Data is automatically downloaded from a gauging site using a dedicated dial-up server running LoggerNet software. This software provides download scheduling, data collection and data storage from Campbell Scientific loggers. 5.2. Data processing 5.2.1. Importing data Downloaded data files are processed using Microsoft SQL Server 2000 DTS. This process separates the raw data into the data arrays defined in the programs FSL file and inserts them into the relevant tables in a database. The file is then appended to an archive file that is stored on a secure server. 5.2.2. Alert system Another DTS queries all specified databases to determine if alarm conditions have been met. It is possible to specify any criteria to trigger an alarm condition. For the stream gauge this is usually defined by a water depth value above the event threshold or if a sample has been collected. Once an alarm condition is met, the service is configured to send an email to a specified address and / or an SMS to a specified number. 5.2.3. Data retrieval All data that is uploaded into a database can be viewed and downloaded via web page interfaces. This process is limited to authorised users only. 5.2.4. Web reports The most recent data from each station is presented on the World Wide Web (Figure 10). This is a useful tool for site management. It can be used to identify what local conditions are like, how many samples have been collected and when maintenance may be required. Local landholders are particularly interested in the rainfall records. A Remote Automated Water Quality Stream Gauging System Design 18 Figure 10 Example of a Data Report page. A Remote Automated Water Quality Stream Gauging System Design 19 6. SAMPLE RETRIEVAL 6.1. Collection When sample bottles are retrieved from a station, a pre-printed, waterproof label is attached to the bottle. This labelling system uses Avery L7060 heavy duty labels although any label that is waterproof and laser printable will suffice. The labels contain the site name, sample identification number and the year. When a sample bottle is removed from the auto sampler, the next label in the series is attached. If there is no sample in the bottle, a label is attached to show that sample collection was attempted. If the numbers on the labels do not match the numbers on the data staff can immediately investigate the cause of the error. When all samples have been collected from the auto sampler, it is restarted and the reset switch on the logger is depressed. The program then logs the time the switch is pressed and resets the bottle remaining counter to 24. A manual record detailing the date of retrieval and any other comments is completed at this time. 6.2. Submission On return to the laboratory, the data for each sample is queried from the database server to construct a sample submission sheet. This sheet includes the time and collection of the sample, the water quality parameters at the time of collection and the event number. This information is used to determine the number of samples to analyse and what analyses may be appropriate. A Remote Automated Water Quality Stream Gauging System Design 20 7. CONCLUSION All installations continue to provide the most detailed water quality data of any stream monitoring sites in the Burdekin catchment. The ability to collect water quality data and samples over entire hydrographs has facilitated improved estimations of contaminant loads exported from waterways and with a quantifiable level of uncertainty (Bartley et al 2007, Post et al 2006 and Brodie et al 2005). This has also provided a platform to calibrate and validate a variety of catchment models such as Sednet, Lisem and Annex. The standardisation of stream gauge design has provided significant improvements over original ad-hoc installations. These include: The ability to prefabricate components, transport them to the installation site and bolt them together. This reduces installation time and creates a lower risk to staff safety. Standardised components and component wiring across all sites means that one set literature is applicable for all sites. Staff training is reduced as they are only required to become familiar with one system (eg if a site has a specific sensor, it will always be connected to the same port on a logger). Standardised program for all systems allows all systems operate in the same way and with only a few variables need to be edited for system setup. The sample procedure is more capable of collecting samples over an entire hydrograph through the use of dynamic window resizing. It is also less affected by fluctuations around event thresholds. Sample tracking is much improved with the use of site specific identifiers for samples the introduction of detailed event logging (eg event counters, reset switch logging). It is possible to further enhance these systems with the addition of additional or upgraded components. This would require some deviation from the standard system both physically and programmatically. Examples of system enhancements include: a refrigerated auto sampler and associated power system improved velocity probes (such as Sontek Argonaught SW) a digital camera an event-based dial out alert from stations. The CR10x logger on which this system is based has been superseded by the CR1000 which has a different operating system and programming language. The system will operate with these loggers although existing program code would need to be rewritten. A Remote Automated Water Quality Stream Gauging System Design 21 8. APPENDICES Appendix 1 – Modem Setup Wavecom Fastrack GSM modem 1. Enter the settings AT+IPR=9600 E0 Q1 S0=2 <ENTER> 2. Save the configuration AT&W <ENTER> ModMax 3G Data Modem 1. Set auto soft reset to a scheduled interval (1440 = Daily) AT$$RESET=1440 2. Check reset value AT$$RESET? 3. Set CSD Service Type AT+CBST= (speed, data circuit type, transfer type) AT+CBST=7,0,1 4. Turn Circuit 109 on for CSD Service AT&C1 5. Set Modem to Auto Answer after 2 seconds ATS0=2 6. Set Baud Rate AT+IPR=9600 7. Set modem to suppress result codes ATQ1 8. Turn Echo 0ff ATE0 9. Save Configuration Changes to user profile 1 AT&W1 10. Set Profile 1 as the default user profile (loaded automatically after power outage or reset) AT&F1 A Remote Automated Water Quality Stream Gauging System Design 22 11. Check all codes are entered correctly (Should be exactly the same as the codes below if using Telsra) AT&V &C: 1; a&D: 2; &F: 1; &W: 1; E: 0; L: 0; M: 0; Q: 1; V: 1; X: 0; Z: 0; S0: 2; S3: 13; S4: 10; S5: 8; S6: 2; S7: 50; S8: 2; S9: 6; S10: 14; S11: 95; +FCLASS: 0; +ICF: 3,3; +IFC: 2,2; +IPR: 9600; +DR: 0; +DS: 0,0,2048,6; +WS46: 12; +CBST: 7,0,1; +CRLP: (61,61,48,6,0),(61,61,48,6,1),(240,240,52,6,2); +CV120: 1,1,1,0,0,0; +CHSN: 0,0,0,0; +CSSN: 0,0; +CREG: 0; +CGREG: 0; +CFUN:; +CSCS: "IRA"; +CSTA: 129; +CR: 0; +CRC: 0; +CMEE: 2; +CGDCONT: (1,"IP"," ","",0,0),(2,"IP","telstra.internet","",0,0),(3,"IP","telstra.pcpack","",0,0),(4 ,"IP","telstra.datapack","",0,0) ; +CGDSCONT: ; +CGTFT: ; +CGEQREQ: ; +CGEQMIN: ; +CGQREQ: ; +CGQMIN: ; +CGEREP: 0,0; +CGDATA: "PPP"; +CGCLASS: "B"; +CGSMS: 1; +CSMS: 0; +CMGF: 1; +CSCA: "",; +CSMP: ,,0,0; +CSDH: 0; +CSCB: 0,"",""; +FDD: 0; +FAR: 0; +FCL: 0; +FIT: 0,0; +ES: ,,; +ESA: 0,,,,0,0,255,; +CMOD: 0; +CVHU: 1; +CPIN: , ; +CMEC: 0,0,0; +CKPD: 1,1; +CGATT: 1; +CGACT: 0; +CPBS: "SM"; +CPMS: "ME","ME","ME"; +CNMI: 2,1,0,0,0; +CMMS: 0; +FTS: 0; +FRS: 0; +FTH: 3; +FRH: 3; +FTM: 96; +FRM: 96; +CCUG: 0,0,0; +COPS: 0,0,""; +CUSD: 0; +CAOC: 1; +CCWA: 0; +CPOL: 0,2,"",0,0,0; +CPLS: 0; +CTZR: 0; +CTZU: 0; +CLIP: 0; +COLP: 0; +CDIP: 0 Iridium Satellite Modem 1. Enter the following AT Commands in sequence a. AT&F (Restores your factory default settings) – You will get a response of OK b. AT+IPR=5 (Sets the baud rate to 9600) – You will get a response of OK c. ATS0=1 (Tells the modem to answer after 1 ring) – You will get a response of OK d. ATE0 (Turns off ECHO) – You will get a response of OK, Note you will not be able to see what you are typing from now on. e. ATQ1 (Turns off Response codes) – You will get no response because you just turned response codes off! f. AT&W (Saves your configuration) – No response 2. You can now check your registers by typing AT&V please make sure your registers read what you just entered and that the registers also read the same under the PROFILE 0 heading eg… E: 0 Q: 1 S0: 1 3. You should now be connected to the Iridium Network, this can be confirmed by typing: AT+CREG If you get a response of 000,001 the satellite modem is connected to the Iridium network A Remote Automated Water Quality Stream Gauging System Design 23 Appendix 2 – Design plans A Remote Automated Water Quality Stream Gauging System Design 24 A Remote Automated Water Quality Stream Gauging System Design 25 A Remote Automated Water Quality Stream Gauging System Design 26 A Remote Automated Water Quality Stream Gauging System Design 27 A Remote Automated Water Quality Stream Gauging System Design 28 A Remote Automated Water Quality Stream Gauging System Design 29 A Remote Automated Water Quality Stream Gauging System Design 30 A Remote Automated Water Quality Stream Gauging System Design 31 A Remote Automated Water Quality Stream Gauging System Design 32 A Remote Automated Water Quality Stream Gauging System Design 33 A Remote Automated Water Quality Stream Gauging System Design 34 Appendix 3 - Wiring Diagram A Remote Automated Water Quality Stream Gauging System Design 35 Appendix 4 - Stream Gauge State Diagram A Remote Automated Water Quality Stream Gauging System Design 36 9. REFERENCES Reports Bartley, R., Hawdon, A. and Keen, R. (2007). Sediment and nutrient loads at the Myuna Gauge in the Bowen Catchment (2006/2007). CSIRO Client report to ACTFR and the Burdekin Dry Tropics Board August 2007. Brodie, J., Duncan, I., Bainbridge, Z., Post, D. and Furnas, M. (2005). Burdekin region Water Quality Monitoring January 2005 Event. Interim Report to the Burdekin Dry Tropics Board – July 2005. Fanning, D., Fitch, P. and Post, D. (2003). Methods for monitoring ephemeral streams, Appendix 2. In: Roth CH, Prosser IP, Post DA, Gross JE, Webb MJ, Eds. Reducing sediment export from the Burdekin Catchment: volume II Appendices. Meat and livestock Australia project number NAP3.224. Report for MLA. Canberra: CSIRO Land and Water and CSIRO Sustainable Ecosystems. pp 8–18. Furnas, MJ (2003) Catchments and Corals: Terrestrial Runoff to the Great Barrier Reef. Australian Institute of Marine Science and CRC Reef Research Centre. 334 p. Hawdon, A.A., Keen, R.K., Kemei, J.K., Vleeshouwer, J.M. and Wallace, J.S. (2007). Design and Application of Automated Flood Monitoring Systems in the Wet Tropics. CSIRO Land and Water Science Report 49/07; 27pp. Hawkins, L., Corfield, J., Cullen, K., Dowe, J., Hawdon, A., Loong, D., Nelson, B., and Post, D. (2004). Improving water quality through on-ground land management changes in the Bowen-Broken River catchment: A framework for action Greening Australia .Client Report to the Burdekin Dry Tropics Board November 2004. McJannet, D., Fitch, P., Henderson, B., Harch, B., and Bartley, R. (2005). Douglas Shire water quality monitoring strategy - final report. A report to Douglas Shire Council and the Department of the Environment and Heritage.CSIRO Land and Water Client Report. Atherton, Queensland: CSIRO. Post, D., Bartley, R., Corfield, J., Nelson, B., Kinsey-Henderson, A., Hawdon, A., Gordon, I., Abbot, B., Berthelsen, S., Hodgen, M., Keen, R., Kemei, J., Vleeshouwer, J., MacLeod, N., and Webb, M. (2006). Sustainable grazing for a healthy Burdekin Catchment.CSIRO Land and Water Science Report 62/06. Canberra: Meat and Livestock Australia Ltd. A Remote Automated Water Quality Stream Gauging System Design 37 Technical Documents CR10x manual http://www.campbellsci.com.au/documents/manuals/cr10x.pdf PS7000 specification sheet http://www.cleanairsystems.com.au/__data/page/11833/PS7000_Sensor.pdf McVan NEP390/395 http://www.mcvan.com/images/stories/acrobat/nep390.pdf McVan NEP180 http://www.mcvan.com/images/stories/acrobat/nep190.pdf Starflow Ultrasonic Doppler http://www.unidata.com.au/products/Starflow/6526/#specs ISCO 3700 Water sampler http://www.johnmorris.com.au/ssl/store/zcust_displayproduct.asp?id=79740 Shurflo submersible pump http://www.shurflo.com/pages/new_industrial/industrial/agriculture/subcategories/9300.html Wavecom GSM modem http://www.intercel.com.au/pdfs/wavecom_hard_options_fastrack_m1306b.pdf Modmax 3G modem http://www.maxon.com.au/udocuments/MM-62880IND-HW_SPEC.pdf Iridium satellite modem http://www.nalresearch.com/Info/Product%20Information%20Model%20A3LA-D.pdf Relays http://docs-asia.electrocomponents.com/webdocs/002b/0900766b8002b88e.pdf LoggerNet http://www.campbellsci.com.au/documents/manuals/loggernet.pdf A Remote Automated Water Quality Stream Gauging System Design 38 A Remote Automated Water Quality Stream Gauging System Design 39