1
IAR C-SPY® Hardware
Debugger Systems
User Guide
for Renesas
E8/E8a and E10A-USB Emulators
CSE8E10-2
COPYRIGHT NOTICE
© Copyright 1996–2008 IAR Systems AB.
No part of this document may be reproduced without the prior written consent of IAR
Systems AB. The software described in this document is furnished under a license and
may only be used or copied in accordance with the terms of such a license.
DISCLAIMER
The information in this document is subject to change without notice and does not
represent a commitment on any part of IAR Systems. While the information contained
herein is assumed to be accurate, IAR Systems assumes no responsibility for any errors
or omissions.
In no event shall IAR Systems, its employees, its contractors, or the authors of this
document be liable for special, direct, indirect, or consequential damage, losses, costs,
charges, claims, demands, claim for lost profits, fees, or expenses of any nature or kind.
TRADEMARKS
IAR Systems, IAR Embedded Workbench, C-SPY, visualSTATE, From Idea To Target,
IAR KickStart Kit, IAR PowerPac, IAR YellowSuite, IAR Advanced Development Kit,
IAR, and the IAR Systems logotype are trademarks or registered trademarks owned by
IAR Systems AB. J-Link is a trademark licensed to IAR Systems AB.
Microsoft and Windows are registered trademarks of Microsoft Corporation.
Renesas is a registered trademark of Renesas Technology Corp.
Adobe and Acrobat Reader are registered trademarks of Adobe Systems Incorporated.
CodeWright is a registered trademark of Starbase Corporation.
All other product names are trademarks or registered trademarks of their respective
owners.
EDITION NOTICE
Second edition: November 2008
Part number: CSE8E10-2
This guide applies to IAR Embedded Workbench® for Renesas.
CSE8E10-2
Contents
Tables
........................................................................................................................ v
Figures
.................................................................................................................... vii
Preface
..................................................................................................................... ix
Who should read this guide ................................................................ ix
How to use this guide ............................................................................ ix
What this guide contains ....................................................................... x
Other documentation ............................................................................. x
Document conventions .......................................................................... x
Typographic conventions ..................................................................... x
Naming conventions ........................................................................... xi
Introduction to C-SPY® hardware debugger systems
................... 1
The C-SPY emulator drivers ............................................................... 1
Differences between the C-SPY drivers ............................................. 1
Installing the C-SPY emulator drivers ............................................ 2
Programming the E10A-USB firmware ......................................... 3
Connecting to the target board, E8/E8a ........................................ 4
Maintaining the connection to the hardware ........................................ 8
Connecting to the target board, E10A-USB ................................. 9
Getting started ........................................................................................ 11
Running the demo program ................................................................ 12
Hardware-specific debugging
.................................................................... 15
Debugger options for debugging using hardware systems ... 15
The Setup page ................................................................................... 16
The Download page ........................................................................... 16
The Extra Options page ...................................................................... 17
Target-dependent settings ................................................................. 17
The Emulator menu ............................................................................ 17
Using breakpoints ................................................................................... 18
Available breakpoints ........................................................................ 19
iii
CSE8E10-2
Code breakpoints ................................................................................ 20
The Execution Address Breakpoint dialog box ................................. 20
The Software breakpoint dialog box .................................................. 21
The Break Condition dialog box ........................................................ 22
The Breakpoint Usage dialog box ...................................................... 23
C-SPY use of breakpoints .................................................................. 24
Resolving problems ................................................................................ 24
Write failure during load .................................................................... 24
No contact with the target hardware .................................................. 25
Index
IAR C-SPY® Hardware Debugger Systems
iv
User Guide
CSE8E10-2
....................................................................................................................... 31
Tables
1: Typographic conventions used in this guide ........................................................... x
2: Naming conventions used in this guide ................................................................. xi
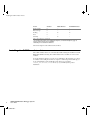
3: Driver differences .................................................................................................... 1
4: The E8/E8a emulator mode options ........................................................................ 5
5: The E10A-USB emulator mode options ................................................................. 9
6: Commands on the E8a Emulator menu ................................................................. 18
7: Available breakpoints for the E8/E8a Emulator ................................................... 19
8: Available breakpoints for the E10A-USB Emulator ............................................. 19
9: Execution address breakpoint conditions .............................................................. 21
10: Software breakpoint conditions ........................................................................... 22
v
CSE8E10-2
IAR C-SPY® Hardware Debugger Systems
vi
User Guide
CSE8E10-2
Figures
1: Emulator communication overview ........................................................................ 3
2: The Emulator Setting dialog box for the E8a emulator .......................................... 5
3: The Firmware Location page for the E8/E8a emulator ........................................... 7
4: The Connecting dialog box ..................................................................................... 7
5: The Power Supply dialog box for the E8/E8a emulator ......................................... 8
6: The ID Code verification dialog box for the E8/E8a emulator ............................... 8
7: The Select Emulator mode dialog box for the E10A-USB emulator ...................... 9
8: The Connecting dialog box ................................................................................... 10
9: The Power Supply dialog box for the E10A-USB emulator ................................. 10
10: The System Clock dialog box for the E10A-USB emulator ............................... 11
11: The ID Code dialog box for the E10A-USB emulator ........................................ 11
12: Example application ............................................................................................ 12
13: The C-SPY Download options ............................................................................ 16
14: The Extra Options page for C-SPY command line options ................................ 17
15: The E8a Emulator menu ...................................................................................... 17
16: The Execution Address Breakpoint dialog box .................................................. 20
17: The Software Breakpoint dialog box .................................................................. 21
18: The Break Condition dialog box ......................................................................... 23
19: The Breakpoint Usage dialog box ....................................................................... 23
vii
CSE8E10-2
IAR C-SPY® Hardware Debugger Systems
viii
User Guide
CSE8E10-2
Preface
Welcome to the IAR C-SPY® Hardware Debugger Systems User Guide for Renesas
E8/E8a and E10A-USB Emulators. The purpose of this guide is to provide you
with detailed reference information that can help you use the features in the
IAR C-SPY® Hardware Debugger Systems.
Who should read this guide
You should read this guide if you want to get the most out of the features in the C-SPY
hardware debugger systems. In addition, you should have working knowledge of:
●
The C or C++ programming language
●
Application development for embedded systems
●
The architecture and instruction set of the Renesas microcontroller (refer to the chip
manufacturer's documentation)
●
The operating system of your host machine.
This guide also assumes that you already have working knowledge of the target system
you are using, as well as some working knowledge of the IAR C-SPY Debugger. For a
quick introduction to the IAR C-SPY Debugger, see the tutorials available in the IAR
Embedded Workbench® IDE User Guide.
How to use this guide
This guide describes the C-SPY interface to the target system you are using; this guide
does not describe the general features available in the IAR C-SPY debugger or the
hardware target system. To take full advantage of the whole debugger system, you must
read this guide in combination with:
●
The IAR Embedded Workbench® IDE User Guide which describes the general
features available in the C-SPY debugger
●
The documentation supplied with the target system you are using.
Note that additional features might have been added to the software after the IAR
C-SPY® Hardware Debugger Systems User Guide was printed. The file readme.htm
contains the latest information. You can find the file via the Help menu in the IDE.
ix
CSE8E10-2
What this guide contains
What this guide contains
Below is a brief outline and summary of the chapters in this guide.
●
Introduction to C-SPY® hardware debugger systems introduces you to the
available C-SPY drivers to be used for the target board. The chapter briefly shows
the difference in functionality provided by the different C-SPY drivers.
●
Hardware-specific debugging describes the additional options, menus, and
features provided by these debugger systems.
Other documentation
The complete set of IAR development tools for the target processor are described in a
series of guides. These guides can be found in the install_dir\doc directory or
reached from the Help menu.
All of these guides are delivered in hypertext PDF or HTML format on the installation
media. Some of them are also delivered as printed books.
Recommended web sites:
●
The Renesas web site, www.renesas.com, contains information and news about the
target processors.
●
The IAR Systems web site, www.iar.com, holds application notes and other
product information.
Document conventions
When, in this text, we refer to the programming language C, the text also applies to C++,
unless otherwise stated.
When referring to a directory in your product installation, for example
install_dir\doc, the full path to the location is assumed, for example c:\Program
Files\IAR Systems\Embedded Workbench 5.n\install_dir\doc.
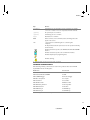
TYPOGRAPHIC CONVENTIONS
This guide uses the following typographic conventions:
Style
Used for
computer
• Source code examples and file paths.
• Text on the command line.
• Binary, hexadecimal, and octal numbers.
Table 1: Typographic conventions used in this guide
IAR C-SPY® Hardware Debugger Systems
x
User Guide
CSE8E10-2
Preface
Style
Used for
parameter
A placeholder for an actual value used as a parameter, for example
filename.h where filename represents the name of the file.
[option]
An optional part of a command.
{option}
A mandatory part of a command.
a|b|c
Alternatives in a command.
bold
Names of menus, menu commands, buttons, and dialog boxes that
appear on the screen.
italic
• A cross-reference within this guide or to another guide.
• Emphasis.
…
An ellipsis indicates that the previous item can be repeated an arbitrary
number of times.
Identifies instructions specific to the IAR Embedded Workbench® IDE
interface.
Identifies instructions specific to the command line interface.
Identifies helpful tips and programming hints.
Identifies warnings.
Table 1: Typographic conventions used in this guide (Continued)
NAMING CONVENTIONS
The following naming conventions are used for the products and tools from IAR
Systems® referred to in this guide:
Brand name
Generic term
IAR Embedded Workbench®
IAR Embedded Workbench®
IAR Embedded Workbench® IDE
the IDE
IAR C-SPY® Debugger
C-SPY, the debugger
IAR C/C++ Compiler™
the compiler
IAR Assembler™
the assembler
IAR XLINK™ Linker
XLINK, the linker
IAR XAR Library builder™
the library builder
IAR XLIB Librarian™
the librarian
IAR DLIB Library™
the DLIB library
IAR CLIB Library™
the CLIB library
Table 2: Naming conventions used in this guide
xi
CSE8E10-2
Document conventions
IAR C-SPY® Hardware Debugger Systems
xii
User Guide
CSE8E10-2
Introduction to C-SPY®
hardware debugger
systems
This chapter introduces you to the C-SPY drivers and to how they differ from
the C-SPY Simulator.
The C-SPY emulator drivers
C-SPY consists of both a general part which provides a basic set of C-SPY features, and
a driver. The C-SPY driver is the part that provides communication with and control of
the target system. The driver also provides a user interface—special menus, windows,
and dialog boxes—to the functions provided by the target system, for instance special
breakpoints. This driver is automatically installed during the installation of IAR
Embedded Workbench.
This guide describes the operation of the IAR C-SPY drivers for the following Renesas
hardware debugger systems:
●
E8/E8a Emulator
●
E10A-USB Emulator.
For further details about the concepts that are related to C-SPY, see information about
the general debugger features, see the IAR Embedded Workbench® IDE User Guide.
DIFFERENCES BETWEEN THE C-SPY DRIVERS
This table summarizes the key differences between the C-SPY drivers:
Feature
Simulator
E8/E8a Emulator
E10A-USB Emulator
Code breakpoints
x
x1
x1
Data breakpoints
x
--
x
Execution in real time
--
x
x
Zero memory footprint
x
--
x
Simulated interrupts
x
--
--
Real interrupts
--
x
x
Cycle counter
x
--
--
Table 3: Driver differences
1
CSE8E10-2
Installing the C-SPY emulator drivers
Feature
Simulator
E8/E8a Emulator
E10A-USB Emulator
Code coverage
x
--
--
Data coverage
x
--
--
2
Profiling
x
x
Trace
x
--
Start/Stop
--
x
3
x2
---
Table 3: Driver differences (Continued)
1 For detailed information about available breakpoints, see Available breakpoints, page 19.
2 Cycle counter statistics are not available.
3 Start/Stop is not available for all drivers.
General descriptions of the different drivers follow.
Installing the C-SPY emulator drivers
The C-SPY emulator drivers are automatically installed during the installation of IAR
Embedded Workbench. Using the C-SPY emulator driver, C-SPY can connect to the
emulator.
To use the hardware debugger, you also need a USB driver. The first time you connect
an emulator to the USB port on the host computer, a USB setup wizard will help you
locate and install the required USB driver. The driver is located in the
install_dir\drivers\renesas directory of your IAR Systems product
installation.
IAR C-SPY® Hardware Debugger Systems
2
User Guide
CSE8E10-2
Introduction to C-SPY® hardware debugger systems
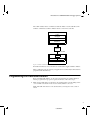
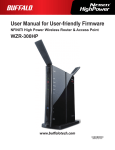
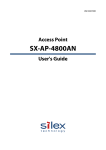
The C-SPY emulator driver communicates with the emulator via the USB driver. The
emulator communicates with the emulator interface on the microcontroller.
Host computer
C-SPY
Debugger
C-SPY emulator driver
USB driver
USB connection
Emulator
Flat cable
CPU
FLASH
RAM
Target board
Figure 1: Emulator communication overview
For further information, refer to the Renesas documentation supplied with the emulator.
When a debugging session is started, your application is automatically downloaded and
programmed into flash memory.
Programming the E10A-USB firmware
Before an E10A-USB emulator can be used for the first time, the emulator firmware
must be programmed. To program or update the firmware, follow these steps:
1 Make sure the USB cable is not attached to the emulator. Then open the sliding switch
cover and make sure that the mode selection switch (number 1) is set to 1.
Note: The USB cable must never be attached when you change the mode selection
switch.
3
CSE8E10-2
Connecting to the target board, E8/E8a
2 Attach the USB cable and connect the E10A-USB emulator to your host computer, and
start the setup program found at \install_dir\external\OCD\Platform\
E10A-USB\cpu_family\cpu_name\SetupTool\E1setup.exe. If you are asked to
locate a sys file, this can be found on the CD that is supplied with the emulator.
3 A dialog box with information about device and firmware version is displayed. If the
firmware information consists of dashes or an older version, this means that no
firmware has been programmed. In that case, click Setup to display the next dialog
box. Otherwise, click Exit and skip steps 4 through 8.
4 Follow the instructions in the dialog box; disconnect the USB cable and change the
mode selection switch back to 0. Then re-attach the USB cable. Click OK to download
the firmware update.
If a hardware wizard is launched and asks you to re-install the USB driver for HMSE
USB Direct, select a driver for your operating system version from the CD—or from the
drivers\ subdirectory in the Embedded Workbench installation directory—and install
it. The original driver is not corrupted or invalid, but the host computer treats the
E10A-USB Emulator with the switch in a different position as a different device. When
the installation of the driver is completed, click OK.
Note: Do not turn off the host computer or disconnect the USB cable any more until the
download has been completed. This can damage the firmware permanently.
5 The firmware download might take some time. When it has been completed
successfully, click OK in the dialog box that is displayed.
6 Follow the instructions in the new dialog box; disconnect the USB cable and change
the mode selection switch back to 1 once more and then re-attach the USB cable again.
Click OK.
7 The dialog box with information about device and firmware version will now show
device group and version information for the firmware.
8 Click Exit. The E10A-USB emulator is now ready to be used.
Note: This setup procedure does not apply to the Renesas E8/E8a Emulator. For the
E8/E8a emulator, the firmware is programmed automatically.
Connecting to the target board, E8/E8a
To establish a connection to the target board, you must follow this procedure:
1 To select the device that matches your target system, choose
Project>Options>General Options>Target.
2 Select the driver that matches your emulator on the
Project>Options>Debugger>Setup page.
IAR C-SPY® Hardware Debugger Systems
4
User Guide
CSE8E10-2
Introduction to C-SPY® hardware debugger systems
3 Build the project if it has not been built and choose Project>Debug to start C-SPY.
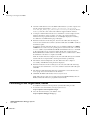
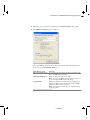
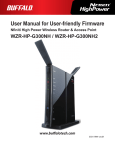
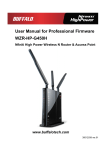
4 The Emulator Setting dialog box is displayed.
Figure 2: The Emulator Setting dialog box for the E8a emulator
Select your MCU group and device from the drop-down lists. The following items can
also be selected on the Emulator Mode page:
E8/E8a Emulator option
Description
Erase Flash and Connect
Erases the flash memory data for the MCUs and simultaneously
writes the E8/E8a emulator firmware.
Keep Flash and Connect
Retains the flash memory data for the MCUs.
Note: The area for the E8/E8a emulator firmware and the vector area used by the E8/E8a emulator will change.
Program Flash
Writes your application to the flash memory. Debugging of the
application is disabled. Select this mode when using the E8/E8a
emulator as a flash memory programmer.
Note: It is necessary to input the ID code of the flash memory
to the target device.
Table 4: The E8/E8a emulator mode options
5
CSE8E10-2
Connecting to the target board, E8/E8a
E8/E8a Emulator option
Description
Debugging of CPU rewrite Erases the flash memory data for the MCUs and simultaneously
mode
writes the E8/E8a emulator program, when starting the debugger. Select this setting when debugging the program which
rewrites the CPU.
Note: In this mode, it is not possible to set PC breakpoints or
to change the contents of the flash memory.
Execute the user program Executes your application when you stop the debugger. This
after ending the debugger option requires external power supply.
Note: This option is available only for the E8a emulator and
only when Program Flash has been selected.
Power target from Emula- Select this option if the target board is not connected to any
tor
power supply.
Do not show this dialog box If you select this option, the dialog box will not be displayed the
again
next time the debugger is launched. This option is mirrored in
the E8/E8a Emulator menu command Show Emulator Setting. Use the menu command to display the dialog box again.
See also Maintaining the connection to the hardware, page 8.
Table 4: The E8/E8a emulator mode options (Continued)
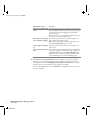
5 If the Firmware Location & WDT dialog box is displayed, you must confirm the
placement of code and data on the target microcontroller. If your application uses a
watchdog timer, select the Debugging of program that uses WDT option to cause the
watchdog timer to be refreshed when your application is running.
If you use the default device-specific XLINK linker command file, you do not need to
change any settings.
IAR C-SPY® Hardware Debugger Systems
6
User Guide
CSE8E10-2
Introduction to C-SPY® hardware debugger systems
Note: Make sure that your application is not downloaded to the firmware location.
Figure 3: The Firmware Location page for the E8/E8a emulator
If this dialog box is not displayed, skip this step.
Click OK in the Emulator Setting dialog box to save your settings.
6 The Connecting dialog box is displayed and the emulator connection is started.
Figure 4: The Connecting dialog box
7
CSE8E10-2
Connecting to the target board, E8/E8a
7 If a dialog box asks you to confirm that the target board is supplied with power, select
the check box and the correct voltage.
Figure 5: The Power Supply dialog box for the E8/E8a emulator
If this dialog box is not displayed, skip this step.
Note: Before you connect the target board to a power supply, check the power
specifications and that there are no short circuits. Incorrect operation might damage the
board and the emulator.
8 If the ID Code verification dialog box is displayed, enter the hexadecimal ID security
code for the flash memory.
Figure 6: The ID Code verification dialog box for the E8/E8a emulator
When the emulator is ready to be used, Connected will be printed in the IAR
Embedded Workbench Debug Log window together with the number of available
hardware and software breakpoints.
MAINTAINING THE CONNECTION TO THE HARDWARE
When a debug session is started, a connection to the hardware is established and an
initialization routine is executed. The initialization sets the emulator options for your
target system.
When you start a debug session with the same hardware as the previous session and
without closing the IDE between the debug sessions, C-SPY can skip the initialization
IAR C-SPY® Hardware Debugger Systems
8
User Guide
CSE8E10-2
Introduction to C-SPY® hardware debugger systems
to save time. For information on how to set this behavior in C-SPY, see the option Do
not show this dialog box again, page 6. If you set this option, the connection to the
hardware is maintained and the initialization is not repeated. This option is mirrored in
the menu command Show Emulator Setting, see the The Emulator menu, page 17.
Connecting to the target board, E10A-USB
To establish a connection to the target board, follow this procedure:
1 To select the device that matches your target system, choose
Project>Options>General Options>Target in IAR Embedded Workbench.
2 Select the driver that matches your emulator on the
Project>Options>Debugger>Setup page.
3 Build the project if it has not been built and choose Project>Debug to start C-SPY.
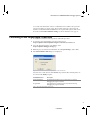
4 The Select Emulator mode dialog box is displayed.
Figure 7: The Select Emulator mode dialog box for the E10A-USB emulator
Select the device name in use from the Device drop-down list. The following items can
be selected in the Mode group box.
E10A-USB Emulator
Description
E10A-USB Emulator
The E10A-USB emulator for the specified device is activated.
Debugging the program is enabled.
Program Flash
Your application is programmed to the internal flash memory.
Debugging the program is disabled.
Table 5: The E10A-USB emulator mode options
9
CSE8E10-2
Connecting to the target board, E10A-USB
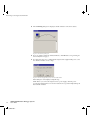
5 The Connecting dialog box is displayed and the emulator connection is started.
Figure 8: The Connecting dialog box
6 If you are asked to update the emulator firmware, click OK and see Programming the
E10A-USB firmware, page 3.
7 If a dialog box asks you to confirm that the target board is supplied with power, select
the check box and the correct voltage.
Figure 9: The Power Supply dialog box for the E10A-USB emulator
If this dialog box is not displayed, skip this step.
Note: Before you connect the target board to a power supply, check the power
specifications and that there are no short circuits. Incorrect operation might damage the
board and the emulator.
IAR C-SPY® Hardware Debugger Systems
10
User Guide
CSE8E10-2
Introduction to C-SPY® hardware debugger systems
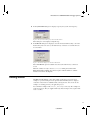
8 If the System Clock dialog box is displayed, specify the system clock frequency.
Figure 10: The System Clock dialog box for the E10A-USB emulator
If this dialog box is not displayed, skip this step.
9 If the ID Code dialog box is displayed, enter the hexadecimal ID security code for the
flash memory. For some devices, the flash memory contents are erased if the ID code
does not match.
Figure 11: The ID Code dialog box for the E10A-USB emulator
If the New ID code option is available and selected, the flash memory contents are
erased.
When the emulator is ready to be used, Connected will be printed in the IAR
Embedded Workbench Debug Log window together with the number of available
hardware and software breakpoints.
Getting started
IAR Embedded Workbench comes with example applications. You can use these
examples to get started using the development tools from IAR Systems or simply to
verify that contact has been established with your target board. You can also use the
examples as a starting point for your application project.
You can find the examples in the install_dir\examples directory. The examples are
ready to be used as is. They are supplied with ready-made workspace files, together with
source code files.
11
CSE8E10-2
Getting started
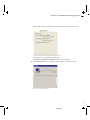
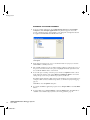
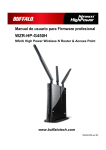
RUNNING THE DEMO PROGRAM
1 To use an example application, choose Help>Startup Screen and click Example
workspaces. In the Example Applications dialog box that appears, choose the
specific evaluation board or starter kit that you are using. The examples listed below
are supplied with IAR Embedded Workbench for H8.
Figure 12: Example application
Click Open.
2 In the dialog box that appears, choose a destination folder for your project location.
Click Select to confirm your choice.
3 The available example projects are displayed in the workspace window. Select one of
the projects, and if it is not the active project (highlighted in bold), right-click it and
choose Set As Active from the context menu.
4 To view the project settings, select the project and choose Options from the context
menu. Verify the settings of the options Device and Debugger>Driver. As for other
settings, the project is set up to suit the target system you selected.
For further details about the C-SPY options for the hardware target system and how to
configure C-SPY to interact with the target board, see Hardware-specific debugging,
page 15.
Click OK to close the Options dialog box.
5 To compile and link the application program, choose Project>Make or click the Make
button.
6 To start C-SPY, choose Project>Debug or click the Debug button. If C-SPY fails to
establish contact with the target system, see Resolving problems, page 24.
IAR C-SPY® Hardware Debugger Systems
12
User Guide
CSE8E10-2
Introduction to C-SPY® hardware debugger systems
7 Choose Execute>Go or click the Go button to start the program.
Click the Stop button to stop execution.
13
CSE8E10-2
Getting started
IAR C-SPY® Hardware Debugger Systems
14
User Guide
CSE8E10-2
Hardware-specific
debugging
This chapter describes the additional options, menus, and features provided by
the C-SPY® hardware debugger systems. The chapter contains the following
sections:
●
Debugger options for debugging using hardware systems
●
Target-dependent settings
●
Using breakpoints
●
Resolving problems.
Debugger options for debugging using hardware systems
Before you start any C-SPY hardware debugger you must set some options for the
debugger system—both C-SPY generic options and options required for the hardware
system (C-SPY driver-specific options). Follow this procedure:
1 To open the Options dialog box, choose Project>Options.
2 To set C-SPY generic options and select a C-SPY driver:
●
Select Debugger from the Category list
●
On the Setup page, select the appropriate C-SPY driver from the Driver list.
For information about the settings Setup macros, Run to, and Device descriptions, as
well as for information about the pages Extra Options and Plugins, see the IAR
Embedded Workbench® IDE User Guide.
Note that a default device description file and linker command file is automatically
selected depending on your selection of a device on the General Options>Target page.
3 To set the driver-specific options, select the appropriate driver from the Category list.
Depending on which C-SPY driver you are using, different sets of available option
pages appears.
For details about each page, see:
●
The Setup page, page 16
15
CSE8E10-2
Debugger options for debugging using hardware systems
●
The Download page, page 16
●
The Extra Options page, page 17.
4 When you have set all the required options, click OK in the Options dialog box.
THE SETUP PAGE
There are no driver-specific options to be set before the debugging starts. Refer to the
user documentation supplied with the target system for information about the required
settings.
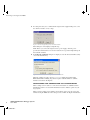
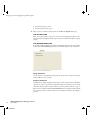
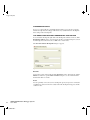
THE DOWNLOAD PAGE
By default, C-SPY downloads the application into RAM or flash memory when a debug
session starts. The Download options lets you modify the behavior of the download.
Figure 13: The C-SPY Download options
Verify download
Use this option to verify that the downloaded code image can be read back from target
memory with the correct contents.
Suppress download
Use this option to debug an application that already resides in target memory. When this
option is selected, the code download is disabled, while preserving the present content
of the flash. Use this option together with the option Keep Flash and Connect, page 5.
If this option is combined with the Verify download option, the debugger will read back
the code image from non-volatile memory and verify that it is identical to the debugged
program.
IAR C-SPY® Hardware Debugger Systems
16
User Guide
CSE8E10-2
Hardware-specific debugging
Note: It is important that the image that resides in target memory is linked consistently
with how you use C-SPY for debugging. For example, you might first link your
application using an output format without debug information, such as Intel-hex, and
then load the application separately from C-SPY. If you then use C-SPY only for
debugging, you cannot build the debugged application with the linker option With
runtime control modules as that would add extra code, resulting in two different code
images.
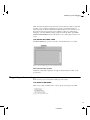
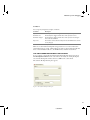
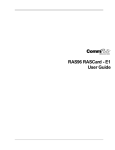
THE EXTRA OPTIONS PAGE
The Extra Options page provides you with a command line interface to C-SPY.
Figure 14: The Extra Options page for C-SPY command line options
Use command line options
Additional command line arguments (not supported by the GUI) for C-SPY can be
specified here.
Target-dependent settings
In this section you can read about the emulator-specific features.
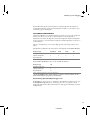
THE EMULATOR MENU
When you are using an emulator driver, a driver-specific menu appears in C-SPY:
Figure 15: The E8a Emulator menu
17
CSE8E10-2
Using breakpoints
These commands are available on the emulator menu:
Menu command
Description
Breakpoint Usage
Displays the Breakpoint Usage dialog box, see the The Breakpoint Usage dialog box, page 23.
Show Emulator Setting1
Displays the Emulator Setting dialog box, see the Maintaining
the connection to the hardware, page 8.
Start/Stop Function Setting1 Lets you execute specified routines of your application immediately before starting and immediately after halting the application execution. The specified routines are executed when the
operations Go and Step are performed. A dialog box where
you can specify start and stop as labels or addresses is displayed. See also Restrictions for the Start/Stop Function, page 18.
Table 6: Commands on the E8a Emulator menu
1 Not available for all targets
Restrictions for the Start/Stop Function
The Start/Stop function has the following restrictions:
●
Do not set any breakpoints in the specified routine.
●
Do not step into the specified routine.
●
When a stack is used, make sure it is the user stack and not the interrupt stack.
●
Disable interrupts during the execution of the specified routine.
Using breakpoints
This section provides an overview of the available breakpoints for the C-SPY hardware
debugger systems. The following is described:
●
Available breakpoints, page 19
●
Code breakpoints, page 20
●
The Execution Address Breakpoint dialog box, page 20
●
The Software breakpoint dialog box, page 21
●
Log breakpoints, see the IAR Embedded Workbench® IDE User Guide.
●
The Break Condition dialog box, page 22
●
The Breakpoint Usage dialog box, page 23
●
C-SPY use of breakpoints, page 24.
IAR C-SPY® Hardware Debugger Systems
18
User Guide
CSE8E10-2
Hardware-specific debugging
For information about the various methods for setting breakpoints, the facilities for
monitoring breakpoints, and the various breakpoint consumers, see the chapter Using
breakpoints, page 18 in this guide.
AVAILABLE BREAKPOINTS
Using the C-SPY drivers for hardware debugger systems you can set code breakpoints
and for some drivers you can also set data breakpoints. Code breakpoints are
implemented as software breakpoints or hardware breakpoints. Hardware breakpoints
are also referred to as execution address breakpoints. Data breakpoints are referred to as
break conditions.
The type of breakpoints you can set in C-SPY depends on the target system you are
using.
The table below summarizes the characteristics of breakpoints for the E8/E8a Emulator:
Breakpoint type
M16C/R8C
M32C
R32C
Hardware breakpoints
x
x
x
H8
--
Software breakpoints
x
x
x
x
Data breakpoints
--
--
--
--
Table 7: Available breakpoints for the E8/E8a Emulator
For the E10A-USB Emulator, these are the available breakpoints:
Breakpoint type
H8
Hardware breakpoints
--
Software breakpoints
x
Data breakpoints
x1
Table 8: Available breakpoints for the E10A-USB Emulator
1 For the E10A-USB Emulator, data breakpoints are referred to as break conditions. See The
Break Condition dialog box, page 22 for more information.
Determining which breakpoint type is set
In the IDE, there are two ways to see which type of breakpoint is set. One way is to open
the Breakpoint Usage dialog box. An other way is to move your mouse over the
breakpoint symbol in the editor window. Then a tooltip appears and informs you of the
breakpoint type.
19
CSE8E10-2
Using breakpoints
CODE BREAKPOINTS
If you set a code breakpoint, a default breakpoint will be set. If your driver supports
hardware breakpoints, the debugger will first use any available hardware breakpoints
before using software breakpoints.
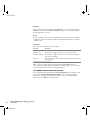
THE EXECUTION ADDRESS BREAKPOINT DIALOG BOX
To set a hardware breakpoint, right-click in the Breakpoints window and choose New
Breakpoint>Address on the context menu. To modify an existing breakpoint, select it
in the Breakpoints window and choose Edit on the context menu.
The Execution Address Breakpoint dialog box appears.
Figure 16: The Execution Address Breakpoint dialog box
Break At
Specify the location of the breakpoint in the Break At text box. Alternatively, click the
Edit browse button to open the Enter Location dialog box; see the IAR Embedded
Workbench® IDE User Guide.
Action
You can optionally connect an action to a breakpoint. Specify an expression, for instance
a C-SPY macro function, which is evaluated when the breakpoint is triggered and the
condition is true.
IAR C-SPY® Hardware Debugger Systems
20
User Guide
CSE8E10-2
Hardware-specific debugging
Conditions
You can specify simple and complex conditions.
Conditions
Description
Expression
A valid expression conforming to the C-SPY expression syntax.
Condition true
The breakpoint is triggered if the value of the expression is true.
Condition changed
The breakpoint is triggered if the value of the expression has changed
since it was last evaluated.
Skip count
The number of times that the breakpoint must be fulfilled before a break
occurs (integer).
Table 9: Execution address breakpoint conditions
When an execution address breakpoint is triggered, there is no need for instruction
rewrite/write back processing, which makes it fast. The execution address breakpoints
share events with data breaks, trace, the RAM monitor, and time measurement.
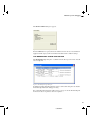
THE SOFTWARE BREAKPOINT DIALOG BOX
To set a software code breakpoint, right-click in the Breakpoints window and choose
New Breakpoint>Software on the context menu. To modify an existing breakpoint,
select it in the Breakpoints window and choose Edit on the context menu.
The Software Breakpoint dialog box appears.
Figure 17: The Software Breakpoint dialog box
21
CSE8E10-2
Using breakpoints
Break At
Specify the location of the breakpoint in the Break At text box. Alternatively, click the
Edit browse button to open the Enter Location dialog box; see the IAR Embedded
Workbench® IDE User Guide.
Action
You can optionally connect an action to a breakpoint. Specify an expression, for instance
a C-SPY macro function, which is evaluated when the breakpoint is triggered and the
condition is true.
Conditions
You can specify simple and complex conditions.
Conditions
Description
Expression
A valid expression conforming to the C-SPY expression syntax.
Condition true
The breakpoint is triggered if the value of the expression is true.
Condition changed
The breakpoint is triggered if the value of the expression has changed
since it was last evaluated.
Skip count
The number of times that the breakpoint must be fulfilled before a break
occurs (integer).
Table 10: Software breakpoint conditions
When a software code breakpoint is set in the internal flash ROM of the target
microcomputer, a number of instructions must be rewritten and processed every time it
is triggered, which makes software code breakpoints slow.
THE BREAK CONDITION DIALOG BOX
To set a data breakpoint, right-click in the View>Breakpoints window. On the context
menu, choose New Breakpoint>Break Condition to set a new break condition.
Alternatively, to modify an existing break condition, select one in the Breakpoint
window and choose Edit on the context menu.
IAR C-SPY® Hardware Debugger Systems
22
User Guide
CSE8E10-2
Hardware-specific debugging
The Break Condition dialog box appears.
Figure 18: The Break Condition dialog box
Press the Edit button to specify the break conditions. Refer to the user documentation
supplied with the target system for information about the break condition settings.
THE BREAKPOINT USAGE DIALOG BOX
The Breakpoint Usage dialog box—available from the driver-specific menu—lists all
active breakpoints.
Figure 19: The Breakpoint Usage dialog box
In addition to listing all breakpoints that you have defined, this dialog box also lists the
internal breakpoints that the debugger is using.
For each breakpoint in the list the address and access type are shown. Each breakpoint
in the list can also be expanded to show its originator.
23
CSE8E10-2
Resolving problems
For more information, see the IAR Embedded Workbench® IDE User Guide.
C-SPY USE OF BREAKPOINTS
When you set a breakpoint, C-SPY sets a breakpoint for internal use. To do this, the
breakpoints in the emulator are used. The fact that C-SPY uses breakpoints is normally
not a problem. However, one exception is C-SPY profiling, which requires many
breakpoints.
C-SPY will set a breakpoint if:
●
●
●
the C-SPY option Run to has been selected (one breakpoint is set temporarily after
each reset)
the stack plugin is being used (if the C-SPY option Run to has been selected, the
breakpoint needed for that will be used also by the stack plugin)
the linker option With runtime control modules has been selected (debug support
for program termination and optionally file I/O).
Exceeding the number of available breakpoints will cause the debugger to single step.
This will significantly reduce the execution speed. For this reason you must be aware of
the different breakpoint consumers; see the IAR Embedded Workbench® IDE User
Guide.
You can prevent the debugger from using breakpoints in these situations by deselecting
these options.
Resolving problems
Debugging using the C-SPY hardware debugger systems requires interaction between
many systems, independent from each other. For this reason, setting up this debug
system can be a complex task. If something goes wrong, it might at first be difficult to
locate the cause of the problem.
This section includes suggestions for resolving the most common problems that can
occur when debugging with the C-SPY hardware debugger systems.
For problems concerning the operation of the evaluation board, refer to the
documentation supplied with it, or contact your hardware distributor.
WRITE FAILURE DURING LOAD
There are several possible reasons for write failure during load. The most common is
that your application has been incorrectly linked:
●
IAR C-SPY® Hardware Debugger Systems
24
User Guide
CSE8E10-2
Check the contents of your linker command file and make sure that your application
has not been linked to the wrong address
Hardware-specific debugging
●
Check that you are using correct linker command file.
If you are using the IAR Embedded Workbench, the linker command file is
automatically selected based on your choice of device:
●
Choose Project>Options
●
Select the General Options category
●
Click the Target tab
●
Choose the appropriate device from the Device drop-down menu.
To override the default linker command file:
●
Choose Project>Options
●
Select the Linker category
●
Click the Config tab
●
Choose the appropriate linker command file in the Linker command file area.
NO CONTACT WITH THE TARGET HARDWARE
There are several possible reasons for C-SPY to fail to establish contact with the target
hardware.
●
Check the communication devices on your host computer
●
Verify that the cable is properly plugged in and not damaged or of the wrong type
●
Verify that the target chip is properly mounted on the evaluation board
●
Make sure that the evaluation board is supplied with sufficient power
●
Check that the correct options for communication have been specified in the IAR
Embedded Workbench; see the documentation provided with the target system.
Examine the linker command file to make sure that your application has not been linked
to the wrong address.
25
CSE8E10-2
Resolving problems
IAR C-SPY® Hardware Debugger Systems
26
User Guide
CSE8E10-2
Index
Index
A
Action (Execution Address Breakpoints dialog box) . . . . . 20
Action (Software Breakpoints dialog box) . . . . . . . . . . . . . 22
address breakpoints . . . . . . . . . . . . . . . . . . . . . . . . . . . . . . . 20
assumptions, programming experience . . . . . . . . . . . . . . . . ix
B
bold style, in this guide . . . . . . . . . . . . . . . . . . . . . . . . . . . . xi
break condition . . . . . . . . . . . . . . . . . . . . . . . . . . . . . . . . . . 22
Break Condition dialog box . . . . . . . . . . . . . . . . . . . . . . . . 22
Breakpoint Usage dialog box . . . . . . . . . . . . . . . . . . . . 19, 23
Breakpoint Usage (Emulator menu) . . . . . . . . . . . . . . . . . . 18
breakpoints
code . . . . . . . . . . . . . . . . . . . . . . . . . . . . . . . . . . . . . . . . 20
data . . . . . . . . . . . . . . . . . . . . . . . . . . . . . . . . . . . . . . . . 22
execution address . . . . . . . . . . . . . . . . . . . . . . . . . . . . . . 20
hardware . . . . . . . . . . . . . . . . . . . . . . . . . . . . . . . . . . . . 20
software . . . . . . . . . . . . . . . . . . . . . . . . . . . . . . . . . . . . . 21
Breakpoints dialog box
Execution Address . . . . . . . . . . . . . . . . . . . . . . . . . . . . . 20
Software . . . . . . . . . . . . . . . . . . . . . . . . . . . . . . . . . . . . . 21
C
code breakpoints . . . . . . . . . . . . . . . . . . . . . . . . . . . . . . . . . 20
command line options, typographic convention . . . . . . . . . xi
command prompt icon, in this guide . . . . . . . . . . . . . . . . . . xi
computer style, typographic convention . . . . . . . . . . . . . . . . x
Conditions (Execution Address Breakpoints dialog box) . . 21
Conditions (Software Breakpoints dialog box) . . . . . . . . . . 22
Connecting dialog box
E10A-USB . . . . . . . . . . . . . . . . . . . . . . . . . . . . . . . . . . . 10
E8/E8a . . . . . . . . . . . . . . . . . . . . . . . . . . . . . . . . . . . . . . . 7
conventions, used in this guide . . . . . . . . . . . . . . . . . . . . . . . x
C++ terminology. . . . . . . . . . . . . . . . . . . . . . . . . . . . . . . . . . x
C-SPY
differences between drivers . . . . . . . . . . . . . . . . . . . . . . . 1
Emulator drivers . . . . . . . . . . . . . . . . . . . . . . . . . . . . . . . 1
C-SPY drivers, Emulator . . . . . . . . . . . . . . . . . . . . . . . . . . . 2
C-SPY options
Download. . . . . . . . . . . . . . . . . . . . . . . . . . . . . . . . . . . . 16
Extra Options . . . . . . . . . . . . . . . . . . . . . . . . . . . . . . . . . 17
D
data breakpoints . . . . . . . . . . . . . . . . . . . . . . . . . . . . . . . . . 22
Data breakpoints, in hardware driver . . . . . . . . . . . . . . . . . 22
debugger drivers, Emulator . . . . . . . . . . . . . . . . . . . . . . . . . . 2
Debugging of CPU rewrite mode (E8/E8a emulator options) 6
dialog boxes
Break Condition . . . . . . . . . . . . . . . . . . . . . . . . . . . . . . . 22
Break Condition (Breakpoints window) . . . . . . . . . . . . . 22
Breakpoint Usage. . . . . . . . . . . . . . . . . . . . . . . . . . . . . . 19
Connecting (E10A-USB) . . . . . . . . . . . . . . . . . . . . . . . . 10
Connecting (E8/E8a) . . . . . . . . . . . . . . . . . . . . . . . . . . . . 7
Emulator Setting . . . . . . . . . . . . . . . . . . . . . . . . . . . . . . . 5
Example Applications . . . . . . . . . . . . . . . . . . . . . . . . . . 12
Execution Address breakpoints (Breakpoints window) . 20
Firmware Location & WDT . . . . . . . . . . . . . . . . . . . . . . . 6
ID Code . . . . . . . . . . . . . . . . . . . . . . . . . . . . . . . . . . . . . 11
ID Code verification . . . . . . . . . . . . . . . . . . . . . . . . . . . . 8
Power Supply (E10A-USB) . . . . . . . . . . . . . . . . . . . . . . 10
Power Supply (E8/E8a) . . . . . . . . . . . . . . . . . . . . . . . . . . 8
Select Emulator mode . . . . . . . . . . . . . . . . . . . . . . . . . . . 9
Software breakpoints (Breakpoints window) . . . . . . . . . 21
System Clock . . . . . . . . . . . . . . . . . . . . . . . . . . . . . . . . . 11
Do not show this dialog box again
(E8/E8a emulator options) . . . . . . . . . . . . . . . . . . . . . . . . . . 6
document conventions. . . . . . . . . . . . . . . . . . . . . . . . . . . . . . x
documentation
other documentation . . . . . . . . . . . . . . . . . . . . . . . . . . . . x
this guide . . . . . . . . . . . . . . . . . . . . . . . . . . . . . . . . . . . . ix
Download (C-SPY options) . . . . . . . . . . . . . . . . . . . . . . . . 16
Download, for C-SPY driver . . . . . . . . . . . . . . . . . . . . . . . . 16
31
CSE8E10-2
E
K
Emulator options
Debugging of CPU rewrite mode (E8/E8a) . . . . . . . . . . . 6
Do not show this dialog box again (E8/E8a) . . . . . . . . . . 6
Erase Flash and Connect (E8/E8a) . . . . . . . . . . . . . . . . . . 5
Execute the user program after ending the debugger
(E8/E8a). . . . . . . . . . . . . . . . . . . . . . . . . . . . . . . . . . . . . . 6
E10A-USB Emulator (E10A-USB) . . . . . . . . . . . . . . . . . 9
Keep Flash and Connect (E8/E8a) . . . . . . . . . . . . . . . . . . 5
Power target from Emulator (E8/E8a) . . . . . . . . . . . . . . . 6
Program Flash (E10A-USB) . . . . . . . . . . . . . . . . . . . . . . 9
Program Flash (E8/E8a) . . . . . . . . . . . . . . . . . . . . . . . . . . 5
Emulator Setting dialog box . . . . . . . . . . . . . . . . . . . . . . . . . 5
Emulator (C-SPY driver) . . . . . . . . . . . . . . . . . . . . . . . . . . . 2
Erase Flash and Connect (E8/E8a emulator options) . . . . . . 5
Example Applications dialog box . . . . . . . . . . . . . . . . . . . . 12
Execute the user program after ending the debugger (E8/E8a
emulator options) . . . . . . . . . . . . . . . . . . . . . . . . . . . . . . . . . 6
Extra Options (C-SPY options) . . . . . . . . . . . . . . . . . . . . . . 17
Extra Options, for C-SPY driver . . . . . . . . . . . . . . . . . . . . . 17
E10A-USB Emulator (E10A-USB emulator options) . . . . . . 9
Keep Flash and Connect (E8/E8a emulator options) . . . . . . . 5
F
Firmware Location & WDT dialog box . . . . . . . . . . . . . . . . 6
H
hardware breakpoints . . . . . . . . . . . . . . . . . . . . . . . . . . . . . 20
lightbulb icon, in this guide . . . . . . . . . . . . . . . . . . . . . . . . . xi
N
naming conventions . . . . . . . . . . . . . . . . . . . . . . . . . . . . . . xi
O
options, hardware debugger systems . . . . . . . . . . . . . . . . . . 15
P
parameters, typographic convention . . . . . . . . . . . . . . . . . . xi
Power Supply dialog box
E10A-USB . . . . . . . . . . . . . . . . . . . . . . . . . . . . . . . . . . . 10
E8/E8a . . . . . . . . . . . . . . . . . . . . . . . . . . . . . . . . . . . . . . . 8
Power target from Emulator (E8/E8a emulator options) . . . . 6
prerequisites, programming experience. . . . . . . . . . . . . . . . ix
Program Flash (E10A-USB emulator options) . . . . . . . . . . . 9
Program Flash (E8/E8a emulator options) . . . . . . . . . . . . . . 5
programming experience. . . . . . . . . . . . . . . . . . . . . . . . . . . ix
R
reference information, typographic convention . . . . . . . . . . xi
I
icons, in this guide . . . . . . . . . . . . . . . . . . . . . . . . . . . . . . . xi
ID Code dialog box . . . . . . . . . . . . . . . . . . . . . . . . . . . . . . . 11
ID Code verification dialog box . . . . . . . . . . . . . . . . . . . . . . 8
italic style, in this guide . . . . . . . . . . . . . . . . . . . . . . . . . . . xi
IAR C-SPY® Hardware Debugger Systems
32
L
User Guide
CSE8E10-2
S
Select Emulator mode dialog box . . . . . . . . . . . . . . . . . . . . . 9
Show Emulator Setting (Emulator menu) . . . . . . . . . . . . . . 18
software breakpoints . . . . . . . . . . . . . . . . . . . . . . . . . . . . . . 21
Start/Stop Function Setting (Emulator menu) . . . . . . . . . . . 18
Index
Suppress download (C-SPY option) . . . . . . . . . . . . . . . . . . 16
System Clock dialog box . . . . . . . . . . . . . . . . . . . . . . . . . . 11
T
terminology. . . . . . . . . . . . . . . . . . . . . . . . . . . . . . . . . . . . . . x
tools icon, in this guide . . . . . . . . . . . . . . . . . . . . . . . . . . . . xi
typographic conventions . . . . . . . . . . . . . . . . . . . . . . . . . . . . x
V
Verify download (C-SPY option) . . . . . . . . . . . . . . . . . . . . 16
W
warnings icon, in this guide . . . . . . . . . . . . . . . . . . . . . . . . xi
33
CSE8E10-2