1
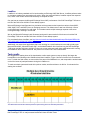
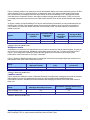
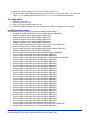
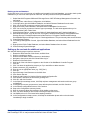
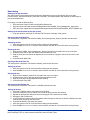
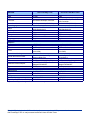
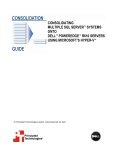
TEST REPORT
SEPTEMBER 2009
SMB workload performance comparison: AMD processorbased Dell PowerEdge T105 vs. Intel processor-based Dell
Vostro 220 Mini Tower
Executive summary
Dell Inc. (Dell) and AMD, Inc. (AMD) commissioned
Principled Technologies (PT) to measure the performance
of the following two Dell systems running a representative
small-business workload on Microsoft® Windows Small
Business Server® 2008 Standard Edition:
•
•
A typical small-business server: Dell™
PowerEdge™ T105 server using an AMD Opteron
1389 processor and 8GB RAM
A typical small-business desktop: Dell™ Vostro™
220 Mini Tower desktop system using an Intel®
Core™ 2 Duo Processor E8600 and 4GB RAM
KEY FINDINGS
z
The Dell PowerEdge T105 server delivered
90 percent more combined WebBench and
LoadGen operations than the Dell Vostro
220 Mini Tower desktop system. (See
Figure 1.)
z
With the system under load, a user on the
Dell PowerEdge T105 server was able to
open various productivity applications in a
total time of 58.5 seconds, for a time
savings of 33.7 percent compared to that of
the Dell Vostro 220 Mini Tower desktop
system, which required a total time of 88.3
seconds to open these same applications.
(See Figure 2.)
We base our testbed on a common small business
scenario; one where the business is currently using an end
user’s desktop as their server. As the business size and
workload increases over time, these desktop-class systems often cannot keep up with the demand from either the
underlying server activities or from the productivity applications being run on the local console. This report shows
the potential benefit and performance gain a business and end user would receive from upgrading to a serverclass system like the Dell PowerEdge T105. Actual results will vary based on specific application- and server-side
workloads. We should note that running Windows Small Business Server 2008 on a desktop-class machine is not
a recommended configuration. We used Windows Small Business Server 2008 on both machines in order to
provide a fair performance comparison between the two systems.
Averaged throughput results
Higher results are better
Normalized comparison
2.0
1.8
1.6
1.4
1.2
1.0
0.8
0.6
0.4
0.2
0.0
Dell Vostro 220 Mini
Tower desktop system
using an Intel Core 2 Duo
Processor E8600
Dell PowerEdge T105
server using an AMD
Opteron 1389 processor
To test performance, we
simultaneously ran
workloads that exercised
two characteristic small
business functions: Web
traffic and email activity. We
used WebBench to simulate
Web traffic and Microsoft
Exchange Load Generator
(LoadGen) to simulate email
activity. The Workload
section provides more
benchmark information. We
define a small business
workload as consisting of
between 25 to 75 users, with
50 users as the average.
Additionally, we timed how
long several productivity
Figure 1: Averaged throughput results of the test systems across the two benchmarks relative
applications took to open on
to the Dell Vostro 220 Mini Tower. Higher numbers are better.
either system while under
the same Web and email workload. For this test, we used Microsoft® Word, Microsoft® Excel®, and Adobe®
Reader®. Our goal was to show the increase in performance an end user might experience if they were using the
Dell PowerEdge T105 server instead of the Dell Vostro 220 Mini Tower desktop system to complete these tasks.
Time in seconds
Figure 1 presents averaged throughput results for the Dell PowerEdge T105 server and the Dell Vostro 220 Mini
Tower desktop system running the two workloads relative to the lower-performing system, the Dell Vostro 220
Mini Tower. For each workload, we assigned a value of 100 percent to that system’s results and then calculated
the percentage performance
improvement of the Dell
Total time to open applications
PowerEdge T105. This
Lower results are better
approach makes each data
100.0
point a comparative number,
with higher numbers indicating
90.0
Dell Vostro 220 Mini
better performance. Finally,
80.0
Tower desktop system
we took the percentage
using an Intel Core 2 Duo
70.0
performance improvement
Processor E8600
over the Dell Vostro 220 Mini
60.0
Dell PowerEdge T105
Tower for the two benchmarks
server using an AMD
50.0
and averaged them.
Opteron 1389 processor
40.0
30.0
20.0
10.0
0.0
As Figure 1 illustrates, the Dell
PowerEdge T105 server
delivered an average of 90
percent greater performance
across the two benchmarks
than did the Dell Vostro 200
Mini Tower desktop system.
Figure 2: Total time for a user on the test systems to open productivity applications while
each test system is under load. Lower numbers are better.
As Figure 2 illustrates, with the
system under load, a user on
the Dell PowerEdge T105 server took 58.5 seconds to open the productivity applications, for a time savings of
33.7 percent over that on the Dell Vostro 200 Mini Tower desktop system, which required 88.3 seconds to open
the productivity applications while under load.
Workload
We ran the following two workloads simultaneously, as a typical small business server might.
WebBench
WebBench 5.0 (128-bit US version) is an industry-standard benchmark for Web server software and hardware. It
uses PC clients to send Web requests to a server under test. It generates performance results by incrementally
increasing the number of clients making HTTP 1.0 GET requests to the Web server; the result is a curve showing
the server’s performance under increasing load. The peak of that curve represents the peak throughput of the
server. WebBench reports both the total number of requests per second the server handled and the server’s total
throughput in bytes per second.
We ran the WebBench e-commerce CGI test suite for 40 minutes on both the Dell PowerEdge T105 server and
the Dell Vostro 220 Mini Tower desktop system. This suite generates both secure and non-secure static and
dynamic requests. While running the e-commerce suite, the clients must negotiate to a secure Web server port
using the Secure Socket Layer (SSL) protocol.
A default WebBench test suite incrementally increases the number of clients making the HTTP 1.0 GET requests
to the Web server. As the workload increases the number of clients, the Web server’s processor utilization also
increases, until the clients saturate the processor in the Web server with work. Each workload point with a fixed
number of clients is a WebBench “mix.” The e-commerce CGI test suite begins with a mix that involves one client;
the next mix involves four clients; and each subsequent mix increases the number of clients by four.
We modified the test suite so it would run 10 clients, with 10 engines per client for the entire test. This allowed us
to keep a constant Web load on the system. To limit the amount of time WebBench ran, we performed only four
mixes for testing. The first two mixes ran for 5 minutes each, while the last two ran for 15 minutes each.
Principled Technologies, Inc.: SMB workload performance comparison: AMD processor-based
Dell PowerEdge T105 vs. Intel processor-based Dell Vostro 220 Mini Tower
2
LoadGen
LoadGen is an industry-standard tool for benchmarking an Exchange 2007 Mail Server. LoadGen performs tasks
to simulate a standard user generating mail activity. When the workload finishes, LoadGen reports the response
time, which is the number of seconds necessary to complete the task.
Our goal was to compare the Microsoft Exchange Server 2007 performance of the Dell PowerEdge T105 server
to that of the Dell Vostro 220 Mini Tower desktop system.
Microsoft Exchange Load Generator is a simulation tool that measures the impact that various clients (MAPI,
OWA, IMAP, POP, and SMTP) have on Exchange servers. This allows users to test how effectively a server
running Exchange responds to e-mail loads. The simulator sends multiple message requests to the server
running Exchange, resulting in a mail load.
We ran the Microsoft Exchange Load Generator benchmark in stress mode for 30 minutes on both the Dell
PowerEdge T105 server and the Dell Vostro 220 Mini Tower desktop system.
For more details about LoadGen, see http://www.microsoft.com/downloads/details.aspx?FamilyId=DDEC1642F6E3-4D66-A82F-8D3062C6FA98&displaylang=en.
Additionally, we chose three applications that a user working on a small business server would typically open:
Microsoft Word 2007, Microsoft Excel® 2007, and Adobe® Reader®. We timed how long the Dell PowerEdge
T105 server and the Dell Vostro 220 Mini Tower took to open a document with these applications while running
the WebBench and LoadGen workload. We present our results in the Test results section.
Test results
We staggered the starting times of the benchmarks to allow each system to ramp up slowly. We began the
benchmarks in the following order: WebBench and then LoadGen. Figure 3 shows a timeline for the benchmark
runs. To obtain the final results, we removed the first parts of the WebBench run, and computed the results based
on the 30 minutes of peak performance during the LoadGen run.
To make sure both systems achieved their optimum results, we allowed them to sit idle for 10 minutes before
starting the workload.
Figure 3: The timeline we followed when starting the benchmarks for the multiple-benchmark runs on both systems.
The shaded areas from 00:10 to 00:40 represent the period during which we measured performance.
Principled Technologies, Inc.: SMB workload performance comparison: AMD processor-based
Dell PowerEdge T105 vs. Intel processor-based Dell Vostro 220 Mini Tower
3
Figure 4 presents results for the systems on the two benchmarks relative to the lower-performing system, the Dell
Vostro 220 Mini Tower. For each benchmark, we assigned a value of 100 percent to that system’s results and
then calculated the percentage performance improvement of the Dell PowerEdge T105. This approach makes
each data point a comparative number, with higher numbers indicating better performance. Finally, we took the
percentage performance improvement over the Dell Vostro 220 Mini Tower for the two benchmarks and averaged
them.
As Figure 4 shows, the Dell PowerEdge T105 server achieved better performance on both benchmarks than did
the Dell Vostro 220 Mini Tower desktop system. Each result is the median of three runs. With the exception of
CPU utilization, all results are relative to the Dell Vostro 220 Mini Tower. We used LoadGen to determine the
median for all runs.
System
Dell PowerEdge T105
Dell Vostro 220 Mini Tower
Percentage CPU
utilization
Normalized Web
requests per
second*
85.9
98.3
2.3
1.0
Normalized
messages
delivered per
second*
1.4
1.0
Average of Web
and email results*
1.9
1.0
Figure 4: Performance for the system on the two benchmarks, relative to the Dell Vostro 220 Mini Tower. Higher numbers are better.
* Relative to Dell Vostro 220 Mini Tower
WebBench results
A WebBench run reports the total requests per second a server can perform and the total throughput, in bytes per
second, that the server delivered. WebBench reports these results for each mix. To obtain the results we list in
Figure 5, we averaged the requests per second and throughput from the mixes that ran during the peak
performance of the benchmark run, as Figure 3 illustrates.
Figure 5 shows the WebBench peak results in requests per second and in throughput (bytes per second) for the
test systems. Each result is the median of three runs.
Server
Dell PowerEdge T105
Dell Vostro 220 Mini Tower
Throughput
(bytes per second)
210,429,903.6
147,128,779.1
Requests per second
(raw)
21,561.2
15,072.4
Normalized requests
per second*
1.4
1.0
Figure 5: Median WebBench results for the two systems. Higher numbers are better.
* Relative to Dell Vostro 220 Mini Tower
LoadGen results
Figure 6 shows the shows the number of Microsoft Exchange Load Generator messages per second each system
delivered during the test. We gathered these results by using the MSExchangeIS Mailbox\Messages
Delivered/sec counter in Windows Performance Monitor and averaging the results. Each result is the median of
three runs.
Server
Dell PowerEdge T105
Dell Vostro 220 Mini Tower
Messages delivered per second
8.5
3.7
Normalized messages delivered per
second*
2.3
1.0
Figure 6: Median LoadGen results for the two systems. Higher numbers are better.
* Relative to Dell Vostro 220 Mini Tower
Principled Technologies, Inc.: SMB workload performance comparison: AMD processor-based
Dell PowerEdge T105 vs. Intel processor-based Dell Vostro 220 Mini Tower
4
Figure 7 shows the time, in seconds, each system took to open the three productivity applications while each
system is under load and in a stressed state. Lower numbers are better.
Application
Microsoft Word 2007
Microsoft Excel 2007
Adobe Reader
Total
Application open time on the Dell
PowerEdge T105 (seconds)
26.3
21.0
11.2
58.5
Application open time on the Dell
Vostro 220 Mini Tower (seconds)
23.1
30.5
34.7
88.3
Figure 7: Time, in seconds, for each system to open the three productivity applications. Lower numbers are better.
Test methodology
Figure 8 summarizes some key aspects of the configurations of the two systems; Appendix A provides detailed
configuration information.
Server
Dell PowerEdge T105
Processor
AMD Opteron 1389
Processor frequency (GHz)
RAM
Hard drive
2.90
8 GB (4 x 2 GB) PC2-6400E
2 x 300 GB, SAS
Dell Vostro 220 Mini Tower
Intel Core 2 Duo Desktop Processor
E8600
3.33
4 GB (2 x 2 GB) PC2-6400
1 x 320 GB, SATA
Figure 8: Key aspects of the system configurations.
For testing, we configured the Dell PowerEdge T105 with redundancy by placing the two hard disks in a RAID 1.
The Dell Vostro 220 Mini Tower only had one hard disk, so we could not configure this system with any hard drive
redundancy. We used the default BIOS options on both systems for testing.
Test bed configuration
To generate the workload, we used 12 Dell™ PowerEdge™ M600 Blade Servers installed in a Dell™
PowerEdge™ M1000e Modular Blade Enclosure, with two Cisco® Catalyst® Blade Switch M 3130G installed in
the back of the enclosure. We configured 10 of the PowerEdge M600 Blade Servers with Microsoft® Windows
Server® 2003 R2, Enterprise Edition and WebBench 5.0 client. We used these 10 blades to drive the WebBench
workload on both systems under test. On the remaining two Dell PowerEdge M600 Blade Servers, we installed
Microsoft Windows Server 2003 R2, Enterprise x64 Edition and Microsoft LoadGen 64-bit. We used one of these
two blades for each system under test.
We installed an Intel® PRO/1000 PT Dual Port adapter in the Dell PowerEdge T105 and Dell Vostro 220 Mini
Tower for testing. We configured both ports of the adapter with static IP addresses and connected them to one of
the Cisco Catalyst M 3130G switches, which we used for WebBench traffic. We connected the integrated network
adapter on the Dell PowerEdge T105 and Dell Vostro 220 Mini Tower to the second Cisco Catalyst M 3130G for
LoadGen traffic.
We began our testing by installing a fresh copy of Microsoft Windows Small Business Server 2008 on each
system. We followed this process for each installation:
1.
2.
3.
4.
5.
6.
7.
8.
9.
Accept the default language settings.
Click install now.
Enter the product key.
Click Next.
Select a Custom Install.
Accept the default settings.
Click Next at the Continue Installation screen.
Set the time/date to the correct time/date.
Fill Out the Company information screen.
Principled Technologies, Inc.: SMB workload performance comparison: AMD processor-based
Dell PowerEdge T105 vs. Intel processor-based Dell Vostro 220 Mini Tower
5
10. Assign the computer a name of SERVER and a domain name of TEST.
11. Fill out the Add a network administrator account screen with FIRST as the first name, LAST as the last
name, root as the Administrator username, and Password1 as the Administrator password.
OS configuration
1.
2.
3.
4.
Open the control panel.
Double-click User Accounts.
Click on Turn User Account Control on or off.
Uncheck the radio box saying, Use User Account Control (UAC) to help protect your computer.
Installing system updates
We installed the following updates using Microsoft Windows update feature:
• Windows Server 2008 Service Pack 2 for x64-based Systems (KB948465)
• Update for Windows Server 2008 x64 Edition (KB957200)
• Update for Windows Server 2008 x64 Edition (KB957321)
• Update for Windows Server 2008 x64 Edition (KB959130)
• Update for Windows Server 2008 x64 Edition (KB972036)
• Update for Windows Server 2008 x64 Edition (KB955430)
• Security Update for Microsoft .NET Framework 2.0 Service Pack 2 (KB972594)
• Update for Windows Server 2008 x64 Edition (KB968389)
• Security Update for Jscript 5.8 for Windows Server 2008 x64 Edition (KB971961)
• Update for Windows Server 2008 x64 Edition (KB952287)
• Security Update for Windows Server 2008 x64-based Systems (KB938464)
• Security Update for Windows Server 2008 x64 Edition (KB949014)
• Security Update for Windows Server 2008 x64 Edition (KB950974)
• Security Update for Windows Mail for Windows Server 2008 x64 Edition (KB951066)
• Security Update for Windows Server 2008 x64 Edition (KB952004)
• Security Update for Windows Server 2008 x64 Edition (KB953733)
• Security Update for Windows Server 2008 x64 Edition (KB954459)
• Security Update for Windows Server 2008 x64 Edition (KB955069)
• Security Update for Windows Server 2008 x64 Edition (KB956572)
• Security Update for Windows Server 2008 x64 Edition (KB956744)
• Security Update for Windows Server 2008 x64 Edition (KB956802)
• Security Update for Windows Server 2008 x64 Edition (KB957097)
• Security Update for Windows Server 2008 x64 Edition (KB958623)
• Security Update for Windows Server 2008 x64 Edition (KB958624)
• Security Update for Windows Server 2008 x64 Edition (KB958644)
• Security Update for Windows Server 2008 x64 Edition (KB958687)
• Security Update for Windows Server 2008 x64 Edition (KB959426)
• Security Update for Windows Server 2008 x64 Edition (KB960225)
• Security Update for Windows Server 2008 x64 Edition (KB960803)
• Security Update for Windows Server 2008 x64 Edition (KB960859)
• Security Update for Windows Server 2008 x64 Edition (KB961063)
• Security Update for Windows Server 2008 x64 Edition (KB961371)
• Security Update for Windows Server 2008 x64 Edition (KB961501)
• Security Update for Windows Server 2008 x64 Edition (KB967723)
• Security Update for Windows Server 2008 x64 Edition (KB968537)
• Security Update for Windows Server 2008 x64 Edition (KB970238)
• Security Update for Windows Server 2008 x64 Edition (KB971557)
• Security Update for Windows Server 2008 x64 Edition (KB971657)
• Security Update for Microsoft .NET Framework 2.0 Service Pack 1 (KB972593)
• Security Update for Windows Server 2008 x64 Edition (KB973507)
Principled Technologies, Inc.: SMB workload performance comparison: AMD processor-based
Dell PowerEdge T105 vs. Intel processor-based Dell Vostro 220 Mini Tower
6
•
•
•
•
•
•
•
•
•
•
Update for Windows Server 2008 x64 Edition (KB951978)
Update for Windows Server 2008 for x64-based Systems (KB955020)
Update for Windows Server 2008 x64 Edition (KB955302)
Update for Windows Server 2008 x64 Edition (KB970653)
Internet Explorer 8 for Windows Server 2008 x64 Edition
Cumulative Security Update for ActiveX Killbits for Windows Server 2008 x64 Edition (KB973346)
Update to .NET Framework 3.5 Service Pack 1 for the .NET Framework Assistant 1.0 x64 (KB963707)
Windows SharePoint Services 3.0 Service Pack 2 for x64 Edition (KB953338)
Microsoft .NET Framework 3.5 Service Pack 1 and .NET Framework 3.5 Family Update (KB951847) x64
Windows Update Agent 7.4.7600.226
Installing and configuring the mail server
Due to the nature of Microsoft Windows Small Business Server 2008, all components for the mail server are setup
upon initial installation of the OS.
Installing and configuring the Web server
Deploying WebBench data
WebBench includes data that must reside on the server and that the Web server must use. We loaded that data
and set the Web server to use it with the following procedure:
1. Copy the file wbtree.exe from the WebBench CD to the wwwroot directory on the system under test. (The
wbtree.exe file is on the WebBench CD at \wb50\workload.)
2. On the system, execute the wbtree.exe file. This program copies the WebBench workload to the system.
3. In the wwwroot folder on the system, create a new folder with the name CGI-BIN.
4. Copy the file simcgi.exe to the CGI-BIN folder.
5. Click StartÆProgramsÆAdministrative ToolsÆComputer Management to open the management console.
6. Navigate to Services and ApplicationÆInternet Information Services (IIS) ManagerÆServerName.
7. Click ISAPI and CGI Restrictions.
8. Click Add.
9. Enter the path for the simcgi.exe, and click the radio box saying allow extension path to execute.
Configuring Internet Information Services (IIS)
We configured the Windows Internet Information Services Web server as follows:
1.
2.
3.
4.
5.
6.
7.
8.
9.
10.
11.
12.
13.
14.
15.
Open Computer Management.
Navigate to Services and ApplicationÆInternet Information Services (IIS) ManagerÆServerName.
Click MIME Types.
In the MIME Types window, click Add.
In the File name extension field, type *.
In the MIME type field, type application/octet-stream, and click OK.
Click OK to exit the MIME Types window.
In the Computer Management window, select Services and ApplicationÆInternet Information Services
(IIS) ManagerÆServerName.
Click ISAPI and CGI Restrictions.
Click Edit Feature Settings.
Click the radio boxes Allow unspecified CGI module and Allow unspecified ISAPI modules.
Click OK.
Navigate to Services and ApplicationÆInternet Information Services (IIS) ManagerÆServerName.
Double-click Logging.
Click Disable.
Installing certificate services
Because WebBench includes tests that involve security, we installed Windows Certificate Services as follows:
Principled Technologies, Inc.: SMB workload performance comparison: AMD processor-based
Dell PowerEdge T105 vs. Intel processor-based Dell Vostro 220 Mini Tower
7
1.
2.
3.
4.
5.
6.
7.
8.
9.
10.
Navigate to Services and ApplicationÆInternet Information Services (IIS) ManagerÆServerName.
Click Server Certificates.
Click Create Self-Signed Certificate.
Name it Performance, and click OK.
Navigate to Services and ApplicationÆInternet Information Services (IIS)
ManagerÆServerNameÆSitesÆDefault Web Site.
Click Bindings....
Click Add.
Set the type to https, and set the SSL Certificate to Performance.
Click Yes when the warning pops up.
Click Close.
Creating SSL Communication
Finally, we had to enable SSL communication as follows:
1.
2.
3.
4.
5.
6.
7.
8.
Navigate to Services and ApplicationÆInternet Information Services (IIS) ManagerÆServerName.
Expand the Default Web site.
Expand wbtree.
Click Wbssl.
Click SSL Settings.
Check Require secure channel (SSL).
Check Require 128-bit encryption.
Click Apply.
We then set the following operating system tuning parameters to reflect the WebBench recommendation in the
Microsoft performance Tuning Guidelines for Windows Server document, which is available on Microsoft’s Web
site here: http://www.microsoft.com/whdc/system/sysperf/Perf_tun_srv.mspx. When creating the following
parameters, ensure that they are DWORD files, with decimal coding (rather than hexadecimal):
•
•
•
•
HKLM\System\CurrentControlSet\Services\Inetinfo\Parameters\MaxCachesFileSize to 1048576
HKLM\System\CurrentControlSet\Services\HTTP\Parameters\UriMaxUriBytes to 1048576
HKLM\System\CurrentControlSet\Control\FileSystem\NtfsDisableLastAccess to 1
HKLM\System\CurrentControlSet\Services\Tcpip\Parameters\MaxHashTableSize to 65535
Installing the mail test client
We began our testing by installing a fresh copy of Microsoft® Windows Server® 2003 R2, Enterprise x64 Edition
Service Pack 2 on the client. Before following these instructions, make sure to statically assign an IP address for
the client, and then plug that port into the system under test. This allows the client to correctly join the domain. We
followed this process for each installation:
1.
2.
3.
4.
5.
6.
Assign a computer name of Clientx for the mail client, where x is the client number.
For the licensing mode, use the default setting of five concurrent connections.
Enter a password for the administrator log on.
Select Eastern Time Zone.
Use typical settings for the Network installation.
Use Test for the workgroup.
To set up this server, we had to install several additional software components. The following subsections detail
the necessary installation processes.
Joining the domain
1. Right-click My Computer, and select Properties.
2. Under the Computer Name tab, click Change.
3. In the Computer Name Changes window, under the Member of section, select the Domain radial box, and
type test.
Principled Technologies, Inc.: SMB workload performance comparison: AMD processor-based
Dell PowerEdge T105 vs. Intel processor-based Dell Vostro 220 Mini Tower
8
4. Select OK to start joining the domain.
5. When the window appears asking for a person qualified on the domain, type root as the username and
Password1 as the password.
6. Click OK at the welcome pop-up window and the window warning that you must reset the computer for
the changes to take effect.
7. Click OK in the System Properties window.
8. When a pop-up appears asking if you want to restart now, click Yes to restart your computer.
Installing Internet Information Services 6.0
1. Select StartÆControl PanelÆAdd or Remove Programs.
2. Click Add/Remove Windows Components.
3. Click Active Directory Services, and make sure a check appears in the check box.
4. Select Application Servers, and click Details.
5. Select Internet Information Services (IIS), and click Details.
6. Click NNTP Services and SMTP Services, make sure a check appears in both check boxes, and click OK.
7. Click OK to close the Application Server window.
8. At the Windows Components Wizard, click Next to begin the installation.
9. When the system prompts you to do so, insert the OS CD, and click OK.
10. At the Completing the Windows Components Wizard window, click Finish.
11. Close the Add or Remove Programs window.
Installing Exchange Server 2007 and Load Generator
1. Insert the Microsoft Exchange Server 2007 CD. The CD should automatically launch the installation
software.
2. Click the link to Step 1: Install .NET Framework 2.0.
3. When you arrive at the download link, download the x64 version of the .NET Framework, and install.
4. Click the link to Step 3: Install Microsoft Windows PowerShell to open the download link.
5. When you arrive at the download link, download Microsoft Windows PowerShell, and install with defaults.
6. Search for and download .NET 2.0 SP1 x64.
7. Install SP1 with all defaults.
8. Click the link to Step 4: Install Microsoft Exchange Server 2007 SP1.
9. Click Next to go past the introduction screen.
10. Accept the license agreement, and click Next.
11. Select No for error reporting, and click Next.
12. Select Custom Exchange Server Installation, and click Next.
13. Check Management Tools, and click Next.
14. After the check finishes, click Install to start the installation process.
15. Once installation is complete, click Finish.
16. Download and install Load Generator using all defaults.
Preparing Load Generator
1. Select StartÆAll ProgramsÆMicrosoft ExchangeÆExchange Load Generator.
2. When the Load Generator window appears, select Start a new test.
3. Select Create a new test configuration, and click Continue.
4. In the Specify test settings window, type Password1 as the Directory Access Password and the Mailbox
Account Master Password, and click Continue with recipient management.
5. Make 50 users in the Mailbox Database, and click Continue.
6. To accept defaults for Advanced recipient settings, click Continue.
7. In the Specify test user groups window, select the plus sign to add a user group.
8. Change the Client Type to Outlook 2007 Online and the Action Profile to Average, and click Continue.
9. Leave defaults in Remote configurations, and click Continue.
10. Click Save the configuration file as, and name it Loadgencfg.
11. Click Start the initialization phase (recommended before running the test) to start initialization. The
initialization process might take a few hours.
Principled Technologies, Inc.: SMB workload performance comparison: AMD processor-based
Dell PowerEdge T105 vs. Intel processor-based Dell Vostro 220 Mini Tower
9
Backing up the mail database
On the test server, once you have set up LoadGen and created its initial mail database, you need to back up that
database so you can have clean copies for each test. Use this process to back up that database.
1. Select StartÆAll ProgramsÆMicrosoft Exchange Server 2007ÆExchange Management Console in the
mail server.
2. In the left pane, under Server Configuration, click Mailbox.
3. In the right pane, right-click Mailbox Database, and select Dismount Database from the menu.
4. Click Yes on the Do you want to continue? pop-up message.
5. Right-click Public Folder Database, and select Dismount Database from the menu.
6. Click Yes on the Do you want to continue? pop-up message. The red arrow appears when you’ve
dismounted the Public Folder Store.
7. Using Windows Explorer, create two new folders C:\backup\mailstore and C:\backup\publicstore.
8. With Windows Explorer, copy all files from C:\Program Files\Microsoft\Exchange Server\Mailbox\First
Storage Group to C:\backup\mailstore and all the files from C:\Program Files\Microsoft\Exchange
Server\Mailbox\Second Storage Group to C:\backup\publicstore. This process may take several minutes.
9. Close Windows Explorer.
10. In Exchange Management Console, right-click Mailbox Database, and select Mount Database from the
menu.
11. Right-click the Public Folder Database, and select Mount Database from the menu.
12. Close Exchange System Manager.
Setting up the run tests for additional applications
We used the following steps to perform each test.
1. Restart the Web Controller, Web clients, and Mail client.
2. Wait for everything to reboot.
3. Double-click the Web Controller shortcut on the desktop.
4. Navigate to the top bar and click ClientsÆStart Log In…
5. Restart all of the web clients.
6. Wait for all of the web clients to appear on the left side of the WebBench Controller Program.
7. Click OK.
8. Click Yes when the application prompts you if you would like to add a test suite.
9. Select ecommerce_cgi_template.tst
10. Give the run an appropriate name (e.g.: WB_Run1).
11. Click OK.
12. Open Exchange Load Generator on the Mail client.
13. Click Start a new test.
14. Select the radio button for Use the following saved configuration file.
15. Click Browse, and select the file 50users_average.xml.
16. Click OK, and click Continue.
17. In the Specify test settings screen, click Skip recipient management and continue with user group
configuration
18. In the Specify test user groups screen, leave default options selected, and click Continue.
19. In the Remote configurations screen, click Continue.
20. Stop at the Configuration summary screen.
21. Wait 10 minutes to allow all processes to finish loading on the server.
22. Click Yes at the Would you like to start executing the test suites screen.
23. Let WebBench run for 10 minutes before starting LoadGen.
24. In the Configuration summary screen, click Skip the initialization phase and run the simulation
immediately to begin LoadGen.
Principled Technologies, Inc.: SMB workload performance comparison: AMD processor-based
Dell PowerEdge T105 vs. Intel processor-based Dell Vostro 220 Mini Tower
10
Hand timing
Setting up the test workload
We used a specific test workload of three productivity applications a user would typically open on a small
business server: Microsoft Word 2007, Microsoft Excel 2007, and Adobe Reader. We describe the initial setup of
the test workload below.
For testing, we used the following files:
• Excel document: ftpbox.us.dell.com/slg/californ/dellware.xls
• Word document: www.dell.com/downloads/global/solutions/OMSA_Event_Management_System.doc
• PDF document: support.dell.com/support/edocs/systems/per710/multlang/GSG/DAO_BCC/YX389A01.zip
Setting up the test workload on the test system
1. Copy the Word file, the Excel file, and the PDF file onto the desktop of the system.
Opening a Microsoft Word file
This test requires a stopwatch. We used the OMSA_Event_Management_System_Mod.doc test document.
Setting up the test
1. Allow the system to idle for 5 minutes before starting the benchmarks.
2. Allow WebBench to run for 10 minutes, start LoadGen, and wait for 5 minutes before running the test.
Running the test
1. Right-click the OMSA_Event_Management_System_Mod.doc file, and place the cursor over Open.
2. Simultaneously click to open the test document and start the timer.
3. Stop the timer when the status bar displays the correct number of pages in the lower left corner of the
window.
4. Close Microsoft Word 2007.
Opening a Microsoft Excel file
This test requires a stopwatch. We used the dellware_mod.xls test document.
Setting up the test
1. Allow the system to idle for 5 minutes before starting the benchmarks.
2. Allow WebBench to run for 10 minutes, start LoadGen, and wait for 5 minutes before running the test.
Running the test
1. Right-click the dellware_mod.xls file, and place the cursor over Open.
2. Simultaneously click to open the test document and start the timer.
3. Stop the timer when the spreadsheet finishes loading.
4. Close Microsoft Excel 2007.
Opening an Adobe Reader file
This test requires a stopwatch. We used the YX389A01.pdf test document.
Setting up the test
1. Open the YX389A01.pdf file, and maximize the window.
2. In the left hand pane, click the Pages icon so that the page previews are showing.
3. Expand the left hand preview pane until all of the pages in the document are visible.
4. Navigate to Edit, Preferences.
5. In the Preferences window, select Documents under Categories, and click to check the Restore last view
settings when reopening documents box.
6. Close Adobe Reader, and restart the system.
7. Allow the system to idle for 5 minutes before starting the benchmarks.
8. Allow WebBench to run for 10 minutes, start LoadGen, and wait for 5 minutes before running the test.
Principled Technologies, Inc.: SMB workload performance comparison: AMD processor-based
Dell PowerEdge T105 vs. Intel processor-based Dell Vostro 220 Mini Tower
11
Running the test
1. Right-click the YX389A01.pdf file, and place the cursor over Open.
2. Simultaneously click to open the test document and start the timer.
3. Stop the timer when all of the pages have loaded in the preview pane.
4. Close Adobe Reader.
Principled Technologies, Inc.: SMB workload performance comparison: AMD processor-based
Dell PowerEdge T105 vs. Intel processor-based Dell Vostro 220 Mini Tower
12
Appendix A – Test system configuration information
Figure 9 provides detailed configuration information about each of the test server systems, which we list in
alphabetical order.
Servers
General
Number of processor packages
Number of cores per processor
package
Number of hardware threads per
core
Dell PowerEdge T105
Dell Vostro 220 Mini Tower
1
1
4
2
1
1
Balanced
Balanced
Total number
1
1
Wattage of each (W)
305
300
CPU
Vendor
AMD
Name
Opteron 1389
Stepping
Socket type
Core frequency (GHz)
Front-side bus frequency (MHz)
L1 cache (KB)
L2 cache (MB)
L3 cache (MB)
Platform
Vendor and model number
Motherboard model number
Motherboard revision number
BIOS name and version
BIOS settings
Memory module(s)
Vendor and model number
Type
Speed (MHz)
Speed in the system currently
running @ (MHz)
Timing/latency (tCL-tRCD-iRPtRASmin)
Size (GB)
Number of RAM modules
Chip organization
Hard disk
Vendor and model number
Number of disks in system
Size (GB)
Buffer size (MB)
C2
AM3
2.90
2,200
512
2
6
Intel
Core 2 Duo Desktop Processor
E8600
E0
LGA775
3.33
1,333
128
6
N/A
Dell PowerEdge T105
0P957K
A01
Dell 1.4.4 (7/30/2009)
Default
Dell Vostro 220 Mini Tower
G45M03
A00
Dell 1.2.0 (6/26/2009)
Default
Hynix HYMP125U72CP8-S6
PC2-6400E
800
Corsair CM2X22048-6400C5
PC2-6400
800
800
800
6-6-6-18
5-5-5-18
2
4
Dual-sided
2
2
Dual-sided
Seagate ST3300656SS
2
300
16
Seagate ST3320418AS
1
320
16
System power management policy
Power Supplies
Principled Technologies, Inc.: SMB workload performance comparison: AMD processor-based
Dell PowerEdge T105 vs. Intel processor-based Dell Vostro 220 Mini Tower
13
Servers
Dell PowerEdge T105
Dell Vostro 220 Mini Tower
RPM
Type
15,000
SAS
Controller
Dell SAS 6/iR Adapter Controller
Controller driver
Operating system
LSI Corp. 1.29.3.0 (10/14/2008)
7,200
SATA
Intel ICH10 Family 6 Port SATA
AHCI Controller
Intel 7.0.0.1000 (2/25/2008)
Windows Small Business Server
2008 Standard x64
6002
2
NTFS
ACPI x64-based PC
English
10
Windows Small Business Server
2008 Standard x64
6002
2
NTFS
ACPI x64-based PC
English
10
ATI ES 1000
Integrated
1,280 x 1,024
Microsoft 6.0.6001.18000
(6/21/2006)
Intel GMA X4500HD
Integrated
1,280 x 1,024
Microsoft 6.0.6001.18000
(6/21/2006)
Broadcom NetXtreme Gigabit
Ethernet BCM 5722
Integrated
Broadcom 12.2.2.1 (8/6/2009)
Intel PRO/1000 PT Dual Port
Adapter EXPI9402PT
PCI-Express
Intel 9.12.36.0 (7/8/2009)
Realtek Gigabit Ethernet
RTL8168/8111
Integrated
Realtek 6.226.729.2009 (7/29/2009)
Intel PRO/1000 PT Dual Port
Adapter EXPI9402PT
PCI-Express
Intel 9.12.36.0 (7/8/2009)
Dell DH-16D5S
DVD-ROM
Dell DH20N
DVD-ROM
Dell DH-16D5S
DVD-ROM
Dell DH20N
DVD-ROM
Name
Build number
Service Pack
File system
Kernel
Language
Microsoft DirectX version
Graphics
Vendor and model number
Type
Resolution
Driver
Network card/subsystem
Vendor and model number
Type
Driver
Additional network adapter
Type
Driver
Optical drive
Vendor and model number
Type
USB ports
Number of ports
Type of ports (USB 1.1, USB 2.0)
Figure 9: Detailed system configuration information for the two systems.
Principled Technologies, Inc.: SMB workload performance comparison: AMD processor-based
Dell PowerEdge T105 vs. Intel processor-based Dell Vostro 220 Mini Tower
14
About Principled Technologies
We provide industry-leading technology assessment and fact-based marketing services. We bring to every
assignment extensive experience with and expertise in all aspects of technology testing and analysis, from
researching new technologies, to developing new methodologies, to testing with existing and new tools.
When the assessment is complete, we know how to present the results to a broad range of target audiences. We
provide our clients with the materials they need, from market-focused data to use in their own collateral to custom
sales aids, such as test reports, performance assessments, and white papers. Every document reflects the results
of our trusted independent analysis.
We provide customized services that focus on our clients’ individual requirements. Whether the technology
involves hardware, software, Web sites, or services, we offer the experience, expertise, and tools to help you
assess how it will fare against its competition, its performance, whether it’s ready to go to market, and its quality
and reliability.
Our founders, Mark L. Van Name and Bill Catchings, have worked together in technology assessment for over 20
years. As journalists, they published over a thousand articles on a wide array of technology subjects. They
created and led the Ziff-Davis Benchmark Operation, which developed such industry-standard benchmarks as Ziff
Davis Media’s Winstone and WebBench. They founded and led eTesting Labs, and after the acquisition of that
company by Lionbridge Technologies were the head and CTO of VeriTest.
Principled Technologies, Inc.
1007 Slater Road, Suite 250
Durham, NC 27703
www.principledtechnologies.com
[email protected]
Principled Technologies is a registered trademark of Principled Technologies, Inc.
All other product names are the trademarks of their respective owners.
Disclaimer of Warranties; Limitation of Liability:
PRINCIPLED TECHNOLOGIES, INC. HAS MADE REASONABLE EFFORTS TO ENSURE THE ACCURACY AND VALIDITY OF ITS
TESTING, HOWEVER, PRINCIPLED TECHNOLOGIES, INC. SPECIFICALLY DISCLAIMS ANY WARRANTY, EXPRESSED OR
IMPLIED, RELATING TO THE TEST RESULTS AND ANALYSIS, THEIR ACCURACY, COMPLETENESS OR QUALITY, INCLUDING
ANY IMPLIED WARRANTY OF FITNESS FOR ANY PARTICULAR PURPOSE. ALL PERSONS OR ENTITIES RELYING ON THE
RESULTS OF ANY TESTING DO SO AT THEIR OWN RISK, AND AGREE THAT PRINCIPLED TECHNOLOGIES, INC., ITS
EMPLOYEES AND ITS SUBCONTRACTORS SHALL HAVE NO LIABILITY WHATSOEVER FROM ANY CLAIM OF LOSS OR DAMAGE
ON ACCOUNT OF ANY ALLEGED ERROR OR DEFECT IN ANY TESTING PROCEDURE OR RESULT.
IN NO EVENT SHALL PRINCIPLED TECHNOLOGIES, INC. BE LIABLE FOR INDIRECT, SPECIAL, INCIDENTAL, OR
CONSEQUENTIAL DAMAGES IN CONNECTION WITH ITS TESTING, EVEN IF ADVISED OF THE POSSIBILITY OF SUCH DAMAGES.
IN NO EVENT SHALL PRINCIPLED TECHNOLOGIES, INC.’S LIABILITY, INCLUDING FOR DIRECT DAMAGES, EXCEED THE
AMOUNTS PAID IN CONNECTION WITH PRINCIPLED TECHNOLOGIES, INC.’S TESTING. CUSTOMER’S SOLE AND EXCLUSIVE
REMEDIES ARE AS SET FORTH HEREIN.
Principled Technologies, Inc.: SMB workload performance comparison: AMD processor-based
Dell PowerEdge T105 vs. Intel processor-based Dell Vostro 220 Mini Tower
15