1
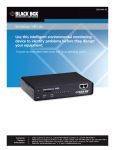
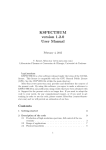
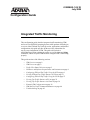
61202880L1-29.1E
July 2008
Configuration Guide
Integrated Traffic Monitoring
This configuration guide describes integrated traffic monitoring (ITM)
and its use on ADTRAN Operating System (AOS) products. Including an
overview of the ITM and Top Traffic processes, applications, and detailed
configurations, this guide provides all the necessary information for
step-by-step configuration of ITM. This guide also includes a
troubleshooting section outlining the proper uses of the show and debug
commands, which verify that ITM has been configured and is functioning
properly.
This guide consists of the following sections:
•
•
•
•
•
•
•
•
•
•
•
•
ITM Overview on page 2
ITM Process on page 2
Traffic Flow Data Collection on page 5
Hardware and Software Requirements and Limitations on page 8
Configuring ITM and Top Traffic Using the GUI on page 9
Viewing ITM and Top Traffic Statistics (GUI) on page 23
Configuring ITM and Top Traffic Using the CLI on page 27
Viewing Top Traffic Statistics (CLI) on page 32
Viewing Top Traffic Statistics via Email on page 34
Example ITM Configuration on page 36
ITM and Top Traffic Command Summaries on page 40
Troubleshooting on page 42
ITM Overview
Integrated Traffic Monitoring
ITM Overview
ITM is a method of tracking traffic flow patterns across interfaces on a network. ITM can monitor traffic
flows over both ingress (incoming) and egress (outgoing) interfaces. The traffic flow data is collected and
sent via Netflow 9 (RFC 768) over User Datagram Protocol (UDP) to either an external data collector or
through the internal Top Traffic data collector, analyzing the traffic flow patterns and presenting the
information in an intuitive graphic form.
ITM facilitates network configurations based on previous traffic flow patterns. By monitoring traffic
flows, decisions can be made regarding traffic engineering, traffic profiling, security measures, and quality
of service (QoS) issues. By providing a standardized method of recording, analyzing, and viewing
network traffic flow data, ITM helps network administrators make smart decisions regarding optimal
network configurations.
Traffic Engineering
Traffic engineering involves manipulating routed traffic based on captured traffic flow patterns.
Engineered routes travel through paths that would not have been used if standard routing procedures were
employed, resulting in a routing network that is malleable. By presenting captured traffic flow data, ITM
allows for traffic engineering on a per network basis. The captured traffic flow data aids in the
understanding of beginning-to-end traffic trends, and can be used to route traffic for load distribution
across multiple paths or to re-route traffic to a preferred path.
Traffic Profiling
Traffic can be profiled using ITM’s captured traffic flow data. By recording and analyzing where traffic is
entering and leaving the network, it becomes possible to understand the network traffic trends. Traffic
flow data can be recorded and sorted by interface, ingress/egress, time, protocol, or source/destination.
The traffic flow records present an overall view of the network, revealing where heavy traffic is flowing,
and where network resources should be allocated, both presently and for future network growth.
Security
ITM provides an extra level of network security through captured traffic flow data. Monitoring traffic on
the network reveals anomalies or changes in network behavior that need to be corrected.
Quality of Service
By keeping a record of the heaviest traffic flows, ITM shows bandwidth usage and indicates what type of
traffic is most frequent for certain IP addresses or interfaces, allowing for clear decisions to be made
regarding QoS allocations.
ITM Process
ITM functions by capturing traffic flow data and sending it to an external data collector and/or analyzer or
through the internal Top Traffic data collector. First, ITM captures traffic flow information, which is then
sent to a flow cache. The flow cache stores the information until it expires, at which time it is exported to
the specified data collector/analyzer.
2
Copyright © 2008 ADTRAN, Inc.
61202880L1-29.1E
Integrated Traffic Monitoring
ITM Process
The following illustration shows how ITM fits into the network.
IP Packet Flow
ITM Traffic Flow
Observation/
Data Collection
IP Packet Flow
Internet
LAN
AOS Product
Export collected
data
User
Terminal
External
Data Collector
Display collected
data
Figure 1. ITM Network Diagram
As traffic enters or exits the AOS product, ITM captures a snapshot of the traffic flow and exports the
information to the external data collector, or collects the information through Top Traffic. The external
data collector stores the gathered information, uses software to analyze it, and displays it on a user
terminal. The analyzed information can be used to determine traffic flow patterns on the network, and
make decisions accordingly. Top Traffic collects the information and produces listings of the hosts sending
the most data (Top Talkers) and the hosts receiving the most data (Top Listeners). A more detailed
overview of Top Traffic is located on page 7 of this guide.
Traffic Flow Data Criteria
ITM begins by capturing traffic flow information. As each IP packet arrives at an AOS product, it is
inspected for specific criteria. These criteria include the following:
•
•
•
•
•
•
•
•
Traffic flow type: whether the IP packet is incoming (ingress) or outgoing (egress)
Interface crossed: which interface the IP packet flows through on the AOS product
Source IP address: where the IP packet originated
Destination IP address: where the IP packet is destined
Type of service (ToS) octet: the 8-bit number that determines the traffic classification of the IP
packet and its per-hop behavior
Protocol type: which Layer 3 protocol is used to transport the IP packet
Source port: which port is used for IP packet ingress
Destination port: which port is used for IP packet egress
The IP packets are grouped based on these criteria. Groups of IP packets with similar attributes are called
traffic flows.
61202880L1-29.1E
Copyright © 2008 ADTRAN, Inc.
3
ITM Process
Integrated Traffic Monitoring
Traffic Flow Data Collection
Information about traffic flows is captured at observation points. Observation points in the ITM
application are most often network interfaces. On platforms with RapidRoute enabled, RapidRoute
architecture behaves as additional observation points by noticing any IP packets not already classified in a
traffic flow. The following illustration depicts the operation of observation points within the ITM
architecture.
IP Packet Traffic
AOS Product
Traffic flow data sent to
external data collector
Network Interface/
Observation Point:
Collects traffic flow
information
Top Traffic Collector:
Captures a snapshot of
traffic flow statistics
Export Process:
Exports expired traffic flow
entries to the external data
collector
Metering Process: Records
traffic flows and creates traffic
flow entries
Flow Cache: Stores traffic
flow entries until expiration
Figure 2. ITM Internal Process
Once traffic flows have been observed by an observation point, the observation point initializes a metering
process on the part of the flow cache.
Traffic Flow Data Sampling and Filtering
Sampling and filtering are two methods which provide a cross-section view of traffic flow while reducing
the amount of data collected and stored via ITM.
Sampling provides a snapshot of traffic flow activity. By reducing the amount of traffic flow data
collected, sampling minimizes memory and CPU usage. Sampling allows an interface to collect only one
of a specified number of IP packets that the interface is receiving or sending. To ensure an accurate
sampling of traffic flow patterns, the sampling method can be either random or fixed.
Filtering occurs by including an access control list (ACL) when ITM is enabled. By including an ACL in
ITM, undesired traffic can be filtered out of the accumulating traffic flow data. For example, all traffic to a
Web server could be filtered out if the monitoring focus is on abnormal traffic activity.
To further reduce the amount of traffic flow data collected, sampling can be used in conjunction with an
ACL. In this case, fewer data packets are inspected because of sampling, and the packets inspected are
filtered through the ACL for further reduction.
4
Copyright © 2008 ADTRAN, Inc.
61202880L1-29.1E
Integrated Traffic Monitoring
ITM Process
Traffic Flow Data Metering
The AOS product’s flow cache monitors the traffic flow information. It collects IP header information,
organizes the packets into traffic flows, and determines when traffic flows have expired and are ready for
export. Once the ITM flow cache has been notified by the network interface (observation point), it
organizes the traffic flows into flow entries and determines when the entries will be exported to the
external data collector.
Traffic Flow Data Storage
Traffic flow entries are stored in the flow cache until they expire. Entry expiration occurs in one of three
ways: (1) the configured expiration time has passed; (2) the Transmission Control Protocol (TCP)
connection between the cache and the flow collector has expired due to FINISH/RESET signaling; or
(3) critical configuration changes have been made (for example, changing the sampling rate). The default
mode of expiration is based on a configured number of minutes (default is 30 minutes) for the traffic flow
entry to be stored in the cache.
Traffic Flow Data Collection
There are a couple of options with regard to traffic flow data collection. Traffic flow data can be sent either
to an external collector, collected internally through Top Traffic, or both.
Traffic Flow Data Export to External Collector
External Data Collectors provide a more detailed view of traffic flow entries, but are not
required for ITM to function. Collected data may be sent to an external collector for more
detailed information, or sent through ITM’s internal Top Traffic data collector for general
usage overviews. ITM’s Top Traffic feature is detailed on page 7 of this guide.
Once the traffic flow entries have expired, they are ready for export. When exporting traffic flow data,
there are multiple types of information sent to the external flow data collector. There is data information
about each traffic flow, as well as system information about each traffic flow, and the traffic flow record
itself. The information about the traffic flow record is called a template. Templates are used to describe the
types and lengths of individual header fields within a traffic flow data record, and communicate to the
external data collector what type of information to expect in the ITM flow record. The following tables
describe the information contained in each template.
Table 1. Data Template Information
61202880L1-29.1E
Ingress Data Template
Egress Data Template
Source IP Address
Source IP Address
Destination IP Address
Destination IP Address
Transport Protocol Type
Transport Protocol Type
Source Port
Source Port
Destination Port
Destination Port
Copyright © 2008 ADTRAN, Inc.
5
ITM Process
Integrated Traffic Monitoring
Table 1. Data Template Information (Continued)
Ingress Data Template
Egress Data Template
Type of Service (ToS) Bits
Type of Service (ToS) Bits
Packets in a Flow
Packets in a Flow
Bytes in a Flow
Bytes in a Flow
Input Interface
Input Interface
System Up Time of First Packet
Output Interface
System Up Time of Last Packet
Next Hop IP Address
Flow Direction
System Up Time of First Packet
System Up Time of Last Packet
Flow Direction
Table 2. Options (System) Template Information
Active-Flow Timeout
Inactive-Flow Timeout
Sample Rate
Sampling Algorithm (Random)
Total Packets Exported to Collectors
Total Flows Exported to Collectors
Total Bytes Exported to Collectors
Templates are sent to the external data collector after a user-specified number of expired traffic flow entries
and are also re-sent periodically on a user-defined interval. The templates must be re-sent periodically
because UDP is often unreliable, and the collector may discard all traffic flow data lacking valid template
information.
From this point, the chosen external data collector receives and stores the traffic flow entries generated by
ITM. This information can be analyzed and viewed, depending on the capabilities of the chosen external
data collector.
For information on external data collector configuration, refer to the user guide or manual
for your particular collector type.
6
Copyright © 2008 ADTRAN, Inc.
61202880L1-29.1E
Integrated Traffic Monitoring
ITM Process
Top Traffic Internal Data Collector
Using the internal Top Traffic data collection feature of ITM, several of the most important flow cache
statistics can be viewed at a glance from within the router itself. The Top Traffic feature incorporates the
statistics of Top Talkers (top bandwidth users by source IP address), Top Listeners (top bandwidth users by
destination IP address), and Port Lists (amounts of traffic observed on specific ports) into easily viewed
output, accessed through either the command line interface (CLI) or Web-based graphical user interface
(GUI). These statistics are captured by the metering process at the traffic flow observation point, and
collected as traffic flow entries expire from the flow cache. These statistics allow the user to see the nature
of traffic being processed by the router without having to configure a separate server to collect data. The
following diagram depicts where the Top Traffic feature fits into the ITM process:
At expiration, traffic flow entries are
sent either to the internal Top Traffic
data collector, an external data
collector, or both.
Traffic flow data sent to
external data collector
IP Packet Traffic
AOS Product
Network Interface/
Observation Point:
Collects traffic flow
information
Export Process:
Exports expired traffic flow
entries to the external data
collector
Top Traffic Collector:
Captures a snapshot of
traffic flow statistics
Metering Process: Records
traffic flows and creates traffic
flow entries
Flow Cache: Stores traffic
flow entries until expiration
Figure 3. Top Traffic Feature in ITM
The internal Top Traffic data collector can be enabled instead of or in conjunction with an external data
collector, or it can operate with no external data collector configured. Because Top Traffic collects and
processes expired flow cache entries in a separate function from their exportation, it can function
independently of an external collector. With both an external data collector and Top Traffic enabled,
expired flow cache entries are sent to both the external data collector and through the Top Traffic collector.
With only an external data collector configured, no data is sent through the Top Traffic collector. With only
Top Traffic enabled, no data is sent to an external collector. The separation of Top Traffic collection from
external data collectors allows the Top Traffic collector, an external data collector, or both to be enabled.
61202880L1-29.1E
Copyright © 2008 ADTRAN, Inc.
7
Hardware and Software Requirements and Limitations
Integrated Traffic Monitoring
Hardware and Software Requirements and Limitations
ITM operates on ADTRAN Operating System (AOS) products that also support RapidRoute. The data
platforms include NetVanta 340, 344, 3130, 3200 (third generation only), 3305, 3430, 3448, 4305, and
5305. The voice products include the Total Access 900(e) Series, the NetVanta 6355, and the
NetVanta 7000 Series.
For a more detailed description of these products, refer to ADTRAN’s website at
www.adtran.com.
The ITM feature is available on AOS data products running firmware version 16.1 or later.
The Top Traffic feature is available on AOS data products running firmware version 17.1.1 or later.
Top Traffic web-based graphical information is available on AOS data products running firmware version
17.2.1 or later.
The ITM and Top Traffic (Top Talkers) features are available on AOS voice products running firmware
version A1.1 or later.
External Data Collector
For some networks, ITM can be enhanced by using external data collector. ITM currently employs
Netflow version 9 as an export protocol for maximum operability with external data collectors. External
data collectors provide a place for analyzing traffic flow data, and often contain software that presents the
data in graphical form. Collectors come in both purchased applications and freeware. Commercial
applications include IBM’s Aurora and IdeaData’s Traffic and Security Analysis, and freeware collectors
include NTOP, Flow-Viewer, and Plixer’s Scrutinizer.
ITM Limitations
Using ITM does slightly affect memory and CPU usage on your AOS product. Depending on the amount
of available memory, capturing large amounts of traffic flow data may fill up the flow cache. An increase
in memory or a reduction in data capture (by using sampling, for example) can alleviate this problem.
It is highly recommended that RapidRoute be enabled on your AOS product to keep ITM
memory and CPU usage to a minimum.
8
Copyright © 2008 ADTRAN, Inc.
61202880L1-29.1E
Integrated Traffic Monitoring
Configuring ITM and Top Traffic Using the GUI
ITM observes IP packet information in the traffic flow upon ingress or egress; it does not analyze the
traffic over its lifetime within the AOS product. As a result, ITM does not consider the execution details of
features like the following:
•
•
•
•
Internal routing modification using Policy Based Routing (PBR) and Virtual Routing and
Forwarding (VRF)
Packet encapsulation using Generic Routing Encapsulation (GRE), IPsec, and Virtual Private
Networks (VPNs)
Packet modification using Network Address Translation (NAT)
Packet replication using Multicast
While these features can be used on an AOS product with ITM enabled, do not expect to use ITM to
configure or diagnose problems with these types of applications.
ITM only monitors routed traffic, therefore, ITM is not available to monitor switch port interface traffic.
Top Traffic Limitations
The Top Traffic feature of ITM does not provide as much information as an external data collector. It
provides a snapshot of important traffic flow statistics (such as bandwidth information) through byte or
packet counts, and which addresses and ports are using the bandwidth resources. For smaller networks, the
Top Traffic feature allows a quick glance at traffic monitoring information from within the AOS product
itself without the use of an external data collector.
ADTRAN recommends that routers with high bandwidth or large flow counts have a large
sampling rate applied to the flow collector to reduce memory drain and maintain high
throughput performance. Failure to apply a sufficient sampling rate on a high-usage
router may result in adverse effects on the unit
Configuring ITM and Top Traffic Using the GUI
The following steps are required to implement ITM in AOS:
•
•
•
•
•
•
•
Enable ITM on selected ingress or egress interface(s).
Decide whether or not traffic will be sampled and/or filtered.
If filtering is chosen, create an ACL (if one does not already exist).
Determine sampling rate and type, if applicable.
Specify the amount of time traffic flow data is kept in the flow cache before it expires.
If using external collection, determine and specify the external data collector to which traffic flow
data will be exported.
• Specify how many IP packets will be exported before template information is sent.
• Specify how often template information will be re-sent.
If using Top Traffic collection, refer to Configuring Top Traffic Using the (GUI) on page 17 of this
guide.
61202880L1-29.1E
Copyright © 2008 ADTRAN, Inc.
9
Configuring ITM and Top Traffic Using the GUI
Integrated Traffic Monitoring
Accessing the GUI
To begin configuring ITM through the GUI, follow these steps:
1. Open a new Web page in your Internet browser.
2. Type your AOS product’s IP address in the Internet browser’s address field in the following form:
http://<ip address>.
For example: http://60.26.109.200
3. At the prompt, enter your user name and password and select OK.
The default user name is admin and the default password is password.
10
Copyright © 2008 ADTRAN, Inc.
61202880L1-29.1E
Integrated Traffic Monitoring
Configuring ITM and Top Traffic Using the GUI
4. Select Monitoring from the menu on the left.
Monitoring
Menu
5. Select IP Flow/Top Traffic from the Monitoring menu on the left.
61202880L1-29.1E
Copyright © 2008 ADTRAN, Inc.
11
Configuring ITM and Top Traffic Using the GUI
Integrated Traffic Monitoring
Enabling ITM Using the GUI
After the GUI has been accessed, ITM must be enabled on the interfaces you wish to monitor. Ingress and
egress parameters specify which traffic is to be monitored by Top Traffic and/or an external data collector.
Ingress, the most commonly used logging feature, specifies that incoming traffic is monitored, and egress
specifies that forwarded or outgoing traffic is monitored. Both ingress and egress traffic can be monitored
on an interface, depending on the desired configuration. Simply enabling ITM on an interface results in
using the default values for all user-configurable parameters. See Table 3 on page 27 for a complete list of
default values.
To enable ITM on a specific interface, follow these steps:
1. Select the Interface tab from the IP Flow/Top Traffic menu. On this tab, you will enable ITM to
monitor ingress or egress traffic on a specified interface.
2. To select an interface on which to enable ITM, check the box next to the interface to be monitored.
Checking the box will enable either ingress or egress ITM for that interface.
3. Select the correct ACL from the drop-down menu if you wish to filter ITM through an ACL on the
specified interface. Each interface can be monitored through ingress and/or egress, and ACLs can be
applied to both traffic directions.
For more information regarding the creation of ACLs, refer to the Configuring Policy
Based Routing configuration guide available on the AOS Documentation CD shipped
with your AOS product, or available on the Web at www.adtran.com.
12
Copyright © 2008 ADTRAN, Inc.
61202880L1-29.1E
Integrated Traffic Monitoring
Configuring ITM and Top Traffic Using the GUI
4. After enabling an interface and applying the desired ACL, select Apply to apply the settings. A message
reading Apply Successful! will appear at the bottom of the screen to confirm that ITM is enabled on
the chosen interfaces.
Configuring Sampling Options
To employ system-wide sampling on an interface with ITM enabled, determine the desired sampling rate.
By specifying a certain number of packets (out of a range of packets) for collection, less traffic data is
collected and stored while still providing an accurate view of traffic activity. To specify sampling rates,
follow these steps:
1. Select the Cache tab from the IP Flow/Top Traffic menu.
61202880L1-29.1E
Copyright © 2008 ADTRAN, Inc.
13
Configuring ITM and Top Traffic Using the GUI
Integrated Traffic Monitoring
2. In the Sample One-Out-Of field, enter the number of packets that will flow between data collection.
The range of packets is 1 to 255. If 1 is entered, every packet in a flow will be collected. If any number
up to 255 is collected, that number of packets will pass before another packet is collected.
3. Select the Sampling Type (random or deterministic).
Selecting random indicates that a packet collected from the packet flow will not be the same one every
time. For example, if random is selected, although 1 out of every 50 packets is collected, it will not be
the fiftieth packet every time, but will be a random packet between 1 and 100. Random sampling
provides a more accurate view of traffic flow patterns.
Selecting deterministic indicates that the packet collected from the packet flow will be the same one
every time. For example, if deterministic is selected, the 1 packet collected out of 50 will be the fiftieth
every time. Because of cyclical traffic patterns often found in networks, deterministic sampling
performs faster than random sampling but includes a risk of less accurate results.
For users of large routers (the NetVanta 5305 for example) sampling at a rate greater than
or equal to one out of every 100 packets is recommended.
4. Determine if traffic flow entry expiration defaults need to be changed.
14
Copyright © 2008 ADTRAN, Inc.
61202880L1-29.1E
Integrated Traffic Monitoring
Configuring ITM and Top Traffic Using the GUI
Setting Traffic Flow Entry Expiration
Traffic flow entries are the data collected about traffic flows. Entries are stored in the flow cache and are
termed either active or inactive. Active traffic flows refer to the maximum life of a single flow that
continues to have packets detected at the observation point; inactive traffic flows refer to idle flows which
no longer have packets detected at the observation point. When traffic flow entries expire, they are ready to
be exported to the flow collector. To set the expiration times for active and inactive traffic flows, follow
these steps:
1. Continuing with the cache tab, the expiration time for active flows in the appropriate box. The range of
storage time is 1 to 60 minutes, with a default expiration time of 30 minutes.
2. Enter the expiration time for inactive flows in the appropriate box. The range of storage time is 10 to
600 seconds, with a default expiration time of 15 seconds.
3. Select Apply to apply the settings.
Configuring Traffic Flow Export
Specifying a destination for traffic flow exportation allows the data collected to be sent to an external data
collector for analysis.
This feature can be used in conjunction with ITM Top Traffic. If only Top Traffic is being
used, traffic flow export does not need to be configured. For Top Traffic configuration
steps, refer to Configuring Top Traffic Using the (GUI) on page 17.
61202880L1-29.1E
Copyright © 2008 ADTRAN, Inc.
15
Configuring ITM and Top Traffic Using the GUI
Integrated Traffic Monitoring
Traffic flow data can be sent to two different destinations or port configurations. When specifying the
destination of traffic flow exports, several parameters can be included. To configure traffic flow export,
follow these steps:
1. Select the Export tab from the Traffic Monitoring menu.
2. Enter the IP address of the external data collector in the Destination Address field.
3. Enter the port destination for the ITM data in the UDP Port field.
4. In the Source Interface (optional) field, specify the interface from which to export data packets.
If using a VRF destination, the source interface must be on the same VRF as the
destination interface or it will be ignored. If the source is ignored, the routing table will
determine the source interface.
For more information on VRFs, refer to the Configuring Multi-VRF configuration guide
available on the AOS Documentation CD shipped with your AOS product, or available on
the Web at www.adtran.com.
5. Select Add at the bottom of the menu. Added destinations will appear below the Add button.
16
Copyright © 2008 ADTRAN, Inc.
61202880L1-29.1E
Integrated Traffic Monitoring
Configuring ITM and Top Traffic Using the GUI
Configuring Top Traffic Using the (GUI)
The internal Top Traffic data collector can be configured by either using the CLI or the GUI. To configure
Top Traffic, you must complete the following tasks:
•
•
•
•
•
•
•
Enable ITM on an interface.
Enter Top Traffic configuration mode.
Determine and specify the minute interval for which data will accumulate.
Determine and specify whether the Top Traffic listing will be sorted by packets or bytes.
Determine and specify the size of the Top Traffic list.
Determine and specify if an ACL will be used to filter the traffic monitoring data.
Optionally configure custom port monitoring.
To begin configuring Top Traffic using the GUI, follow these steps:
1. Open a new Web page in your Internet browser.
2. Type your AOS product’s IP address in the Internet browser’s address field in the following form:
http://<ip address>.
For example: http://60.26.109.200
3. Follow the steps for Accessing the GUI on page 10 and Enabling ITM Using the GUI on page 12 of this
guide.
4. To enter Top Traffic configuration mode via the GUI, select the Top-Traffic tab. Checking the box next
to Enable will enable the Top Traffic feature.
61202880L1-29.1E
Copyright © 2008 ADTRAN, Inc.
17
Configuring ITM and Top Traffic Using the GUI
Integrated Traffic Monitoring
5. Determine the minimum number of minutes that Top Talkers and Top Listeners data is accumulated.
Specify an interval option of 5, 10, and 15 minutes using the drop-down menu. When viewing Top
Traffic data, the current interval displayed will reflect the interval choice at this stage of configuration.
It is important to remember that once Top Traffic is configured, if the interval time is
changed, all data collected at the previous interval setting will be lost.
6. Determine and specify whether the Top Traffic will measure traffic by byte count or packet count.
• Top Talkers and Top Listeners measured by byte count display overall bandwidth consumption on
a host-by-host basis. Top Talkers hosts are identified by the source IP address that transmitted the
most data in bytes over a period of time (interval). The Top Listeners hosts are identified by the
destination IP address that received the most data in bytes over an interval.
• Top Talkers and Top Listeners measured by packet count display which hosts generated or received
the highest number of packets over a period of time. Using packet count to monitor hosts can make
it easier to identify the source of problems in cases where a host is infected by a virus, or when a
host is attacking the network with a port scan, sequentially generating large numbers of small
packets. In this case, the overall byte count generated by the host may not be large enough for that
host to show up on the Top Talkers list by byte count, but it would show up on the Top Talkers list
by packet count. The Top Listeners packet count will identify those hosts who have received the
most packets, making it easier to determine if a host is the subject of some sort of malicious traffic,
such as a denial of service attack.
• Monitoring by byte count or packet count are mutually exclusive and must be configured by the
user. The default statistic is number of bytes.
18
Copyright © 2008 ADTRAN, Inc.
61202880L1-29.1E
Integrated Traffic Monitoring
Configuring ITM and Top Traffic Using the GUI
To configure whether Top Traffic is monitoring byte counts or packet counts, select the appropriate option
from the drop-down menu.
If the statistic to be gathered is changed once Top Traffic is configured, all existing
data will be lost.
7. Determine the number of hosts that will be displayed in the Top Traffic listings. The range of host
listings is 1 to 20, with the default set at 5. To set the desired number of hosts listed in the Top Traffic
display, enter the appropriate number in the Top Listing Size field.
Specify desired
number of hosts
to list.
61202880L1-29.1E
Copyright © 2008 ADTRAN, Inc.
19
Configuring ITM and Top Traffic Using the GUI
Integrated Traffic Monitoring
8. If an ACL is to be used to filter the traffic for the Top Traffic lists, select an ACL from the drop-down
menu titled Match List. By default, no ACL is configured and all traffic is considered.
Select the desired
ACL from the
drop-down menu.
For more information regarding the creation of ACLs, refer to the Configuring Policy
Based Routing configuration guide available on the AOS Documentation CD
shipped with your AOS product, or available on the Web at www.adtran.com.
9. Once all options on the current screen have been determined and specified, Top Traffic is configured.
Select Apply at the bottom of the screen to apply the Top Traffic configuration. A message reading
Apply Successful! appears at the bottom of the screen to signal successful application.
20
Copyright © 2008 ADTRAN, Inc.
61202880L1-29.1E
Integrated Traffic Monitoring
Configuring ITM and Top Traffic Using the GUI
Configuring Custom Port Monitoring
By default, well-known TCP and UDP ports are monitored whenever Top Traffic is enabled. An additional
32 custom ports can be added to this list as desired, to help monitor ports used for file-sharing, gaming
applications, or common ports used by viruses. To add a custom port to the port monitoring list, follow
these steps:
1. Select the Monitor Port tab from the IP Flow/Top Traffic menu.
2. In the Monitor Port field, enter the port number to be monitored. Optionally, in the Monitor Port
Name field, you can add a description to specify an application name associated with this port.
61202880L1-29.1E
Copyright © 2008 ADTRAN, Inc.
21
Configuring ITM and Top Traffic Using the GUI
Integrated Traffic Monitoring
3. Select Add at the bottom of the screen to add this port to the port monitoring list. The added port will
appear in the listing at the bottom of the tab.
Newly Added Port
4. To remove ports from the custom list, check the box next to the desired port and select Remove Selected
Monitor Ports.
22
Copyright © 2008 ADTRAN, Inc.
61202880L1-29.1E
Integrated Traffic Monitoring
Viewing ITM and Top Traffic Statistics (GUI)
Viewing ITM and Top Traffic Statistics (GUI)
Both ITM and Top Traffic statistics can be viewed from the GUI.
Viewing ITM Statistics
The ITM GUI displays traffic flow export and flow cache statistics in a Web-based format. To view either
export or cache statistics, follow these steps:
1. Select IP Flow Statistics from the Monitoring menu on the left.
2. Select either the Export or Cache tab to view the statistics for traffic flow export or traffic flow cache
storage. Export details are shown in the illustration above, and include information about export status,
ITM version, number of flows exported, export failures, and the currently applied destination.
Cache details are shown in the illustration below, and include information about the cache size, entry
additions, and aging polls.
61202880L1-29.1E
Copyright © 2008 ADTRAN, Inc.
23
Viewing ITM and Top Traffic Statistics (GUI)
Integrated Traffic Monitoring
Viewing Top Traffic Statistics
1. To view the Top Traffic statistics, choose Top Traffic Statistics from the Monitoring menu on the left.
Top Traffic statistics can be viewed in hourly, 24-hourly, or daily increments. Each increment lists the
ranking of source IP addresses (Top Talkers), destination IP addresses (Top Listeners), and how many
bytes or packets were sent or received by each host. In this case, destination IP address does NOT mean the
receiver of information from the listed source IP address. The source and destination IP addresses are
independent of one another; the source hosts are the hosts sending the most information on the system, and
the destination hosts are the hosts receiving the most information on the system.
2. To view the port monitoring statistics, select either the Ports - 24 hour or Ports - day tab.
Ports are ranked with the most active first, listing the port number and description, and the amount of
traffic moving over the ports.
To clear Top Traffic statistics, select the Clear button at the bottom of the menu.
24
Copyright © 2008 ADTRAN, Inc.
61202880L1-29.1E
Integrated Traffic Monitoring
Viewing ITM and Top Traffic Statistics (GUI)
Viewing Top Traffic Graphical Information
1. To view the Top Traffic graphical information, choose Top Traffic Graphs from the Monitoring menu
on the left.
There are four options of Top Traffic graphs to view. The first graph displayed is the Summary graph,
which displays the total traffic in bytes or packets for either the last hour or the last 24-hour period. Other
optional graphic displays include Port Totals, Top Talkers, and Top Listeners. The Port Totals graph
displays total traffic in bytes or packets by port number, the Top Talkers graph displays traffic in bytes or
packets by source IP address, and the Top Listeners graph displays traffic in bytes or packets by
destination IP address. The Top Talkers and Top Listeners graphs can display traffic data for the current
interval, the current hour, or the current day. All graphs can be refreshed by selecting the Refresh Data
button at the bottom right of the graph, and all graph totals can be cleared by selected the Clear Data
button at the bottom left of the graph.
2. To view the traffic by port number, select the Port Totals tab.
61202880L1-29.1E
Copyright © 2008 ADTRAN, Inc.
25
Viewing ITM and Top Traffic Statistics (GUI)
Integrated Traffic Monitoring
3. To view the traffic by source IP address (Top Talkers), select the Top Talkers tab.
4. To view the traffic by destination IP address (Top Listeners), select the Top Listeners tab.
26
Copyright © 2008 ADTRAN, Inc.
61202880L1-29.1E
Integrated Traffic Monitoring
Configuring ITM and Top Traffic Using the CLI
Configuring ITM and Top Traffic Using the CLI
Both ITM and Top Traffic can be configured using the CLI.
To avoid confusion, it should be noted that the CLI commands configure Top Traffic with
“Top Talkers” commands.
Enabling ITM Using the CLI
To enable ITM on a specific interface, enter the interface configuration mode from the Global
configuration mode and use one of the two following commands:
(config-interface)#ip flow ingress
(config-interface)#ip flow egress
Ingress and egress parameters specify which traffic is to be monitored. Ingress, the most commonly used
logging feature, specifies that incoming traffic is monitored, and egress specifies that forwarded or
outgoing traffic is monitored. Both ingress and egress traffic can be monitored on an interface, depending
on the desired configuration. Use the no form of these commands to disable the traffic monitoring for
either incoming or outgoing traffic, as specified.
Both commands include an optional parameter for ACL traffic filtering. When including an ACL, the
command requires an ACL name. The command appears as follows:
(config-interface)#ip flow ingress <name>
In this form, <name> is the name of a previously created ACL. Using the no command disables traffic
monitoring on the interface and removes the association between a specific ACL and traffic monitoring.
For more information regarding the creation of ACLs, refer to page 5 of Configuring
Policy Based Routing available on the AOS Documentation CD shipped with your AOS
product, or available on the Web at www.adtran.com.
Simply enabling ITM on an interface results in using the default values for all user-configurable
parameters. The default values are described in the following table:
Table 3. ITM Default Parameters
Command
Default Value
ip flow [ingress | egress]
ITM is disabled on all interfaces by default.
ip flow export
Traffic flow data export is disabled by default.
ip flow export template refresh-rate <packets>
Template information is sent with the traffic flow
data to the export destination every 20 packets by
default.
61202880L1-29.1E
Copyright © 2008 ADTRAN, Inc.
27
Configuring ITM and Top Traffic Using the CLI
Integrated Traffic Monitoring
Table 3. ITM Default Parameters
Command
Default Value
ip flow export template timeout-rate <minutes>
Template information is re-sent to the export
destination every 30 minutes by default.
ip flow cache sample one-out-of <number>
[random | deterministic]
Sampling is disabled and every packet is
recorded. When enabled, sampling is set to
random.
ip flow cache timeout [active | inactive]
Active is 30 minutes; inactive is 15 seconds.
Any of the configured parameters can be changed at any time, once ITM is enabled; however, changing the
sample rate while enabled forces traffic flow entry expiration. Other configurations, such as disabling
traffic monitoring on an interface or changing expiration timers, will take place immediately but will not
force the expiration of any traffic flow entries.
Configuring Sampling
To employ sampling on an interface with ITM enabled, define the desired sample rate. By specifying a
certain number of packets out of a range of packets for collection, less traffic data is collected and stored
while still providing an accurate view of traffic activity. The following command is used to specify
sampling rates:
(config)#ip flow cache sample one-out-of <number> [random | deterministic]
For example, if you were configuring a sample rate of 1 packet out of every 200 for traffic monitoring on
any interface, the command would appear as follows:
(config)#ip flow cache sample one-out-of 200
Sampling can also be set to random or deterministic. Selecting random indicates that the one packet
collected from the packet flow will not be the same one every time. Selecting deterministic indicates that
the one packet collected from the packet flow will be the same one every time. By default, sampling is set
to random.
The command also supports a no parameter, which disables sampling. Sampling also has a range limit of 1
to 255 packets at a time.
For users of large routers (the NetVanta 5305 for example), sampling at a rate greater
than or equal to one out of every 100 packets is recommended.
Traffic Flow Entry Expiration
Traffic flow entries are the data collected about traffic flows. Entries are stored in flow cache and are
termed either active or inactive. Active traffic flows refer to single flows that continue to have packets
detected at the observation point; for example, with a long download. Active flows are forcibly expired in
30 minute intervals by default. Inactive traffic flows refer to idle flows which have no packets detected at
28
Copyright © 2008 ADTRAN, Inc.
61202880L1-29.1E
Integrated Traffic Monitoring
Configuring ITM and Top Traffic Using the CLI
the observation point after 15 seconds by default. When traffic flow entries expire, they are ready to be
exported to the data collector. By default, active traffic flow entries are forcibly expired in 30 minutes.
Also by default, traffic flows become inactive and expire after 15 seconds of inactivity. Use the following
commands to set the time that traffic flows are stored before expiration:
(config)#ip flow cache timeout active <minutes>
or
(config)#ip flow cache timeout inactive <seconds>
Active traffic flows are cached for 1 to 60 minutes, and inactive traffic flows are stored for 10 to
600 seconds, depending on preference. The no form of the command resets the expiration time to the
default (active is 30 minutes, inactive is 15 seconds). The following is the syntax of the no form of the
command:
(config)#no ip flow cache timeout active <minutes>
or
(config)#no ip flow cache timeout inactive <seconds>
Traffic Flow Export
Specifying a destination for traffic flow exportation allows the data collected to be sent to an external data
collector for analysis. Traffic flow data can be sent to two different destinations or port configurations.
When specifying the destination of traffic flow exports, several parameters can be included.
VRF locations can be specified by adding a VRF <name> parameter to the command. VRFs allow a single
physical router to be partitioned into two or more virtual routers, each with its own route table, routing
protocols, and IP addresses. Traffic being forwarded to one router instance is prevented from spilling over
into any other router instances. The VRF parameter in traffic monitoring allows for the designation of a
particular VRF as the destination of the traffic flow data.
For more information on VRFs, refer to Configuring Multi-VRF available on the AOS
Documentation CD shipped with your product, or available on the Web at
www.adtran.com.
The destination parameter for the traffic flow data must be specified, and includes the IP address of the
forwarding location, as well as the UDP port number. If using the VRF option, the IP address and port
number will correspond to the chosen VRF.
A source interface can also be specified. Specifying a source sets a source interface to send the data export
packets. If using a VRF destination, the source must be on the same VRF as the destination or it will be
ignored. If the source is ignored, the routing table will determine the source interface. The source
parameter includes the specification of the interface through the <interface> parameter. Specify an
interface in the format <interface type [slot/port | slot/port.sub-interface id | interface id | interface
id.sub-interface id]>. For example, for a T1 interface, use t1 0/1; for an Ethernet sub-interface, use eth
0/1.1; for a PPP interface, use ppp 1; and for an ATM sub-interface, use atm 1.1. Type ? at the source
parameter for a complete list of valid interfaces.
61202880L1-29.1E
Copyright © 2008 ADTRAN, Inc.
29
Configuring ITM and Top Traffic Using the CLI
Integrated Traffic Monitoring
The export command also includes a no parameter. The no parameter precedes the command and disables
the export functionality, or removes an associated destination if multiple entries are specified.
With all the optional parameters, the traffic flow export command appears as follows:
(config)#ip flow export vrf <name> destination <ip address> <port> source <interface>
Enter this command from the configuration mode to configure the traffic flow data exportation path.
Additional Export Commands
As previously mentioned, exporting templates is part of the ITM export functionality. Templates are
automatically sent based on a user-configured packet count and re-sent based on a user-configured timeout
rate.
To configure the number of packets sent before template information is exported, use the following
command:
(config)#ip flow export template refresh-rate <packets>
<packets> refers to the number of packets to be sent before the template information is sent. The
command also includes a no parameter, which resets the template exportation to the default value. The
default value is 20 packets, but the range of packets that can be specified is 1 to 600.
To configure how often template information is re-sent to specified export destinations, use the following
command:
(config)#ip flow export template timeout-rate <minutes>
Using the no form of the command resets the timeout rate to the default time of 30 minutes, although the
range of time that can be specified is 1 to 3,600 minutes.
Configuring Top Traffic Using the CLI
To begin configuring the Top Traffic feature of ITM, ITM must be enabled on an interface. For details on
how to enable ITM on an interface, refer to Enabling ITM Using the GUI on page 12 or Enabling ITM
Using the CLI on page 27 of this guide.
Enabling Top Traffic/Entering Top Traffic Configuration Mode
Once an interface has ITM enabled, from the Global configuration mode enter the Top Traffic
configuration mode using the following command:
(config)#ip flow top-talkers
(config-top-talkers)#
The ip flow top-talkers command enables Top Traffic functionality and leads to the Top Traffic
configuration mode. By default, Top Traffic is disabled. Use the no version of the command to disable all
Top Traffic collection processes and remove all associated settings.
30
Copyright © 2008 ADTRAN, Inc.
61202880L1-29.1E
Integrated Traffic Monitoring
Configuring ITM and Top Traffic Using the CLI
From the Top Traffic configuration mode, Top Traffic functionality can be configured. Configurable
parameters include the time interval for which Top Traffic data will accumulate, if data will be gathered by
packet or byte observation, how many Top Talkers will be displayed, whether or not an ACL will be used
to filter Top Traffic data, and (optionally) adding custom ports to the port monitoring feature.
Setting the Data Accumulation Interval
To set the minimum amount of time that Top Traffic data is accumulated before it is reported, use the
interval command as shown in the following example:
(config)#ip flow top-talkers
(config-top-talkers)#interval [5 | 10 | 15]
You can choose between 5-minute, 10-minute, and 15-minute intervals for data accumulation. The default
interval is 5 minutes, which indicates that data is collected for 5 minutes, and then available for viewing.
When viewing Top Traffic data, the current interval displayed is the interval set with this command. As the
specified interval for data accumulation ends, the data is compiled into hourly, 24-hourly, and daily
readouts.
Use the no form of this command to reset the interval value to its default (5 minutes).
Specifying Packet or Byte Data Collection
Data used in the Top Traffic collection can be collected by monitoring the number of packets sent or
received or the number of bytes sent or received in a specified amount of time. Collection by byte count
and packet count are mutually exclusive and must be configured by the user, yet each can be helpful
depending on specific network needs. Using packet counts to monitor hosts can make it easier to identify
the source of problems in cases where a host is infected by a virus or attacking the network with a port
scan. Using byte counts can display overall bandwidth consumption on a host-by-host basis. The default
statistic used in Top Traffic is byte count.
If the statistic to be gathered is changed once Top Traffic is configured, all existing data
will be lost.
To specify the statistic for displaying Top Traffic information, use the sort-by command as shown in the
following example:
(config)#ip flow top-talkers
(config-top-talkers)#sort-by [packets | bytes]
Use the no form of this command to return to the sorting procedure to the default setting (bytes).
Specifying Listing Size
You can specify the number of Top Talkers included in the Top Traffic report. The list can include one to
20 listings, depending on network needs. To set the number of Top Talkers displayed, use the following
command:
(config)#ip flow top-talkers
61202880L1-29.1E
Copyright © 2008 ADTRAN, Inc.
31
Viewing Top Traffic Statistics (CLI)
Integrated Traffic Monitoring
(config-top-talkers)#top <number>
Enter the number of listings desired after the top parameter. The default number is 5.
Use the no form of this command to return to the default number.
Using an ACL with Top Traffic
An ACL can be used to filter the traffic monitoring data to be used in the Top Traffic listings. By using an
ACL, it is possible to narrow the types of hosts that will be reported by ITM’s Top Traffic function. To
include an ACL in Top Traffic functionality, use the following command:
(config)#ip flow top-talkers
(config-top-talkers)#match list <name>
In this case, the <name> parameter is the name of a previously created ACL. Use the no form of this
command to reset the match list command to its default state. By default, no ACL is used and, therefore,
all traffic is considered.
For more information regarding the creation of ACLs, refer to the Configuring Policy
Based Routing configuration guide available on the AOS Documentation CD shipped
with your AOS product, or available on the Web at www.adtran.com.
Adding Custom Ports
Up to 32 custom ports can be added to the port monitoring list, that monitors well-known TCP and UDP
ports whenever Top Traffic is enabled. To add a custom port to the port monitoring list, use the following
command:
(config)#ip flow top-talkers
(config-top-talkers)#monitor port <number> <description>
The <number> parameter is the port number and the optional <description> parameter is the application
name associated with the port. Use the no form of the command to remove a port from the port monitoring
list.
Viewing Top Traffic Statistics (CLI)
To view the Top Traffic statistics using the CLI, use the show ip flow top-talkers command and the show
ip top-talkers port command. These commands are detailed in the following section.
The output of all show commands can be limited by appending a modifier to the end of the
command. Appropriate modifiers are: begin <text>, exclude <text>, and include <text>.
The begin modifier displays the first line of output that contains the specific text and all
sequential lines, the exclude modifier excludes any lines with the specific text from the
output, and the include modifier limits output to lines that contained the specific text.
32
Copyright © 2008 ADTRAN, Inc.
61202880L1-29.1E
Integrated Traffic Monitoring
Viewing Top Traffic Statistics (CLI)
show ip flow top-talkers
The show ip flow top-talkers command displays the list of IP addresses (hosts) that generated the most IP
traffic during the current interval being accumulated. If the optional parameters of hour or day are used,
data from the currently accumulating hour or 24-hour period is displayed. The detail keyword also
displays the previously accumulated intervals.
For example, entering the command as follows shows the current hourly interval, as well as the previous
twelve intervals:
>enable
#show ip flow top-talkers hour detail
In the following example, the display results are data from the 24-hour period currently being accumulated
and hourly data from the previous 24-hour period:
>enable
#show ip flow top-talkers day detail
The following is an example of what is seen from the show ip flow top-talkers command using the hour
keyword:
# show ip flow top-talkers hour
0--------1---------2---------3---------4---------5---------6---------7---------8
12345678901234567890123456789012345678901234567890123456789012345678901234567890
Current Hour Top Talkers:
Top Traffic Sources:
SrcIPaddress
Bytes
10.10.19.1
1.1M
172.30.216.196
978K
10.10.18.1
844K
10.162.37.71
725K
10.92.231.235
257K
Top Traffic Destinations:
DestIPAddress
Bytes
10.10.19.1
3.5M
10.10.18.1
958K
172.30.216.196
735K
10.92.231.235
457K
10.162.37.71
129K
Top 5 talkers shown. 16 flows processed
Top Traffic Destinations statistics do not correspond directly to Top Traffic Sources. The
Top Traffic Sources data refers to the Top Talkers for the data accumulation interval, and
Top Traffic Destinations data refers to the Top Listeners for the data accumulation
interval.
61202880L1-29.1E
Copyright © 2008 ADTRAN, Inc.
33
Viewing Top Traffic Statistics via Email
Integrated Traffic Monitoring
show ip flow top-talkers port
The show ip flow top-talkers port command displays the list of monitored ports and the amount of traffic
that has been observed on each port. The optional detail parameter breaks down port activity by the hour.
For example, entering the command as follows results in the following sample output:
>enable
#show ip flow top-talkers port
Current Day Top Talkers Port
Top Ports
Packets
1. (8080)
7167
2. domain (53)
342
3. netbios-ns (137)
245
4. www (80)
88
5. netbios-ss (139)
50
6. netbios-dgm (138)
47
7. https (443)
6
8. ntp (123)
2
9. bootps (67)
1
10. bootpc (68)
1
These ports account for 7949 of 9799 total packets.
Viewing Top Traffic Statistics via Email
Using AOS’s mail agent, Top Traffic statistical information can be received via email. The mail agent
places CLI output from running commands into the body of an email message, and can be configured to
email the output at user-specified intervals. The following section describes the commands necessary for
employing the mail agent for Top Traffic notification.
ADTRAN’s mail agent can only be configured using the CLI. Refer to the Mail Agent
Quick Configuration Guide for more information on general mail agent configurations
and applications. The Mail Agent Quick Configuration Guide is available on the AOS
Documentation CD shipped with your AOS product, or available at www.adtran.com.
34
Copyright © 2008 ADTRAN, Inc.
61202880L1-29.1E
Integrated Traffic Monitoring
Viewing Top Traffic Statistics via Email
After configuration of the mail agent and its parameters as outlined in the Mail Agent Configuration Guide,
use the following configuration example to initialize email notification of Top Traffic statistics through a
named mail client:
Parameters in italics indicate examples, and should be replaced by parameters specific to
individual needs. For more specific command descriptions, applications, and limitations,
refer to the AOS Command Reference Guide or the Mail Agent Quick Configuration
Guide, available on the AOS Documentation CD shipped with your AOS product, or
available at www.adtran.com.
(config)#logging email receiver-ip <hostname>
(config)#logging email sender <email address>
(config)#mail-client <client name>
(config-mail-client-client name)#address to <email address>
(config-mail-client-client name)#server <ip address>
(config-mail-client-client name)#subject <text>
(config-mail-client-client name)#capture commands <commands>
(config-mail-client-client name)#send trigger track <track> <state>
(config-mail-client-client name)#no shutdown
In the following example, Joe at Company will receive an email entitled Top Traffic data for top-talkers
and port statistics through his mail agent client (named TopTrafficData) sent when the state change of
track named traffic occurs:
(config)#logging email receiver-ip smtp.company.com
(config)#logging email sender [email protected]
(config)#mail-client TopTrafficData
(config-mail-client-TopTrafficData)#address to [email protected]
(config-mail-client-TopTrafficData)#server 172.22.48.76
(config-mail-client-TopTrafficData)#subject Top Traffic data
(config-mail-client-TopTrafficData)#capture commands
#do show ip flow top-talkers
#do show ip flow top-talkers port
#exit
(config-mail-client-TopTrafficData)#send trigger track traffic pass
(config-mail-client-TopTrafficData)#no shutdown
When using mail agent for Top Traffic email notification, only output of the show ip flow top-talkers
command and its variants can be captured. Command output is captured from the Global Configuration
mode, so the do parameter must be included in the command to capture.
61202880L1-29.1E
Copyright © 2008 ADTRAN, Inc.
35
Example ITM Configuration
Integrated Traffic Monitoring
Example ITM Configuration
In the following example, ITM is used to capture network usage information to more accurately determine
network availability and possible congestion problems. In this example, ITM, along with Top Traffic,
provides information about who is using the network, where the network traffic is going, and the peak time
of network usage. These factors allow a study of network patterns and user behavior in order to configure
the network to avoid congestion problems during peak times.
The following illustration is an overview of the configured ITM process.
Engineering
LAN
Observation Point
(Eth 0/1 Interface)
User 1
208.61.209.4
Monitored
IP Packet Flow
User 2
208.61.209.2
Ethernet
Ethernet
Internet
AOS Product
User 3
208.61.209.3
Data Collector
208.61.209.5
Analyzer
Terminal
208.61.209.6
Figure 4. ITM Configuration Diagram
It is assumed for the purposes of this example that RapidRoute has already been enabled
on your AOS product.
To capture the desired network information, ITM is enabled on ingress for the ethernet 0/1 interface from
the interface configuration mode. An ACL, named engineering, is specified to help keep the AOS
product’s memory and CPU usage to a minimum, as well as add an extra dimension of network security.
(config)#interface ethernet 0/1
(config-eth 0/1)#ip flow ingress engineering
36
Copyright © 2008 ADTRAN, Inc.
61202880L1-29.1E
Integrated Traffic Monitoring
Example ITM Configuration
From the Global configuration mode, the export destination is set to the external data collector at the IP
address 208.61.209.5 through the UDP port 1010.
(config)#ip flow export destination 208.61.209.5 1010
By default, if no source interface is specified, the router interface at the hop closest to the
data collector will be sourced. Most often, a source will only need to be specified for
security purposes. For example, if an ACL is active on the external data collector, a source
interface may need to be specified.
The following GUI entries set the same parameters:
61202880L1-29.1E
Copyright © 2008 ADTRAN, Inc.
37
Example ITM Configuration
Integrated Traffic Monitoring
In order to get a more accurate cross section of network traffic flow patterns, the time-out rates for
template export and active flow cache will be changed from their defaults. By changing the time-out rates
from the default 30 minutes to 15, a more detailed picture can be achieved in analysis. To change these
values from the defaults, enter these CLI commands:
(config)#ip flow cache timeout active 15
(config)#ip flow export template timeout-rate 15
Sampling, randomized at a rate of 1-out-of 100, is employed from the Global configuration prompt to help
minimize the CPU and memory usage of the AOS product, while still creating an accurate picture of traffic
flow information.
(config)#ip flow cache sample one-out-of 100 random
The following GUI entries also set these values:
To verify that the ITM is configured properly, use the ITM show ip flow commands (detailed on page 45
of this guide) or the GUI IP Flow Statistics menu (detailed on page 23).
In this example, Top Traffic functionality is also employed in addition to the external data collector. Top
Traffic is configured to accumulate data for 10-minute intervals, to monitor packet counts, and to show the
10 Top Talkers. Top Traffic is also set to filter traffic through the same ACL as ITM (engineering), and is
not set to monitor any custom ports. The following CLI commands set these values:
(config)#ip flow top talkers
(config-top-talkers)#interval 10
(config-top-talkers)#sort-by packets
(config-top-talkers)#top 10
(config-top-talkers)#match list engineering
38
Copyright © 2008 ADTRAN, Inc.
61202880L1-29.1E
Integrated Traffic Monitoring
Example ITM Configuration
The following GUI entries also set these values:
To view the Top Traffic data, use the Top Traffic show ip flow top-talkers commands as detailed on
page 45 of this guide, or the GUI Top Talkers Statistics tab as detailed on page 23 of this guide.
61202880L1-29.1E
Copyright © 2008 ADTRAN, Inc.
39
ITM and Top Traffic Command Summaries
Integrated Traffic Monitoring
ITM and Top Traffic Command Summaries
The following table describes each configuration command for using ITM.
Table 4. ITM Command Summary
Access Prompt
Command
Command Description
(config-interface)#
[no] ip flow ingress [<name>]
Enables monitoring of all traffic
received on an interface with
optional ACL filtering.
(config-interface)#
[no] ip flow egress [<name>]
Enables monitoring of all traffic
an interface is forwarding with
optional ACL filtering.
(config)#
[no] ip flow cache sample
one-out-of <number>
[random | deterministic]
Configures an interface to
sample only a subset of the
packets it receives or sends and
the method of sampling.
(config)#
[no] ip flow export [vrf
<name>] destination <ip
address> <port> [source
<interface>]
Enables export functionality and
sets a destination for export
packets with an optional
specification of source of
packets for export.
(config)#
[no] ip flow export template
refresh-rate <packets>
Specifies the number of packets
sent before template definition
information is sent.
(config)#
[no] ip flow export template
timeout-rate <minutes>
Specifies how often template
information is periodically
re-sent to destinations.
(config)#
[no] ip flow cache timeout
[active <minutes> | inactive
<seconds>]
Specifies the time traffic flow
entries are kept before they
expire and are exported.
For specific details regarding the optional parameters for each command, refer to
Configuring ITM and Top Traffic Using the CLI on page 27.
40
Copyright © 2008 ADTRAN, Inc.
61202880L1-29.1E
Integrated Traffic Monitoring
Top Traffic Command Summary
Top Traffic Command Summary
The following table describes each configuration command for using Top Traffic.
Table 5. Top Traffic Command Summary
Access Prompt
Command
Command Description
(config)#
[no] ip flow top-talkers
Enables the collection of Top
Traffic information and/or
switches to Top Traffic
configuration mode.
(config-top-talkers)#
[no] top <number>
Specifies the number of Top
Talkers included in the Top
Traffic report. Range is 1 to 20
listings.
(config-top-talkers)#
[no] sort-by [bytes | packets]
Specifies whether Top Traffic will
be collected by monitoring
packets or bytes sent or
received.
(config-top-talkers)#
[no] match list <name>
Specifies an ACL be used to
filter the data that can be used in
Top Traffic listings.
(config-top-talkers)#
[no] interval [5 | 10 | 15]
Specifies the minimum interval
Top Traffic data is accumulated.
(config-top-talkers)#
[no] monitor port <number>
<description>
Specifies the addition of a
custom port to Top Traffic port
monitoring capabilities.
61202880L1-29.1E
Copyright © 2008 ADTRAN, Inc.
41
Troubleshooting
Integrated Traffic Monitoring
Troubleshooting
There are two methods for troubleshooting ITM. Troubleshooting can be done from either the GUI or the
CLI. The GUI method gives you information regarding the entire system, whereas the CLI method gives
you information specific to the configuration of ITM and Top Traffic. Both methods are described in the
following sections.
GUI Troubleshooting
The GUI method of troubleshooting works well for monitoring the overall system through a system health
description and alert system, as well as through GUI debugging ability.
To access GUI troubleshooting, follow these steps:
1. Select the Troubleshooting from the Utilities menu on the GUI.
2. Check the box next to each category of troubleshooting information you wish to view. The previous
menu gives you an idea of the information collected in GUI troubleshooting. Messages below the
selected items are color coded for visibility. Messages in green are satisfactory, messages in orange
indicate a warning, and messages in red indicate an error. On the previous menu, for example, the
physical interfaces information is in red because there is no physical connection.
42
Copyright © 2008 ADTRAN, Inc.
61202880L1-29.1E
Integrated Traffic Monitoring
Troubleshooting
To access GUI debugging abilities, follow these steps:
1. Select Debug Unit from the Utilities menu.
2. Select the Add Debug Filter button and choose the desired item to debug from the following Category
drop-down menu. Select Apply when correct item is chosen.
The item you have selected to debug will appear in the Debug Category tab in the middle of the screen.
61202880L1-29.1E
Copyright © 2008 ADTRAN, Inc.
43
Troubleshooting
Integrated Traffic Monitoring
3. You can then select Start Debug and begin receiving debug information for the item you selected.
CLI Troubleshooting
After configuring ITM, several different commands can be issued from Enable mode in the CLI to assist in
troubleshooting. These commands are detailed in the following table.
Table 6. AOS ITM with Top Traffic Troubleshooting Command Summary
Command
Explanation
#show ip flow export
Displays information on export packets sent to a destination.
#show ip flow cache
Displays a summary of the current state of the cache of
non-expired traffic flows.
#show ip flow interface
Displays the ITM configuration of each interface on the router.
#show ip top talkers
Displays the list of hosts that generated the most IP traffic during
the current interval.
#show ip top-talkers port
Displays the list of application ports and the amount of traffic that
has been observed on each port.
#debug ip flow cache entry
Prints a debug message every time traffic flow data is added to
the flow cache.
#debug ip flow cache expiration
Prints a debug message every time traffic flow data has expired
from the flow cache.
#debug ip flow export
Prints a debug message every time a message is sent to an
external data collector.
#clear ip flow stats
Clears all statistics associated with an ITM observation point.
#clear ip flow top-talkers
Clears all statistics associated with ITM Top Traffic listings.
44
Copyright © 2008 ADTRAN, Inc.
61202880L1-29.1E
Integrated Traffic Monitoring
Troubleshooting
Show Commands
Use the show ip flow commands to display information pertinent to ITM configuration on your AOS
product and to reveal possible problems in the configuration.
The output of all show commands can be limited by appending a modifier to the end of the
command. Appropriate modifiers are: begin <text>, exclude <text>, and include <text>.
The begin modifier displays the first line of output that contains the specific text and all
sequential lines, the exclude modifier excludes any lines with the specific text from the
output, and the include modifier limits output to lines that contained the specific text.
Use the show ip flow export command to view the traffic flow export statistics. This command displays
the current configuration of traffic flow export—–its version, export destinations, sources, traffic flows
exported, and the number of traffic flows that failed to export. The command also displays the reason for
failed or dropped IP packets.
The following is sample output from the show ip flow export command:
#show ip flow export
Traffic Flow export is ENABLED
Version: 9
Export Destinations
10.22.16.132 : 9991
vrf BLUE
source ppp 1
10.5.22.203 : 30000
11 flows exported in 8 udp datagrams
0 flows failed to export
If any numbers appear in the flows failed to export section, you can determine where the problem lies and
reconfigure the ITM export process appropriately.
To view the current status of the flow cache holding all active traffic flows, use the show ip flow cache
command. Output from this command provides a summary of the flow cache. From this command, you
can determine information such as if the cache is becoming congested or if the aging poller is updating
slowly.
The following is sample output from the show ip flow cache command:
#show ip flow cache
IP Traffic Flow Cache
Size: 682/4096 entries
8206 total entries added
95545 aging polls, last aging poll occurred 3 seconds ago
61202880L1-29.1E
Copyright © 2008 ADTRAN, Inc.
45
Troubleshooting
Integrated Traffic Monitoring
Use the show ip flow interface command to display configuration parameters for each interface on the
AOS product. This command displays which interfaces are configured for ITM, whether they are enabled
for ingress or egress monitoring, and whether they are configured for sampling. The following is sample
output from an AOS product with an Ethernet interface and a point-to-point interface configured for ITM:
#show ip flow interface
eth 0/1
ip flow ingress
ppp 1
ip flow ingress
ip flow egress
This display informs you that the Ethernet interface on port zero/slot one (eth 0/1) is set to monitor ingress
traffic flows, and that point-to-point interface one (ppp 1) is set to monitor both ingress and egress traffic
flows.
Use the show ip flow top-talkers commands to display information pertinent to ITM Top Traffic
configuration on your AOS product and to reveal possible problems in the configuration.
Use the show ip flow top-talkers [hour | day] [detail] command to view the list of IP addresses that
generated the most IP traffic during the current interval. Using only the show ip top-talkers command
results in the display of data from the configured interval (5-, 10-, or 15-minute) currently being
accumulated. If the hour keyword is specified, the data from the hour currently being accumulated is
displayed. If the day keyword is specified, the data from the 24-hour period currently being accumulated is
displayed. Using the optional detail keyword displays the information for previous intervals as well as the
current interval.
46
Copyright © 2008 ADTRAN, Inc.
61202880L1-29.1E
Integrated Traffic Monitoring
Troubleshooting
The following is sample output from the show ip flow top-talkers hour detail command:
# show ip flow top-talkers hour detail
0--------1---------2---------3---------4---------5---------6---------7---------8
12345678901234567890123456789012345678901234567890123456789012345678901234567890
Current Hour Top Talkers Details
EOI
Rank
Current
1
2
3
4
5
Top Traffic Sources:
SrcIPaddress
Bytes
10.10.19.1
503K
172.30.216.196
135K
10.10.18.1
44K
10.162.37.71
25K
10.92.231.235
7K
Top Traffic Destinations:
DestIPAddress
Bytes
10.10.19.1
735K
10.10.18.1
458K
172.30.216.196
235K
10.92.231.235
157K
10.162.37.71
125K
13:45:00
1
2
3
4
5
10.10.19.1
172.30.216.196
10.10.18.1
10.162.37.71
10.92.231.235
503K
135K
44K
25K
7K
10.10.19.1
10.10.18.1
172.30.216.196
10.92.231.235
10.162.37.71
735K
458K
235K
157K
125K
13:40:00
1
2
3
4
5
10.10.19.1
172.30.216.196
10.10.18.1
10.162.37.71
10.92.231.235
503K
135K
44K
25K
7K
10.10.19.1
10.10.18.1
172.30.216.196
10.92.231.235
10.162.37.71
735K
458K
235K
157K
125K
13:35:00
1
2
3
4
5
10.10.19.1
172.30.216.196
10.10.18.1
10.162.37.71
10.92.231.235
503K
135K
44K
25K
7K
10.10.19.1
10.10.18.1
172.30.216.196
10.92.231.235
10.162.37.71
735K
458K
235K
157K
125K
1
2
3
4
5
10.10.19.1
172.30.216.196
10.10.18.1
10.162.37.71
10.92.231.235
503K
135K
44K
25K
7K
10.10.19.1
10.10.18.1
172.30.216.196
10.92.231.235
10.162.37.71
735K
458K
235K
157K
125K
.
.
.
12:50:00
The results from this command show the Top Traffic statistics for network usage, providing a snapshot of
network activity and revealing anomalies and possible problems within the network.
Use the show ip flow top-talkers port [detail] command to display the list of application ports and the
amount of traffic that has been observed on each port. Using the detail keyword displays the information
for previous intervals, as well as the current interval.
61202880L1-29.1E
Copyright © 2008 ADTRAN, Inc.
47
Troubleshooting
Integrated Traffic Monitoring
The following is sample output from the show ip flow top-talkers port command:
# show ip flow top-talkers port
0--------1---------2---------3---------4---------5---------6---------7---------8
12345678901234567890123456789012345678901234567890123456789012345678901234567890
Current Day Top Talkers by Port:
1.
2.
3.
4.
5.
Top Port Sources:
SrcPort
FTP (20)
HTTP (80)
UserDef_1 (31337)
ICMP (7)
NetBIOS (137-139)
Bytes
3.4M
1.2M
750K
128K
550K
1.
2.
3.
4.
5.
Top Port Destinations:
DestPort
Bytes
FTP (20)
3.4M
HTTP (80)
1.2M
UserDef_1 (31337)
750K
ICMP (7)
128K
NetBIOS (137-139)
550K
These ports account for 7.6M of 8.3M total bandwidth.
Debug Commands
Debug commands are another useful tool in diagnosing problems within the ITM configuration. By
enabling debug commands, debug messages are sent to alert you whenever specified actions take place.
These messages can be beneficial when you are troubleshooting your configuration.
Using debug commands can be very processor intensive, and should be used with caution.
To receive notification whenever a message is sent from the FlowExport to an external data collector, use
the debug ip flow export command. This command indicates when traffic flows are exported and lets you
track which traffic flows are traveling to which destinations. The following is sample output from the
debug ip flow export command:
#debug ip flow export
#show run
ip flow export destination 10.22.22.254 3000
ip flow export vrf BLUE destination 172.16.4.5 65774
*Dec 18 22:45:43: IPFLOW: Sent export pkt #32958 to 10.22.22.254:3000
*Dec 18 22:45:43: IPFLOW: Sent export pkt #32958 to 172.16.4.5:65774 (BLUE)
To receive messages every time a traffic flow has expired from the flow cache, use the debug ip flow
cache expiration command. Using this command allows you to be notified each time a traffic flow has
expired and is being exported through FlowExport. This notification can be beneficial because it allows
you to verify that the traffic flow expiration time is set correctly, that the traffic flows are being expired
correctly, and that the number of forced expirations of traffic flows is not excessive.
48
Copyright © 2008 ADTRAN, Inc.
61202880L1-29.1E
Integrated Traffic Monitoring
Troubleshooting
In this debug message, various information is given about each flow as it expires. The message reveals the
source IP address and port, the destination IP address and port, the direction of the traffic flow, the
interface it crossed, the ToS, and the protocol it uses.
Source IP address: Port
Destination IP
address:Port
Interface
Direction
ToS
Protocol
(6=TCP)
16:38:37: FLOW.CACHE: Expired 10.23.197.244:23 > 172.22.77.208: 1188 out eth 0/1 <T=0/P=6>
Figure 5. Debug IP Flow Cache Expiration Output Detail
The following is sample output from the debug ip flow cache expiration command:
#debug ip flow cache expiration
#show run
interface shdsl 2/1
16:38:37: FLOW.CACHE: Expired 10.23.197.244:23 > 172.22.77.208: 1188 out eth 0/1 <T=0/P=6>
16:38:37: FLOW.CACHE: ^Idle Time = 60, Active Time = 60
interface adsl 1/1
16:39:20: FLOW.CACHE: Expired 10.23.197.244.23 > 172.22.77.208:1189 out eth 0/1 <T=0/P=6>
16:39:20: FLOW.CACHE: ^Idle Time = 60, Active Time = 90
In the previous example, the second lines of both the SHDSL interface and the ADSL interface output can
tell you whether the traffic flow has expired because of the Idle Timeout or the Active Timeout. Review the
idle and active times in the following line:
16:38:37: FLOW CACHE:^Idle Time=60, Active Time=60
Both the idle time and the active time are the same value. This phenomena tells you that the traffic flow
was used once, inserted into the flow cache, and then never used again.
In contrast, review the idle and active times in this line:
16:39:20: FLOW CACHE:^Idle Time=60, Active Time=90
In this example, the time values differ by 30 seconds. The idle time signifies that the traffic flow has not
been used in 60 seconds, while the active time signifies that the traffic flow has been in the flow meter for
90 seconds. This output tells you that the traffic flow was used multiple times, with the last access
occurring 30 seconds after it was first inserted into the flow meter.
To monitor the ingress of traffic on your AOS product, use the debug ip flow cache entry command. This
command sends you notification every time a new traffic flow is added to the flow cache. This command
can be useful for validating that the flow cache is working and observing traffic. The following is sample
output from the debug ip flow cache entry command:
#debug ip flow cache entry
#show run
16:52:20: FLOW.CACHE: Added 172.22.77.208: 1189 > 10.23.197.244: 23 in eth 0/1 <T=0/P=6>
61202880L1-29.1E
Copyright © 2008 ADTRAN, Inc.
49
Troubleshooting
Integrated Traffic Monitoring
Clear Commands
You can easily clear the ITM statistics on your unit by using the clear ip flow stats command. Using this
command clears all statistics associated with ITM and allows for new statistics to be configured and
observed. To use the clear ip flow stats command, use the following example:
#clear ip flow stats
You can also easily clear the ITM Top Traffic statistics by using the clear ip flow top-talkers command.
Using this command clears all statistics associated with ITM Top Traffic operation and allows for new
statistics to be configured and observed. To use the clear ip flow top-talkers command, use the following
example:
#clear ip flow top-talkers
50
Copyright © 2008 ADTRAN, Inc.
61202880L1-29.1E