1
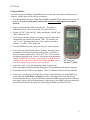
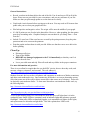
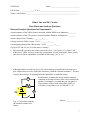
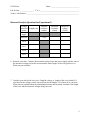
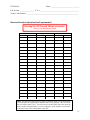
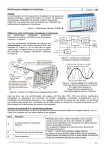
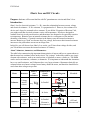
P31220 Lab Ohm’s Law and DC Circuits Purpose: Students will become familiar with DC potentiometers circuits and Ohm’s Law. Introduction: Ohm’s Law for electrical resistance, V = IR, states the relationship between current, voltage, and electrical resistance. If R is constant, V is proportional to I. However, the resistance of a device can’t always be assumed to be a constant. If you did the “Properties of Resistors” lab, you might recall that electrical resistance varies with temperature. Diodes are designed to conduct electricity in only one direction, and thermistors are designed to be especially sensitive to temperature. Batteries have an internal resistance that is a consequence of the internal chemistry of the battery. Chemical reactions in the battery cause the internal resistance to increase. Batteries go “dead” not because they lose voltage, but because their internal resistance increases to the point where current can no longer flow. In this lab, you will observe how Ohm’s Law works, you’ll learn about voltage dividers, and you’ll learn how to measure the internal resistance of a battery. About Voltmeters, Ammeters, and Ohmmeters: The table below summarizes the important characteristics of meters and how to connect them so that the meter has a minimal effect on the circuit. The “resistor” in the table could be any circuit element with resistance, such as an actual resistor, a light bulb, a motor, a diode, etc. The DMM can be used as an ammeter, voltmeter, or ohmmeter. It is important to understand that Ammeters have very small resistance, and Voltmeters have very large resistance. Ohmmeters basically are voltmeters that use a known voltage from a battery inside the meter, and therefore should not be used when other voltages are present. Meter’s own resistance Connected to circuit element Meter Measures Voltmeter Voltage “across” resistor Ammeter Current “through” resistor very small In Series Resistance ”of” Ohmmeter resistor Big. Uses its own battery In Parallel Circuit Diagram Circuit is V very big In Parallel ON A Element is disconnected ON Ω OFF and disconnected 1 P31220 Lab Using the DMM’s: You will be using two DMM’s (Digital Multimeters) in this lab. One of these will be used as a voltmeter, and the other will be used as an ammeter . Turn the POWER switch on. Note: These DMM’s automatically turn themselves off after 30 minutes. To reset, turn the power switch OFF, wait five seconds, then turn the meter back on. Plug one probe into the COM (common) port. This probe is traditionally black. (The electrons don’t care what color it is.) Put the “AC/DC” switch on DC. Make sure that the “HOLD” and “REL” buttons are off. If you want to measure voltage or resistance, plug the other probe (traditionally red) into the port labeled “VΩ”. For currents, use “mA” or “A”, depending on the size of the currents you want to measure. You’ll use “mA” in this lab. Turn the DMM knob to the setting for what you want to measure. Your meter may automatically choose its range. The range shows the highest value that can be measured. In general, if you have a choice of ranges (such as 200V, 100V, 20V, 10V, 2V), start with the highest range and work your way down to the most appropriate setting. WARNING: Measuring a current that is too high for your setting will blow the meter’s internal fuse. Don’t do that! Always start at the highest range and work your way down! Fig. 1: Extech Model MT310 Digital Multimeter (DMM) About the ± sign: If you are measuring voltage or current, the minus sign appears when the polarity of the non-COM (traditionally red) probe is negative. Pay attention to the UNITS on the display. There’s a difference between Ω, kΩ, and MΩ! About error: For the purposes of this lab, you may assume that the error of the DMM is no greater than 2% of the meter’s reading. In reality, each range on the meter has its own measurement uncertainty. If you need to know about the DMM’s measurement uncertainty in more detail, please refer to the manufacturer’s data sheet for the DMM or the sheet posted on the bulletin board in the lab. (Most are Extech Digital Multimeter Model MT310) 2 P31220 Lab Experiment 1: Find the internal resistance of a Battery (15 minutes) You have a 9V battery. Use the DMM to measure its voltage. There are two resistors on the board. Measure their actual resistances using the DMM as an ohmmeter. You’ll need these numbers later. Record your results on the Data Sheet. You can measure the resistance of the diode if you want to, but you don’t have to. Remember, an ammeter’s resistance is very small. We can’t measure current from a battery by connecting an ammeter directly across its terminals. This would cause a large current to flow, running down the battery very quickly and/or blowing the DMM’s internal fuse. We will measure the internal resistance indirectly, by putting a resistor in series with our battery and ammeter. Construct the following circuit: V Hint: 240Ω = red-yellow-brown 240Ω A 9V battery Fig. 2: Circuit for Experiment 1 Record your measurements and answer the Analysis Questions on the data sheet. Experiment 2: Voltage Drops Across Series Resistors (15 minutes) In Experiment 1, you might have observed that the measured voltage across the 240Ω resistor was not exactly 9V. In this part of the lab, you will find out why. You have a plastic block with a wire in it. Points a and e represent the two ends of the wire. Using a DMM as an ohmmeter, measure the resistance between point a and the other four points on the wire, as well as the actual resistance of the 27Ω resistor. Then construct the following circuit. Use the 6V power supply instead of the battery. Measure the voltages between point a and the other four points along the wire. In addition, measure the voltage across the 27Ω resistor and the voltage across the power supply. Complete the data table and answer the Analysis Questions for Experiment 2. V Hint: 27Ω = red-violet-black 6V Power Supply 27Ω a b c d Long Wire e Fig. 2: Circuit for Experiment 2 3 P31220 Lab Experiment 3: Building the Potentiometer Circuit (5 minutes) If you did the “Properties of Resistors” lab, you might recall that the longer the wire, the more resistance it has. You can think of a long wire as several short segments of wire that are connected in series. Each segment is a resistor. As you hopefully saw from Experiment 2, the more resistance you have, the greater the voltage across that resistor. A potentiometer is basically a long wire with a sliding contact. We can adjust the voltage between two points in the circuit by moving the slider along the wire. Potentiometers are commonly used for volume and brightness control knobs. Fig 3a: Potentiometer. Fig. 3b: Internal construction Fig. 3c: Circuit symbol Connect the circuit shown in Fig. 4. Use the power supply, not the battery. Points a and b are the outside terminals of the potentiometer as shown in Fig. 3b above. Point w is the middle (wiper) terminal of the potentiometer. If you have connected everything properly, your DMM should read 0V when the knob is turned all the way counterclockwise, and some maximum voltage when the knob is turned all the way clockwise. If this is “backwards”, simply switch the wires connected to terminals a and b. V w a b 25Ω potentiometer 6V Fig. 4: Basic Potentiometer Circuit Observe that you now have a variable voltage between points a and w. We can now use this circuit as a variable voltage source for the rest of the lab. 4 P31220 Lab Experiment 4: Measuring Resistance as a Function of Voltage Now, things get a little more interesting. Carbon resistors, light bulbs, and semiconductors behave very differently. While V=IR is always true for fixed values of V, I, and R, the graph of V vs. I is not necessarily linear. This is because R cannot be assumed to be a constant. We will plot V vs. I for several different devices so that you can observe this. Basic setup: Modify your potentiometer circuit by adding an ammeter, as shown in Fig. 5. The resistor marked “X” is whatever device we are measuring – either a resistor, light bulb, or diode. We will measure the current through X and the voltage across X at the same time. For starters, use the 27Ω resistor as “X”. V X A a w b 25Ω potentiometer 6V Fig. 5: Potentiometer Circuit for Measuring Resistor X What to do: 1. Measure and graph V vs. I for the 27 Ω resistor. Measure and graph the V vs. I curve for both positive and negative voltages. The easiest way to get the negative voltages is to switch the wires from the power supply. You can expect this first graph to be linear. Remove the “connect the dots” and do a linear fit to your data. The slope of this line should be the resistance of X. This is the classic “Ohm’s Law” measurement. IMPORTANT: Complete each graph before changing to the next element. You may want to fill in some more data points after you see the graph. 2. Next, remove the 27Ω resistor and replace it with the light bulb. Make a graph of V vs. I, using both polarities and taking care to obtain more data points in the regions of the graph that are changing more rapidly. Notice how the resistance is changing and observe whether reversing polarity makes a difference. Forget the linear fit. Tell this graph to connect the dots “to guide the eye”. 3. Finally, replace the light bulb with the diode. Measure and graph both the positive and negative voltages as before, even if it looks like nothing is happening. Take more data points where things are happening fast. Tell this graph to connect the dots also. 5 P31220 Lab General instructions: Record your data in the data table at the end of the lab. You do not have to fill in all of the boxes. Extra rows are provided for your convenience, and you may add more if you like. Make sure that you plot enough points to see the data curves clearly. Graph each circuit element before moving on to the next. You may need to fill in more data points after you see what your graph looks like. Plot both positive and negative values. The origin will be near the middle of your graph. It’s OK if points are out of order in the data tables. However, when graphing, the data points must be in ascending order. Graphical Analysis can sort them for you using “Data → Sort Data Set”. Include 2% error bars. If the error bars are covered by the point protectors, keep the point protectors and write a note on the printouts. Print the graphs and turn them in with your lab. Make sure that the curves are a dark color before printing. Clean-Up: Disconnect all wires. Turn off the DMMs. REPORT any damaged equipment to the TA’s immediately so that they can fix it before the next class. Leave your table neat and tidy. Place all trash and recyclables in the proper containers. For more information and practice: There is an excellent Java applet that lets you build DC circuits, observe how they work, and measure voltages, resistances, and currents. The web address is: http://phet.colorado.edu/en/simulation/circuit-construction-kit-dc Modern electronic devices such as cell phones and computers are made out of diodes, transistors, and other semiconductor devices. One common use for diodes is to convert alternating current (like what comes out of the wall) to direct current (like what comes out of a battery). Solar cells are basically semiconductor diodes. To learn more about how semiconductor diodes work, try the following links: http://electronics.howstuffworks.com/diode.htm or http://hyperphysics.phy-astr.gsu.edu/hbase/solids/pnjun.html A LED (light-emitting diode) is a semiconductor diode that gives off light when it is in the conducting state. Single LEDs are commonly used in indicator lights and in battery-operated flashlights. Often many LEDs are bunched together, as in automobile tail lights, traffic lights, and replacements for incandescent light bulbs. This link explains how LEDs work: http://electronics.howstuffworks.com/led.htm 6 P31220 Lab Name: ________________________________ Lab Section: ________________ T.A.’s ____________________________________________ Today’s Lab Partners: ___________________________________________________________ Ohm’s Law and DC Circuits Data Sheets and Analysis Questions Data and Analysis Questions for Experiment 1: Actual resistance of the 240Ω resistor, measured with the DMM as an Ohmmeter: ________ Actual resistance of the 27Ω resistor, measured with the DMM as an Ohmmeter: ________ Actual voltage of the 9V battery: _________±_____ Voltage across the 240Ω resistor: V±δV: _________±_____ Current passing through the 240Ω resistor: A±δA: _________±_____ (To figure δV and δA, use 2% of the meter’s reading.) 1. The error in R is given by the resistor color code (silver = 10%, gold = 5%). Does V=IR , within error? (Hint: You may need to do a propagation of error calculation.) Please justify your answer with an explanation, in addition to answering “yes” or “no”. 2. Although a battery is really one device, the circuit analysis is simplified if you treat it as a pure voltage source in series with a pure resistance, called the “internal resistance.” The new circuit is shown below. Everything inside the dashed line is inside the battery. Recall that the voltmeter has nearly infinite resistance compared to the other resistors in the circuit, and that the ammeter’s resistance is so small that you can ignore it. The resistance of this circuit is therefore (240Ω + r). Calculate r, using Ohm’s Law (V=IR) and V = 9V. V r 9V 240Ω A Fig. 5: Circuit for measuring the internal resistance of a battery. Answer: _______________ 7 P31220 Lab Name: ________________________________ Lab Section: ________________ T.A.’s ____________________________________________ Today’s Lab Partners: ___________________________________________________________ 3. (circle one) Using the circuit in the previous question, would you expect the measured voltage across the 240Ω resistor to be LARGER, SMALLER, or the SAME as 9V? Explain your thinking: 4. Typically, r gradually increases as electrical energy is drawn out of the battery. a. Assume that r = 20Ω. Calculate the current in the circuit. Answer: __________ b. Assume that r = 60Ω. What is the new current in the circuit? Answer: __________ 5. Why won’t measuring battery terminals with a voltmeter always tell you whether a battery is weak? If weak and dead batteries are available, you might try testing them with your DMM. Report what you did and what you found out below. MAKE SURE THAT THE DMM IS ON VOLTS! 8 P31220 Lab Name: ________________________________ Lab Section: ________________ T.A.’s ____________________________________________ Today’s Lab Partners: ___________________________________________________________ Data and Analysis Questions for Experiment 2: Voltage measured Length (cm) across Power supply Resistor Nominal resistance (ohms) Measured resistance (ohms) Measured voltage (Volts) 27Ω a to b a to c a to d a to e 6. Examine your data. Compare the measured voltage across the power supply with the sum of the measured voltages across the resistor and the entire length of the wire (points a to e). What can you conclude? 7. Consider your data for the wire only. Graph the voltage vs. length of the wire. Include 2% error bars for the voltages, and 2 mm error bars for the lengths. Do a linear fit to your data. What can you conclude about the relationships between the measured resistances, the length of the wire, and the measured voltages along the wire? 9 P31220 Lab Name: ________________________________ Lab Section: ________________ T.A.’s ____________________________________________ Today’s Lab Partners: ___________________________________________________________ 8. Predict, then test: What voltage would you expect to measure from point b to point e? Prediction: ______________ Reason for this prediction: (do NOT change this if it was wrong!) Test: ____________________ Correction to your thinking, if your prediction was wrong: 9. Repeat question 8, this time measuring the voltage from point c to point e. Prediction: ______________ Reason for this prediction: (do NOT change this if it was wrong!) Test: ____________________ Correction to your thinking, if your prediction was wrong: Data and Analysis Questions for Experiment 3: 10. Just get your circuit working. Is it working? YES NO CAN’T TELL If it isn’t working or if you can’t tell, ask your TA for help. 10 P31220 Lab Name: ________________________________ Lab Section: ________________ T.A.’s ____________________________________________ Today’s Lab Partners: ___________________________________________________________ Data and Analysis Questions for Experiment 4: Warning! Do NOT exceed 200 mA of current! Doing so can damage the DMM. Carbon Resistor V I Light Bulb V I Diode V I Hints: Take more data points where the graphs are changing rapidly. The most interesting part of the light bulb’s graph happens when the bulb is not yet glowing. There IS current, but not enough to make a glow. You’ll also want to take data points more often where the diode’s graph is changing rapidly. Feel free to add pages, use the margins, or use the back of the page if there aren’t enough blanks in this table. 11 P31220 Lab Name: ________________________________ Lab Section: ________________ T.A.’s ____________________________________________ Today’s Lab Partners: ___________________________________________________________ 11. Examine the data and graph for the 27Ω carbon resistor. What is the data telling you about the behavior of the resistance of this device? Explain in as much detail as you can. 12. You measured the actual resistance of the 27Ω resistor with an ohmmeter in Experiment 1. Compare this number to the slope of the graph. Do these two numbers agree within error? (circle one) YES NO Please discuss. 13. Examine the data and graph for the light bulb. What is the data telling you about the behavior of the resistance of this device? Explain in as much detail as you can. 14. Incandescent light bulbs glow when the current heats the wire filament to a high temperature. The brighter the glow, the hotter the filament. What does your graph tell you about how the electrical resistance of the filament changes with temperature? 15. Examine the data and graph for the diode. What is the data telling you about the behavior of the resistance of this device? Explain in as much detail as you can. 16. What are your final thoughts and impressions about this lab? List of graphs to turn in with your data sheets: V vs. L for the wire V vs. I for a light bulb V vs. I for a carbon resistor V vs. I for a diode 12