1
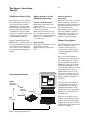
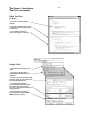
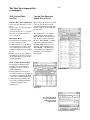
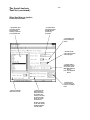
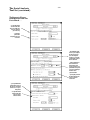
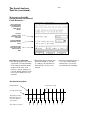
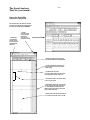
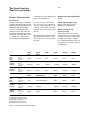
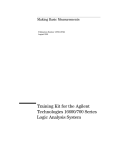
Post-Processing Tool Sets for the
Agilent Technologies 16700A
Series Logic Analysis Systems
Product Overview
Solutions for Digital
System Debug
Post-processing tools
provide rapid insight
into your toughest debug
problems
Series logic analysis systems. Each
tool set provides digital design
engineers like you insight into your
specific application.
When you want to understand what
your target is doing and why, you
need to view acquisition results in a
format that quickly guides you to
problem identification.
You have unique measurement and
analysis needs. Agilent Technologies’ combination of powerful triggering and deep trace provides the
ability to precisely acquire large
quantities of data around a specified sequence of events.
The tool sets described in the
following pages are optional, postprocessing software packages for
the Agilent Technologies 16700A
consolidate data into displays that
provide insight into your system’s
behavior.
Free Tool Set Evaluation
Once the data is acquired, you can
rely on the analysis tools to rapidly
To see which tool sets best fit your
needs, Agilent Technologies offers a
free 21-day trial period that lets you
evaluate any tool set as your work
schedule permits. Once you receive
your tool, you obtain a password
that temporarily enables the tool.
(See page 35 for information on
evaluation and tool set passwords.)
Application
Product Name
Agilent Model
Number
B4620B
Detailed
Information
Pgs 3-6
Debug your real-time code at the source level
Correlate a logic analyzer trace with the high-level source code
that produced it. Set up the logic analyzer trace by simply pointing
and clicking on a line of source code.
Debug your parallel data communications buses
Display logic analyzer trace information at a protocol level.
Powerful trigger macros allow triggering on standard or
custom protocol fields. Supports data buses up to 32 bits wide.
Customize your trace for greater insight
Create custom tools using the C programming language.
Custom tools can analyze captured data and present it
in a form that makes sense to you. Analysis systems do not require
the tool development kit to run generated tools.
Optimize your system’s performance
Profile your system’s performance to identify system
bottlenecks and to identify areas needing optimization.
Solve your serial communication problems
Convert serial bit streams to parallel format for easy viewing and
analysis. Supports serial data with or without an external clock
reference and protocols that use bit stuffing to maintain clock
synchronization. Works at speeds up to 1 GHz.
Source Correlation
Tool Set
Data Communications
Tool Set
B4640B
Pgs 7-15
Tool Development Kit
B4605B
Pgs 16-22
System Performance
Analysis Tool Set
B4600B
Pgs 23-28
Serial Analysis
Tool Set
B4601B
Pgs 29-34
Table 1. Applications for the Agilent Technologies Post-Processing Tool Sets.
2
Seamless Integration
with Your Development
Environment
Remotely access any tool set from
a PC or workstation through your
web browser or X-window emulation software. You can also use an
SVGA monitor to locally control
and view measurements at your
lab bench.
Access source files or other development environment applications
(compiler, debugger) from your
16700A Series system via Telnet,
NFS or mapped file systems, and
X-Windows client/server protocols.
Serial bit stream displayed in a
parallel waveform format
Save or access files via the standard network capabilities of the
16700A Series mainframes, such
as FTP, NFS, or CIFS (Common
Internet File System for Windows
95/98/NT based PCs).
Statistical representations
Source code time-correlated
to the inverse assembled
trace listing
Figure 1: Get the Insight You Need
into Your System’s Behavior with
Agilent Technologies Post-Processing
Tool Sets.
The Source Correlation
Tool Set
Debug Your Source Code
3
Obtain Answers to the
Following Questions:
Software-Hardware
Integration
• What is the root cause of a system
As an engineer, you are responsifailure—hardware or software?
ble for the flawless execution of
Software Code Execution
• Are timing anomalies found by the
your software in its real-time
• What happened just before the
hardware engineer the cause of
environment. You must ensure
system crashed?
that both input and output data• What source code was executed at my software problems?
• Am I working on the same probflow processing and system time
a specific point in time?
lem as the hardware engineer?
constraints are tested to design
• What is the exact time between
• What portion of my source code
specification. Valid measurements two user-defined system events?
can only be performed on the
• What is the execution history lead- correlates to the problem the
hardware engineer reported?
actual hardware prototype.
ing up to or occurring after an
area of interest?
Product Description
Using the Agilent Technologies
B4620B source correlation tool set Data Tracking
The Agilent Technologies B4620B
you can obtain answers to many of • What is the exact history of a varisource correlation tool set
your questions concerning softable’s value over time?
correlates a microprocessor
ware code execution, data track• Which routine(s) corrupted my
execution trace window with a
ing, and software-hardware intedata?
corresponding high-level source
gration.
code window.
The tool set uses information
provided in your compiler’s object
file to build a database of source
files, line numbers and symbol
information. The tool set’s main
advantage is its ability to allow
you to observe software execution
without halting the system or
adding instructions to the code.
The tool set can also be used to
set up the logic analyzer trace by
simply pointing and clicking on a
source line.
Your Development Environment
Source
Analyzer
Trace
Compile
Relocatable
Object Code
Link
Absolute
Object Code
Symbol File
Once the tool set is enabled on
your 16700A Series system, it
can support new processors by
changing analysis probes and
verifying object file compatibility.
Multiple-processor systems are
also supported.
Download
Edit
Source File
Debug
Figure 2: Typical Development Cycle.
The source correlation tool set
completes your software development environment by providing
multiple views of code execution
and variable content under severe
real-time constraints.
The Source Correlation
Tool Set (continued)
When You Want
to Trace . . .
...on a variable to see what caused data
corruption.
...on a function to determine where it is being
called from in order to understand the context
of a system error.
...on a line number to determine if a
specific code segment is ever executed.
Simply Click . . .
... to trace about a variable, function, or line
number.
... to halt processor execution with an
integrated emulation module when the trace
event occurs.
...to use text search to quickly navigate through
hundreds of symbols. To recall previous entries
when rotating through debug tests.
...to specify alignment conditions for
processors that don’t include lower address
bits on the bus. This is necessary if your
processor uses bursting or byte enables when
fetching instructions.
...to use address offsets for code that is
dynamically loaded or moved from ROM to
RAM during a boot-up sequence.
4
The Source Correlation
Tool Set (continued)
5
Once You Acquire
the Trace . . .
...“step” through the
trace at the sourcecode level or the
assembly level.
Locate the cause of a
problem by “stepping
backward” from the
point where you see
a problem to its root
cause.
...quickly locate a
specific function,
variable, or text
string. The system
maintains a history of
previous text
searches for quick
recall.
...click the source line
which you want to
trace about on your
next acquisition.
...set the data type to
“Symbols” to view file
and symbol names or
”line #s” to view file
name and line number.
...filter out unexecuted code fetches from
the inverse assembled trace to view
executed code only
using Agilent’s
advanced inverse
assembly filtering for
popular processors.
...measure the actual
execution time
between two points in
the software. Every
trace is nonintrusive
and every captured
event is time stamped.
...scroll or step through
the time-correlated
source code (left) or
inverse-assembled
trace listing (right)
Also...
Analyze a function’s behavior without viewing
calls to subroutines or interrupts by using the
analyzer’s filtering capabilities to focus on a
specific part of the executed software.
The Source Correlation
Tool Set (continued)
Product Characteristics
Data Sources
All state and timing measurement
modules supported by the 16700A
Series logic analysis systems
(except the 16517A/518A) serve as
data sources for the source correlation tool set.
Microprocessor Support
The source correlation tool set
supports many of the most popular
embedded microprocessors using
nonintrusive analysis probes for
the 16700A Series systems to provide reliable, fast and convenient
connections to your target system.
New microprocessors are constantly being added to the list of
supported CPUs. For the most
current information about
supported microprocessors,
please contact your Agilent
Technologies sales representative
or visit our web site:
http://www.agilent.com/find/
logicanalyzer
Object File Format
Compatibility
The 16700A Series logic analysis
systems quickly and reliably read
your specific object file format.
Agilent Technologies’ experience
with different file formats and
symbol representations translates
into confidence that your source
code files are accurately correlated and your system is precisely
characterized.
6
Source correlation and system
performance measurements do
not require any change in your
software generation process. No
modification or recompilation of
your source code is required.
You can load multiple object files.
Address offsets are also supported, enabling system performance
measurements and source-code
level views of dynamically loaded
software execution or code moved
from ROM to RAM during a bootup sequence.
Source File Access
The source correlation tool set
must be able to access source files
to provide source line referencing.
Source files can reside in multiple
directories on the hard drive of
your workstation, PC, or on the
16700A Series mainframe’s internal hard disk. You can access the
files via NFS-mounted disks or
CIFS mounted disks. To display
the source file, the tool set first
looks for the source path name in
the object file, follows the path to
access the source file, and if not
found, looks for the source file in
alternate user-defined directories.
High-level language tools that produce the following file formats are
supported:
• HP/MRI IEEE695
The 16700A Series logic analysis
• ELF/DWARF*
systems automatically place the
• ELF/Stabs*
following in the directory search
• TI_COFF
path:
• COFF/Stabs*
• NFS mounted directories
• Intel OMF86
• Directory paths specified in
• Intel OMF96
loaded symbol files
• Intel OMF 286
• Directory paths specified in
• Intel OMF 386 (which supports
loaded source files
Intel80486 and Pentium Language)
Source Correlation
*Supports C++ name de-mangling
Functionality
• Source code and inverse
If your language system does not
assembled trace listing are
generate output in one of the listtime-correlated.
ed formats, a generic ASCII file
• Ability to alternate between
format is also supported.
source viewer and browsing of
other-source files.
For the most current information • Trace specification can be set up
about supported compiler file
from the source viewer or file
formats and processor support,
browser.
please contact your Agilent
• For multiple-processor systems,
Technologies sales representative. each trace window can be timecorrelated to a source viewer.
Data Communications Tool Set
7
Monitor Packet
Information on
Parallel Data Buses
The powerful protocol trigger
macro allows easy trigger setup by
eliminating the need to manually
configure the trigger sequencer for
complex measurements. All
custom-defined protocol fields
or layers are supported in the
trigger macro.
Your networking hardware uses
parallel data buses such as
UTOPIA or a proprietary parallel
interface to communicate between
communications processors, network processors, custom ASICs,
or physical interface chip sets.
The data communications tool set
allows developers to view parallel
bus data at a protocol level on the
logic analyzer.
With a higher abstraction view of
the data combined with the
powerful time-correlation features
of the logic analyzer, Agilent
Technologies equips designers
with a new debugging capability
to find complex system-level bus
interaction problems combined
with protocol information from
parallel data paths.
Obtain Answers to the
Following Questions
• What is the time difference
between two or more data paths
and/or a microprocessor?
• Did a packet make it through the
switch or router?
• Why did a packet take so long to
go through the switch or router?
• Where did an illegal packet come
from?
• What is the latency on packet
information?
• What is corrupting packets?
Product Description
The Agilent Technologies B4640B
data communications tool set adds
protocol analysis capabilities to
the logic analyzer for viewing parallel data buses in a switching or
routing system. Each protocol
layer is displayed with a different
color in the logic analyzer lister
display to allow easy viewing of
the protocol data. Payload information is included after the header
in a raw hex format. Filters are
included to allow many different
views of the data. Protocol layers
can be collapsed or expanded to
create a custom view of the data
acquired in the logic analyzer.
With the filters, you can concentrate on the data of interest for a
particular measurement.
All packets or cells are timestamped in the logic analyzer for
time-correlation measurements
with other system buses such as
a microprocessor, memory interface, PCI bus, or other UTOPIA
bus. All state listing and waveform
displays in the logic analyzer are
time-correlated with global markers for a complete view of the system. With this tool, it is possible
to trigger the logic analyzer with a
microprocessor event and see
what is happening on a parallel
data bus with protocol information.
By monitoring multiple timecorrelated data buses, you can
monitor a packet entering one
ASIC and see how long it takes for
the packet to reach another part of
the system. The powerful trigger
can also monitor a packet entering
one port and trigger if the packet
has not reached another port by a
designated time.
The data communications tool
set supports data buses up to 32
bits wide.
Data Communications Tool Set
(continued)
8
Theory of Operation
UTOPIA Level 2
Custom / UTOPIA
CPU
PHY
PHY
ATM
Layer
ATM
Layer
PHY
PHY
Switch
Fabric
PHY
ATM
Layer
ATM
Layer
PHY
PHY
UTOPIA
Level 1
Figure 3: Typical ATM Switch Design.
The logic analyzer probes the parallel data buses in the system, such
as the UTOPIA shown above. The
logic analyzer needs access to data
signals, qualifying signals, start of
cell or packet bit, and the synchronous clock for the bus.
With access to the "Start of Cell"
or "Start of Packet" bit on the data
bus, the logic analyzer starts looking at the beginning of a cell or
packet. With the protocol definition set up by the user, the logic
analyzer can sequence down into
the cell or packet to find the desired protocol fields to trigger on.
Qualifiers such as "Data Valid"
allow the logic analyzer to sample
only on events of interest instead
of all cycles. The synchronous bus
clock samples the data into the
logic analyzer.
Protocol Support
The B4640B includes both ATM
and Ethernet standard protocol
setup files. These files can be
edited to support custom fields or
"wrapper" layers in a protocol.
Custom additions or changes can
be easily entered through the logic
analyzer user interface or a text
file, as shown on page 9. These
custom protocol definitions are
used in both the trigger definition
and packet display.
Data Communications Tool Set
(continued)
Edit or create a
protocol using the
logic analyzer
user interface.
Select a known
protocol and
add proprietary
fields.
Insert custom
wrapper or
field here.
Insert name,
number of bits
and format for
trigger and
display.
Define any
symbols for
both trigger
and display
of packets.
Edit or create a
protocol using a
text file.
Start with
standard
protocol
definition and
add custom
fields with
text file.
Insert protocol
layer name.
Define
protocol fields,
number of bits,
and format
for trigger
and display.
Define any
user symbols
to make
triggering
and display
easier to use.
9
Data Communications Tool Set
(continued)
10
Trigger Interface
New packet
trigger
macros.
Specify
protocol
layer to
trigger on.
Trigger on
simple IP
address instead
of setting up
trigger
sequencer.
Specify what
action to
perform once
a packet is
found.
Specify
protocol layer
to trigger on.
Use any defined
protocol fields
as a trigger,
such as
source address,
destination
address, etc.
Physical representation of bit fields to be
triggered on. This window is automatically
updated when fields are edited.
Data Communications Tool Set
(continued)
11
View the
actual
trigger
sequencer
setup.
Up to 16 trigger sequences are
available for a measurement.
Data Communications Tool Set
(continued)
12
Display of
custom
protocol
levels.
Protocol
view of
data
acquired
in logic
analyzer.
Time tags for system level
correlation of other data
buses, memory interfaces,
microprocessors, etc.
Data Communications Tool Set
(continued)
13
Protocol Filters and
Viewing Preferences
Filter captured data
to only view key data
for measurement.
Choose to view
payload data with
header information.
Select which
protocol layers
and fields to
view in trace.
Data Communications Tool Set
(continued)
14
Global markers measure time intervals
between packets on separate parallel
interfaces or timing between the data
path and a microprocessor.
Collapsed
view of
protocol
information
using
preferences.
Raw
packet
header
information.
Raw
payload
information.
Data Communications Tool Set
(continued)
Product Characteristics
Requires a 16700/702A Series logic
analysis system with operating
system version A.01.50.00 or later.
Logic Analysis Modules
Supported:
Agilent Technologies 16715A,
16716A, 16717A, 16718A, and
16719A
Protocols Supported:
Ethernet and ATM*
* These are example files shipped
with the product. These standard
files can be edited to include any
custom protocol layers or fields.
Custom protocols are supported
by entering the protocol setup
information via the logic analyzer
interface or a text file.
Maximum Parallel
Bus Width: 32
15
The Tool Development Kit
16
Customize Your
Measurements
Product Description
A logic analysis system is used to
obtain critical information about
your system. At times the information you need can be buried in
the raw data of your measurement. This might be due to one of
several reasons:
• The use of a protocol, encoded
data, or proprietary bus
• Events that happen only under
certain conditions
• The need to analyze system
performance
• The need to analyze data across
a large number of repetitive
measurements
Answering Your
Visualization Needs
The following trace shows a small
part of what can be done with
custom tools.
The Agilent Technologies B4605B
tool development kit provides a
complete environment for creating
custom tools. This includes:
• Fast, compiled and optimized
C code
• Push button compiling, no make
files
• A rich library of functions that
speeds development
• Extensive examples of code
• The creation of installable tools
• One year of technical support for
the B4605B
Custom tools process data right
on the analyzer. This way the
powerful search and filtering
capabilities of the analyzer can be
used. Time-correlation with other
traces, using the global markers, is
also available.
The ability to interpret and display
this information is vital to your
project.
In this example, raw digital data
containing engine and transmission information has been interpreted and displayed in the
"System Information" column.
This text makes it much easier to
understand what is going on in the
system.
The tool development kit allows
you to generate custom tools
that can:
• Add textual information and color
highlighting to your traces
• Interpret protocols, encoded data,
or proprietary buses
• Apply algorithms to both scope
and analyzer traces
• Read or write ASCII or binary
files, in virtually any format, on
the analyzer, your workstation,
or PC
• Provide time-correlation to other
measurements
• Stop the analyzer during a
repetitive run
Data is processed quickly by the
custom tools, because they consist
of compiled, optimized C code. As
you develop code for a tool, programming errors can require you
to restart the analyzer session.
While a C language programming
background helps, specific knowledge of C is not required. This is
due to the use of a tutorial, examples in the manual and a rich
library of functions that let you
easily access analyzer data and the
tool’s interface.
The custom tools can be used on
any 16700A Series analysis system.
This allows you to purchase just
one or two copies of the development kit and develop custom tools
to support a large number of
analyzers.
The Tool Development Kit
(continued)
With Custom Tools
You Can:
Enhance How Data is Displayed
• Color-code specific states of your
trace.
• Display some of your trace data in
engineering units.
• Convert the raw trace of a proprietary bus to a transaction-level
trace of that bus.
Manipulate Data
• Unravel interleaved data into two
or more columns of data.
• Combine the traces of two different analyzers into one trace, with
each column being combined or
separately displayed as prescribed
by you.
• Modify your scope trace using an
algorithm developed by you, such
as an analog filter, beat frequency,
or DSP algorithm.
17
Custom Tool Examples,
Added Text in Trace
This example shows how a custom
tool can convert data to text to
present information in a form that
is much easier to understand than
the raw data.
The original trace comes from a
control unit in an automobile.
Embedded in the data is information about the engine and transmission. When MODE = 0, DATA
represents engine information,
including RPM, fuel level, fuel to
air ratio, and manifold pressure.
When MODE = 1, DATA represents transmission information,
including gear position and
temperature.
Read or Write External Files
• Accumulate information from
repetitive traces taken by the
analyzer in a file on your PC or
UNIX workstation.
• Write specific types of states or
trace data that have been analyzed
to an Excel consumable ASCII file
on your PC or UNIX workstation.
• Use information read from a file
on your PC or UNIX workstation
to modify the display of an
analyzer trace.
Output of Custom Tool
Original Trace
This custom tool allows the
user to specify Fahrenheit or
Centigrade for the engine
temperature data.
Parameter Interface of Custom Tool
The Tool Development Kit
(continued)
18
Custom Tool Examples,
Microprocessor Code
Reconstruction
The code was reconstructed by
using the branch trace messages
and information in the SRecord
file created when the code was
compiled. The tool took the
address of the appropriate states
in the trace data and found the
corresponding code (data) in the
SRecord file. This created a trace
that the MPC 555 inverse assembler could operate on properly.
The original trace (below) came
from the bus of a MPC 555 processor. As you can see, no data was
placed on the bus at the time of
the trace. This is because cache
memory was turned on. Normally,
it would not be possible to inverse
assemble this trace.
Original Trace
The output of the custom tool in
this example is shown below.
Notice that there is now data in
the DATA column. The custom
tool was able to reconstruct the
code flow after the trace was
taken. This is because the
MPC 555 processor supports
branch trace messages.
Output of Custom Tool
By entering information here, users can direct
the tool to the correct SRecord file and control
how much of the data the tool is to operate on.
They can also indicate if the AT2 pin of the
MPC 555 processor is in use.
Parameter Window of Custom Tool
The Tool Development Kit
(continued)
19
Custom Tool Examples,
Multiplex Data
Custom tools can combine several
lines of data acquired sequentially
under one label into one line of
data. However the data to be
combined does not have to come
from the same label, it can come
from different labels. The labels
can even come from different
analyzers.
Output of Custom Tool
Original Trace
At left are the parameter window and message
display created by the custom tool in this
example. Parameters allow the user to control
different aspects of what the tool does to the
acquired trace. The user can change the parameters and hit the execute button to change the
output of the tool. The output dialog to the left
displays information generated by the tool.
Parameter and Output Window
The Tool Development Kit
(continued)
Custom Tool Examples,
FFT Algorithm
In this example the output of a
scope module is modified by a custom tool using a FFT algorithm.
The tool’s output is then displayed
20
using the chart display. This is an
example of how custom tools can
be used with something other than
state traces. While the chart does
not have label vs label, you can get
an idea of the characteristics of
the signal acquired by the scope.
Sine Wave FFT
Original Trace
Parameter Window
Trig Out FFT
The Tool Development Kit
(continued)
21
Custom Tool
Development
Environment
This is the main window for
developing code with the tool
development kit.
Select this button to cause the compiled
code to operate on the acquired data.
Select this button to compile
the code displayed in the
“Source Code” tab.
Load a file created
on another system or
create your code here
using the “Source
Code” editor.
Errors generated
during a compile are
displayed in the
“Buildtime” tab.
Runtime errors are displayed
in the “Runtime” tab.
Output generated during
the tool’s execution
are displayed
in the “Output” tab.
The Tool Development Kit
(continued)
22
Custom Tool Development
Environment (continued)
This window provides the information and
icon necessary to create an installable tool.
Once your code has been created and is
working properly, you can create an installable tool for use on other 16700A Series
analysis systems.
Name the tool and manage versions of it
here.
Select the icon for the tool here. New
icons can be created and added to the
toolbar if you like.
Add your tool descriptions here. This
description will be visible at install
times, so users will know what they are
getting.
Product Characteristics
Analyzer Compatibility
Custom tools will run on any
16700A Series analyzer running
version A.01.40.00 or greater. In
some rare instances, changes in
the operating system can require
that your tools be recompiled in
order to run on that version of the
operating system.
Analysis Modules
The tool development kit supports
the following Agilent Technologies
measurement modules:
• 16715A, 16716A, 16717A
• 16710A, 16711A, 16712A
• 16557D
• 16556A/D, 16555A/D
• 16554A
• 16550A
• 16534A, 16533A
• 16517A, 16518A
C Compiler
The libraries provided with the
C compiler allow you to perform
standard operations such as creating ASCII or binary files, reading
from these files, writing or
appending to these files, and IEEE
754 floating point operations.
Provided Functions
Agilent Technologies also provides a rich library of functions
that allow you to copy data sets,
create new data sets with new
labels, and to reorganize the
acquired data under these new
labels or to include data or text
derived from the acquired data.
The functions allow:
• Stopping a repetitive run
• Filtering of the data
• Randomly accessing the data
• Searching the data
• Displaying the data in one of eight
colors
• Accessing the trigger point
• Accessing the acquired time or
state of the data
• Outputting text strings to the
tool’s display window
• Outputting errors to the runtime
window
By using two of the provided functions, a simple user interface can
easily be created that consists of
label strings and input fields. This
allows the input of parameters
during the tool’s execution.
The System Performance
Analysis Tool Set
23
Optimize System
Performance
Product Description
Software Execution Coverage
• Do my test suites provide thorough coverage of my application?
Getting your target system up and • Is this function or variable
accessed by the application?
running is clearly the first priority
for successful product developDebug and System
ment. But a working system isn’t
Parameter Analysis
enough. It has to meet consistent
performance requirements over a • Does this pointer address the right
memory buffer?
range of operating conditions and
over a specific time period. Using • How does the system react when
it receives too many simultaneous
the system performance analysis
interrupts?
tool set, you can obtain answers
• Is the stack size adequate?
to many of your questions concerning performance and respon- • Is the cache size adequate?
siveness, software execution
Analog, Timing,
coverage, debug and system
and Bus Measurements
parameter analysis, etc.
• What is the setup/hold time of this
signal or group of signals?
Obtain Answers to the
• Is the distribution of voltages of
Following Questions:
this analog signal acceptable?
• Is this signal spending too much
Performance and
time in the switching region?
Responsiveness
• What functions monopolize micro- • What bus states occur most often?
• What is the bus loading?
processor bandwidth?
• How does the bus affect overall
• What functions are never
system performance?
executed?
• How much time is spent in bus
• What is the relative workload of
arbitration?
each processor in a multiple• What is the histogram of bus
processor system?
transfer times?
• What is the minimum, maximum,
and average execution time of a
Processor/Cache Measurements
function (including calls)?
• Which microprocessor bus states
• How many interrupts does the
occur most often?
system receive per consecutive
• Which peripherals are used most
time slice?
often?
• What is the response time of my
• What is the profile of load sharing
system to an external event?
in a multiple-processor system?
• How does the cache size affect
system performance?
The Agilent Technologies B4600B
system performance analysis
(SPA) tool set profiles your entire
system at all levels of abstraction—from signals to high-level
source code. It clearly identifies
the components that affect the
behavior of your system. In addition to performance analysis, it
can be used at any time to test and
document many other characteristics, such as memory coverage and
response time.
The SPA tool set generates
statistical representations of the
captured data. It shows the
amount and percent of time spent
in each of the targeted functions
or data locations. Data is conveniently displayed in histograms
and bar charts, reducing the time
you spend analyzing results and
identifying system bottlenecks.
Multiple SPA Windows
SPA provides several different
display types, which can be
viewed simultaneously:
1. State overview tool: an overview
of bus/memory activity
2. State interval tool: a histogram
of event activity
3. Time interval tool: a histogram
of event times
4. Time overview tool: an overview
of occurrence rates over time.
Each display includes filtering
capabilities that allow you to
remove portions of a trace that are
not applicable to the analysis
(such as initialization routines) so
that you can concentrate on
specific events.
The System Performance
Analysis Tool Set (continued)
Identify which Events
Occur Most Frequently
State Overview Tool
Use this tool as the first step of the
analysis or optimization process to
identify which events occur most
frequently during a measurement.
The tool interprets the captured
data and displays the number of
hits for each possible bus state.
Narrow in on an area of interest
using built-in qualification and
zoom functions.
24
Isolate defects, such as invalid
pointers, when used in combination with the 16700A Series
filtering tool.
When used on an oscilloscope
trace, the tool displays a distribution of voltages for the signal. The
shape of the distribution can tell
you whether a digital signal is
spending too much time in the
switching region, or you can evaluate the linearity of the output of a
digital-to-analog converter.
Pinpoint regions of high memory
activity to determine which routines
or operations are responsible for
throughput bottlenecks.
Measure memory coverage or
stack usage by observing whether
memory locations are accessed.
You can also detect which peripherals are most frequently used.
The System Performance
Analysis Tool Set (continued)
Determine which
Functions Use the Most
CPU Cycles
State Interval Tool
Help prioritize functions that are
candidates for duration measurements using the time interval tool.
The histogram display shows the
percentage of time the system is
spending in each procedure, function, or event (states). Events are
defined as patterns or ranges associated with any set of data (labels,
symbols).
25
Use this tool to show which
functions are using the most CPU
cycles. It can also show the share
of the workload that each processor in a multiple-processor system
carries or determine if the system
is balanced. Bus measurements,
such as headroom analysis, can be
made by examining the ratio of
active to idle status states.
Computer systems take advantage
of cache memory to improve
performance. The analysis of
cache hits and misses can be made
by defining the states corresponding to hits and misses.
Sort and display symbols alphabetically by
event name or by the number of hits.
Display just the symbols you want to
evaluate by using the symbol-navigation
utility. The utility automatically configures
the tool for the selected function and variable names from large symbol files created
by complex software projects.
To help simplify your display, delete all
functions below a selected point with a
single mouse click.
Pass the mouse over a histogram bar and
bucket information gives you detailed
information for each event.
The System Performance
Analysis Tool Set (continued)
Determine a Specific
Routine’s Execution
Times
Time Interval Tool
Examine execution times and
verify signal timing specifications
using the time interval tool.
Results from the tool help you
determine the best and worst
26
execution scenarios so you can
decide if optimization is needed.
The time interval tool uses a
histogram to display a distribution
of the execution time of a specific
function or of the time between
two user-defined events. Use the
tool to measure setup and hold
times, the jitter between two
edges, or the variation between
two bus states.
Because time interval measurements often
depend upon hardware-software interaction,
the event definition can be a combination of
symbolics and hardware events. Data
qualification can be used to define the
specific hardware context in which the
analysis will be made.
Data is displayed in histograms, which can
be exported to your host computer either as
histograms or as tabular formatted text files.
Statistics such as maximum time, minimum
time, standard deviation and mean help you
document system behavior. Use “accumulate mode” to analyze the behavior of your
system over a long period of time.
The System Performance
Analysis Tool Set (continued)
View the Frequency of
Events Over Time
the occurrence rate of any event,
including interrupts, over time.
Time Overview Tool
Use the time overview tool to
show the variation in the
frequency of events as you vary
test conditions. The tool measures
Define the event and time period
in which events are counted. Also
define the width of the time
buckets and number of time
buckets based on the frequency of
events you expect.
Use “Comments” to document your trace. The
“Comments” field contents are saved with the
configuration and data.
Use the markers in this window to correlate
interrupts to a state listing or timing waveform.
27
Elusive system crashes are often caused by
too many interrupts occurring over a short
period of time. If the software cannot handle
all simultaneous service requests, the
system can exhibit random defects while
leaving no clues as to their cause. In this
situation, you need a tool that can measure
and display interrupt loading.
Embedded systems manage the flow of data to
and from physical sensors. Problems can
occur if the system does not frequently acquire
data from the sensor. By defining an event that
corresponds to the sensor’s address space,
you will get an image of the flow of data
between the sensor and the processor.
The System Performance
Analysis Tool Set (continued)
28
Product Characteristics
Off-Line Analysis and
Post-Processing
All measurements can be saved
using the file out tool. Data can
be recalled at any time for later
analysis using any SPA or other
tool. Performance measurements
can be exported to your host computer as histograms or as tabularformatted text files.
Data Sources
All measurement modules
supported by the 16700A Series
logic analysis systems serve without modification as data sources
for the B4600B. The particular
measurement module used determines time resolution and
accuracy. Sample rate, channel
count, memory depth and triggering are controlled by the user
independent of the SPA tool set.
SPA Tools
Maximum
Number of
Events
Supplemental
Information
Display Modes
Accumulate
Mode
Processor Support
The SPA tool set supports any
analysis probe listed in the configuration guide entitled Processor
and Bus Support for Agilent
Technologies Logic Analyzers
(pub no. 5966-4365E).
Nonintrusive analysis probes provide reliable, fast, and convenient
connections to your target system.
Object File Format
Compatibility
The object file formats are
identical for the system performance analysis and the source
correlation tool sets. See the
information provided for the
source correlation tool set on
page 6.
State Interval
Time Interval
Time Overview
State Overview
Display
Display
Display
Display
No theoretical limit
Number of events limited by the size of the
Up to 10,000 events tested with a standard
window (e.g. pixels on the screen)
configuration
Number of hits
Minimum time
Number of hits
Number of hits
Maximum time
Average time
Time bucket width
State bucket width
Standard deviation
Sort by number of
Sort by time
Autoscale zoom
hits
Sort alphabetically
Sort alphabetically
by event name
by event name
No theoretical limit to the number of acquisitions in accumulate mode.
Any modification of the display will cause the display to revert back to the last data acquisition.
Table 2. Performance Measurement Characteristics.
The Serial Analysis
Tool Set
Solve Serial
Communication Problems
Your system uses serial buses to
communicate between ICs and to
transfer data to and from peripheral devices. Sifting through thousands of serial bits by looking at
long vertical columns of captured
1’s and 0’s can be very tedious,
time-consuming, and error-prone.
29
Obtain Answers to the
Following Questions:
Product Description
The Agilent Technologies B4601B
• Is my software sending the correct serial analysis tool set is a generalmessage?
purpose tool that allows easy
• Is the communication
viewing and analysis of serial data.
hardware acting as expected?
• When multiple messages are
The tool set enables you to:
involved, what order is data being • Convert acquired serial bit
transmitted?
streams into readable parallel
• How does the serial bus activity
word formats
correlate to the system processor? • Time-correlate real-time serial
• What is causing the data corruptraces to system activity
tion in my system?
• Remove stuffed bits from the data
block
• Process frame and data portions
separately
• Process serial data from a signal
with or without an external clock
reference
• Capture and analyze high-speed
(1 GHz) serial buses
The Serial Analysis
Tool Set (continued)
30
When You Want to Analyze
Serial Bit Streams . . .
...specify which signal
you want to convert to
parallel format by
selecting a specific bit
of any available label.
...accept the default
output label“Parallel”
or modify the label
name for easy
recognition.
...set the output parallel word width (up to
32 bits).
...select the specific
state in the trace where
conversion begins.
...specify the order in
which the bits occur in
the serial data stream
MSB = Most Significant
Bit first
LSB = Least Significant
Bit first.
...enable frame processing to extract all
instances of a defined
frame.
...maintain or invert the
input serial bit stream.
...capture serial data
with or without an
external clock reference. Enable clock
recovery for an incoming serial bit stream
that has no external
clock reference.
(RS-232 is an example
of a bus with clocking
embedded within the
serial bit stream).
.
The Serial Analysis
Tool Set (continued)
31
To Separate Frame
Information from the
Data Block . . .
...accept the default
start of frame label
“Start” or modify the
label to a name of
your choosing.
...specify the
pattern that
designates the start
of a frame.
...get immediate feedback as you configure
the tool set for your
data. This diagram
changes as you make
your framing and data
block selections.
...remove stuffed 0s or
0/1s from the trace
before other serial
analysis functions are
performed. Some protocols use bit stuffing to
maintain clock
synchronization.
...specify the portion of
the data block for the
serial-to-parallel
conversion.
...specify whether the
end of frame occurs at
the end of a data block
of X bits or on a specified pattern.
...accept the default
end of frame label
“End” or enter a
different name.
The Serial Analysis
Tool Set (continued)
32
To Acquire a Serial Bit
Stream without an External
Clock Reference . . .
...set the sample period
of your timing analyzer
to take four or more
samples for each
serial bit.
...accept the
“Samples” default
label or enter a new
label name.
...specify the embedded
bit time of the serial bit
stream.
...specify the incoming
signal’s data encoding
method, normal or
NRZI.
Clock Recovery Algorithm
1. For analysis purposes the data is
captured in conventional timing
mode using the internal timing
analyzer clock as the clock
reference. Set the sample period of the timing analyzer to take
four or more samples for each
serial bit.
2. The timing analyzer data is sampled in the middle of each bit
according to the serial bit rate
defined in the clock recovery
window.
3. Data edges (transitions from 0
to 1 or 1 to 0 in the timing
analyzer trace) are used to
resynchronize the sampling.
How Clock Recovery Works
Embedded bit time
Resynchronize on edge
Incoming serial bit stream
Timing analyzer samples
(with timing analyzer set
to take five samples for
each serial bit)
New “Samples”serial data
0000000000000000000001111111111111111111111111111
0
0
0
0
1
1
1
1
1
The Serial Analysis
Tool Set (continued)
33
Once the Serial Bit
Stream is Acquired . . .
This example shows the conversion of an RS232 serial bit stream. The data sent to the printer includes the column header ”MACHINE”.
...configure the
serial tool once
for your specific
bus, then save the
configuration for
future uses.
...view the
serial-to-parallel
conversion in the
format that is
easiest for you —
waveform or listing.
...display the parallel data in binary, hex,
octal, decimal, ASCII or Twos Complement.
...use the global markers and time tags to
correlate real-time serial traces to other
system activity.
...synchronize the start of the
serial-to-parallel conversion to the start of
the frame pattern for your specific bus.
...convert the data block into parallel words,
in this case 8-bit words.
...find the Nth occurrence of specific frames
or data relative to the trigger, other markers, or the beginning or end of the trace.
Markers allow you to quickly search from
frame to frame in the data.
...view the data in the order in which the bits
occur in the serial stream, in this case LSB.
The Serial Analysis
Tool Set (continued)
Product Characteristics
Data Sources
All state and timing measurement
modules supported by the 16700A
Series logic analysis systems serve
without modification as data
sources for the B4601B serial
analysis tool set. The particular
measurement module used determines time resolution and accuracy. Sample rate, channel count,
memory depth and triggering are
Maximum
serial
trace
depth
Maximum
serial bus
frequency
Minimum
serial bus
frequency
Maximum
serial
trace
depth
Maximum
serial bus
frequency
Minimum
serial bus
frequency
Clocked
Data [1]
Unclocked
Data [2]
Clocked
Data [3]
Unclocked
Data [4]
Clocked
Data
Unclocked
Data [5]
Clocked
Data [1]
Unclocked
Data [2]
Clocked
Data [3]
Unclocked
Data [4]
Clocked
Data
Unclocked
Data [5]
34
controlled by the user independent
of the serial analysis tool.
Maximum Parallel Word Width
32 bits
Because every trace is nonintrusive, and every event captured in
the trace is time-stamped, you can
correlate activity from your serial
bus with other events in the target
system.
Parallel Data Display Types
Binary, Octal, Hex, Decimal,
ASCII, Twos Complement
The Agilent Technologies 16522A
pattern generator module can be
used to generate your own serial
test data.
Off-Line Analysis and
Post-Processing
All measurements can be saved
using the file out tool. Data can be
recalled at any time for later analysis using any analysis or display
tool. Serial measurement data can
be exported to your host computer
as ASCII files.
16600A
Series
64 Kbits
16517A/
16518A
64 Kbits
16550A
16554A
16555A/D
16556A/D
8 Kbits
512 Kbits
1 Mbit/2 Mbits
1 Mbit/2 Mbits
32 Kbits
16-32 Kbits
2 Kbits
256 Kbits
1 Mbit
1 Mbit
100 Mbits/s
1 Gbit /s
100 Mbits/s
70 Mbits/s
110 Mbits/s
100 Mbits/s
62.5 Mbits/s
1 Gbit /s
125 Mbits/s
62.5 Mbits/s
125 Mbits/s
100 Mbits/s
No limit
20 Mbits/s
No limit
No limit
No limit
No limit
500 bits/s
765 bits/s
6 bits/s
500 bits/s
1.25 Kbits/s
1.25 Kbits/s
16557D
2 Mbits
16710A/711A/712A
8 Kbits/32 Kbits/128 Kbits
16715A
2 Mbits
16716A
512 Kbits
16717A
2 Mbits
1 Mbit
4 Kbits/16 Kbits/64 Kbits
1 Mbit
256 Kbits
1 Mbit
135 Mbits/s
100 Mbits/s
167 Mbits/s
167 Mbits/s
333 Mbits/s
125 Mbits/s
125 Mbits/s
167 Mbits/s
167 Mbits/s
167 Mbits/s
No limit
No limit
No limit
No limit
No limit
5 Kbits/s
5 Kbits/s
50 bits/s
50 bits/s
50 bits/s
Information in Table 3 calculated according to notes [1] to [5]:
[1] =Maximum State Memory Depth
[2] =Maximum Timing Memory Depth/4
[3] =Maximum State Frequency
[4] =Maximum Timing Frequency/4
[5]=1/(Maximum sample period x 20)
Table 3. Serial Measurement Characteristics.
35
Tool Set Licensing
Information
License Policy
The 16700A Series logic analysis
systems’ tool set software is
licensed for single-unit use only.
Licenses are valid for the life of the
tool set. Software updates do not
affect the license.
Nodelock Mode
Tool set licenses are shipped or first
installed as nodelocked applications. Nodelocked means that use
of the tool set license is only
allowed on the single node (16700A
Series analyzer) on which it is
installed. Tool sets ordered with
a 16700A Series mainframe will be
installed with a permanent password and are ready to run. For tool
sets purchased as upgrades to existing 16700A Series mainframes, you
must contact the Password Center
via e-mail, fax or phone to obtain a
password. Select ‘Obtain passwords...’ in the License Management
dialog for contact information.
Password turn-around time is generally the next business day.
Temporary Demo License
A single temporary license is available for any tool set type not previously licensed on a node. The temporary password for any node on
any tool set is “demo”. The temporary license is valid for 21 calendar
days from first entry of the password in the License Management
window of the 16700A Series logic
analysis
system.
License Management
Licenses are managed from
‘Licensing...’ under System Admin.
Licenses are reserved at the start
of a measurement session. They
remain in use until the measurement session is terminated.
Password Backup
Passwords can be backed up to
a floppy disk or network file.
Should the passwords on your
16700A Series logic analysis system hard drive become corrupted,
the tool set passwords can be
reinstated by copying your backed
up password file to:
/hplogic/licensing/license.dat
For More Information Refer to the Following Publication:
HP 16700A Series Logic Analysis System Mainframes,
HP publication number 5966-3107E
Warranty
Agilent Technologies warrants that the software and firmware
designated by Agilent Technologies for use with an instrument will
execute its programming instructions when properly installed on that
instrument. Agilent Technologies does not warrant that the operation of
the instrument software, or firmware will be uninterrupted or error free.
For a free, one-time, 21-day trial of any tool set, simply type “demo” in the
password field for the product you want to evaluate.
Ordering Information
www.agilent.com
Agilent Model Number and Description
For more information about Agilent
Technologies test and measurement products,
applications, services, and for a current sales
office listing, visit our web site:
http://www.agilent.com/find/tmdir
B4600B
B4601B
B4605B
B4620B
B4640B
System Performance Analysis (SPA) Tool Set
Serial Analysis Tool Set
Tool Development Kit
Source Correlation Tool Set
Data Communications Tool Set
Option For All Tool Sets
0D4
Do not install tool set (instructs factory to ship tool set
separately from any 16700A Series system on the order)
System Configuration
Requirements
• A 16700A Series logic analysis
system
• Desired tool set(s)
• Supported and compatible measurement hardware. (See product characteristics for each tool
set.)
Ordering and Shipment
When a tool set is ordered with
a 16700A Series mainframe, the
tool set is shipped installed and
ready to run (unless option 0D4
is ordered). Tool set proof-ofreceipt is provided by the
entitlement certificate.
Windows 95/98/NT is a registered trademark of Microsoft.
Pentium is a registered trademark of Intel Corporation.
You can also contact one of the following centers and ask for a test and measurement sales
representative
United States:
Agilent Technologies
Test and Measurement Call Center
P.O. Box 4026
Englewood, CO 80155-4026
(tel) 1 800 452
Canada:
Agilent Technologies Canada Inc.
5150 Spectrum Way
Mississauga, Ontario
L4W 5G1
(tel) 1 877 894 4414
Europe:
Agilent Technologies
Test & Measurement
European Marketing Organisation
P.O. Box 999
1180 AZ Amstelveen
The Netherlands
(tel) (31 20) 547 9999
Japan:
Agilent Technologies Japan Ltd.
Measurement Assistance Center
9-1, Takakura-Cho, Hachioji-Shi,
Tokyo 192-8510, Japan
(tel) (81) 426 56 7832
(fax) (81) 426 56 7840
Latin America:
Agilent Technologies
Latin American Region Headquarters
5200 Blue Lagoon Drive, Suite #950
Miami, Florida 33126
U.S.A.
(tel) (305) 267 4245
(fax) (305) 267 4286
Australia/New Zealand:
Agilent Technologies Australia Pty Ltd
347 Burwood Highway
Forest Hill, Victoria 3131
(tel) 1-800 629 485 (Australia)
(fax) (61 3) 9272 0749
(tel) 0 800 738 378 (New Zealand)
(fax) (64 4) 802 6881
Asia Pacific:
Agilent Technologies
24/F, Cityplaza One, 1111 King’s Road,
Taikoo Shing, Hong Kong
tel: (852)-3197-7777
fax: (852)-2506-9284
Technical data is subject to change
Printed in U.S.A.
5966-3147E
12/99