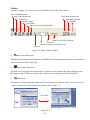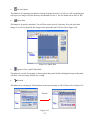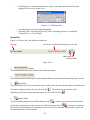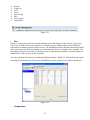
1
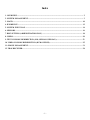
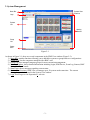
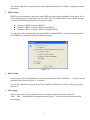
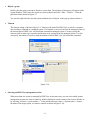
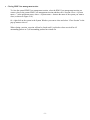
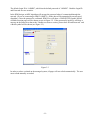
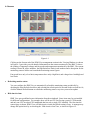
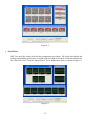
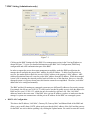
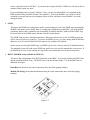
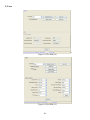
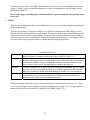
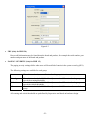
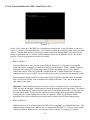
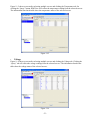
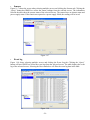
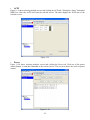
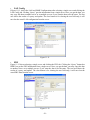
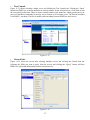
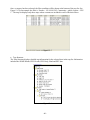
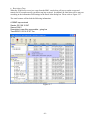
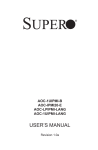
IPMI View User Guide
Version 2.5
Copyright © 2003-2006 Super Micro Computer, Inc., All rights reserved.
Index
1. OVERVIEW...................................................................................................................................................... 2
2. SYSTEM MANAGEMENT............................................................................................................................. 3
3. LOGIN ............................................................................................................................................................. 10
4. IPM DEVICE .................................................................................................................................................. 12
5. SYSTEM EVENT LOG ................................................................................................................................. 14
6. SENSORS ........................................................................................................................................................ 16
7. BMC SETTING (ADMINISTRATOR ONLY) ........................................................................................... 18
8. USERS.............................................................................................................................................................. 20
9. TEXT CONSOLE REDIRECTION (SOL, SERIAL OVER LAN)........................................................... 23
10. VIDEO CONSOLE REDIRECTION (KVM OVER IP) .......................................................................... 25
11. GROUP MANAGEMENT........................................................................................................................... 31
12. TRAP RECEIVER........................................................................................................................................ 38
-1-
IPMI View (IPMI Over LAN)
1. Overview
IPMI View is management software based on IPMI specification version 1.5 - 2.0. IPMI View sends IPMI
messages to and from the BMC (Base Management Card) on a remotely managed system. IPMI messages are
encapsulated in RMCP (Remote Management Control Protocol) packets called “datagrams”. This method is
also referred to as “IPMI over LAN”.
The Distributed Management Task Force (DMTF) has defined RMCP for supporting pre-OS and OS-absent
management. RMCP is a simple request-response protocol that can be delivered using UDP (User Datagram
Protocol) datagrams. IPMI-over-LAN uses version 1 of the RMCP protocol and packet format. An RMCP
packet is transmitted via IP (Internet Protocol) networking. Thus, system managers may manage their IPMIenabled system over the Internet. (Of course, in a private LAN this is a basic feature.) IPMI uses the same
UDP port number (623 in decimal) with ASF (Alert Standard Forum) protocol. If the managed system is
protected by a firewall, UDP port 623 must be opened.
In Supermicro’s IPMI solution, a BMC shares the LAN1 NIC on the mainboard. (If there are more than one
LAN Ports on the mainboard, LAN1 is the one near Keyboard/Mouse Port.) The NIC will re-route the IPMI
packet to the BMC instead of forwarding it to the upper layer network protocol stacks (as other protocol packets
do).
IPMI View V2.0 covers Supermicro’s BMCs for both IPMI v1.5 and IPMI v2.0. However, according to design
changes, some functions added to IPMI v2.0 are not available in IPMI v1.5, and some functions are no longer
available in IPMI v2.0 implementation. IPMI View will automatically hide any function that is not available to
the BMC version being used.
-2-
2. System Management
Menu Bar
System View
Sessions
Logo
System
List
Viewing
Window
Group
List
Status
Area
Figure 2-1
As shown in Figure 2-1, there are several components in the IPMI View window (Figure 2-2):
1) Menu Bar: contains functions allowing you to add/delete systems or groups and save configurations.
2) System List: lists the computers managed with a BMC card.
3) Group List: lists managed computer groups for more convenient management.
4) Viewing Window: shows detailed information including Login, IPMI Device, Event Log, Sensors, BMC
Setting and Text Console.
5) Status Area: shows messages regarding current status.
6) System View Sessions: IPMI View can manage up to 20 systems at the same time. The current
managed system is indicated in the System View window.
7) Logo: Press Logo to visit Supermicro’s web site.
-3-
Figure 2-2
•
Adding a new system to IPMI View
Figure 2-3
As shown in Figure 2-3, click “File>New…>System” to add a new system to IPMI View. An “Add a
new system…” dialog box will pop up as shown in Figure 2-4.
Figure 2-4
-4-
In the “Add a new system” dialog box, type in the desired System Name for the managed system and the
correct IP address, as well as a description. Then click OK.
•
Adding a new group to IPMI View
To maintain systems easier, the manager may categorize managed systems into different groups. A
system may be included in multiple groups. The default group is “IPMI Domain”. All managed
systems belong to IPMI Domain even if they join other groups.
In Figure 2-3, click menu “File>New…>Group” to add a new group to IPMI View.
An “Add a new group” dialog will pop up as shown in Figure 2-5.
Figure 2-5
In the “Add a new group” dialog box, type in the desired Group Name and description. Then click OK.
•
Discover New Systems in a Specified Network
IPMI View includes a function that allows the user to collect candidate system information in order to
build their information into a System List (see Figure 2-6). The user may specify the IP range or click
“Detect” to search any possible system that has either IPMI 1.5 or IPMI 2.0 capability. After the
candidate system information is collected, the user may add systems into a System List by IP addresses
or by a given Prefix name. The “IPMI 2.0+” list in version column means this system is IPMI 2.0
RMCP+ protocol supported.
-5-
Figure 2-6
•
Reload Configuration
From the pull-down menu, click “File>Reload Configuration” to load the previous saved configuration.
•
Save Configuration
From the pull-down menu, click “File>Save Configuration” to save the current IPMI View configuration.
•
Exit IPMI View
From the pull-down menu, click “File>Exit” or press Alt-F4 when the IPMI View is running to exit
IPMI View. Remember to save your configuration before exiting.
Figure 2-7
•
Modify System
Select a system in the System Window you want to modify and then click “Edit>Modify…>System”
from the pull-down menu shown in Figure 2-7 to modify it.
You can also right click on a system in the System Window and then select “Modify” in the pop-up
menu to modify it.
•
Delete System
Select a system in the System Window you want to delete and then click “Edit>Delete…>System” from
the pull-down menu shown in Figure 2-7 to delete it.
You can also right click on a system in the System Window and then select “Delete” in the pop-up menu
to delete it.
•
Modify Group
Select a group in the Group Window you want to modify and then click “Edit>Modify…>Group” from
the pull-down menu shown in Figure 2-7 to modify it.
-6-
You can also right click on a group in the Group Window and then select ”Modify” in the pop-up menu
to modify it.
•
IMPI Security
IPMIView can automatically detect the current IPMI version during the beginning of login phase. If you
want to manually specify the protocol, you may check the “For Advanced User” box as shown in Figure
2-8 and select the following protocols for a specific system.
Hardware: BMCB, Firmware:IPMI 1.5:
Hardware: BMC2, Firmware:IPMI 2.0 non-RMCP+:
Hardware: BMC2, Firmware:IPMI 2.0 Standard RMCP+.
You may choose the encryption function in the IPMI 2.0 Standard RMCP+. All the packets transmitted
from IPMIView to managed system will then be encrypted.
Figure 2-8
•
Delete Group
Select a group in the Group Window you want to delete and then click “Edit>Delete…>Group” from the
pull-down menu shown in Figure 2-7 to delete it.
You can also right click on a group in the Group Window and then select ”Delete” in the pop-up menu
to delete it.
•
Join a group
Select a group in the Group window and select a system in the System Window, then click
“Edit>…Join…” from the pull-down menu shown in Figure 2-7 to have the selected system join the
desired group.
-7-
•
Disjoin a group
Double click the group you want to disjoin a system from. The members of that group will appear in the
System Window. Then, select the system you want to disjoin and click “Edit>…Disjoin…” from the
pull-down menu shown in Figure 2-7.
You can also right click the selected system and then select “Disjoin” in the pop-up menu to delete it.
•
Timeout
The timeout setting is shown in Figure 2-9. Timeout is the period for IPMI View to wait for a response
after sending a command to a managed system. If a response is not received from the managed system in
the timeout period, IPMI View will resend the command to managed system. You may specify the
timeout value in order to get a quicker notification of no response from the managed system. You also
can specify the number of retries to limit the number of times IPMI View will resend the command.
Figure 2-9
Figure 2-10
•
Selecting an IPMI View management session
When more than one system is managed by IPMI View at the same time, you can select which opened
management session you want to control by double clicking on system’s name in the System Window or
by selecting “Session><<System name>>” in the pull-down menu, where <<System name>> denotes
the name of the target system you want to control (as shown in Figure 2-10).
-8-
•
Closing IPMI View management session
To close the opened IPMI View management session, select the IPMI View management session you
want to close as the current IPMI View management session and then click “Session>Close <<System
name>>” in the pull-down menu, where <<System name>> denotes the name of the system you want to
close (as shown in Figure 2-10).
Or - right click on the system in the System Window you want to close and select “Close Session” in the
pop-up menu to close it.
When closing a session, a session will not be closed until 1) replies have been received for all
outstanding packets or 2) all outstanding packets have timed out.
-9-
3. Login
•
Login
In Figure 3-1, double click the system in the System Window you want to manage. A login screen along
with some information about the managed system will appear in the Viewing Window. Type in the login
ID and password and click the Login button to log in. When a login is successful, the connection
information will be shown at the bottom. The Login button is grayed (i.e. disabled) and the Logout
button is enabled as well as the availability of other management functions. as shown in Figure 3-2.
Figure 3-1
Figure 3-2
- 10 -
The default Login ID is “ADMIN”,,which has the default password of “ADMIN”. Both the Login ID
and Password are case-sensitive.
In the IPMI design, an MD5 algorithm will encrypt the password when it’s transmitted through the
network. (If you are connecting to IPMI 2.0 RMCP+, all the data will be transmited by an encrypted
algorithm.) Once the password is confirmed, IPMI View will show a CONNECTED symbol, and all
available function pages will be shown as seen in Figure 3-2. If the password is invalid, it will show a
message in the Status Area that reads “Unable to activate a session, please check ID and Password” and
a Break symbol will be shown (see Figure 3-3).
Figure 3-3
In order to reduce overhead on the managed system, all pages will not refresh automatically. The user
must refresh manually as needed.
- 11 -
4. IPM Device
Figure 4-1
Clicking the IPM Device tab of the IPMI View management session in the Viewing Window (shown in
Figure 4-1) will display some information and functions of the system’s BMC firmware.
•
Device Information
This shows the revision levels of the BMC and IPMI firmware.
•
ACPI System Power State
This shows the managed system’s power state. If the managed system is in a power-off state, the green
light will be off. This status will update automatically every five seconds.
•
Graceful Power Control (Administrator and Operator only)
Graceful power control will inform the OS running on the managed system to shutdown/reboot/powercycle within a specified time (the default is 30 seconds). When the OS running on the managed system
receives a graceful power control request, it will generate a pop-up window on the managed system’s
monitor and start a count down. This pop-up notice window gives the user who is working on the
system a chance to save any working files. However, remote login users or service users (for example
Web site visitors) will not see this notice.
Graceful Shutdown: same as the shutdown function in Windows. The managed system will enter an
S5 state.
- 12 -
Graceful Reboot: same as the reboot function in Windows.
Graceful Power Cycle: this function is a combination of the Graceful Shutdown and Power Up
functions.
The Power Cycle function will shut down the managed system for a few seconds and then power up the
system. Graceful power control will send an event to the System Event Log (next section). If no more
memory space is left for the incoming event, graceful power control will not function.
•
Chassis Power Control (Administrator and Operator only)
This function is used to forcibly control the power state of the managed system’s chassis. When the
BMC receives a chassis power control command, it will have direct control over the power button or
reset button of a system.
Reset: this is the same as pressing the Reset button on a managed system’s chassis to reset the managed
system.
Power Down: this is the same as pressing the Power button on a managed system’s chassis to remove
power from the managed system.
Power Up: this is the same as pressing the Power button on a managed system’s chassis to turn on the
power of the managed system.
Power Cycle: this function is a combination of the Power Down and Power Up functions.
The Power Cycle function will shutdown the managed system for a few seconds and then power up the
system.
•
BMC Cold Reset (Administrator only)
Clicking the Cold Reset button allows you to reset the BMC. After confirming to reset the BMC, the
session will break immediately. The user has to close this session manually. This function is rarely used,
only in events such as when a malfunction is suspected.
- 13 -
5. System Event Log
Figure 5-1
Clicking on the Event Log tab of the IPMI View management session in the Viewing Window (shown
in Figure 5-1) gives you detailed information on the System Event Log for the BMC. It shows the
System Event Log version, number of log entries, free space for the System Event Log and the times of
recently added and recently erased System Event Logs.
•
Get System Event Log
In the Get Entries group on the upper left side of the Event Log tab in the Viewing Window, you can
decide how many logs you want to get from the BMC. Click the From button and type in the first and
last numbers of the logs you wish to view, or click the All button to get all the logs from the BMC. The
logs retrieved from the BMC will listed as a table in the central part of the Viewing Window. Please
refer to the IPMI specifications version 2.0 for detailed descriptions of each field. Some helpful fields:
Timestamp: the time the event happened.
Sensor Type: this could be health sensors or a system event.
Event Type: the event description.
Because the BMC communicates with the NIC on the mainboard via a slow channel, it is recommended
that you request only the events you need to see. Choosing "all" to get hundreds of event entries will
result in a very long delay.
- 14 -
•
Clear System Event Log
Clicking the Clear All Entries button clears the logged system events on the BMC. The total event log
space is 16 KB. When all this space is used, any incoming event will be lost. The user has to clear the
system event log manually as needed.
•
Time stamp of System Event Log and Time Zone
To set the time stamp of the BMC on the managed system, type in the time in the Current SEL Device
Timestamp field. Then click the Set Timestamp button to update the BMC.
Timestamp and Time Zone reflect the managed system’s local time.
(The Time Zone setting is only available for IPMI 1.5)
- 15 -
6. Sensors
Figure 6-1
Clicking on the Sensors tab of the IPMI View management session in the Viewing Window (as shown
in Figure 6-1) provides you with detailed information on the sensors monitored by the BMC. It shows
the reading of supported voltages and fan speeds and temperatures monitored by the BMC. The current
reading is shown in yellow numbers, the high limits/low limits in red numbers and a description for the
monitoring sensors in blue text beneath the monitoring sensor figures.
Fan speeds have only a low limit, temperatures have only a high limit, and voltages have both high and
low limits.
•
Refreshing monitor status
You can configure the IPMI View to automatically refresh the monitoring status periodically by
checking the Auto Refresh check box and selecting the refresh period in seconds in the seconds list. Or,
click the Manual Refresh button to refresh the monitoring status every time you need an update.
•
Hide inactive item
IPMI View gets predefined sensor information from the mainboard. Some items may be not installed
for different configurations. For example, there will be no CPU fan if using a passive CPU heatsink,
and only one CPU on a dual CPU mainboard that has only a single CPU installed. The first time the
sensors page is shown, IPMI View will hide inactive items (the default setting) if any. A manager may
change this option later by un-checking the “Hide inactive item” box, as shown in Figure 6-2.
- 16 -
Figure 6-2
•
Show History
IPMI View provides a history chart for fans, temperatures and voltages. The yellow line indicates the
reading corresponding to the sensor. A red line indicates a high or low limit. A blue line indicates the
base value of 0 (zero). Check the “Show History” box to display these charts, as shown in Figure 6-3.
Figure 6-3
- 17 -
7. BMC Setting (Administrator only)
Figure 7-1
Clicking on the BMC Setting tab of the IPMI View management session in the Viewing Window (as
shown in Figure 7-1) gives you detailed information on the BMC LAN Configuration, SNMP trap
configuration and serial communication port of the BMC.
In order to support the power-down state management capability under the IPMI specification, the
manager has to configure the proper MAC address for each IP address. To deliver an IP packet to a
receiver, the sender needs to know the receiver’s MAC address or the gateway’s MAC address. ARP
(Address Resolution Protocol) is used to get the MAC address from the IP address. While the managed
system’s OS is running, the network protocol stack will take care of this function. However, when the
managed system is in a power down state, this function cannot be accomplished. Therefore, each MAC
address has to be configured manually.
The BMC and the OS running on a managed system may use different IP addresses for security reasons.
For example, the OS may use 66.201.4.73 (which can be reached by public access) while the address for
BMC may be set to 192.168.1.55, which can only be reached in a private LAN. But, LAN MAC
addresses must be the exact same. If the BMC uses a private IP address, you have to make sure that the
manager’s system can communicate with the private IP address for the BMC on a managed system.
•
BMC LAN Configuration
This shows the IP address, LAN MAC, Gateway IP, Gateway MAC and Subnet Mask of the BMC and
allows you to modify them. NOTE: please make sure that the MAC address of the LAN and the gateway
for the BMC are correct before updating it by clicking the Update button. Be careful to enter the correct
- 18 -
values, especially for the LAN MAC. If you enter the wrong LAN MAC, IPMI View will not be able to
connect to that system any more.
If you accidentally enter a wrong LAN MAC value, you may use the IPnMAC.exe command in the
IPMI Solution/Utility subfolder on this CD to update it. To activate IPnMAC.exe,,which is a DOS
command, you must first boot your managed system to DOS, and then execute IPnMAC.exe on the
managed system.
•
SNMP
This shows the SNMP trap configuration of the system needing to receive the SNMP traps generated by
the BMC and allows you to modify them. To change the configuration on the BMC, type in the SNMP
community name in the Community text field and the IP address and MAC address in the SNMP Trap
Receivers table in the SNMP group, and then click the Update button.
The SNMP Trap may have multiple destinations. When any critical error occurs, an SNMP trap packet
will be sent to all receivers in the list. To remove an SNMP receiver, you may change both IP and MAC
addresses to 0.0.0.0 and 00:00:00:00:00:00 respectively, and then click Update.
On the system receiving the SNMP traps, an SNMP trap receiver software needs to be installed and run.
The managed system will send out an SNMP trap packet to receivers at the moment the event occurs. If
an SNMP trap receiver is not running, the trap packet is discarded and won’t be queued anywhere.
•
RS232 / MODEM (Only available for IPMI 1.5)
This shows the configuration of the RS232 interface on the BMC. It is used to initialize the RS232 port
and the installed modem, if any. The RS232 port is the box-header (Figure 7-2) on the BMC and is a
dedicated serial port.
Baud Rate: the baud rate for serial connections (does not affect paging settings).
Modem Init String: the modem initialization string for serial connections (does not affect paging
settings).
Figure 7-2
- 19 -
8. Users
b
Figure 8-1 (For IPMI 2.0)
Figure 8-2 (For IPMI 1.5)
- 20 -
Clicking on the Users tab of the IPMI View management session in the Viewing Window (as shown in
Figure 8-1 and 8-2) gives you detailed information on the Users management, and the paging severity
thresholds for IPMI 1.5.
We strongly suggest you change passwords immediately to prevent malicious users getting control
before you.
•
USERS
There are several buttons that allow you to add/delete a user, set user privileges, change passwords and
enable/disable paging.
There are six privilege level groups, Callback, User, Operator, Administrator, OEM, and No Access.
Only the first four privilege levels are implemented. Privilege Levels determine which IPMI commands
a given user can execute over a given channel. Privilege Limits set the maximum privilege level that a
user can operate at. A user is configured with a given maximum privilege limit for each channel. Thus, a
user can operate at a privilege level that is no higher than his group privilege limit.
Callback
User
Operator
Administrator
Group Privilege Levels
This may be considered the lowest privilege level. Only commands necessary to
support initiating a Callback are allowed. (Only available for IPMI 1.5.)
Only ‘benign’ commands are allowed. These are primarily commands that read data
structures and retrieve status. Commands that can be used to alter BMC configuration,
write data to the BMC or other management controllers or perform system actions
such as resets, power on/off, and watchdog activation are not allowed.
All BMC commands are allowed, except for configuration commands that can change
the behavior of the out-of-band interfaces. For example, Operator privilege does not
allow the capability to disable individual channels or change user access privileges.
All BMC commands are allowed, including configuration commands. An
Administrator can even execute configuration commands that would disable the
channel that the Administrator is communicating over.
Clicking on Paging Setting allows you to set the parameters for an individual user (Figure 8-3). There
are two types of paging services: Numeric paging and alphanumeric paging. To use a paging service, a
modem must be connected to the RS232 connector on the BMC (Figure 7-2).
- 21 -
Figure 8-3
•
FRU (Only for IPMI 2.0)
Here useful information may be found about the board and product, for example the serial number, part
number and part name of the board and product.
•
PAGING / SEVERITY (Only for IPMI 1.5)
The paging severity settings define when users will be notified of entries in the system event log (SEL).
The following settings are available for each group:
None
When this is selected, user notification for this group is inactive.
Warning
When this is selected, the RMC will notify users when SEL entries for the group
exceed the warning thresholds.
When this is selected, the RMC will notify users when SEL entries for the group
exceed the critical thresholds.
When this is selected, the RMC will notify users of all SEL entries of events for the
group.
Critical
All
All warning and critical thresholds are predefined by Supermicro and based on hardware design.
- 22 -
9. Text Console Redirection (SOL, Serial Over LAN)
Figure 9-1
On the Text Console tab of the IPMI View management session in the Viewing Window (as shown in
Figure 9-1), there is a function that allows you to remotely control the managed system from a text mode
console. Click the Start button to start the text console redirection. During control, click the ReSynch
button to synchronize the text console with the managed system if you think the screen is not shown
properly. Click the Stop button to stop the text console.
•
BMC for IPMI 1.5
Console Redirection is not a function in the IPMI specification V1.5. Supermicro provides this
useful function for a manager to control the managed system remotely. When a managed system is
booting up and in the POST routine and no other software application can give you control to
redirect the console, IPMI View offers this valuable function. Console Redirection will dump a
managed system’s screen to IPMI View and send the key codes you entered in the managed system.
When a managed system switches its video mode from Text Mode to Graphics Mode, a terminate
notice will be sent to IPMI View to terminate the console redirection. Text Console Redirection
only works for text mode.
Important: Console Redirection puts a very heavy load on a managed system. It will dump the
whole screen to the manager’s system and slow down the managed system significantly. We suggest
you use this function only when you need to get special control and cannot achieve it any other way.
For other applications, a proper console redirection software application (pcAnywhere, Symantec
Corporation) or a remote login protocol (telnet) is suggested. When you finish your remote
operation, click Stop to terminate console redirection to take the load off the managed system.
•
BMC for IPMI 2.0
IPMI specification V2.0 defines Serial Over LAN (SOL) to support Text Console Redirection. This
implementation performs better than the one we implemented for IPMI 1.5. The Text mode console
remains working on Windows 2003, even when the OS is running. To support Text Console
- 23 -
Redirection on Windows 2003, Special Administration Console (SAC) must be enabled. The
following instruction is used to enable SAC:
1. Enable Console Redirection in BIOS, and set it to COM 2 (or COM B)
2. Modify boot.ini in C:\. Boot.ini is a hidden file. Below is an example of boot.ini
[boot loader]
redirect=com2
redirectbaudrate=19200
timeout=30
default=multi(0)disk(0)rdisk(0)partition(1)\WINDOWS
[operating systems]
multi(0)disk(0)rdisk(0)partition(1)\WINDOWS="Windows Server 2003, Standard" /fastdetect
/redirect
For Text Console Redirection on a Linux Platform
1. Host A with IPMI BMC installed (Linux Platform):
a) BIOS POST:
(i) Enable "Console Redirection" in BIOS Setup.
For example, COM2 / 19.2Kbps / 8N1
(ii) Disable "Enable Console Redirection after POST" in BIOS setup.
b) BOOT LOADER:
(i) For GRUB, add the following TWO lines into /boot/grub/grub.conf, but
comment out "splashimage=(hd0,0)/grub/splash.xpm.gz"
serial --unit=1 --speed=19200 --word=8 --parity=no --stop=1
terminal --timeout=10 serial console
#splashimage=(hd0,0)/grub/splash.xpm.gz
(ii) Then add "serial console=ttyS1,19200n8" to the end of kernel /vmlinuz in
/boot/grub/grub.conf.
For example:
kernel /vmlinuz-2.6.5-1.358smp ro root=LABEL=/ rhgb quiet serial
console=ttyS1,19200n8
This will result in all boot messages being output to console ttyS1, and you will not see
all these boot messages on the local console until the login message prompts.
c) LINUX OS:
(i) Add the following line into /etc/inittab.
s0:2345:respawn:/sbin/agetty ttyS1 19200
(ii) Edit /etc/securetty and add ttyS1
2. Host B with IPMIView installed:
a) Install and run IPMIView.
b) Log in Host A with IPMI BMC installed as Admin.
c) Start Console Redirection in IPMIView right after the Host A reboots.
You will see the BIOS POST, the boot loader, and the Linux OS messages and prompts.
- 24 -
10. Video Console Redirection (KVM over IP)
Video Console Redirection is a new feature included in Supermicro IPMI. In the Video Console Redirection
tab, the remote screen will be redirected to IPMIView if this function is enabled. BIOS POST, BIOS settings,
DOS, Windows or Linux OS screens can all be redirected to IPMIView. Furthermore, it provides a drive
redirection function for mounting your local device as a virtual device for a remote managed system. The local
device could be a CD-ROM or a hard drive and could be accessed from the remote managed system.
Figure 10-1 show sample screenshots of Video Console redirection. The screen of a remote managed system
will be redirected to IPMIView. It will appear to you just as if you are sitting in front of the remote system.
System Boot Up
BIOS Screen
Windows XP
Linux X
Figure 10-1
- 25 -
Toolbar
As shown in Figure 10-2, there are several tool buttons used for the video console.
Start Video Redirection
Stop Video Redirection
Full Screen
Screen Capture
Quick Shot
Open or Close Quick Shot Panel
Open Drive Redirection
Auto Adjust Screen
Options
Send Ctrl+Alt+Del to Remote
Zoom Out
Select Percentage for Scaling Screen
Zoom In
Figure 10-2 Video Console Toolbar
•
Start Video Redirection
This button is for starting video redirection. The IPMIView will automatically start the video redirection
when you click the Video console tab.
•
Stop Video Redirection
This button is for stopping video redirection. If you don’t want to continue the video redirection, press
this button to stop it. Please note that the drive redirection will continue working when enabled.
•
Full Screen
This button is for maximizing the remote video screen in the local computer screen. You may press “alt
+ enter” to return back to the original mode. Please refer to Figure *-3.
Alt + enter
Figure 10-3
- 26 -
•
Screen Capture
This button is for capturing screenshots of remote managed systems. You will see a file save dialog box
with a preview image. Select the directory and filename to save it. The file format can be PNG or JPG.
•
Quick Shot
This button is for quick screenshots. You will first need to specify a directory for saved quick shot
images. You will see the quick shot images in the quick shot panel. Please refer to Figure 10-4.
Figure 10-4 Quick Shot
•
Open or Close a Quick Shot Panel
This button is a switch for opening or closing quick shot panel. Double clicking the image in this panel
will show a full size image window for viewing.
•
Zoom In
This button is for zooming in. The maximum zoom out percentage is 300%. Please refer to Figure 10-5.
Zoom In
Figure 10-5
- 27 -
•
Zoom Out
This button is for zooming out. The maximum zoom out percentage is 10%. Please refer to Figure 10-6.
Zoom Out
Figure 10-6
•
Select percentage for Scaling Screen
This is a combo box for selecting the percentage of screen scaling, either 10%, 25%, 50%, 75%, 100%,
200%, 250% or 300%. An additional selection allows you to scale to fit with the IPMIView window size.
•
Send Ctrl + Alt + Del to Remote
This is a button for sending Ctrl + Alt + Del key combination to remote. It is useful when the remote
managed system is running BIOS, DOS or Windows login.
•
Open Drive Redirection Panel
This button is used to open a drive redirection panel. The drive redirection panel will appear at the
bottom of the window, as shown in Figure 10-7.
Figure 10-7 Open Drive Redirection Panel
- 28 -
Drive redirection can use your CD-ROM or hard driver as a virtual device for a remote system. In the
Drive direction panel, select which drive you want to be a virtual device for a remote system and press
connect. The remote managed system will recognize it as an external USB device. See Figure 10-8 for
reference.
Figure 10-8 Drive Redirection Panel
•
Auto Adjust Screen
This is a button for auto adjusting the screen. Press this button if it’s difficult to see the whole screen.
•
Options
You can select more options here. Below is the list of options.
o Monitor Only: Only shows remote screen and disables keyboard and mouse.
o Readability Filter: Applies a smooth algorithm to the screen. This lets you see the content
easier when you scale the screen.
o Local Cursor: Change local cursor.
o Chat Window: Multiple users can chat with this window. Please refer to Figure 10-9.
Figure 10-9 Chat Window
o Video Settings: Here you can give specified detailed settings for the video. Please refer to
Figure 10-10.
Figure 10-10 Video Settings
o Refresh Video: Refreshes the video screen.
- 29 -
o Soft Keyboard: A virtual keyboard for easy input. It also provides localized keyboard
mapping. Please refer to Figure 10-11.
Figure 10-11 Soft Keyboard
o Local Keyboard: Sets local keyboard mapping.
o Encoding: This is encoding for the video screen. Encoding options are “Predefined”,
“Compression” or “Color Depth”.
Status Bar
Figure 10-12 shows the video redirection status bar.
Message
Frames per second and In/Out bytes per second
Share Mode
Monitor Mode
Figure 10-12
•
Message
This section shows tool tip info and the video redirection status.
•
This section shows the frames per second and Input (Kbytes per second) and Output (bytes per second).
•
Share Mode
This icon indicates the remote screen share status. If there only one user has started the video redirection
of a remote managed system, the icon will look like
. If two or more users start the video
redirection of the same remote managed system, the icon will look like
•
.
Monitor Mode
This icon indicates monitor mode. When displayed like
, it means you can use the local keyboard
and mouse to control the current remote screen. When is appears like this
, it means you cannot use
the local keyboard and mouse to control the remote screen. If you select the “monitor only” option, the
keyboard and mouse will be disabled.
- 30 -
11. Group Management
Group management is a way to manage multiple servers at the same time. For example, you can query the fan
sensor reading from multiple servers and note their differences. Also, you can simultaneously power on or off
multiple servers at the same time. As shown in Figure 11-1, click Manage>Group to show group management.
In group management, you can select multiple servers from the host group on the left and manage them with the
functions provided. You may make groups of servers in the group list to make server group management easier.
Figure 11-1
For group management, a Login ID and password are required. Click Manage > Setting to set the login
information. Please note that IPMIView will use this account to login to multiple servers. (Figure 11-2)
Figure 11-2
IPMIView provides various tools for group management. As shown in Figure 11-3, group management can be
separated to the following category.
Fan
Temperature
Voltage
- 31 -
Sensors
Event Log
ACPI
Power
LAN Config
FRU
Text Console
General Info
Figure 11-3
Fan
Figure 11-4 shows the view after selecting multiple servers and clicking on the Fan tab. You can use
Ctrl+Click or Shift+Click for selecting servers. Clicking “Query” button will then have IPMIView
collect the fan readings from the selected servers. The information listed in the table show the fan status
of the selected servers. If the fan reading is in red it means the fan may be broken or not installed. If a
fan reading is below the low limit, it will also be in red. Administrators should be concerned about red
marked fans to make sure the system is healthy.
You may refresh the fan status by checking the Reflash checkbox. IPMIView will refresh the fan status
according to the selected time. Please note that IPMIView won’t refresh if you switch to another tab.
Figure 11-4
Temperature
- 32 -
Figure 11-5 shows a screen after selecting multiple servers and clicking the Temperature tab. On
clicking the “Query” button, IPMIView will collect the temperature reading from the selected servers.
The information listed in the table show the temperature status of the selected servers.
Figure 11-5
Voltage
Figure 11-6 shows a screen after selecting multiple servers and clicking the Voltage tab. Clicking the
“Query” tab will collect the voltage readings from the selected servers. The information listed in the
table show the voltage status of the selected servers.
Figure 11-6
- 33 -
Sensors
Figure 11-7 shows the screen when selecting multiple servers and clicking the Sensors tab. Clicking the
“Query” button has IPMIView collect the sensor readings from the selected servers. The information
listed in the table show the sensors status of the selected servers. The sensors here are chassis status and
power supply status. If the chassis was opened or a power supply failed, the reading will be in red.
Figure 11-7
Event log
Figure 11-8 shows selecting multiple servers and clicking the Event Log tab. Clicking the “Query”
button will have IPMIView collect the event logs from the selected servers. The table displays the event
log of the selected servers. Selecting the Host combo box will filter the event log data in the table.
Figure 11-8
- 34 -
ACPI
Figure 11-9 shows selecting multiple servers and clicking the ACPI tab. Clicking the “Query” button has
IPMIView collect the ACPI state from the selected servers. The table displays the ACPI state of the
selected servers.
Figure 11-9
Power
Figure 11-10 shows selecting multiple servers and clicking the Power tab. Click one of the power
control buttons to send that command to the selected server. The text area shows the result of power
control.
Figure 11-10
- 35 -
LAN Config
Ffigure 11-11, shows the LAN and SNMP Configurations after selecting a single server and clicking the
LAN Config tab. Clicking “Query” gets the information from a single server. Once you get the data, you
may copy this data to another server or to multiple servers if you want the data to be the same. The text
area shows the results of a query and update. The clear button is for clearing the text field only; it will
not clear the actual LAN configuration from the server.
Figure 11-11
FRU
Figure 11-12 shows selecting a single server and clicking the FRU tab. Clicking the “Query” button has
IPMIView get the FRU information from a single server. Once you get the data, you may copy this data
to another server or to multiple servers if you want the data to be the same. The text area shows the
results of a query and update. The clear button is for clearing the text field only; it will not clear the
actual FRU data from the server.
Figure 11-12
- 36 -
Text Console
Figure 11-13 shows selecting a single server and clicking the Text Console tab. Clicking the “Open”
button has IPMIView create an internal text console window for the selected server. Click Start to start
the text console redirection. There are power control buttons in the status bar, which provide power on,
power off and Reset commands for an easy way to turn on or off a remote server. The Encode checkbox
is for RMCP+ encoding. Check it to enable packet encoding between IPMIView and a server.
Figure 11-13
General Info
Figure 11-14 shows the screen after selecting multiple servers and clicking the General Info tab.
Selecting the fields you want to query from the servers and clicking the “Query” button will have
IPMIView collect that information from the selected servers.
Figure 11-14
- 37 -
12. Trap Receiver
Trap Receiver is a utility used for receiving traps from the BMC. In the event of a sensor error or a
sensor reading that exceeds a threshold, the BMC will send SNMP traps to the destinations set in BMC.
Trap Receiver is executed on the destination site and receives the SNMP trap from multiple senders
(BMC). If you select a category you can see all the traps in that category. Furthermore, when you click a
trap in the trap list, you can see its details in the Trap Structure window. Please refer the BMC Setting
page in IPMIView to set the SNMP destination.
As shown in Figure 12-1, there are several components to the IPMI Trap Receiver.
1) Menu Bar: contains pull-down menus for exiting the program, getting help, etc.
2) Tool Bar: contains all IPMI Trap Receiver functions.
3) Category: categorizes the traps by Sender, Community and Sensor.
4) Trap Structure: a tree structure for displaying trap details.
5) Status Bar: shows messages regarding current status.
6) Trap List: shows detailed information for received traps.
Menu
MenuBar
Bar
Tool Bar
Category
Trap List
Trap
Structure
Status Bar
Figure 12-1
•
Tool Bar functions
The tool bar provides the following functions, as shown in Figure 12-2.
Figure 12-2
o Start: starts Trap Receiver.
o Stop: stops Trap Receiver.
- 38 -
o
o
o
o
Save: saves the received traps into a file.
Load: loads a saved trap file into Trap Receiver.
Clear: clears all the traps in the trap list.
Email: displays an Email alert setting dialog box (see Figure 12-3). Fill in the SMTP server,
From (email address) and To (email address) fields. Please notice that the From and To email
addresses must be valid in the SMTP server. If the SMTP server requires authentication,
please fill in the username and password fields. Once the necessary fields have been filled in,
click the Test button to verify that the email function works.
Figure 12-3
• Category
There are three categories (each with a tab used to select it): Sender, Community and Sensor, as shown
in Figure 12-4. The Sender page lists all the sender IP addresses. The Community page lists all the
SNMP communities. The Sensor page lists all the sensor types from the traps. Clicking on each category
type will act as a filter for all traps in the traps list. Click on the “All” button to cancel all filters.
Figure 12-4
- 39 -
Once a category has been selected, the filter condition will be shown at the bottom of the trap list. See
Figure 12-5 as an example: the filter is “Sender = 192.168.10.245, Community = public, Sensor = CPU
1”. The trap list displays only those traps whose contents are included in each of the three filters.
Figure 12-5
• Trap Structure
The Trap Structure displays detailed trap information for the selected item in the trap list. Information
includes the SNMP Header, PDU Header, PDU Body, Bind and PET data.
Figure 12-6
- 40 -
• Receiving a Trap
When the Trap Receiver receives a trap from the BMC, an alert bar will pop up on the screen and
remain for 10 seconds to notify you that a trap has occurred. In addition, an email alert will be sent out
according to the information field settings in the Email Alert dialog box. Please refer to Figure 12-7.
The email content will include the following information:
A SNMP trap received
Sender:192.168.10.247
Sensor:FAN 2
Description:Lower Non-recoverable - going low
Time:2005/11/22 14:27:07 Tue
Figure 12-7
- 41 -