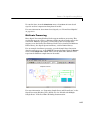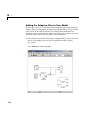
1
Signal Processing
Blockset
®
For Use with Simulink
Getting Started
Version 6
How to Contact The MathWorks:
www.mathworks.com
comp.soft-sys.matlab
Web
Newsgroup
[email protected]
Technical support
Product enhancement suggestions
Bug reports
Documentation error reports
Order status, license renewals, passcodes
Sales, pricing, and general information
508-647-7000
Phone
508-647-7001
Fax
The MathWorks, Inc.
3 Apple Hill Drive
Natick, MA 01760-2098
Mail
[email protected]
[email protected]
[email protected]
[email protected]
[email protected]
For contact information about worldwide offices, see the MathWorks Web site.
Getting Started with the Signal Processing Blockset
© COPYRIGHT 2004 by The MathWorks, Inc.
The software described in this document is furnished under a license agreement. The software may be used
or copied only under the terms of the license agreement. No part of this manual may be photocopied or reproduced in any form without prior written consent from The MathWorks, Inc.
FEDERAL ACQUISITION: This provision applies to all acquisitions of the Program and Documentation by,
for, or through the federal government of the United States. By accepting delivery of the Program or
Documentation, the government hereby agrees that this software or documentation qualifies as commercial
computer software or commercial computer software documentation as such terms are used or defined in
FAR 12.212, DFARS Part 227.72, and DFARS 252.227-7014. Accordingly, the terms and conditions of this
Agreement and only those rights specified in this Agreement, shall pertain to and govern the use,
modification, reproduction, release, performance, display, and disclosure of the Program and Documentation
by the federal government (or other entity acquiring for or through the federal government) and shall
supersede any conflicting contractual terms or conditions. If this License fails to meet the government's
needs or is inconsistent in any respect with federal procurement law, the government agrees to return the
Program and Documentation, unused, to The MathWorks, Inc.
MATLAB, Simulink, Stateflow, Handle Graphics, and Real-Time Workshop are registered trademarks, and
TargetBox is a trademark of The MathWorks, Inc.
Other product or brand names are trademarks or registered trademarks of their respective holders.
Printing History: June 2004
October 2004
First printing
New for Version 6.0 (Release 14)
Second printing Revised for Version 6.0.1 (Release 14SP1)
Contents
Introduction
1
What Is the Signal Processing Blockset? . . . . . . . . . . . . . . . . 1-2
System Setup . . . . . . . . . . . . . . . . . . . . . . . . . . . . . . . . . . . . . . . . .
Installation . . . . . . . . . . . . . . . . . . . . . . . . . . . . . . . . . . . . . . . . . .
Required Products . . . . . . . . . . . . . . . . . . . . . . . . . . . . . . . . . . . .
Related Products . . . . . . . . . . . . . . . . . . . . . . . . . . . . . . . . . . . . .
1-3
1-3
1-4
1-4
Product Demos . . . . . . . . . . . . . . . . . . . . . . . . . . . . . . . . . . . . . . .
Demos in the Help Browser . . . . . . . . . . . . . . . . . . . . . . . . . . . .
Demos on the Web . . . . . . . . . . . . . . . . . . . . . . . . . . . . . . . . . . . .
Demos on MATLAB Central . . . . . . . . . . . . . . . . . . . . . . . . . . . .
1-5
1-5
1-8
1-9
Working with the Documentation . . . . . . . . . . . . . . . . . . . . .
Viewing the Documentation . . . . . . . . . . . . . . . . . . . . . . . . . . .
Printing the Documentation . . . . . . . . . . . . . . . . . . . . . . . . . . .
Using This Guide . . . . . . . . . . . . . . . . . . . . . . . . . . . . . . . . . . . .
1-10
1-10
1-11
1-12
Signal Processing Blockset Overview
2
Sample Model and Block Libraries . . . . . . . . . . . . . . . . . . . . . 2-2
Modeling System Behavior . . . . . . . . . . . . . . . . . . . . . . . . . . . . . 2-2
Signal Processing Blockset Blocks . . . . . . . . . . . . . . . . . . . . . . . 2-5
Key Blockset Concepts . . . . . . . . . . . . . . . . . . . . . . . . . . . . . . .
Signals . . . . . . . . . . . . . . . . . . . . . . . . . . . . . . . . . . . . . . . . . . . .
Sample Time . . . . . . . . . . . . . . . . . . . . . . . . . . . . . . . . . . . . . . .
State . . . . . . . . . . . . . . . . . . . . . . . . . . . . . . . . . . . . . . . . . . . . . .
Sample-Based Signals . . . . . . . . . . . . . . . . . . . . . . . . . . . . . . . .
Frame-Based Signals . . . . . . . . . . . . . . . . . . . . . . . . . . . . . . . .
Tunable Parameters . . . . . . . . . . . . . . . . . . . . . . . . . . . . . . . . .
2-10
2-10
2-10
2-11
2-11
2-12
2-14
i
Features of the Signal Processing Blockset . . . . . . . . . . . . .
Frame-Based Operations . . . . . . . . . . . . . . . . . . . . . . . . . . . . . .
Multirate Processing . . . . . . . . . . . . . . . . . . . . . . . . . . . . . . . . .
Fixed-Point Support . . . . . . . . . . . . . . . . . . . . . . . . . . . . . . . . . .
Real-Time Code Generation . . . . . . . . . . . . . . . . . . . . . . . . . . .
Adaptive and Multirate Filtering . . . . . . . . . . . . . . . . . . . . . . .
Quantization . . . . . . . . . . . . . . . . . . . . . . . . . . . . . . . . . . . . . . . .
Statistical Operations . . . . . . . . . . . . . . . . . . . . . . . . . . . . . . . .
Linear Algebra . . . . . . . . . . . . . . . . . . . . . . . . . . . . . . . . . . . . . .
Parametric Estimation . . . . . . . . . . . . . . . . . . . . . . . . . . . . . . .
Matrix Support . . . . . . . . . . . . . . . . . . . . . . . . . . . . . . . . . . . . . .
Data Type Support . . . . . . . . . . . . . . . . . . . . . . . . . . . . . . . . . . .
2-16
2-16
2-17
2-18
2-18
2-19
2-19
2-19
2-20
2-20
2-20
2-21
Configuring Simulink for Signal Processing Models . . . . . 2-23
Using dspstartup.m . . . . . . . . . . . . . . . . . . . . . . . . . . . . . . . . . . 2-23
Settings in dspstartup.m . . . . . . . . . . . . . . . . . . . . . . . . . . . . . . 2-24
Signal Processing Models
3
Creating a Block Diagram . . . . . . . . . . . . . . . . . . . . . . . . . . . . . 3-2
Setting the Model Parameters . . . . . . . . . . . . . . . . . . . . . . . . . . 3-7
Running the Model . . . . . . . . . . . . . . . . . . . . . . . . . . . . . . . . . . . . 3-9
Modifying Your Model . . . . . . . . . . . . . . . . . . . . . . . . . . . . . . . . 3-12
Filters
4
Digital Filters . . . . . . . . . . . . . . . . . . . . . . . . . . . . . . . . . . . . . . . . . 4-2
Designing a Digital Filter . . . . . . . . . . . . . . . . . . . . . . . . . . . . . . 4-2
Adding a Digital Filter to Your Model . . . . . . . . . . . . . . . . . . . . 4-6
ii
Contents
Adaptive Filters . . . . . . . . . . . . . . . . . . . . . . . . . . . . . . . . . . . . . . . 4-9
Designing an Adaptive Filter . . . . . . . . . . . . . . . . . . . . . . . . . . . 4-9
Adding the Adaptive Filter to Your Model . . . . . . . . . . . . . . . . 4-14
Viewing the Coefficients of Your Adaptive Filter . . . . . . . . . . . 4-19
Code Generation
5
Understanding Code Generation . . . . . . . . . . . . . . . . . . . . . . . 5-2
Code Generation with Real-Time Workshop . . . . . . . . . . . . . . . 5-2
Highly Optimized Generated C Code . . . . . . . . . . . . . . . . . . . . . 5-3
Generating Code . . . . . . . . . . . . . . . . . . . . . . . . . . . . . . . . . . . . . . 5-4
Setting Up the Build Directory . . . . . . . . . . . . . . . . . . . . . . . . . . 5-4
Setting Configuration Parameters . . . . . . . . . . . . . . . . . . . . . . . 5-5
Generating Code . . . . . . . . . . . . . . . . . . . . . . . . . . . . . . . . . . . . 5-11
Viewing the Generated Code . . . . . . . . . . . . . . . . . . . . . . . . . . . 5-12
Frequency Domain Signals
6
Power Spectrum Estimates . . . . . . . . . . . . . . . . . . . . . . . . . . . .
Creating the Block Diagram . . . . . . . . . . . . . . . . . . . . . . . . . . . .
Setting the Model Parameters . . . . . . . . . . . . . . . . . . . . . . . . . .
Viewing the Power Spectrum Estimates . . . . . . . . . . . . . . . . . .
6-2
6-2
6-4
6-9
Spectrograms . . . . . . . . . . . . . . . . . . . . . . . . . . . . . . . . . . . . . . . .
Modifying the Block Diagram . . . . . . . . . . . . . . . . . . . . . . . . . .
Setting the Model Parameters . . . . . . . . . . . . . . . . . . . . . . . . .
Viewing the Spectrogram of the Speech Signal . . . . . . . . . . . .
6-12
6-12
6-14
6-19
iii
Index
iv
Contents
1
Introduction
The Signal Processing Blockset is a tool for digital signal processing algorithm simulation and code
generation. It enables you to design and prototype signal processing systems using key signal
processing algorithms and components in the Simulink® block format. This chapter provides an
introduction to the Signal Processing Blockset, its product requirements, and its documentation.
What Is the Signal Processing
Blockset? (p. 1-2)
Learn more about the Signal Processing Blockset and its
components.
System Setup (p. 1-3)
Install the Signal Processing Blockset and learn about
the products required to run the models in this manual.
Product Demos (p. 1-5)
View the demos available in the product and on the Web.
Working with the Documentation
(p. 1-10)
Learn how to view and print the documentation.
1
Introduction
What Is the Signal Processing Blockset?
The Signal Processing Blockset is a tool for digital signal processing algorithm
simulation and code generation. It is made up of blocks contained within block
libraries. You can interconnect these blocks to create sophisticated models
capable of operations such as speech and audio processing, wireless digital
communications, radar/sonar, and medical electronics.
The Signal Processing Blockset requires Simulink, a tool for simulating
dynamic systems. Simulink is a model definition environment. Use Simulink
blocks to create a block diagram that represents the computations of your
system or application. Simulink is also a model simulation environment. Run
the block diagram to see how your system behaves. All of the blocks in the
Signal Processing Blockset are designed for use with the blocks in the Simulink
libraries. If you are new to Simulink, read the “Getting Started” section of the
Simulink documentation to better understand its functionality.
You can use the Signal Processing Blockset and Simulink to develop your
signal processing concepts and to efficiently revise and test these concepts until
your design is production-ready. You can also use the Signal Processing
Blockset in conjunction with Real-Time Workshop® to automatically generate
code for real-time execution on DSP hardware.
1-2
System Setup
System Setup
This section describes how to install the Signal Processing Blockset software
and documentation. It also reviews the other MathWorks products you must
install in order to run the Signal Processing Blockset.
This section includes the following topics:
• “Installation” on page 1-3 — Install the Signal Processing Blockset and the
product documentation from a CD or a Web download.
• “Required Products” on page 1-4 — Learn more about the products you must
install in order to run the Signal Processing Blockset.
• “Related Products” on page 1-4 — Explore other products that are applicable
to the kinds of tasks you can perform with the Signal Processing Blockset.
Installation
Before you begin working with the Signal Processing Blockset, you need to
install the product on your computer.
Installing the Signal Processing Blockset
The Signal Processing Blockset follows the same installation procedure as the
MATLAB® toolboxes. See the MATLAB Installation documentation for your
platform.
Installing Online Documentation
Installing the documentation is part of the installation process:
• Installation from a CD — Start the MathWorks installer. When prompted,
select the Product check boxes for the products you want to install. The
documentation is installed along with the products.
• Installation from a Web download — If you update the Signal Processing
Blockset using a Web download and you want to view the documentation
with the MathWorks Help browser, you must install the documentation on
your hard drive.
Download the files from the Web. Then, start the installer, and select the
Product check boxes for the products you want to install. The
documentation is installed along with the products.
1-3
1
Introduction
Required Products
The Signal Processing Blockset is part of a family of products from The
MathWorks. You need to install the following products to use the Signal
Processing Blockset:
• MATLAB
• Simulink
• Signal Processing Toolbox
MATLAB
You can use MATLAB to open model files and view Signal Processing Blockset
demos. You can import signal values from the MATLAB workspace into signal
processing models and export signal values from signal processing models to
the MATLAB workspace.
Simulink
Simulink provides an environment that enables you to create a block diagram
to model your physical system. You can create these block diagrams by
connecting blocks and using graphical user interfaces (GUIs) to edit block
parameters.
Signal Processing Toolbox
The Signal Processing Toolbox provides basic filter capabilities. You can design
and implement filters using the Filter Design and Analysis Tool (FDATool) and
use them in your signal processing models.
Related Products
The MathWorks provides several products that are relevant to the kinds of
tasks you can perform with the Signal Processing Blockset.
For more information about any of these products, see either
• The online documentation for that product if it is installed on your system
• The MathWorks Web site, at
http://www.mathworks.com/products/sigprocblockset/related.jsp
1-4
Product Demos
Product Demos
The Signal Processing Blockset has a number of demo models that solve
real-world problems. Begin viewing Signal Processing Blockset demos by using
the MATLAB Help browser. For additional demo models, navigate to the
MathWorks and MATLAB Central Web sites.
This section includes the following topics:
• “Demos in the Help Browser” on page 1-5 — View and interact with Signal
Processing Blockset product demos in the Help browser.
• “Demos on the Web” on page 1-8 — View Signal Processing Blockset Web
demos on the MathWorks Web site.
• “Demos on MATLAB Central” on page 1-9 — View user and developer
contributed Signal Processing Blockset demos on the MATLAB Central Web
site.
Demos in the Help Browser
You can find interactive Signal Processing Blockset demos in the MATLAB
Help browser. This example shows you how to locate and open a typical demo:
1 To open the Help browser to the Demos tab, type demos at the MATLAB
command line.
2 To see a list of Signal Processing demo categories, double-click Blocksets,
and then double-click Signal Processing. These categories include Adaptive
Processing, Aerospace, Audio Processing, Communications, Filtering,
Fixed-Point, Spectral Analysis, Wavelets, and Working with Signals.
1-5
1
Introduction
3 To view the description of the Equalization demo, which demonstrates
adaptive channel equalization, double-click Adaptive Processing in the left
pane, and then click Equalization.
1-6
Product Demos
4 Click Open this model to display the Simulink model for the Equalization
demo. Run the model by selecting Start from the Simulation menu in the
model window.
1-7
1
Introduction
Demos on the Web
The MathWorks Web site contains viewlet demos that show you how to use the
Signal Processing Blockset. You can find these demos at
http://www.mathworks.com/products/sigprocblockset/demos.jsp.
You can run these demos without having MATLAB or the Signal Processing
Blockset installed on your system.
1-8
Product Demos
Demos on MATLAB Central
MATLAB Central contains files, including demos, contributed by users and
developers of the Signal Processing Blockset, MATLAB, Simulink, and other
products. Contributors submit their files to one of a list of categories. You can
browse these categories to find submissions that pertain to the Signal
Processing Blockset or a specific problem that you would like to solve.
MATLAB Central is located at http://www.mathworks.com/matlabcentral/.
1-9
1
Introduction
Working with the Documentation
The Signal Processing Blockset documentation includes Getting Started with
the Signal Processing Blockset and the Signal Processing Blockset User’s
Guide. You can access this documentation using the MATLAB Help browser or
on the MathWorks Web site.
This section includes the following topics:
• “Viewing the Documentation” on page 1-10 — View HTML files on your
system or the MathWorks Web site.
• “Printing the Documentation” on page 1-11 — Locate and print PDF files on
the MathWorks Web site.
• “Using This Guide” on page 1-12 — Suggestions for learning about the
Signal Processing Blockset and a description of the chapters in this manual.
Viewing the Documentation
You can access the Signal Processing Blockset documentation using files you
installed on your system or from the Web using the MathWorks Web site.
Documentation in the Help Browser
This procedure shows you how to use the MATLAB Help browser to view the
Signal Processing Blockset documentation installed on your system:
1 In the MATLAB window, from the Help menu, click Full Product Family
Help. The Help browser opens.
2 From the list of products in the left pane, click Signal Processing Blockset.
In the right pane, the Help browser displays the Signal Processing Blockset
Roadmap page.
3 Under the section titled “Documentation Set”, select “Getting Started”. The
Help browser displays the chapters of this manual.
The Help browser also has a Demo tab where you can view product demos. For
more information, see “Product Demos” on page 1-5.
1-10
Working with the Documentation
Documentation on the Web
You can also view the documentation from the MathWorks Web site. The
documentation available on these Web pages is for the latest release,
regardless of whether the release was distributed on a CD or as a Web
download:
1 Navigate to the Signal Processing Blockset Product Page at
http://www.mathworks.com/products/sigprocblockset/.
2 On the right side of the page, click on the Documentation link. The Signal
Processing Blockset documentation is displayed.
Printing the Documentation
The documentation for the Signal Processing Blockset is also available in
printable PDF format. You need to install Adobe Acrobat Reader 4.0 or later to
open and read these files. To download a free copy of Acrobat Reader, see
http://www.adobe.com/products/acrobat/main.html.
The following procedure shows you how to view the documentation in PDF
format:
1 In the MATLAB window, from the Help menu, click Full Product Family
Help. The Help browser opens.
2 From the list of products in the left pane, click Signal Processing Blockset.
In the right pane, the Help browser displays the Signal Processing Blockset
Roadmap page.
3 Under the “Printing the Documentation Set” section, click on the links to
view PDF versions of the Signal Processing Blockset documentation.
1-11
1
Introduction
Using This Guide
To help you effectively read and use this guide, here is a brief description of the
chapters and a suggested reading path.
Expected Background
This manual assumes that you are already familiar with
• MATLAB, to write scripts and functions with M-code, and to use functions
with the command-line interface
• Simulink, to create simple models as block diagrams and simulate those
models
What Chapter Should I Read?
If You Are a New User — Follow the procedures in this guide to become
familiar with the blockset’s functionality and create your first signal processing
model:
• Read Chapter 1, “Introduction” to learn about the installation process, the
products required to run the Signal Processing Blockset, and to view Signal
Processing Blockset demos.
• Read Chapter 2, “Signal Processing Blockset Overview” to learn about Signal
Processing Blockset functionality, review key concepts and terminology, and
find out more about product features.
• Read Chapter 3, “Signal Processing Models” to learn how to build a signal
processing model and simulate its behavior.
• Read Chapter 4, “Filters” to create an adaptive noise cancellation system
using digital and adaptive filters.
• Read Chapter 5, “Code Generation” to generate C code from your signal
processing model.
• Read Chapter 6, “Frequency Domain Signals” to learn how to view the
spectral content of a speech signal.
1-12
Working with the Documentation
If You Are an Experienced Signal Processing Blockset User — See the
Signal Processing Blockset User’s Guide for a discussion of more advanced
topics. The User’s Guide contains tutorial sections that are designed to help
you become familiar with using Simulink and the Signal Processing Blockset,
as well as a reference section for finding detailed information on particular
blocks in the blockset:
• Read Chapter 1, “Working with Signals” and Chapter 2, “Advanced Signal
Concepts” for details on key operations common to many signal processing
tasks.
• Read the following chapters for discussions of how to implement various
signal processing operations:
- Chapter 3, “Filters”
- Chapter 4, “Transforms”
- Chapter 5, “Quantizers”
- Chapter 6, “Statistics, Estimation, and Linear Algebra”
- Chapter 7, “Data Type Support”
- Chapter 8, “Working with Fixed-Point Data”
• See Chapter 9, “Block Reference” for a description of each block’s operation,
parameters, and characteristics.
1-13
1
Introduction
1-14
2
Signal Processing Blockset
Overview
In this chapter, you learn how to access Signal Processing Blockset blocks so that you can begin
creating models. You review key concepts and terminology used throughout this manual and explore
the features of the Signal Processing Blockset.
Sample Model and Block Libraries
(p. 2-2)
Simulate a model that removes noise from a signal, and
learn the process behind creating models and accessing
Signal Processing Blockset blocks.
Key Blockset Concepts (p. 2-10)
Descriptions of the terminology used in this guide.
Features of the Signal Processing
Blockset (p. 2-16)
Overview of the features of the Signal Processing
Blockset.
Configuring Simulink for Signal
Processing Models (p. 2-23)
Learn how to automatically configure Simulink for signal
processing simulation.
2
Signal Processing Blockset Overview
Sample Model and Block Libraries
The Signal Processing Blockset is made up of blocks contained within block
libraries. You can interconnect these blocks to create models capable of
sophisticated signal processing operations. This section introduces you to a
model that removes noise from a signal and describes the process by which
such models can be created. It also describes how to access Signal Processing
Blockset blocks so that you can begin using them to create models.
This section includes the following topics:
• “Modeling System Behavior” on page 2-2 — Simulate a model capable of
acoustic noise cancellation.
• “Signal Processing Blockset Blocks” on page 2-5 — Access Signal Processing
Blockset blocks directly or using the Simulink Library Browser.
Modeling System Behavior
The Signal Processing Blockset can simulate the behavior of complex signal
processing systems. For example, the following demo model, called the Acoustic
Noise Canceler, illustrates some of the capabilities of the Signal Processing
Blockset. In the model, the signal output at the upper port of the Acoustic
Environment subsystem is white noise. The signal output at the lower port is
composed of colored noise and a signal from a .wav file. This demo model uses
an adaptive filter to remove the noise from the signal output at the lower port.
When you run the model, you hear both noise and a person playing the drums.
Over time, the adaptive filter in the model filters out the noise so all you hear
is the person playing the drums.
Note Later, this manual shows you how to create a similar model.
1 Open the Acoustic Noise Canceler demo model by typing dspanc at the
MATLAB command prompt. The demo model, shown below, and the
dspanc/Waterfall scope window open. The scope window is discussed later
in this procedure.
2-2
Sample Model and Block Libraries
2 Run this demo by selecting Start from the Simulation menu.
3 As the demo runs, listen to the demo using your computer’s speakers. Over
time, as the filter coefficients change, the noise in the signal decreases and
you can hear the drums more clearly.
4 The dspanc/Waterfall scope window displays the behavior of the adaptive
filter’s filter coefficients. The following figure shows the scope window when
the simulation begins. Each plot represents the values of the filter
coefficients of a normalized LMS adaptive filter. In the figure, you can see
that they are initialized to zero. Also, the color of the plots fades from red to
yellow. The current filter coefficients are plotted in red. The other plots
represent the filter coefficients at previous simulation times.
2-3
2
Signal Processing Blockset Overview
The next figure shows the dspanc/Waterfall scope window when the filter
coefficients have reached their steady state.
2-4
Sample Model and Block Libraries
5 To speed up or slow down the rate of filter adaption, double-click the switch
attached to the blocks labeled Fast Adapt and Slow Adapt. Then,
double-click the switch attached to the blocks labeled Filter Select. If the
switch is connected to the block labeled Fast Adapt, the filter coefficients
reach steady state in a shorter period of time.
The “Adaptive Filters” section of the Signal Processing Blockset User’s Guide
contains more information on the Acoustic Noise Canceler demo.
Signal Processing Blockset Blocks
The Signal Processing Blockset contains a collection of blocks that are
organized within nested libraries. These libraries are designed specifically for
digital signal processing applications, and include blocks for key operations
such as multirate and adaptive filtering, matrix manipulation, linear algebra,
2-5
2
Signal Processing Blockset Overview
statistics, and time-frequency transforms. You can locate these blocks using
the main Signal Processing Blockset library or the Simulink Library Browser:
• “Accessing Blocks Directly” on page 2-6 — On Microsoft Windows and UNIX
platforms, use the Signal Processing Blockset library to locate blocks.
• “Accessing Blocks with the Library Browser” on page 2-9 — On Microsoft
Windows platforms, use the Simulink Library Browser to locate Signal
Processing Blockset blocks.
Accessing Blocks Directly
You can access the main Signal Processing Blockset library from the MATLAB
command line. This procedure shows you how to open this library and locate
the Signal Processing Source blocks:
1 Open the library by typing dsplib at the MATLAB command prompt.
2-6
Sample Model and Block Libraries
2 Double-click the Signal Processing Sources library. The library displays the
blocks it contains. The orange blocks support fixed-point data types in some
or all modes. You can use the blocks in the Signal Processing Sources library
to create discrete-time or continuous-time signals.
2-7
2
Signal Processing Blockset Overview
The Signal Processing Blockset libraries are
• Signal Processing Sinks — Blocks used to display data in a scope or send
data to the MATLAB workspace
• Signal Processing Sources — Blocks that create discrete-time or
continuous-time signals or import these signals from the MATLAB
workspace
• Estimation — Blocks for linear prediction, parametric estimation, and power
spectrum estimation
• Filtering — Blocks used to design digital, analog, adaptive, and multirate
filters
• Math Functions — Blocks used to perform mathematical operations, matrix
operations, and polynomial functions
• Platform Specific I/O — Blocks for working with specific platforms such as
sending audio data to standard audio devices on 32-bit Windows operating
systems
• Quantizers — Blocks that create scalar and vector quantizers as well as
uniform encoders and decoders
• Signal Management — Blocks for buffering, selecting part of a signal,
modifying signal attributes, and edge detection
• Signal Operations — Blocks that perform operations such as convolution,
downsampling, upsampling, padding, and delaying the input
• Statistics — Blocks that perform statistical operations such as correlation,
maximum, and mean
• Transforms — Blocks that transform data into different domains
Drag any block into a model, double-click the block, and click Help to learn
more about the block’s functionality.
2-8
Sample Model and Block Libraries
Accessing Blocks with the Library Browser
On Microsoft Windows platforms, starting Simulink displays the Simulink
Library Browser. One way to explore the Signal Processing Blockset is to
expand the Signal Processing Blockset entry in the tree pane of this browser.
For complete information about the Simulink Library Browser, see the
Simulink documentation.
2-9
2
Signal Processing Blockset Overview
Key Blockset Concepts
The following section describes the terms you should understand before
reading this guide.
This section includes the following topics:
• “Signals” on page 2-10 — Learn how signals are represented in the Signal
Processing Blockset.
• “Sample Time” on page 2-10 — Learn how sample time is defined in the
Signal Processing Blockset.
• “State” on page 2-11 — Understand how state is defined in the Signal
Processing Blockset.
• “Sample-Based Signals” on page 2-11 — Understand how sample-based
signals are propagated through a model.
• “Frame-Based Signals” on page 2-12 — Understand how frame-based signal
are propagated through a model.
• “Tunable Parameters” on page 2-14 — Change the values of block
parameters while the simulation is running.
Signals
Signals in Simulink can be real or complex valued. They can be represented
with data types such as single-precision floating point, double-precision
floating point, or fixed point. Signals can be either sample based or frame
based, single-channel or multichannel.
Sample Time
A discrete-time signal is a sequence of values that correspond to particular
instants in time. The time instants at which the signal is defined are the
signal’s sample times, and the associated signal values are the signal’s
samples. For a periodically sampled signal, the equal interval between any pair
of consecutive sample times is the signal’s sample period, Ts. The sample rate,
Fs, is the reciprocal of the sample period, F s = 1 ⁄ T s . It represents the number
of samples in the signal per second.
2-10
Key Blockset Concepts
Note In the block parameters dialog boxes, the term sample time refers to
the sample period, Ts of the signal.
State
Some of the blocks in the Signal Processing Blockset have state and others do
not. If a block does not have state, the block calculates its output using only the
current input. If a block has state, the output of the block depends on the
current input as well as past inputs and/or outputs.
Sample-Based Signals
A signal is sample based if it is propagated through the model one sample at a
time. To represent a single-channel sample-based signal, create a 1-by-1-by-T
matrix. Each matrix element represents one sample from the channel and T is
the total number of samples in the channel. To represent a multichannel signal
with M*N independent channels, create an M-by-N-by-T matrix. Each matrix
element represents one sample from a distinct channel and T is the total
number of samples in each channel.
Consider the following model.
2-11
2
Signal Processing Blockset Overview
The Signal From Workspace block outputs a sample-based signal. The Gain
block multiplies all the samples of the signal by two. Then, the Signal To
Workspace block outputs the signal to the MATLAB workspace in the form of
a variable called yout. The following figure is a symbolic representation of how
the single-channel, sample-based signal is propagated through the model.
t=0
6 5 4 3 2 1
12 10 8 6 4 2
1:6
2
yout
Signal From
Workspace
Gain
Signal To
Workspace
If, after you ran the model, you were to type yout at the MATLAB command
prompt, the following is a portion of what you would see.
yout(:,:,1) =
2
yout(:,:,2) =
4
yout(:,:,3) =
6
Because yout represents a single-channel, sample-based signal, each sample of
the signal is a different page of the output matrix.
Frame-Based Signals
A signal is frame based if it is propagated through a model one frame at a time.
A frame of data is a collection of sequential samples from a single channel or
multiple channels. One frame of a single-channel signal is represented by a
M-by-1 column vector. One frame of a multichannel signal is represented by a
2-12
Key Blockset Concepts
M-by-N matrix. Each matrix column is a different channel, and the number of
rows in the matrix is the number of samples in each frame.
You can typically specify whether a signal is frame based or sample based
using a source block from the Signal Processing Sources library. Most other
signal processing blocks preserve the frame status of an input signal, but some
do not.
The process of propagating frames of data through a model is called
frame-based processing. Because multiple samples can be processed at once,
the computational time of the model is improved. “Working with Signals” in the
Signal Processing Blockset User’s Guide contains more information about
frame-based processing.
Consider the following model.
Indicates a
frame-based signal
The Signal From Workspace block outputs a frame-based signal as indicated
by the wide double lines that connect the blocks. Because the Samples per
frame parameter of the block is set to 2, the frame-based signal has two signals
per frame. The Gain block multiplies all the samples of this signal by two.
Then, the Signal To Workspace block outputs the signal to the MATLAB
workspace in the form of a variable called yout. The following figure is a
symbolic representation of how the frame-based signal is propagated through
the model.
2-13
2
Signal Processing Blockset Overview
5
6
3
4
t=2
t=1
1
2
10
12
6
8
2
4
t=0
If, after you ran the model, you were to type yout at the MATLAB command
prompt, the following is a portion of what you would see.
yout =
2
4
6
8
10
12
Because yout represents a single-channel, frame-based signal, the output is a
column vector. Note that once you export your signal values into the MATLAB
workspace, they are no longer grouped into frames.
Tunable Parameters
There are some parameters, such as the Sine Wave block’s Frequency
parameter, that you can change or tune during simulation. Many parameters
cannot be changed while a simulation is running. This is usually the case for
parameters that directly or indirectly alter a signal’s dimensions or sample
rate.
Note Opening a dialog box for a source block causes the simulation to pause.
While the simulation is paused, you can edit the parameter values. However,
you must close the dialog box to have the changes take effect and allow the
simulation to continue.
2-14
Key Blockset Concepts
How to Tune Parameters
To change a tunable parameter during simulation, double-click the block to
open its block parameters dialog box, change any tunable parameters to the
desired settings, and then click OK. The simulation now uses the new
parameter settings.
Tunable Parameters During Simulation
In addition to changing tunable parameters during simulation when Simulink
is in Normal mode, you can also change tunable parameters when Simulink is
in Accelerator mode or External mode. You must have the Simulink
Accelerator installed on your system to use the Accelerator.
Note When a parameter is marked “Tunable” in a reference page, it is
tunable only when Simulink is in Normal mode, and not in Accelerator mode
or External mode, unless indicated otherwise.
For more information on tunable parameters, see the “Tunable Parameters”
section of the Simulink documentation.
2-15
2
Signal Processing Blockset Overview
Features of the Signal Processing Blockset
This section describes the following features:
• “Frame-Based Operations” on page 2-16 — Perform frame-based operations
to improve performance.
• “Multirate Processing” on page 2-17 — Build models with blocks that
support different sample rates at each port.
• “Fixed-Point Support” on page 2-18 — Design discrete-time dynamic signal
processing systems that use fixed-point arithmetic.
• “Real-Time Code Generation” on page 2-18 — Create ANSI/ISO C code from
your signal processing model.
• “Adaptive and Multirate Filtering” on page 2-19 — Build advanced signal
processing models using blocks from these libraries.
• “Quantization” on page 2-19 — Explore the advanced quantization
capabilities of the Signal Processing Blockset.
• “Statistical Operations” on page 2-19 — Perform basic statistical analysis on
your signals.
• “Linear Algebra” on page 2-20 — Solve equations and use matrix
factorization methods.
• “Parametric Estimation” on page 2-20 — Compute AR system parameters.
• “Matrix Support” on page 2-20 — Represent multichannel frame-based
signals using matrices.
• “Data Type Support” on page 2-21 — Learn the data types supported by the
Signal Processing Blockset.
Frame-Based Operations
Most real-time signal processing systems optimize throughput rates by
processing data in “batch” or “frame-based” mode. By propagating multisample
frames instead of the individual signal samples, the signal processing system
can take advantage of the speed of signal processing algorithm execution, while
simultaneously reducing the demands placed on the data acquisition (DAQ)
hardware.
For an example of frame-based operations, open the LPC Analysis and
Synthesis of Speech demo by typing dsplpc at the MATLAB command prompt.
2-16
Features of the Signal Processing Blockset
To run this demo, from the Simulation menu, select Start. A frame-based
signal is used for computation throughout the model.
For more information about frame-based signals, see “Frame-Based Signals”
on page 2-12.
Multirate Processing
Many Signal Processing Blockset blocks support multirate processing. This
means that one port can have a different sample time than another port on the
same block. Multirate processing is achieved by port-based sample time
support across the blocks. The multirate blocks can be found in the Multirate
Filters library, the Signal Operations library, and the Buffers library.
For an example of multirate processing, open the Sample Rate Conversion
demo by typing dspsrcnv at the MATLAB command prompt. From the Format
menu, select Sample time colors. Then, run the demo. The different colors
represent the different sample times in the model.
For more information, see “Inspecting Sample Rates and Frame Rates” in the
Signal Processing Blockset User’s Guide. See also “Models with Multiple
Sample Rates” in the Real-Time Workshop documentation.
2-17
2
Signal Processing Blockset Overview
Fixed-Point Support
Many of the blocks in the Signal Processing Blockset have fixed-point support.
This allows you to design discrete-time dynamic signal processing systems that
use fixed-point arithmetic. Fixed-point support in the Signal Processing
Blockset includes
• Signed two’s complement fixed-point data types
• Word sizes from 2 to 128 bits in simulation
• Word sizes from 2 to the size of a long in the Real-Time Workshop C
code-generation target
• Overflow handling, scaling, and rounding methods
• C code generation for deployment on a fixed-point embedded processor, with
Real-Time Workshop. The generated code uses all allowed simulation data
types supported by the embedded target, and automatically includes all
necessary shift and scaling operations.
Simulating your fixed-point development choices before implementing them in
hardware saves time and money. The Signal Processing Blockset provides
built-in fixed-point operations that save time in simulation and provide
automatically optimized code.
For fixed-point blocks, the Signal Processing Blockset and Real-Time
Workshop produce optimized fixed-point code ready for execution on a
fixed-point processor. All the choices you make during simulation with the
Signal Processing Blockset in terms of scaling, overflow handling, and
rounding methods are automatically optimized in the generated code, without
the need for time-consuming and costly hand-optimized code.
For more information on fixed-point support in the Signal Processing Blockset,
see “Fixed-Point Support” in the Signal Processing Blockset User’s Guide.
Real-Time Code Generation
For all Signal Processing Blockset blocks, the Signal Processing Blockset and
Real-Time Workshop produce optimized, compact, ANSI/ISO C code.
You can find more information about this process in Chapter 5, “Code
Generation.”
2-18
Features of the Signal Processing Blockset
Adaptive and Multirate Filtering
The Adaptive Filters and Multirate Filters libraries provide key tools for the
construction of advanced signal processing systems. You can use adaptive filter
block parameters to tailor signal processing algorithms to application-specific
environments.
For an example of adaptive filtering, open the LMS Adaptive Equalization
demo by typing lmsadeq at the MATLAB command prompt. Equalization is
important in the field of communications. It involves estimating and
eliminating dispersion present in communication channels. In this demo, the
LMS Filter block models the system’s dispersion. The plot of the squared error
demonstrates the effectiveness of this adaptive filter.
For an example of multirate filtering, open the Sample Rate Conversion demo
by typing dspsrcnv at the MATLAB command prompt. This demo
demonstrates two ways in which you can interpolate, filter, and decimate a
signal. You can use either the Upsample, Direct-Form II Transpose Filter, and
Downsample blocks, or the FIR Rate Conversion block.
For more information on adaptive filters, see “Adaptive Filters” on page 4-9.
For more information on multirate filters, see “Multirate Filters” in the Signal
Processing Blockset User’s Guide.
Quantization
The process of quantization allows you to represent your input signal with a
finite number of values. This helps you to limit the bandwidth of your
transmitted signal. The Signal Processing Blockset has a number of blocks that
can help you to design and implement scalar and vector quantizers. In the main
Signal Processing Blockset library, open the Quantizers library to view the
available blocks. See the block reference pages for any of these blocks to find
out more information about their functionality.
For more information about quantization, see “Analysis and Synthesis of
Speech” in the Signal Processing Blockset User’s Guide.
Statistical Operations
Use the blocks in the Statistics library for basic statistical analysis. These
blocks calculate measures of central tendency and spread such as mean,
standard deviation, and so on. They can also calculate the frequency
distribution of input values.
2-19
2
Signal Processing Blockset Overview
For an example of a model capable of statistical operations, open the Statistical
Functions demo by typing statsdem at the MATLAB command prompt. Run
the model to view the maximum, mean, and variance of a noisy input signal.
See “Statistics” in the Signal Processing Blockset User’s Guide for more
information.
Linear Algebra
The Matrices and Linear Algebra library provides Cholesky, LU, LDL, and QR
matrix factorization methods and equation solvers based on these methods. It
also provides blocks for common matrix operations.
See “Linear Algebra” in the Signal Processing Blockset User’s Guide for more
information.
Parametric Estimation
The Parametric Estimation library provides a number of methods for modeling
a signal as the output of an AR system. The methods include the Burg AR
Estimator, Covariance AR Estimator, Modified Covariance AR Estimator, and
Yule-Walker AR Estimator, which allow you to compute the AR system
parameters based on forward error minimization, backward error
minimization, or both.
In the Comparison of Spectral Analysis Techniques demo, dspsacomp, a
Gaussian noise sample is filtered by an IIR all-pole filter. Three different
blocks, each with its own method, estimate the spectrum of the IIR filter. You
can view the results of each method using a Vector Scope block.
Matrix Support
The Signal Processing Blockset takes full advantage of the matrix format of
Simulink. Some typical uses of matrices in signal processing simulations are
• General two-dimensional array
A matrix can be used in its traditional mathematical capacity, as a simple
structured array of numbers. Most blocks for general matrix operations are
found in the Matrices and Linear Algebra library.
2-20
Features of the Signal Processing Blockset
• Factored submatrices
A number of the matrix factorization blocks in the Matrix Factorizations
library store the submatrix factors (such as lower and upper submatrices) in
a single compound matrix. See the LDL Factorization and LU Factorization
blocks for examples.
• Multichannel frame-based signal
The standard format for multichannel frame-based signals is a matrix,
where each column represents a different channel. For example, a matrix
with three columns contains three channels of data. The number of rows in
the matrix is the number of samples in each frame.
The following sections of the Signal Processing Blockset User’s Guide provide
more information about working with matrices:
• “Creating Sample-Based Signals”
• “Creating Frame-Based Signals”
• “Creating Multichannel Sample-Based Signals”
• “Creating Multichannel Frame-Based Signals”
• “Deconstructing Multichannel Sample-Based Signals”
• “Deconstructing Multichannel Frame-Based Signals”
Data Type Support
All Signal Processing Blockset blocks support single- and double-precision
floating-point data types during both simulation and Real-Time Workshop C
code generation. Many blocks also support fixed-point and Boolean data types.
The following table lists all data types supported by the Signal Processing
Blockset and which function or block to use when converting between data
types. To see which data types a particular block supports, see the “Supported
Data Types” section of the block’s reference page.
For more information, see “Data Type Support” in the Signal Processing
Blockset User’s Guide.
2-21
2
Signal Processing Blockset Overview
Supported Data Types
Data Types Supported
by Signal Processing
Blockset Blocks
Functions and Blocks for
Converting Data Types
Comments
Double-precision
floating point
• double
• Data Type Conversion block
Simulink built-in data type
supported by all Signal Processing
Blockset blocks
Single-precision floating
point
• single
• Data Type Conversion block
Simulink built-in data type
supported by all Signal Processing
Blockset blocks
Boolean
• boolean
• Data Type Conversion block
Simulink built-in data type. To
learn more, see “Boolean Support”
in the Signal Processing Blockset
User’s Guide.
Integer (8-,16-, or
32-bits)
• int8, int16, int32
Simulink built-in data type.
Unsigned integer
(8-,16-, or 32-bits)
• uint8, uint16, uint32
Fixed-point data types
• Data Type Conversion block
• Data Type Conversion block
• Data Type Conversion block
• Simulink Fixed Point
num2fixpt function
• Functions and GUIs for
designing quantized filters
with the Filter Design
Toolbox (compatible with
Filter Realization Wizard
block)
Custom data types
2-22
Simulink built-in data type.
To learn more about fixed-point
data types in the Signal Processing
Blockset, see “Working with
Fixed-Point Data” in the Signal
Processing Blockset User’s Guide.
See “Correctly Defining Custom Data Types” in the Signal
Processing Blockset User’s Guide to learn about custom data types.
Configuring Simulink for Signal Processing Models
Configuring Simulink for Signal Processing Models
The Signal Processing Blockset provides an M-file, dspstartup, that lets you
automatically configure Simulink for signal processing simulation. We
recommend these configuration parameters for models that contain Signal
Processing Blockset blocks. Because these blocks calculate values directly
rather than solving differential equations, you must configure the Simulink
Solver to behave like a scheduler. The Solver, while in scheduler mode, uses a
block’s sample time to determine when the code behind each block is executed.
For example, if the sample time of a Sine Wave block is 0.05. The Solver
executes the code behind this block, and every other block with this sample
time, once every 0.05 seconds.
Note When working with models that contains blocks from the Signal
Processing Blockset, use source blocks that enable you to specify their sample
time. If your source block does not have a Sample time parameter, you must
add a Zero-Order Hold block in your model and use it to specify the sample
time. For more information, see “Continuous-Time Source Blocks” in the
Signal Processing Blockset User’s Guide. The exception to this rule is the DSP
Constant block, which can have a constant sample time. When it does,
Simulink executes this block and records the constant value once, which
allows for faster simulations and more compact generated code.
This section contains the following topics:
• “Using dspstartup.m” on page 2-23 — Learn how to use dspstartup.m to
configure Simulink for signal processing simulations.
• “Settings in dspstartup.m” on page 2-24 — Understand how the settings in
the dspstartup M-file affect the simulation.
Using dspstartup.m
To use the dspstartup M-file to configure Simulink for signal processing
simulations, you can
• Type dspstartup at the MATLAB command line. All new models have
settings customized for signal processing applications. Existing models are
not affected.
2-23
2
Signal Processing Blockset Overview
• Place a call to dspstartup within the startup.m file. This is an efficient way
to use dspstartup if you would like these settings to be in effect every time
you start Simulink. For more information about performing automated tasks
at startup, see the documentation for the startup command in the MATLAB
Function Reference.
The dspstartup M-file executes the following commands:
set_param(0, ...
'SingleTaskRateTransMsg','error', ...
'Solver',
'fixedstepdiscrete', ...
'SolverMode',
'SingleTasking', ...
'StartTime',
'0.0', ...
'StopTime',
'inf', ...
'FixedStep',
'auto', ...
'SaveTime',
'off', ...
'SaveOutput',
'off', ...
'AlgebraicLoopMsg',
'error', ...
'InvariantConstants',
'on', ...
'ShowInportBlksSampModeDlgField','on', ...
set_param(getActiveConfigSet(0), 'RollThreshold', 2);
You can edit the dspstartup M-file to change any of the settings above or to
add your own custom settings. For complete information about these settings,
see the Simulink documentation.
Settings in dspstartup.m
A number of the settings in the dspstartup M-file are chosen to improve the
performance of the simulation:
• 'SaveTime' is set to 'off'
Simulink does not save the tout time-step vector to the workspace. The
time-step record is not usually needed for analyzing discrete-time
simulations, and disabling it saves a considerable amount of memory,
especially when the simulation runs for an extended period of time.
• 'SaveOutput' is set to 'off'
Simulink Outport blocks in the top level of a model do not generate an output
(yout) in the workspace.
2-24
Configuring Simulink for Signal Processing Models
• 'InvariantConstants' is set to 'on'
Simulink precomputes the values of all constant blocks at the start of the
simulation and does not update them again for the duration of the
simulation. Simulink also precomputes the outputs of all downstream blocks
driven exclusively by constant blocks.
In the example below, the input to the top port (U) of the Matrix Multiply
block is computed once at the start of the simulation.
precomputed
This process eliminates the computational overhead of continuously
reevaluating these constant branches, which results in faster simulation and
smaller, more efficient generated code.
Note When 'InvariantConstants' is set to 'on', changes that you make to
parameters in a constant block while the simulation is running are not
registered by Simulink, and do not affect the simulation.
• set_param(getActiveConfigSet(0), 'RollThreshold', 2); sets
loop-rolling threshold to 2
This parameter only applies to code generation. By default, the Real-Time
Workshop “unrolls” a given loop into inline code when the number of loop
iterations is less than five. This avoids the overhead of servicing the loop in
cases when inline code can be used with only a modest increase in the file
size.
However, because typical DSP processors offer zero-overhead looping, code
size is the primary optimization constraint in most designs. It is more
2-25
2
Signal Processing Blockset Overview
efficient to minimize code size by generating a loop for every instance of
iteration, regardless of the number of repetitions.
• 'Stop time' is set to 'Inf',
The simulation runs until you manually stop it by selecting Stop from the
Simulation menu.
• 'Solver' is set to 'fixedstepdiscrete', which selects the fixed-step solver
option instead of the Simulink default variable-step solver. This mode
enables code generation from the model using Real-Time Workshop.
2-26
3
Signal Processing Models
This chapter describes the procedures necessary to begin using the Signal Processing Blockset. In
this chapter, you build a Simulink model, set the model parameters, and run the model.
Creating a Block Diagram (p. 3-2)
Build a Simulink model using Signal Processing Blockset
blocks.
Setting the Model Parameters (p. 3-7)
Specify your model’s parameter values.
Running the Model (p. 3-9)
Run the model and view its behavior over time.
Modifying Your Model (p. 3-12)
Add noise to your input signal and view its effect on your
system.
3
Signal Processing Models
Creating a Block Diagram
You can build signal processing models using functionality from many different
Simulink and Signal Processing Blockset libraries. In this section, you move
through the tasks needed to create a signal processing model that displays a
sine wave over time. These tasks are
• Opening a new model
• Dragging blocks into the model
• Connecting the blocks
In subsequent procedures, you set the block parameters and run the model.
Later in the book, you expand upon this model to create a system capable of
adaptive noise cancellation. You also use Real-Time Workshop to generate code
from this model:
1 Begin building your model. Open the main Signal Processing Blockset
library by typing dsplib at the MATLAB command prompt.
3-2
Creating a Block Diagram
2 Open a new model. In the Signal Processing Blockset library window, click
on the File menu, point to New, and select Model. You can drag-and-drop
Simulink blocks into a model to represent a system and model its behavior.
3 Display the Signal Processing Sources library. In the main library window,
double-click the Signal Processing Sources icon.
3-3
3
Signal Processing Models
The orange blocks support fixed-point data types in some or all modes.
4 Click-and-drag a Sine Wave block into your new model. The Sine Wave block
generates a sinusoidal signal.
3-4
Creating a Block Diagram
5 Double-click the Signal Processing Sinks library, and click-and-drag the
Time Scope block into your model.
6 Connect the two blocks by selecting the Sine Wave block, holding down the
Ctrl key, and then selecting the Time Scope block.
3-5
3
Signal Processing Models
Now that you have created a model, you are ready to set your model
parameters. To learn how to do this, see “Setting the Model Parameters” on
page 3-7.
3-6
Setting the Model Parameters
Setting the Model Parameters
Once you have built your signal processing model, you can set your model
parameters. Nearly all blocks have an associated block parameters dialog box.
Enter values into this dialog box to ensure that your model accurately
represents the behavior of your system. Double-click the block to display this
dialog box.
Note The software provides premade models as starting points to each
procedure in this manual. To prevent yourself from overwriting these models,
from the File menu, select Save as. Then, save your modified model in a
different directory.
1 If the model you created in “Creating a Block Diagram” on page 3-2 is not
open on your desktop, you can open an equivalent model by typing
doc_gstut1
at the MATLAB command prompt.
2 Open the Sine Wave dialog box by double-clicking the Sine Wave block.
3 Set the block parameters as follows:
- Frequency (Hz) = 0.5.
- Sample time = 0.05.
3-7
3
Signal Processing Models
Click OK to apply the settings and close the dialog box.
Note In the Signal Processing Blockset, the Sample time parameter
represents the sample period of the signal. The sample period is the amount of
time between each sample of the signal.
Now that you have set your model parameters, you are ready to run your model
and view its behavior. To learn how to do this, see “Running the Model” on
page 3-9.
3-8
Running the Model
Running the Model
After you set the desired model parameters, you can run your model and view
its behavior. The Signal Processing Blockset has many scope blocks that you
can use to display your model output. In this section, you use a Time Scope
block to view your sinusoidal signal:
1 If the model you created in “Setting the Model Parameters” on page 3-7 is
not open on your desktop, you can open an equivalent model by typing
doc_gstut2
at the MATLAB command prompt.
2 Run the model by selecting Start from the Simulation menu.
3 Display the sinusoidal signal in the Time Scope window by double-clicking
the Time Scope block.
3-9
3
Signal Processing Models
4 Autoscale the output to fit in the scope window by clicking on
.
You can achieve a more finely sampled output by decreasing the Sample
time parameter. For example, change the Sample time parameter to 0.005,
run the model, and autoscale the output. The Time Scope window should
now look similar to the following figure.
3-10
Running the Model
5 Experiment with your model. Change the Frequency (Hz) and Sample
time parameters of the Sine Wave block. Then, run your model to see the
effect.
Now that you have run your model, you are ready to add noise to your
sinusoidal signal and view its effect. To learn how to do this, see “Modifying
Your Model” on page 3-12.
3-11
3
Signal Processing Models
Modifying Your Model
A system’s input signal can contain noise that was introduced as the signal
traveled over a wire or through the air. You can incorporate noise into the
model of your system to simulate this real-world noise. Then, you can
experiment with ways to eliminate its effect at both low and high frequencies.
In this topic, you model a real-world signal by adding noise to your input signal.
In the next chapter, you use a filter to convert this noise to low frequency noise
and another filter to eliminate this noise from your signal:
1 If the model you worked with in “Running the Model” on page 3-9 is not open
on your desktop, you can open an equivalent model by typing
doc_gstut2
at the MATLAB command prompt.
2 Add a Random Source block to your model to represent the noise in your
system. From the Signal Processing Sources library, click-and-drag a
Random Source block into your model. Set the block parameters before you
connect the blocks. Double-click the Random Source block and set the block
parameters as follows:
- Source type = Gaussian
- Method = Ziggurat
- Mean = 0
- Variance = 1
- Repeatability = Specify seed
- Initial seed = [23341]
- Sample time = 0.05
Based on these parameters, the Random Source block produces Gaussian
random values using the Ziggurat method. The Repeatability and Initial
seed parameters ensure that the block outputs the same signal each time
you run the model. The figure below shows the completed Random Source
dialog box.
3-12
Modifying Your Model
Opening this dialog box causes a running simulation to pause. See “Changing
Source Block Parameters” in the online Simulink documentation for details.
3 Add a Sum block to your model to add the random noise to your input signal.
From the Simulink library, then from the Math Operations library,
click-and-drag a Sum block into your model.
4 Set the Sum block parameters. Open the Sum dialog box by double-clicking
the Sum block. Change the List of signs parameter to ++|.
3-13
3
Signal Processing Models
5 Set the time scope parameters. Open the Time Scope window by
double-clicking the Time Scope block. Open the Time Scope parameters
dialog box by clicking on the Parameters icon in the Time Scope window.
In the Time Scope parameters dialog box, set the Number of axes
parameter to 2 and click OK. Now, the Time Scope window has two plotting
windows and the Time Scope block has two input ports.
3-14
Modifying Your Model
6 Connect the blocks. Connect the output of the Sine Wave block and the
output of the Random Source block to the input of the Sum block. Then,
connect the output of the Sum block to the second input of the Time Scope
block. When you are finished, your model should look similar to the figure
shown below.
7 Verify the parameters of your Sine Wave block. Open the Sine Wave dialog
box by double-clicking the Sine Wave block. Verify that the Frequency (Hz)
parameter is set to 0.5 and the Sample time parameter is set to 0.05. Note
that the value of the Sample time parameter of the Sine Wave block is the
same as the value of the Sample time parameter of the Random Source
block.
8 Run your model and view the results in the Time Scope window. The block
displays the original sinusoidal signal in the top axes and the signal with the
noise in the bottom axes.
3-15
3
Signal Processing Models
Note You can change the signal labels in the Time Scope window by
right-clicking on the axes and selecting Axes properties. In the Title text box,
enter your signal label.
You have now created and run a signal processing model that displays a
sinusoidal signal over time. During this process, you created a digital sine wave
and viewed it in the Time Scope window. You also added noise to your
sinusoidal signal and viewed its effect. In Chapter 4, “Filters” you increase the
complexity of your signal processing model by adding filters to eliminate the
presence of this noise.
3-16
4
Filters
Filters are an integral part of this manual’s extended example. In this chapter, you expand your
signal processing model into an adaptive noise cancellation system using digital and adaptive filters.
You create a digital filter to simulate colored noise in your signal and an adaptive filter to remove this
colored noise. Lastly, you view the coefficients of your adaptive filter to see how they change over
time.
Digital Filters (p. 4-2)
Design a digital lowpass filter and incorporate it into your
model to simulate the presence of low frequency noise.
Adaptive Filters (p. 4-9)
Design an adaptive filter and use it to recover your
original sinusoidal signal.
4
Filters
Digital Filters
You can design lowpass, highpass, bandpass, and bandstop filters using either
the Digital Filter Design block or the Filter Realization Wizard. These blocks
are capable of calculating filter coefficients for various filter structures. In
Chapter 3, “Signal Processing Models” you added white noise to a sine wave
and viewed the resulting signal on a scope. In this section, you use the Digital
Filter Design block to convert this white noise to low frequency noise so you can
simulate its effect on your system.
As a practical application, suppose a pilot is speaking into a microphone within
the cockpit of an airplane. The noise of the wind passing over the fuselage is
also reaching the microphone. A sensor is measuring the noise of the wind on
the outside of the plane. You want to estimate the wind noise inside the cockpit
and subtract it from the input to the microphone so only the pilot’s voice is
transmitted. In this chapter, you first learn how to model the low frequency
noise that is reaching the microphone. Later, you learn how to remove this
noise so that only the pilot’s voice is heard.
This section includes the following topics:
• “Designing a Digital Filter” on page 4-2 — Design a digital lowpass filter to
create low frequency noise.
• “Adding a Digital Filter to Your Model” on page 4-6 — Add your digital filter
to your model to simulate the presence of low frequency noise in your system.
Designing a Digital Filter
In this topic, you use a Digital Filter Design block to create low frequency noise,
which models the wind noise inside the cockpit:
1 If the model you created in “Modifying Your Model” on page 3-12 is not open
on your desktop, you can open an equivalent model by typing
doc_gstut3
at the MATLAB command prompt. This model contains a Time Scope block
that displays the original sine wave and the sine wave with white noise
added.
4-2
Digital Filters
2 Open the Signal Processing Blockset library by typing dsplib at the
MATLAB command prompt.
3 Convert white noise to low frequency noise by introducing a Digital Filter
Design block into your model. In the airplane scenario, the air passing over
the fuselage creates white noise which is measured by a sensor. This noise
is modeled by the Random Source block. The fuselage of the airplane
converts this white noise to low frequency noise, a type of colored noise,
which is heard inside the cockpit. This noise contains only certain
frequencies and is more difficult to eliminate. In this example, you model the
low frequency noise using a Digital Filter Design block. This block uses the
functionality of the Filter Design and Analysis Tool (FDATool) to design a
filter. Double-click the Filtering library, and then double-click the Filter
Designs library. Click-and-drag the Digital Filter Design block into your
model.
4-3
4
Filters
4 Set the Digital Filter Design block parameters to design a lowpass filter and
create low frequency noise. Open the Digital Filter Design dialog box by
double-clicking the block. Set the block parameters as follows:
- Response Type = Lowpass
- Design Method = FIR and, from the list, choose Window
- Filter Order = Specify order and enter 31
- Window = Hamming
- Units = Normalized (0 to 1)
- wc = 0.5
Based on these parameters, the Digital Filter Design block designs a
lowpass FIR filter with 32 coefficients and a cutoff frequency of 0.5. The
block multiplies the time-domain response of your filter by a 32 sample
Hamming window.
4-4
Digital Filters
5 View the magnitude response of your filter in the Magnitude Response
window by clicking Design Filter at the bottom center of the dialog. The
Digital Filter Design dialog box should now look similar to the following
figure.
Passband
Filter design
summary
Stopband
Cutoff frequency
Filter design
specifications
You have now designed a digital lowpass filter using the Digital Filter Design
block. In the next topic, “Adding a Digital Filter to Your Model” on page 4-6,
you integrate your filter into your model.
You can experiment with the Digital Filter Design block in order to design a
filter of your own. For more information on the block functionality, see the
Digital Filter Design block reference page in the Signal Processing Blockset
4-5
4
Filters
User’s Guide. For more information on the Filter Design and Analysis Tool, see
“FDATool: A Filter Design and Analysis GUI” in the Signal Processing Toolbox
documentation.
Adding a Digital Filter to Your Model
In this topic, you add the lowpass filter you designed in “Designing a Digital
Filter” on page 4-2 to your block diagram. Use this filter, which converts white
noise to colored noise, to simulate the low frequency wind noise inside the
cockpit:
1 If the model you created in “Designing a Digital Filter” on page 4-2 is not
open on your desktop, you can open an equivalent model by typing
doc_gstut4
at the MATLAB command prompt.
4-6
Digital Filters
2 Incorporate the Digital Filter Design block into your block diagram.
Click-and-drag the Digital Filter Design block, and place it between the
Random Source block and the Sum block.
3 Run your model and view the results in the Time Scope window. This
window shows the original input signal and the signal with low frequency
noise added to it.
4-7
4
Filters
You have now built a digital filter and used it to model the presence of colored
noise in your signal. This is analogous to same as modeling the low frequency
noise reaching the microphone in the cockpit of the aircraft. Now that you have
added noise to your system, you can experiment with methods to eliminate it.
In the next section, “Adaptive Filters” on page 4-9, you design an adaptive filter
to remove this noise from your signal.
4-8
Adaptive Filters
Adaptive Filters
Adaptive filters track the dynamic nature of a system and allow you to
eliminate time-varying signals. The Signal Processing Blockset libraries
contain blocks that implement least-mean-square (LMS), Block LMS, Fast
Block LMS, and recursive least squares (RLS) adaptive filter algorithms. These
filters minimize the difference between the output signal and the desired
signal by altering their filter coefficients. Over time, the adaptive filter’s output
signal more closely approximates the signal you want to reproduce.
This section includes the following topics:
• “Designing an Adaptive Filter” on page 4-9 — Design an adaptive filter to
remove the low frequency noise.
• “Adding the Adaptive Filter to Your Model” on page 4-14 — Add your
adaptive filter to your system to recover your original sinusoidal signal.
• “Viewing the Coefficients of Your Adaptive Filter” on page 4-19 — View the
variation of the adaptive filter’s coefficients while your model is running.
Designing an Adaptive Filter
In this topic, you design an LMS adaptive filter to remove the low frequency
noise in your signal:
1 If the model you created in “Adding a Digital Filter to Your Model” on
page 4-6 is not open on your desktop, you can open an equivalent model by
typing
doc_gstut5
at the MATLAB command prompt.
4-9
4
Filters
2 Open the Signal Processing Blockset library by typing dsplib at the
MATLAB command prompt.
3 Remove the low frequency noise from your signal by adding an LMS Filter
block to your system. In the airplane scenario, this is equivalent to
subtracting the wind noise inside the cockpit from the input to the
microphone. Double-click the Filtering library, and then double-click the
Adaptive Filters library. Click-and-drag the LMS Filter block into your
model.
4-10
Adaptive Filters
4 Set the LMS Filter block parameters to model the output of the Digital Filter
Design block. Open the LMS Filter dialog box by double-clicking the block.
Set the block parameters as follows:
- Algorithm = Normalized LMS
- Filter length = 32
- Specify step size via = Dialog
- Step size (mu) = 0.1
- Leakage factor (0 to 1) = 1.0
- Initial value of filter weights = 0
- Clear the Adapt port check box.
- Reset port = None
- Select the Output filter weights check box.
4-11
4
Filters
Based on these parameters, the LMS Filter block computes the filter
weights using the normalized LMS equations. The filter order you specified
is the same as the filter order of the Digital Filter Design block. The Step
size (mu) parameter defines the granularity of the filter update steps.
Because you set the Leakage factor (0 to 1) parameter to 1.0, the current
filter coefficient values depend on the filter’s initial conditions and all of the
previous input values. The initial value of the filter weights (coefficients) is
zero. Since you selected the Output filter weights check box, the Wts port
appears on the block. The block outputs the filter weights from this port.
When you are finished setting the parameters, the LMS Filter dialog box
should look like the following figure.
4-12
Adaptive Filters
Now that you have set the block parameters of the LMS Filter block, you can
incorporate this block into your block diagram. To learn how to do this, see
“Adding the Adaptive Filter to Your Model” on page 4-14.
4-13
4
Filters
Adding the Adaptive Filter to Your Model
In this topic, you recover your original sinusoidal signal by incorporating the
adaptive filter you designed in “Designing an Adaptive Filter” on page 4-9 into
your system. In the aircraft scenario, the adaptive filter models the low
frequency noise heard inside the cockpit. As a result, you can remove the noise
so that the pilot’s voice is the only input to the microphone:
1 If the model you created in “Designing an Adaptive Filter” on page 4-9 is not
open on your desktop, you can open an equivalent model by typing
doc_gstut6
at the MATLAB command prompt.
4-14
Adaptive Filters
2 Subtract the output of the adaptive filter, i.e. low frequency noise, from the
sinusoidal signal with low frequency noise. To do this, add a Sum block to
your model. From the Simulink Math Operations library, click-and-drag a
Sum block into your model. Open the Sum dialog box by double-clicking this
block. Change the List of signs parameter to |+-.
3 Incorporate the LMS Filter block into your system. Connect the output of the
Random Source block to the Input port of the LMS Filter block. In the
aircraft scenario, the random noise is the white noise measured by the
sensor on the outside of the airplane. The LMS Filter block models the effect
of the airplane’s fuselage on the noise. Connect the output of the Digital
Filter Design block to the Desired port on the LMS Filter block. This is the
signal you want the LMS block to reproduce. Connect the output of the LMS
Filter block to the negative port of the second Sum block, i.e., the Sum block
you added in step 2. Connect the output of the first Sum block to the positive
port of the second Sum block. Your model should now look similar to the
following figure.
4-15
4
Filters
The positive input to the second Sum block is the sum of the input signal and
the low frequency noise, s ( n ) + y . The negative input to the second Sum
block is the LMS Filter block’s best estimation of the low frequency noise, y' .
When you subtract the two signals, you are left with an approximation of the
input signal.
s ( n ) approx = s ( n ) + y – y′
In this equation, s ( n ) is the input signal, s ( n ) approx is the approximation
of the input signal, y is the noise created by the Random Source block and
the Digital Filter Design block, and y′ is the LMS Filter block’s
approximation of the noise. Because the LMS Filter block can only
approximate the noise, there is still a difference between the input signal
and the approximation of the input signal. In subsequent steps, you set up
4-16
Adaptive Filters
the Time Scope block so you can compare the original sinusoidal signal with
its approximation.
4 Add two additional inputs and axes to the Time Scope block. Open the Time
Scope window by double-clicking the Time Scope block. Click the
Parameters button. For the Number of axes parameter, enter 4. Close the
dialog box by clicking OK.
5 Label the new Time Scope axes. In the Time Scope window, right-click on
the third axes and point to Axes properties. The Time Scope properties:
axis 3 dialog box opens. In the Title box, enter Approximation of Input
Signal. Close the dialog box by clicking OK. Repeat this procedure for the
fourth axes and label it Error.
6 Connect the new inputs of the Time Scope block. Connect the output of the
second Sum block to the third port of the Time Scope block. Connect the
output of the Error port on the LMS Filter block to the fourth port of the
Time Scope block. Your model should now look similar to the following
figure.
4-17
4
Filters
In this example, the output of the Error port is the difference between the LMS
filter’s desired signal and its output signal. Because the error is never zero, the
filter continues to modify the filter coefficients in order to better approximate
the low frequency noise. The better the approximation, the more low frequency
noise that can be removed from the sinusoidal signal. In the next topic,
“Viewing the Coefficients of Your Adaptive Filter” on page 4-19, you learn how
to view the coefficients of your adaptive filter as they change with time.
4-18
Adaptive Filters
Viewing the Coefficients of Your Adaptive Filter
The coefficients of an adaptive filter change with time in accordance with a
chosen algorithm. Once the algorithm optimizes the filter’s performance, these
filter coefficients reach their steady-state values. You can view the variation of
your coefficients, while the simulation is running, to see them settle to their
steady-state values. Then, you can determine whether you can implement
these values in your actual system:
1 If the model you created in “Adding the Adaptive Filter to Your Model” on
page 4-14 is not open on your desktop, you can open an equivalent model by
typing
doc_gstut7
at the MATLAB command prompt. Note that the Wts port of the adaptive
filter, which outputs the filter weights, still needs to be connected.
4-19
4
Filters
2 Open the Signal Processing Blockset library by typing dsplib at the
MATLAB command prompt.
3 View the filter coefficients using a Vector Scope block. Double-click the
Signal Processing Sinks library, and click-and-drag a Vector Scope block
into your model.
4-20
Adaptive Filters
4 Set the Vector Scope block parameters. Open the Vector Scope dialog box
by double-clicking the block. Set the block parameters as follows:
- Click the Scope Properties tab.
- Input domain = Time
- Time display span (number of frames) = 1
- Click the Display Properties tab.
- Select the Show grid, Frame number, Compact display, and Open
scope at start of simulation check boxes.
- Click the Axis Properties tab.
- Minimum Y-limit = -0.2
- Maximum Y-limit = 0.6
- Y-axis title = Filter Weights
- Click the Line Properties tab.
- Line visibilities = on
- Line style =:
- Line markers =.
- Line colors = [0 0 1]
5 Connect the Vector Scope block to the Wts port of the LMS Filter block.
4-21
4
Filters
6 Set the configuration parameters. Open the Configuration dialog box by
selecting Configuration Parameters from the Simulation menu. In the
Solver pane, for the Stop time parameter, enter inf. From the Type list,
choose Fixed-step. From the Solver list, choose discrete (no continuous
states).
We recommend these configuration parameters for models that contain
Signal Processing Blockset blocks. Because these blocks calculate values
directly rather than solving differential equations, you must configure the
Simulink Solver to behave like a scheduler. The Solver, while in scheduler
mode, uses a block’s sample time to determine when the code behind each
4-22
Adaptive Filters
block is executed. For example, the sample time of the Sine Wave and
Random Source blocks in this model is 0.05. The Solver executes the code
behind these blocks, and every other block with this sample time, once every
0.05 second.
Note When working with models that contains blocks from the Signal
Processing Blockset, use source blocks that enable you to specify their sample
time. If your source block does not have a Sample time parameter, you must
add a Zero-Order Hold block in your model and use it to specify the sample
time. For more information, see “Continuous-Time Source Blocks” in the
Signal Processing Blockset User’s Guide. The exception to this rule is the DSP
Constant block, which can have a constant sample time. When it does,
Simulink executes this block and records the constant value once, which
allows for faster simulations and more compact generated code.
7 Close the dialog box by clicking OK.
8 Open the Time Scope window by double-clicking the Time Scope block.
9 Run your model and view the behavior of your filter coefficients in the
Vector Scope window, which opens automatically when your simulation
starts. Over time, you see the filter coefficients change and approach their
steady-state values, shown below.
4-23
4
Filters
You can simultaneously view the behavior of the system in the Time Scope
window. Over time, you see the error decrease and the approximation of the
input signal more closely match the original sinusoidal input signal.
4-24
Adaptive Filters
You have now created a model capable of adaptive noise cancellation. So far,
you have learned how to design a lowpass filter using the Digital Filter Design
block. You also learned how to create an adaptive filter using the LMS Filter
block. The Signal Processing Blockset has other blocks capable of designing
and implementing digital and adaptive filters. For more information on the
filtering capabilities of the Signal Processing Blockset, see “Filters” in the
Signal Processing Blockset User’s Guide.
Because all blocks in this model have the same sample time, this model is
single rate and Simulink ran it in SingleTasking solver mode. If the blocks in
your model have different sample times, your model is multirate and Simulink
might run it in MultiTasking solver mode. For more information on solver
modes, see “Recommended Settings for Discrete-Time Simulations” in the
Signal Processing Blockset User’s Guide.
In Chapter 5, “Code Generation” you use Real-Time Workshop to generate code
from your model.
4-25
4
Filters
4-26
5
Code Generation
This chapter demonstrates how to generate C code from your signal processing model. You can
implement this code on other computer systems and external targets.
Understanding Code Generation
(p. 5-2)
Learn how Real-Time Workshop generates code from your
model.
Generating Code (p. 5-4)
Generate an executable from your model and view the
generated source code.
5
Code Generation
Understanding Code Generation
You can use Real-Time Workshop to generate code for distribution on other
software platforms and hardware applications. In Chapter 4, “Filters” you built
a model capable of adaptive noise cancellation. In this section, you learn basic
code generation concepts that help you understand how Real-Time Workshop
generates code from your model.
This section includes the following topics:
• “Code Generation with Real-Time Workshop” on page 5-2 — Understand
how your generated code can solve real-world problems.
• “Highly Optimized Generated C Code” on page 5-3 — Learn the techniques
used to maximize the code’s speed and minimize its memory use.
Code Generation with Real-Time Workshop
The Signal Processing Blockset, Real-Time Workshop, and Real-Time
Workshop Embedded Coder enable you to generate code that you can use to
implement your model for a practical application. For instance, you can create
an executable from your Simulink model to run on a target chip.
This chapter introduces you to the basic concepts of code generation using
these tools. For more information on code generation, see “The Build Process”
in the Real-Time Workshop documentation. See “Model Execution” in the
Real-Time Workshop documentation for more information on how the
generated model code is executed.
Windows Dynamic Library Dependencies
To run executables generated for Generic Real-Time (GRT), Embedded
Real-Time (ERT), and S-Function targets, you need dsp_rt.dll if
• The Real-Time Workshop target is a Windows platform and
• You are using the default Real-Time Workshop optimization parameters
For more information about Real-Time Workshop optimization parameters,
see “Generated Source Files and File Dependencies” in the Real-Time
Workshop documentation.
5-2
Understanding Code Generation
Copy dsp_rt.dll from the machine where the Signal Processing Blockset is
installed to a directory on the system path of a different machine if you use
• Real-Time Workshop with the Signal Processing Blockset on Windows to
generate standalone executables for GRT, ERT, or S-Function targets and
• You want to run these executables on a Windows machine where the Signal
Processing Blockset is not installed
The library dsp_rt.dll resides in $matlabroot/bin/win32 on the machine
where MATLAB and the Signal Processing Blockset are installed.
Highly Optimized Generated C Code
All Signal Processing Blockset blocks generate highly optimized ANSI/ISO
C code. This C code is often suitable for embedded applications, and includes
the following optimizations:
• Function reuse (run-time libraries) — The generated code reuses common
algorithmic functions via calls to run-time functions. Run-time functions are
highly optimized ANSI/ISO C functions that implement core algorithms such
as FFT and convolution. Run-time functions are precompiled into ANSI/ISO
C run-time libraries, and enable the blocks to generate smaller, faster code
that requires less memory.
• Parameter reuse (Real-Time Workshop run-time parameters) — In
many cases, if there are multiple instances of a block that all have the same
value for a specific parameter, each block instance points to the same
variable in the generated code. This process reduces memory requirements.
• Blocks have parameters that affect code optimization — Various blocks,
such as the FFT and Sine Wave blocks, have parameters that enable you to
optimize the simulation for memory or for speed. These optimizations also
apply to code generation.
• Other optimizations — Use of contiguous input and output arrays,
reusable inputs, overwritable arrays, and inlined algorithms provide smaller
generated C code that is more efficient at run-time.
5-3
5
Code Generation
Generating Code
In this section, you learn how to generate code from your signal processing
model using the Signal Processing Blockset and Real-Time Workshop. You also
learn how to view your generated code in HTML format.
Note You must have both the Signal Processing Blockset and Real-Time
Workshop installed on your computer to complete this section’s procedures.
This section includes the following topics:
• “Setting Up the Build Directory” on page 5-4 — Create the directory to store
the generated source code.
• “Setting Configuration Parameters” on page 5-5 — Enter the necessary
parameter values to ensure your code is generated correctly.
• “Generating Code” on page 5-11 — Create code from your signal processing
model.
• “Viewing the Generated Code” on page 5-12 — Look at the generated source
code in HTML format.
Setting Up the Build Directory
First, you need to create a filter directory and put a local copy of your model in
it. Real-Time Workshop creates a build directory within this filter directory
during code generation. The build directory name is model_target_rtw,
derived from the name of the source model and the selected target. The build
directory contains generated source code and other files created during the
build process. This procedure assumes that your filter directory resides on
drive D: (PC) or your home directory (UNIX):
1 Set up your filter directory by typing
!mkdir d:\filter_example (PC)
or
5-4
Generating Code
!mkdir ~/filter_example (UNIX)
The "!" character passes the command that follows it to the operating
system, which creates the directory.
2 Make this your working directory by typing cd d:\filter_example (PC).
3 If the model you created in “Viewing the Coefficients of Your Adaptive
Filter” on page 4-19 is not open on your desktop, you can open an equivalent
model by typing
doc_gstut8
at the MATLAB command prompt.
4 Save this model in your new working directory.
You have now created a directory to store the generated source files. In the next
topic, “Setting Configuration Parameters” on page 5-5, you configure your
model.
Setting Configuration Parameters
Before you can generate code, you must set several model parameters using the
Configuration dialog box. To learn how to configure your model and Real-Time
Workshop so that your generated code accurately reflects your system, see the
following topics:
• “Selecting a Solver Algorithm” on page 5-5
• “Selecting a Target Configuration” on page 5-7
• “Controlling Other Code Generation Options” on page 5-10
In these procedures, you continue to work with gstut8.mdl, the model you
saved in your working directory in “Setting Up the Build Directory” on
page 5-4.
Selecting a Solver Algorithm
Specify parameters that enable Simulink to solve your model:
1 Open the Configuration dialog box for this model by selecting
Configuration Parameters from the Simulation menu.
5-5
5
Code Generation
2 In the Select pane, click Solver. Set the parameters as follows, and then
click OK:
- Start Time = 0.0
- Stop Time = 60.0
- Type = Fixed-step
- Solver = discrete (no continuous states)
- Fixed step size (fundamental sample time) = 0.01
- Tasking mode for periodic sample times = SingleTasking
When you are finished setting the parameters, the Solver pane should look
similar to the following figure.
5-6
Generating Code
Selecting a Target Configuration
All Signal Processing Blockset blocks support the following code generation
targets:
• Generic Real-Time (GRT) target
• Embedded Real-Time (ERT) target
The MathWorks supplies the Generic Real-Time (GRT) target with Real-Time
Workshop. This target uses the real-time code format and supports external
mode communication. You can use this target as a starting point when creating
a custom rapid prototyping target, or for validating the generated code on your
workstation.
The MathWorks supplies the Embedded Real-Time (ERT) target with
Real-Time Workshop Embedded Coder. This is a separate product from
Real-Time Workshop. This target configuration generates model code for
execution on an independent embedded real-time system. For more
information about Real-Time Workshop Embedded Coder, see
http://www.mathworks.com/products/rtwembedded/.
A target configuration consists of system target file, a template makefile, and
a make command. In most situations, rather than specifying these parameters
individually, you use the ready-to-run generic real-time target configuration.
This GRT target is designed to build a stand-alone executable program that
runs on your workstation:
1 If you have not already done so, open the Configuration dialog box. In the
Select pane, click Real Time Workshop.
5-7
5
Code Generation
2 Make sure that the Generate code only check box is not selected. If you
select this check box, Real-Time Workshop does not generate an executable
after it has created source code.
3 Select a target configuration. Open the System target file browser by
clicking Browse next to the RTW system target file box. The System target
file browser displays a list of all currently available target configurations.
When you select a target configuration, Real-Time Workshop automatically
chooses the appropriate system target file, template makefile, and make
command. From the list of available configurations, select Generic
Real-Time Target and then click OK.
5-8
Generating Code
The Real-Time Workshop pane now displays the correct system target file
(grt.tlc), template makefile (grt_default_tmf), and make command
(make_rtw).
5-9
5
Code Generation
Controlling Other Code Generation Options
The are a number of additional options that you can set using the
Configuration dialog box:
1 If you have not already done so, open the Configuration dialog box.
2 Prevent data from being logged to the MATLAB workspace. In the Select
pane, click Data Import/Export, and then clear the Time and Output check
boxes. These check boxes control whether or not the respective variables are
sent to the workspace.
3 Create a navigable summary of source files when the model is built. In the
Select pane, click Real-Time Workshop. Select the Generate HTML
report and Launch report after code generation completes check boxes.
The HTML report opens automatically after the code generation is complete.
5-10
Generating Code
4 Make statements that were eliminated as a result of optimizations appear
as comments in the generated code. In the Select pane, expand Real-Time
Workshop. Click Comments, and then select the Show eliminated
statements check box.
5 View progress information during code generation. In the Select pane,
expand Real-Time Workshop. Click Debug, and then select the Verbose
build check box. When this option is selected, the MATLAB Command
Window displays progress information during code generation. The compiler
also reports its progress there.
6 Apply these settings and close this dialog box by clicking OK.
7 Save the model in your working directory. Your configuration parameters
are saved within the model file.
Once you have configured your model, you are ready to generate code. To learn
how to do this, see “Generating Code” on page 5-11.
Generating Code
After you set the configuration parameters, you can generate code from your
model. In this procedure, you continue to work with gstut8.mdl, the model you
saved in your working directory in “Setting Configuration Parameters” on
page 5-5:
1 Open the Configuration dialog box. In the Select pane, click Real-Time
Workshop.
2 To start the Real-Time Workshop build process, click Build at the bottom of
the Real Time Workshop pane. A number of messages concerning code
generation and compilation appear in the MATLAB Command Window. The
initial messages are
### Starting Real-Time Workshop build procedure for model: gstut8
### Generating code into build directory:
d:\filter_example\gstut8_grt_rtw
The content of the succeeding messages depends on your compiler and
operating system. The final message is
### Successful completion of Real-Time Workshop build procedure
for model: gstut8
5-11
5
Code Generation
3 Type dir at the MATLAB command prompt. The working directory now
contains a build directory, gstut8_grt_rtw, which Real-Time Workshop
created. Real-Time Workshop put the generated source files in this
directory.
You have now generated code from your signal processing model file. In
“Viewing the Generated Code” on page 5-12, you view your code in an HTML
Report.
Viewing the Generated Code
Once you have generated code from your Simulink model, you can view this
code in an HTML report. You asked Real-Time Workshop to create this report
by selecting the Generate HTML report check box. The HTML report is a
navigable summary of source files that you can view in the Real-Time
Workshop Report window:
1 View the code automatically generated by Real-Time Workshop. Select the
Real-Time Workshop Report window. You can use the links on the left side
of the report to view the different source and header files that were
generated.
2 To display one of the generated files, click the gstut8.c link in the
Generated Source Files list. The generated code is displayed as an HTML
file in the right side of the Real-Time Workshop Report window. Real-Time
Workshop produces an HTML file for each source file in a directory named
\html within the build directory.
5-12
Generating Code
Selected files
appear in this pane
Links to source and
header files
You have now generated ANSI/ISO C code from your signal processing model
and viewed this code in an HTML report. For more information on code
generation, see the Real-Time Workshop documentation. For information on
generating fixed-point code, refer to “Code Generation” in the Simulink Fixed
Point documentation.
5-13
5
Code Generation
5-14
6
Frequency Domain Signals
This chapter uses spectral analysis concepts to illustrate the frequency-domain capabilities of the
Signal Processing Blockset. In this chapter, you calculate and view the power spectrum estimate and
spectrogram of a speech signal.
Power Spectrum Estimates (p. 6-2)
Create a model capable of calculating the power spectrum
estimate of a speech signal.
Spectrograms (p. 6-12)
Modify the model to calculate and display the
spectrogram of a speech signal.
6
Frequency Domain Signals
Power Spectrum Estimates
Up until now, you have been dealing with signals in the time domain. The
Signal Processing Blockset is also capable of working with signals in the
frequency domain. You can use the Signal Processing Blockset to perform fast
Fourier transforms (FFTs), power spectrum analysis, short-time FFTs, and
many other frequency-domain applications.
The power spectrum of a signal represents the contribution of every frequency
of the spectrum to the power of the overall signal. It is useful because many
signal processing applications, such as noise cancellation and system
identification, are based on frequency-specific modifications of signals. In this
section, you build a model capable of calculating and displaying the power
spectrum of a speech signal that represents a woman’s voice saying
“MATLAB.”
This section includes the following topics:
• “Creating the Block Diagram” on page 6-2 — Assemble the blocks needed to
calculate the power spectrum of your speech signal.
• “Setting the Model Parameters” on page 6-4 — Set the parameters of your
power spectrum model.
• “Viewing the Power Spectrum Estimates” on page 6-9 — Use a Vector Scope
block to view the power spectrum of your speech signal.
Creating the Block Diagram
First, assemble and connect the blocks needed to calculate the power spectrum
of your speech signal:
1 Open a new Simulink model.
2 Add the following blocks to your model. Subsequent topics describe how to
use these blocks.
6-2
Block
Library
Signal From Workspace
Signal Processing Sources
Buffer
Signal Management / Buffers
Power Spectrum Estimates
Block
Library
Periodogram
Estimation / Power Spectrum Estimation
Vector Scope
Signal Processing Sinks
3 Connect the blocks as shown in the figure below.
Once you have assembled the blocks needed to calculate the power spectrum of
your speech signal, you can set the block parameters. To learn how to do this,
see “Setting the Model Parameters” on page 6-4. The Buffer, Periodogram, and
Vector Scope blocks in this model can be replaced by a Spectrum Scope block.
For more information on this block, see the Spectrum Scope block reference
page.
6-3
6
Frequency Domain Signals
Setting the Model Parameters
In the previous topic, you have assembled the blocks needed to calculate the
power spectrum of your speech signal. Now you need to set the block
parameters. These parameter values ensure that the model calculates the
power spectrum of your signal accurately:
1 If the model you created in “Creating the Block Diagram” on page 6-2 is not
open on your desktop, you can open an equivalent model by typing
doc_gstut9
at the MATLAB command prompt.
2 Load the speech signal, whose power spectrum you are going to calculate,
into the MATLAB workspace. At the MATLAB command prompt, type
load mtlb. This speech signal is a woman’s voice saying “MATLAB.”
3 Use the Signal From Workspace block to import the speech signal from the
MATLAB workspace into your Simulink model. Open the Signal From
Workspace dialog box by double-clicking the block. Set the block
parameters as follows:
- Signal = mtlb
- Sample time = 1/8000
- Samples per frame = 80
- Form output after final data value by = Setting to zero
The Signal Processing Blockset is capable of frame-based processing. In
other words, Signal Processing Blockset blocks can process multiple samples
of data at one time. This improves the computational speed of your model.
In this case, by setting the Samples per frame parameter to 80, you are
telling the Signal From Workspace block to output a frame that contains 80
signal samples at each simulation time step. Note that the sample period of
the input signal is 1/8000 seconds. Also, after the block outputs the final
signal value, all other outputs are zero.
6-4
Power Spectrum Estimates
Once you are done setting these parameters, the Signal From Workspace
dialog box should look similar to the figure below.
4 Use the Buffer block to buffer the input signal into frames that contain 128
samples. Open the Buffer dialog box by double-clicking the block. Set the
block parameters as follows:
- Output buffer size (per channel) = 128
- Buffer overlap = 48
- Initial conditions = 0
Based on these parameters, the first output frame contains 48 initial
condition values followed by the first 80 samples from the first input frame.
The second output frame contains the last 48 values from the previous frame
followed by the second 80 samples from the second input frame, and so on.
You are buffering your input signal into an output signal with 128 samples
per frame to minimize the estimation noise added to your signal. Also,
6-5
6
Frequency Domain Signals
because 128 is a power of 2, this operation optimizes the FFT performed by
the Periodogram block.
Once you are done setting these parameters, the Buffer dialog box should
look similar to the figure below.
5 Use the Periodogram block to compute a nonparametric estimate of the
power spectrum of the speech signal. Open the Periodogram dialog box by
double-clicking the block. Set the block parameters as follows:
- Window type = Hamming
- Window sampling = Periodic
- Select the Inherit FFT length from input dimensions check box.
- Number of spectral averages = 2
Based on these parameters, the block applies a Hamming window
periodically to the input speech signal and averages two spectra at one time.
6-6
Power Spectrum Estimates
The length of the FFT is assumed to be 128, which is the number of samples
per frame being output from the Buffer block.
Once you are done setting these parameters, the Periodogram dialog box
should look similar to the figure below.
6 Use the Vector Scope block to view the power spectrum of the speech signal.
Open the Vector Scope dialog box by double-clicking the block. Set the block
parameters as follows:
- Input domain = Frequency
- Click the Axis Properties tab.
- Clear the Inherit sample time from input check box.
- Sample time of original time series = 1/8000
- Y-axis title = Magnitude, dB
Because you are buffering the input with a nonzero overlap, you have
altered the sample time of the signal. As a result, you need to specify the
6-7
6
Frequency Domain Signals
sample time of the original time series. Otherwise, the overlapping buffer
samples lead the block to believe that the sample time is shorter than it
actually is.
Once you are done setting these parameters, the Axis Properties pane of
the Vector Scope dialog box should look similar to the figure below. As you
can see by the Amplitude scaling parameter, the decibel amplitude is
plotted in a vector scope window
After you have set the block parameter values, you can calculate and view the
power spectrum of the speech signal. To learn how to do this, see “Viewing the
Power Spectrum Estimates” on page 6-9.
6-8
Power Spectrum Estimates
Viewing the Power Spectrum Estimates
In the previous topics, you created a power spectrum model and set its
parameters. In this topic, you simulate the model and view the power spectrum
of your speech signal:
1 If the model you created in “Setting the Model Parameters” on page 6-4 is
not open on your desktop, you can open an equivalent model by typing
doc_gstut10
at the MATLAB command prompt.
2 Set the configuration parameters. Open the Configuration dialog box by
selecting Configuration Parameters from the Simulation menu. Select
Solver from the menu on the left side of the dialog box, and set the
parameters as follows:
- Stop time = 0.5
- Type = Fixed-step
- Solver = discrete (no continuous states)
6-9
6
Frequency Domain Signals
3 Apply these parameters and close the Configuration dialog box by clicking
OK. These parameters are saved only when you save your model.
4 If you have not already done so, load the speech signal into the MATLAB
workspace by typing load mtlb.
5 Run the model to open the Vector Scope window. The data is not
immediately visible at the end of the simulation. To autoscale the y-axis to
fit the data, in the Vector Scope window, right-click and choose Autoscale.
The following figure shows the data displayed in the Vector Scope window.
6-10
Power Spectrum Estimates
During the simulation, the Vector Scope window displays a series of frames
output from the Periodogram block. Each of these frames corresponds to a
window of the original speech signal. The data in each frame represents the
power spectrum, or contribution of every frequency to the power of the original
speech signal, for a given window.
In the next section, “Spectrograms” on page 6-12, you use these power
spectrums to create a spectrogram of the speech signal.
6-11
6
Frequency Domain Signals
Spectrograms
Spectrograms are color-based visualizations of the evolution of the power
spectrum of a speech signal as this signal is swept through time. Spectrograms
use the periodogram power spectrum estimation method and are widely used
by speech and audio engineers. You can use them to develop a visual
understanding of the frequency content of your speech signal while a particular
sound is being vocalized. In this section, you view the spectrogram of a speech
signal.
This section includes the following topics:
• “Modifying the Block Diagram” on page 6-12 — Modify your model in order
to view the spectrogram of your speech signal.
• “Setting the Model Parameters” on page 6-14 — Set the parameters of your
model.
• “Viewing the Spectrogram of the Speech Signal” on page 6-19 — Use a
Matrix Viewer block to view the spectrogram of your speech signal.
Modifying the Block Diagram
In the previous section, you built a model capable of calculating the power
spectrum of a speech signal that represents a woman saying “MATLAB.” In
this topic, you modify this model to view the spectrogram of your signal:
1 If the model you created in “Viewing the Power Spectrum Estimates” on
page 6-9 is not open on your desktop, you can open an equivalent model by
typing
doc_gstut11
at the MATLAB command prompt.
6-12
Spectrograms
2 Add the following blocks to your model. Subsequent topics describe how to
use these blocks.
Block
Library
Selector
Simulink / Signal Routing
dB Conversion
Math Functions / Math Operations
Buffer
Signal Management / Buffers
Transpose
Math Functions / Matrices and Linear
Algebra / Matrix Operations
Matrix Viewer
Signal Processing Sinks
6-13
6
Frequency Domain Signals
3 Connect the blocks as shown in the figure below. These blocks extract the
positive frequencies of each power spectrum and concatenate them into a
matrix that represents the spectrogram of the speech signal.
Once you have assembled the blocks needed to view the spectrogram of your
speech signal, you can set the block parameters. To learn how to do this, see
“Setting the Model Parameters” on page 6-14.
Setting the Model Parameters
In the previous topic, you assembled the blocks you need to view the
spectrogram of your speech signal. Now you must set the block parameters:
1 If the model you created in “Modifying the Block Diagram” on page 6-12 is
not open on your desktop, you can open an equivalent model by typing
doc_gstut12
at the MATLAB command prompt.
2 Use the Selector block to extract the first 64 elements, or the positive
frequencies, of each power spectrum. Open the Selector dialog box by
double-clicking the block. Set the block parameters as follows:
6-14
Spectrograms
- Input type = Vector
- Index mode = One-based
- Source of element indices (E) = Internal
- Elements (-1 for all elements) = 1:64
- Input port width = 128
At each time instance, the input to the Selector block is a vector of 128
elements. The block assigns one-based indices to these elements and
extracts the first 64. Once you are done setting these parameters, the
Selector dialog box should look similar to the figure below.
3 The db Conversion block converts the magnitude of the input FFT signal to
decibels. Leave this block at its default parameters.
6-15
6
Frequency Domain Signals
4 Use the Buffer1 block to concatenate the individual power spectrums into a
a matrix. Open the Buffer1 dialog box by double-clicking the block. Set the
block parameters as follows:
- Output buffer size (per channel) = 48
- Buffer overlap = 46
- Initial conditions = -70
Based on these parameters, the Buffer1 block buffers the 64-by-1
frame-based input signal 48 times in order to create a 64-by-48 frame-based
signal. In other words, it collects the power spectrums calculated at each
time and concatenates them into a matrix. The block then outputs the
transpose of this matrix. To ensure that your spectrogram represents
smooth movement through time, set the value of the Buffer overlap
parameter slightly less than the value of the Output buffer size (per
channel) parameter. The Initial conditions parameter represents the
initial values in the buffer; -70 represents silence.
Once you are done setting these parameters, the Buffer1 dialog box should
look similar to the figure below.
6-16
Spectrograms
5 The Transpose block transposes the input signal back to its original
orientation. Leave this block at its default parameters.
6 The Matrix Viewer enables you to view the spectrogram of the speech signal.
Open the Matrix Viewer dialog box by double-clicking the block. Set the
block parameters as follows:
- Click the Image Properties tab.
- Colormap matrix = jet(256)
- Minimum input value = -70
- Maximum input value = 15
- Select the Display colorbar check box.
Once you are done setting these parameters, the Image Properties pane
should look similar to the figure below.
- Click the Axis Properties tab.
- Axis origin = Lower left corner
- X-axis title = Time Index
6-17
6
Frequency Domain Signals
- Y-axis title = Frequency Index
- Colorbar title = dB Magnitude
In this case, you are assuming that the power spectrum values do not exceed
15 dB. Once you are done setting these parameters, the Axis Properties
pane should look similar to the figure below.
After you have set the parameter values, you can calculate and view the
spectrogram of the speech signal. To learn how to do this, see “Viewing the
Spectrogram of the Speech Signal” on page 6-19.
6-18
Spectrograms
Viewing the Spectrogram of the Speech Signal
In the topic “Viewing the Power Spectrum Estimates” on page 6-9, you used a
Vector Scope block to display the power spectrum of your speech signal. In this
topic, you view the spectrogram of your speech signal using a Matrix Viewer
block. The speech signal represents a woman’s voice saying “MATLAB”:
1 If the model you created in “Setting the Model Parameters” on page 6-14 is
not open on your desktop, you can open an equivalent model by typing
doc_gstut13
at the MATLAB command prompt.
6-19
6
Frequency Domain Signals
2 Run the model. During the simulation, the Vector Scope window displays a
sequence of power spectrums, one for each window of the original speech
signal. The power spectrum is the contribution of every frequency to the
power of the speech signal.
6-20
Spectrograms
The Matrix Viewer window, shown below, displays the spectrogram of the
speech signal. This spectrogram is calculated using the Periodogram power
spectrum estimation method. Note the harmonics that are visible in the
signal when the vowels are spoken. Most of the signal’s energy is
concentrated in these harmonics; therefore, two distinct peaks are visible in
the spectrogram.
In this example, you viewed the spectrogram of your speech signal using a
Matrix Viewer block. You can find additional Signal Processing Blockset
examples in the Help browser. To access these examples, click the Contents
tab, double-click Signal Processing Blockset, and then click Examples. A list
of the examples in the Signal Processing Blockset documentation appears in
the right pane of the Help browser.
6-21
6
Frequency Domain Signals
For information about Signal Processing Blockset demos, see “Product Demos”
on page 1-5. For additional information about Signal Processing Blockset
functionality, see the Signal Processing Blockset User’s Guide.
6-22
Index
A
Acoustic Noise Cancellation demo 2-2
adaptive filtering 2-19
adaptive filters
adding to model 4-14
blocks 2-19
designing 4-9
viewing coefficients 4-19
algebra
linear 2-20
algorithms
solver 5-5
B
background
user’s expected 1-12
blocks
accessing directly 2-5
accessing with Simulink Library browser 2-5
Buffer 6-4
Digital Filter Design 4-2
links into models 5-12
LMS Filter 4-9
Matrix Viewer 6-14
Periodogram 6-4
Random Source 3-12
Selector 6-14
Signal From Workspace 6-4
Sine Wave 3-2
Sum 3-12
Time Scope 3-2
Vector Scope 4-19
Waterfall Scope 2-2
Buffer block 6-4
build directory
setting up 5-4
C
C code
generating 5-11
optimization 5-3
code
generating 5-4
code generation 5-11
HTML report 5-12
links to model blocks 5-12
minimizing size of 2-26
optimization 5-3
options 5-10
overview 5-2
setting parameters 5-5
support for 2-18
targets 5-7
understanding 5-2
viewing code 5-12
with Real-Time Workshop 5-2
coefficients
of adaptive filter 4-19
Comparison of Spectral Analysis Techniques demo
2-20
configuration parameters
setting 5-5
Configuration Parameters dialog box 5-5
constants
invariant (nontunable) 2-25
precomputing 2-25
creation of
adaptive filters 4-9
digital filters 4-2
spectrograms 6-12
Index-1
Index
D
E
data type
support 2-21
demos
Acoustic Noise Cancellation 2-2
Comparison of Spectral Analysis Techniques
2-20
Help browser 1-5
LMS Adaptive Equalization 2-19
MATLAB Central 1-9
Sample Rate Conversion 2-17
Statistical Functions 2-19
Web 1-8
design of
adaptive filters 4-9
digital filters 4-2
Digital Filter Design block 4-2
digital filters
adding to model 4-6
designing 4-2
displaying
coefficients of adaptive filter 4-19
documentation 1-10
generated code 5-12
power spectrum of speech signal 6-9
spectrogram of speech signal 6-19
spectrograms 6-19
documentation
installing 1-3
on system 1-10
on Web 1-10
PDF 1-11
printing 1-11
viewing 1-10
dspstartup M-file
editing 2-24
environment (system)
setting up 1-3
estimation
parametric 2-20
power spectrum 6-2
Index-2
F
features
Signal Processing Blockset 2-16
Filter Design and Analysis Tool (FDATool) 4-2
filters
adaptive 2-19
adding to model 4-6
lowpass 4-2
multirate 2-19
fixed-point support 2-18
fixed-step solvers
setting 2-26
frame-based
operations 2-16
signals 2-12
function reuse 5-3
functionality of the Signal Processing Blockset 2-2
functions, utility
startup 2-24
G
generated code
size of 2-26
generating code 5-11
generation of
code 5-4
Index
H
HTML reports 5-12
links to model blocks 5-12
I
installation
documentation 1-3
Signal Processing Blockset 1-3
L
libraries
Signal Processing Blockset 2-5
linear algebra 2-20
links to model blocks 5-12
LMS Adaptive Equalization demo 2-19
LMS Filter block 4-9
loop-rolling 2-25
lowpass filters 4-2
M
MATLAB Central
signal processing demos 1-9
matrices
frame-based 2-12
support for 2-20
Matrix Viewer block 6-14
memory
conserving 2-24
M-files
startup 2-24
modeling system behavior 2-2
models
creating 3-2
modifying 3-12
running 3-9
multichannel signals 2-10
multirate
filtering 2-19
processing 2-17
N
noise
adding to signal 3-12
O
operations
frame-based 2-16
statistical 2-19
optimization
code generation 5-3
options
code generation 5-10
organization of chapters 1-12
Out block
suppressing output 2-24
P
parameter reuse 5-3
Index-3
Index
parameters
changing during simulation 2-14
code generation 5-5
configuration 5-5
estimating 2-20
model 3-7
Solver 2-26
Stop Time 2-26
tuning 2-14
parametric estimation 2-20
performance
dspstartup M-file 2-24
Periodogram block 6-4
power spectrum
estimation 6-2
of speech signal 6-2
viewing 6-9
printing documentation 1-11
processing
multirate 2-17
Q
quantizers
scalar 2-19
vector 2-19
R
Random Source block 3-12
Real-Time Workshop
and loop-rolling 2-25
build directory 5-4
code generation 5-2
generating code 5-4
Index-4
reuse of
functions 5-3
parameters 5-3
S
Sample Rate Conversion demo 2-17
sample-based signals 2-11
sampling 2-10
scalar quantizers 2-19
selection of
target configurations 5-7
Selector block 6-14
setting
code generation parameters 5-5
configuration parameters 5-5
model parameters 3-7
setting up
build directory 5-4
system 1-3
signal concepts 2-10
Signal From Workspace block 6-4
signal processing model
building 3-2
signals
definition 2-10
frame-based 2-12
multichannel 2-10
sample-based 2-11
simulation
of system behavior 2-2
simulations
accelerating 2-24
size of generated code 2-26
stopping 2-26
Simulink Library Browser 2-5
Sine Wave block 3-2
Index
solver algorithms
selecting 5-5
Solver parameter 2-26
spectrogram
creating 6-12
of speech signal 6-12
viewing 6-19
speed
improving 2-24
startup M-file 2-24
Statistical Functions demo 2-19
statistical operations 2-19
Stop Time parameter 2-26
stopping a simulation 2-26
Sum block 3-12
suppressing
tout vector 2-24
system
setup 1-3
system behavior
modeling 2-2
V
variable-step solver
setting 2-26
vector quantizers 2-19
Vector Scope block 4-19
viewing
coefficients of adaptive filter 4-19
documentation 1-10
generated code 5-12
power spectrum of speech signal 6-9
spectrogram of speech signal 6-19
W
Waterfall Scope block 2-2
Web
demos 1-8
documentation 1-10
workspace
suppressing output to 2-24
Y
T
target configurations
selecting 5-7
targets
code generation 5-7
Time Scope block 3-2
time-step vector
saving to workspace 2-24
tout vector
suppressing 2-24
tunable parameters 2-14
definition 2-14
yout
suppressing 2-24
Index-5
Index
Index-6