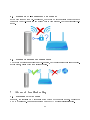
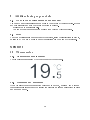
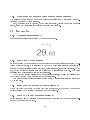
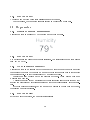
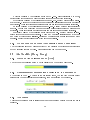
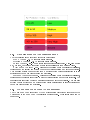
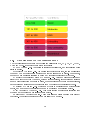
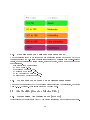
1
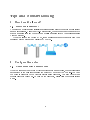
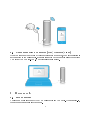
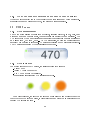
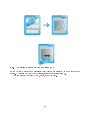
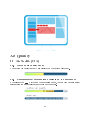
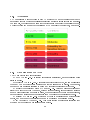
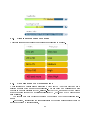
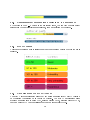
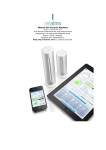
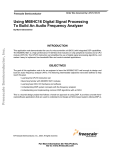
Netatmo User Manual
An interactive version of this manual is embedded in your Netatmo iPhone/iPad/Android
application. It is also available at http://my.netatmo.com on your personal account.
Netatmo Weather Station NWS01. Version 1 / May 2012
Contents
1 How does it all work?
1.1
2
How does it all work? . . . . . . . . . . . . . . . . . . . . . . . . . . . . . .
2 Conguration setup
2
2
2.1
Conguring with a smartphone
. . . . . . . . . . . . . . . . . . . . . . . .
2.2
Conguring with a computer (Mac/Windows/Linux)
. . . . . . . . . . . .
3 Power supply
2
3
3
3.1
Indoor module . . . . . . . . . . . . . . . . . . . . . . . . . . . . . . . . . .
3
3.2
Outdoor and Additional indoor module . . . . . . . . . . . . . . . . . . . .
4
4 Measurements on demand
6
4.1
Measurements on demand
. . . . . . . . . . . . . . . . . . . . . . . . . . .
6
4.2
Direct CO2 reading . . . . . . . . . . . . . . . . . . . . . . . . . . . . . . .
6
5 No outdoor data?
7
5.1
Outdoor data is not displayed?
. . . . . . . . . . . . . . . . . . . . . . . .
7
5.2
Reason 1: Batteries are low
. . . . . . . . . . . . . . . . . . . . . . . . . .
7
5.3
Reason 2: Weak radio signal . . . . . . . . . . . . . . . . . . . . . . . . . .
7
5.4
Reason 3: Too close to the indoor module
8
. . . . . . . . . . . . . . . . . .
6 No data at all?
8
6.1
Missing measurements
. . . . . . . . . . . . . . . . . . . . . . . . . . . . .
8
6.2
Reason 1: Power supply is out . . . . . . . . . . . . . . . . . . . . . . . . .
8
6.3
Reason 2: Wi-Fi signal is too weak
. . . . . . . . . . . . . . . . . . . . . .
9
6.4
Reason 3: Wi-Fi password has changed . . . . . . . . . . . . . . . . . . . .
10
6.5
Reason 4: Internet access is down . . . . . . . . . . . . . . . . . . . . . . .
10
7 Advanced troubleshooting
7.1
10
Station's MAC address . . . . . . . . . . . . . . . . . . . . . . . . . . . . .
8 Additional indoor modules
10
11
8.1
What are additional indoor modules? . . . . . . . . . . . . . . . . . . . . .
11
8.2
Setup . . . . . . . . . . . . . . . . . . . . . . . . . . . . . . . . . . . . . . .
11
8.3
Troubleshooting . . . . . . . . . . . . . . . . . . . . . . . . . . . . . . . . .
11
9 Additional rain gauge module
12
9.1
What is the additional rain gauge module? . . . . . . . . . . . . . . . . . .
12
9.2
Setup . . . . . . . . . . . . . . . . . . . . . . . . . . . . . . . . . . . . . . .
12
1
10 Thermometer
12
10.1 Temperature measurement . . . . . . . . . . . . . . . . . . . . . . . . . . .
12
10.2 Minimum and maximum . . . . . . . . . . . . . . . . . . . . . . . . . . . .
12
10.3 Feels like temperature
. . . . . . . . . . . . . . . . . . . . . . . . . . . .
13
10.4 Humidex vs. Heat index setting . . . . . . . . . . . . . . . . . . . . . . . .
13
10.5 Did you know?
13
. . . . . . . . . . . . . . . . . . . . . . . . . . . . . . . . .
10.6 Wise steps for accurate temperature measurements
. . . . . . . . . . . . .
11 Barometer
14
14
11.1 Pressure measurement
. . . . . . . . . . . . . . . . . . . . . . . . . . . . .
14
11.2 Mean Sea Level Pressure . . . . . . . . . . . . . . . . . . . . . . . . . . . .
14
11.3 How does the station know its altitude? . . . . . . . . . . . . . . . . . . . .
14
11.4 How do I set my station's altitude?
. . . . . . . . . . . . . . . . . . . . . .
14
. . . . . . . . . . . . . . . . . . . . . . . . . . . . . . . . .
15
11.5 Did you know?
12 Hygrometer
15
12.1 Relative humidity measurement
12.2 Did you know?
. . . . . . . . . . . . . . . . . . . . . . . .
15
. . . . . . . . . . . . . . . . . . . . . . . . . . . . . . . . .
15
12.3 What is relative humidity? . . . . . . . . . . . . . . . . . . . . . . . . . . .
15
12.4 Did you notice? . . . . . . . . . . . . . . . . . . . . . . . . . . . . . . . . .
15
12.5 What happens if the station is exposed to high humidity? . . . . . . . . . .
16
13 CO2 Sensor
16
13.1 CO2 measurement
. . . . . . . . . . . . . . . . . . . . . . . . . . . . . . .
16
13.2 CO2 indicator . . . . . . . . . . . . . . . . . . . . . . . . . . . . . . . . . .
16
13.3 Units . . . . . . . . . . . . . . . . . . . . . . . . . . . . . . . . . . . . . . .
17
13.4 Typical ppm values . . . . . . . . . . . . . . . . . . . . . . . . . . . . . . .
17
13.5 Consequences
17
13.6 CO2 Alerts
. . . . . . . . . . . . . . . . . . . . . . . . . . . . . . . . . .
. . . . . . . . . . . . . . . . . . . . . . . . . . . . . . . . . . .
13.7 How does the Netatmo station measure the CO2 concentration?
13.8 Calibration
17
. . . . . .
17
. . . . . . . . . . . . . . . . . . . . . . . . . . . . . . . . . . .
17
13.9 Manual CO2 calibration
. . . . . . . . . . . . . . . . . . . . . . . . . . . .
14 Sound meter
18
18
14.1 Acoustic comfort measurement . . . . . . . . . . . . . . . . . . . . . . . . .
18
14.2 How does the Netatmo station measure acoustic comfort? . . . . . . . . . .
18
14.3 Did you know?
18
. . . . . . . . . . . . . . . . . . . . . . . . . . . . . . . . .
15 Rain gauge
19
15.1 Rain fall measurement
. . . . . . . . . . . . . . . . . . . . . . . . . . . . .
19
15.2 Displayed measures . . . . . . . . . . . . . . . . . . . . . . . . . . . . . . .
19
15.3 Setup and precaution . . . . . . . . . . . . . . . . . . . . . . . . . . . . . .
19
15.4 Calibration
19
. . . . . . . . . . . . . . . . . . . . . . . . . . . . . . . . . . .
2
16 Current weather conditions
19
16.1 Current weather icon . . . . . . . . . . . . . . . . . . . . . . . . . . . . . .
17 7-day forecast
17.1 Forecast
19
20
. . . . . . . . . . . . . . . . . . . . . . . . . . . . . . . . . . . . .
20
17.2 Summary mode . . . . . . . . . . . . . . . . . . . . . . . . . . . . . . . . .
20
17.3 Temperature mode
. . . . . . . . . . . . . . . . . . . . . . . . . . . . . . .
21
17.4 Rain mode . . . . . . . . . . . . . . . . . . . . . . . . . . . . . . . . . . . .
21
18 Indoor comfort
22
18.1 Indoor comfort index . . . . . . . . . . . . . . . . . . . . . . . . . . . . . .
22
18.2 Complementary information available on the mobile app
. . . . . . . . . .
22
18.3 Indoor comfort index . . . . . . . . . . . . . . . . . . . . . . . . . . . . . .
22
19 Notications
23
19.1 What are notications? . . . . . . . . . . . . . . . . . . . . . . . . . . . . .
23
19.2 Personalized notications . . . . . . . . . . . . . . . . . . . . . . . . . . . .
23
19.3 CO2 notications (default) . . . . . . . . . . . . . . . . . . . . . . . . . . .
23
19.4 Freezing notication (default)
23
. . . . . . . . . . . . . . . . . . . . . . . . .
19.5 Pressure drop notication (default)
. . . . . . . . . . . . . . . . . . . . . .
23
19.6 Room temperature notications (default) . . . . . . . . . . . . . . . . . . .
23
19.7 Humidity notication (default)
. . . . . . . . . . . . . . . . . . . . . . . .
24
19.8 NOAA Weather Alerts (US) . . . . . . . . . . . . . . . . . . . . . . . . . .
24
19.9 MeteoAlarm Weather Alerts (Europe) . . . . . . . . . . . . . . . . . . . . .
24
20 Highlights
24
20.1 What are highlights? . . . . . . . . . . . . . . . . . . . . . . . . . . . . . .
24
20.2 Example
24
. . . . . . . . . . . . . . . . . . . . . . . . . . . . . . . . . . . .
21 Graphs
24
21.1 Automated recording . . . . . . . . . . . . . . . . . . . . . . . . . . . . . .
24
21.2 Navigating from dashboard to graphs on a smartphone
. . . . . . . . . . .
25
. . . . . . . . . . . . . .
25
. . . . . . . . . . . . . . . . . . . . . .
26
21.3 Navigating from dashboard to graphs on a tablet
21.4 Showing graphs in the browser app
22 Air Quality (USA)
22.1 Outdoor air quality index
27
. . . . . . . . . . . . . . . . . . . . . . . . . . .
22.2 Complementary information available on the mobile app
27
. . . . . . . . . .
27
22.3 AQI colors . . . . . . . . . . . . . . . . . . . . . . . . . . . . . . . . . . . .
28
22.4 Understanding the AQI . . . . . . . . . . . . . . . . . . . . . . . . . . . . .
28
22.5 Where does the outdoor air quality index come from? . . . . . . . . . . . .
29
3
23 Air Quality (Canada)
29
23.1 Outdoor: Air Quality Health Index
. . . . . . . . . . . . . . . . . . . . . .
29
23.2 AQHI colors . . . . . . . . . . . . . . . . . . . . . . . . . . . . . . . . . . .
29
23.3 Understanding the AQHI . . . . . . . . . . . . . . . . . . . . . . . . . . . .
29
23.4 Where does the AQHI come from?
30
. . . . . . . . . . . . . . . . . . . . . .
24 Air Quality (Europe - Citeair)
30
24.1 Outdoor air quality: pollution index . . . . . . . . . . . . . . . . . . . . . .
30
24.2 Complementary information available on the mobile app
30
. . . . . . . . . .
24.3 Citeair indices color code scale . . . . . . . . . . . . . . . . . . . . . . . . .
31
24.4 Understanding the Citeair indices . . . . . . . . . . . . . . . . . . . . . . .
31
24.5 Source and Acknowledgement
32
. . . . . . . . . . . . . . . . . . . . . . . . .
25 Air Quality (Europe - Citeair/MACC)
32
25.1 Outdoor air quality: pollution index . . . . . . . . . . . . . . . . . . . . . .
32
25.2 Complementary information available on the mobile app
. . . . . . . . . .
32
. . . . . . . . . . . . . . . . . . . . . . . . . . . .
32
25.4 Understanding the Citeair index . . . . . . . . . . . . . . . . . . . . . . . .
33
25.5 Source and Acknowledgement
33
25.3 CiteAir index color code
. . . . . . . . . . . . . . . . . . . . . . . . .
26 Air quality (Australia)
34
26.1 Outdoor air quality index
. . . . . . . . . . . . . . . . . . . . . . . . . . .
26.2 Complementary information available on the mobile app
26.3 Australian AQI Colors
34
. . . . . . . . . .
34
. . . . . . . . . . . . . . . . . . . . . . . . . . . . .
34
26.4 Understanding the Australian AQI
. . . . . . . . . . . . . . . . . . . . . .
26.5 Where does the Australian AQI come from?
. . . . . . . . . . . . . . . . .
27 Air Quality (China US embassy)
27.1 Outdoor air quality index
35
35
35
. . . . . . . . . . . . . . . . . . . . . . . . . . .
27.2 Complementary information available on the mobile app
35
. . . . . . . . . .
36
27.3 AQI colors . . . . . . . . . . . . . . . . . . . . . . . . . . . . . . . . . . . .
36
27.4 Understanding the AQI . . . . . . . . . . . . . . . . . . . . . . . . . . . . .
37
27.5 Where does the outdoor AQI come from? . . . . . . . . . . . . . . . . . . .
37
28 Air Quality (China)
37
28.1 Outdoor Air Pollution Index . . . . . . . . . . . . . . . . . . . . . . . . . .
37
28.2 Complementary information available on the mobile app
. . . . . . . . . .
37
28.3 Air pollution colors . . . . . . . . . . . . . . . . . . . . . . . . . . . . . . .
38
28.4 Understanding the Air Pollution Index
. . . . . . . . . . . . . . . . . . . .
28.5 Where does the outdoor Air Pollution Index come from?
4
. . . . . . . . . .
38
39
29 Air Quality (Hong Kong)
39
29.1 Outdoor Air Pollution Index (API)
. . . . . . . . . . . . . . . . . . . . . .
29.2 Complementary information available on the mobile app
39
. . . . . . . . . .
39
29.3 API colors . . . . . . . . . . . . . . . . . . . . . . . . . . . . . . . . . . . .
39
29.4 Understanding the Air Pollution Index
. . . . . . . . . . . . . . . . . . . .
40
29.5 Where does the outdoor API come from? . . . . . . . . . . . . . . . . . . .
40
30 Air Quality (Japan)
41
30.1 Outdoor Air Pollution Index (AQI) . . . . . . . . . . . . . . . . . . . . . .
41
30.2 Complementary information available on the mobile app
. . . . . . . . . .
41
30.3 AQI colors . . . . . . . . . . . . . . . . . . . . . . . . . . . . . . . . . . . .
41
30.4 Understanding the Air Pollution Index
. . . . . . . . . . . . . . . . . . . .
30.5 Where does the outdoor AQI in Japan come from?
. . . . . . . . . . . . .
31 Air Quality (Taiwan)
43
31.1 Outdoor Pollutant Standards Index (PSI)
. . . . . . . . . . . . . . . . . .
31.2 Complementary information available on the mobile app
31.3 PSI colors
42
43
43
. . . . . . . . . .
43
. . . . . . . . . . . . . . . . . . . . . . . . . . . . . . . . . . . .
43
31.4 Understanding the Pollutant Standards Index
. . . . . . . . . . . . . . . .
31.5 Where does the outdoor PSI in Taiwan come from?
. . . . . . . . . . . . .
32 Air Quality (Greater Mexico City)
44
44
44
32.1 Metropolitan Air Quality Index (IMECA)
. . . . . . . . . . . . . . . . . .
32.2 Complementary information available on the mobile app
44
. . . . . . . . . .
45
32.3 IMECA colors . . . . . . . . . . . . . . . . . . . . . . . . . . . . . . . . . .
45
32.4 Understanding the IMECA index
. . . . . . . . . . . . . . . . . . . . . . .
45
32.5 Where does the IMECA in Mexico come from? . . . . . . . . . . . . . . . .
46
5
Tips and troubleshooting
1 How does it all work?
1.1
How does it all work?
The outdoor module (small) wirelessly sends its measurements to the indoor module (large)
using a radio signal. Using your Wi-Fi access point, the indoor module then sends both
its own measurements and the outdoor module's measurements to your personal online
Netatmo account.
When you launch the Netatmo App, those measurements are downloaded from your
personal Netatmo account and displayed by the App.
2 Conguration setup
2.1
Conguring with a smartphone
When you congure your Netatmo Weather Station with a smartphone, the weather station
is connected to the wall adapter using the provided USB cable (USB to micro-USB) and
the phone is connected to the Weather Station using bluetooth. You need to have your
phone's bluetooth turned on. To turn on the bluetooth, please visit the phone's setting
menu.
6
2.2
Conguring with a computer (Mac/Windows/Linux)
When you congure your Netatmo Weather Station with a computer, the weather station is
not connected to the wall adapter. It is only connected to the computer using the provided
USB cable (USB to micro-USB). No additional cable is needed.
3 Power supply
3.1
Indoor module
The indoor module is powered by the USB wall adapter and USB cable. When plugged-in,
the indoor module should light up green.
7
3.2
Outdoor and Additional indoor module
The outdoor module and additional indoor module are powered by AAA Alkaline batteries.
Upon introducing the batteries, the light of the module should light up green.
8
9
4 Measurements on demand
4.1
Measurements on demand
Touching the top button of the indoor module instantly triggers the measurement process.
Updated data is then sent directly to your devices.
4.2
Direct CO2 reading
When measuring on demand, the indoor module displays the CO2 level using the following
color code:
- Green = Good
- Yellow = Could be improved
- Red = Room should be ventilated.
10
5 No outdoor data?
5.1
Outdoor data is not displayed?
If your outdoor module's data is not displayed on the Netatmo dashboard, although indoor
measurements are still visible, the link between the two modules might not be working.
This may occur due to one of the following reasons:
5.2
Reason 1: Batteries are low
Check the outdoor module's batteries.
When inserting batteries, the outdoor module
should ash green. If you are unsure whether your batteries still work, replace them.
5.3
Reason 2: Weak radio signal
If the outdoor module is located too far away from the indoor module, or if both modules
are separated by solid obstacles like concrete walls, data might not be transmitted correctly.
In that case, make sure to move the two modules closer to eachother.
11
5.4
Reason 3: Too close to the indoor module
If the outdoor module is too close to the indoor module (a few centimeters/inches) it may
not operate properly.
6 No data at all?
6.1
Missing measurements
The Netatmo App dashboard is not displaying any measurements? This may be due to
one of the following reasons:
6.2
Reason 1: Power supply is out
The indoor module may not be connected to the power source. Unplug the wall-adapter
and plug it back in: the indoor module should light up green.
12
6.3
Reason 2: Wi-Fi signal is too weak
If the indoor module is located too far away from your Wi-Fi router, or separated by solid
obstacles such as concrete walls, the station might not be able to transmit data correctly.
In that case, make sure to bring the indoor module closer to your Wi-Fi router or access
point.
13
6.4
Reason 3: Wi-Fi password has changed
If you have changed your Wi-Fi password, the Netatmo weather station won't be able to
connect to your Wi-Fi network and upload data to your account. Fix your Station's Wi-Fi
setup.
6.5
Reason 4: Internet access is down
The Netatmo Station can access your Wi-Fi router, but your internet access is not working.
If this occurs, please check your internet access.
7 Advanced troubleshooting
7.1
Station's MAC address
If needed, the station's MAC address is at the bottom of the indoor module. Replace the
g by 70:ee:50 . For example g002460 has the MAC address 70:ee:50:00:24:60.
14
You can also read it directly from your stations' setting menu.
8 Additional indoor modules
8.1
What are additional indoor modules?
You can add indoor modules to your Netatmo Weather Station. They don't work separatly
and need the Netatmo Station to operate.
They measure temperature, humidity and CO2, and allow you to monitor one more
room in your house.
You can add up to 3 additional indoor modules to your Netatmo Weather Station.
8.2
Setup
To add an additional indoor module to the station, follow the instructions on its box, or
click on Add a new module to one of your stations in the menu My stations .
8.3
Troubleshooting
If the additional indoor module is too close to the indoor module (a few centimeters/inches)
it may not operate properly.
15
9 Additional rain gauge module
9.1
What is the additional rain gauge module?
You can add an additional rain gauge module to your Netatmo Weather Station. It does
not work separatly and need the Netatmo Station to operate.
It allows you to monitor rain fall.
You can add only one rain gauge module to your Netatmo Weather Station.
9.2
Setup
To add an additional rain gauge module to the station, follow the instructions on its box,
or click on Add a new module to one of your stations in the menu My stations .
Sensors
10 Thermometer
10.1
Temperature measurement
The temperature is measured by both indoor and outdoor modules.
10.2
Minimum and maximum
When you slide the indoor panel of the dashboard up or down, minimum and maximum
temperatures will appear below the current temperature : minimum is indicated in green
and maximum in red.
16
Minimum and maximum temperatures are the highest and lowest temperatures measured during 24 hours, from midnight to midnight.
10.3
Feels like temperature
Your Netatmo Dashboard displays a feels like temperature.
This is computed data, obtained by adding the combined eect of moisture and wind
over human perception of heat and cold.
To achieve reliable data, the station uses a combination of two usual formulae: windchill which represents the eect of wind on cold temperatures and Humidex/Heat Index
which represents the eect of moisture on high temperatures.
10.4
Humidex vs. Heat index setting
The formula used to represent the eect of moisture on high feels like temperature is
either Humidex or Heat index, depending on your geographical region. Default settings use
Heat index in the United States, and Humidex in Canada and Europe. You can manually
change the formula used in the the unit-setting menu.
10.5
Did you know?
◦
◦
◦
◦
The indoor comfort temperature ranges from 20 C to 24 C (68 F to 75.2 F) in Winter
◦
◦
◦
◦
time, and 23 C to 26 C (73.4 F to 78.8 F) in Summer time.
Comfort temperature depends on the humidity level: the dryer the air, the higher the
comfort temperature.
17
10.6
Wise steps for accurate temperature measurements
You will improve the accuracy of your temperature measurements by protecting your modules from exposure to direct sunlight.
Also, measurements on demand, when used frequently, trigger the indoor module's
lights, which may articially increase the measured temperature.
11 Barometer
11.1
Pressure measurement
Mean sea level pressure is measured by the indoor module.
11.2
Mean Sea Level Pressure
In order to allow the comparison between dierent barometric pressures measured by different weather stations, it is necessary to match the barometric pressure measurements
recorded at dierent altitudes: sea elevation, valley elevation, mountain elevation. To do
so, the raw pressure measurements are adjusted by a standardized formula.
The value
resulting from this is called mean sea level pressure.
Your Netatmo station displays the mean sea level pressure, meaning the pressure that
the Netatmo station would measure if it were at sea level.
The mean sea level pressure is also the value given by weather forecasts and reports on
TV or the Web.
11.3
How does the station know its altitude?
When you setup the Netatmo Station with your smartphone, the Netatmo App uses the
smartphone's GPS to localize your station and your altitude.
11.4
How do I set my station's altitude?
In the settings menu/my stations/your station's name/location you can set the exact altitude of your station on the map.
18
11.5
Did you know?
The indoor and outdoor barometric pressure is always the same.
For that reason, the barometer sensor is located in the indoor module only.
12 Hygrometer
12.1
Relative humidity measurement
Relative humidity is measured by both indoor and outdoor modules.
12.2
Did you know?
Dry environments can cause throat or nose irritation. Comfortable indoor humidity ranges
from 30% up to 70%.
12.3
What is relative humidity?
Relative humidity is a measurement of the amount of water vapor in the air (at a specic
temperature) compared to the maximum amount of water vapor air can hold at that specic
temperature level. Humidity is represented by a percentage value.
Relative humidity depends on the temperature of the air.
Warm air can hold more
moisture than cold air.
A relative humidity of 100% indicates that the air is holding all the water it can at that
specic temperature; any additional moisture at that point will transform into condensation.
If the temperature decreases, but the amount of moisture in the air does not change,
the relative humidity increases.
12.4
Did you notice?
If you blow into the station, the humidity level raises!
19
12.5
What happens if the station is exposed to high humidity?
When the weather is very humid (due to rain) the humidity sensor may become saturated.
It usually takes a few hours for it to dry, and return to its normal state.
13 CO2 Sensor
13.1
CO2 measurement
Due to the accumulation of gases from adhesives, cleaning products, smoke, dust, dust
mites and mold in a conned space, your indoor air can rapidly become unhealthy. The
CO2 is produced by human activities and can rapidly concentrate in conned spaces such
as a living room, bed room, oce...
As CO2 level rises, so does the concentration of
unhealthy components of indoor air. CO2 level is therefore a good air quality indicator.
The CO2 level is measured by the station's indoor module.
13.2
CO2 indicator
For a quick reading of the CO2 level, the following color code is used:
- Green = good
- Yellow = Could be improved
- Red = Room should be ventilated.
This indicator is represented by a colorful gas bubble.
For a direct reading, the light on the indoor module uses the same color code: if you
touch the top of the indoor module, it briey lights up and gives you an indication of the
current CO2 level in the room.
20
13.3
Units
CO2 is measured in ppm (parts per million), meaning the number of CO2 molecules among
one million air molecules. Usual indoor CO2 levels vary between 400 and 5000 ppm.
13.4
Typical ppm values
- Outdoor, CO2 level is always around 400 ppm.
- In an appropriately ventilated room, the CO2 level should remain below 1000 ppm
for the upmost comfort.
- In a closed room such as a meeting room with several people or a small bedroom at
night, CO2 can easily go past 1000 ppm.
13.5
Consequences
CO2 is not dangerous when kept within such values. Nevertheless, when it rises over 1000
ppm, it is an indication that indoor air has not been renewed for a long time.
If this
happens, ventilating the room is a simple and eective action.
Over 2000 ppm CO2 can also cause sleepiness and slight headaches.
13.6
CO2 Alerts
When the CO2 level rises above 1000 ppm, a notication is sent to your smartphone and
the indoor module briey lights up yellow.
When the CO2 level goes above 2000 ppm, a second alert is sent to your smartphone
and the indoor module briey lights up red.
13.7
How does the Netatmo station measure the CO2 concentration?
The sensor measures CO2 using an optical process: the Station is embedded with a light
bulb and an infrared receiver. Light is emitted from the bulb and partially absorbed by
the CO2 contained in the ambient air.
The higher the CO2 level, the more the light is
absorbed. The infrared receiver then measures the amount of light received and from there
it deducts the CO2 level. This method works regardless of the ambient light.
13.8
Calibration
To ensure the accuracy of your CO2 measurements, the Netatmo Weather Station automatically and regularly recalibrates its CO2 sensor. This calibration is performed assuming
that the CO2 level surrounding the station lowers to 400 ppm at least once a week. To
achieve a precise calibration, make sure to ventilate the room for a period of time long
enough to entirely renew the air.
21
13.9
Manual CO2 calibration
If the Netatmo station fells on the ground or goes under similar shocks, it may be necessary
to perform a manual calibration of the CO2 sensor.
For this purpose please visit the CO2 Calibration tab of your station, from the menu
My stations . Once the manual CO2 calibration started, please don't unplug the station
for at least 6 hours, to let it calibrate.
If the station did not go under excessive shock manual CO2 calibration should not be
needed.
14 Sound meter
14.1
Acoustic comfort measurement
Acoustic comfort is measured by the indoor module.
You can view data and measurements directly on the Netatmo App dashboard.
14.2
How does the Netatmo station measure acoustic comfort?
The Netatmo weather station evaluates the surrounding acoustic comfort by measuring
the average noise level (in dB) over a 5-minute interval.
14.3
Did you know?
- The usual human ear cannot distinguish sounds below 30 dB.
- A prolongated exposure to sound levels over 65 dB noticeably disminishes your ability
to concentrate.
- In many countries, continuous exposure to noise during a workday is limited to an 85
dB level.
- Sounds over 95 dB can put your hearing at risk.
22
15 Rain gauge
15.1
Rain fall measurement
Rainfall is measured with a tipping buckets rain gauge. Water makes the buckets tip, and
the number of tips is counted through a magnet placed on the buckets.
15.2
Displayed measures
Your dashboard displays:
- Rainfall in mm/h or inches/h measured over the last hour.
- Cumulative rainfall during the day (measured from midnight to midnight).
A reminder of the forecasted rainfall value for the day (forecasted from midnight to
midnight), which let you compare and estimate remaining rainfall for today.
15.3
Setup and precaution
The rain gauge shoudl be place horizontally, if possible between 0,5 and 1,5 m (2 and 5
feet) high and 3 m (10 feet) away from surrounding obstacles.
To x the rain gauge, you may use a 1/4 inches standard camera mounting screw, or
the two holes pierced in the rain gauge plastic base.
The rain gauge cannot measure snowfall and it is recommended not to let it outside by
very low temperatures.
15.4
Calibration
If you wish to recalibrate your rain gauge, please visit the calibration section of your
weather station settings menu.
Other functions
16 Current weather conditions
16.1
Current weather icon
The current weather condition is estimated, using the most up-to-date information available
at your station's precise location.
23
17 7-day forecast
17.1
Forecast
The Netatmo App oers a complete 7-day detailed weather forecast. It is localized according to your Netatmo Weather Station location and transmitted from our servers through
the Internet and to your Netatmo App.
This weather forecast data is provided by Me-
teoGroup.
17.2
Summary mode
The Summary mode gives you: minimum and maximum temperatures of the day, wind
gust speed, amount of rain and sunlight duration.
24
17.3
Temperature mode
The Temperature mode gives you: the temperature during the day (in blue) the maximum
temperature (in red) and the minimum temperature (in green).
17.4
Rain mode
The Rain mode gives you: the amount of rain per 3 hour period (represented by blue bars)
and the probability of rain (represented by a red curve).
25
18 Indoor comfort
18.1
Indoor comfort index
The indoor comfort index is displayed in the indoor dashboard
18.2
Complementary information available on the mobile app
By touching the icon button on the indoor comfort gauge, you can view the main discomfort
factor (temperature, humidity, CO2 or noise).
18.3
Indoor comfort index
Your indoor comfort is computed from indoor temperature, humidity, CO2 and acoustic
comfort.
When the CO2 is high, the temperature too cold or too hot, the room too dry, or too
noisy, your indoor comfort index deteriorates.
26
19 Notications
19.1
What are notications?
Notications are computed by your Netatmo Weather Station and sent to your smartphone.
They are implemented to help you improve your environment with basic daily steps.
Those notications are stored in your Netatmo embedded events timeline.
19.2
Personalized notications
Your Netatmo stations is set up with the following default notications: CO2, temperature,
pressure and humidity. You can nd details about each notication below, and you can
activate and deactivate each notication from the personalized notications menu of your
station.
In addition to those default notications, you can create personalized notications by
choosing a module (indoor/outdoor), a measurement type (high CO2, low temperature...)
and a threshold.
19.3
CO2 notications (default)
When the CO2 level rises above 1000 ppm, this notication indicates the potential benets
of ventilating the room.
Similarly, above 2000 ppm, this notication warns you that you should open the window
to refresh your living environment.
19.4
Freezing notication (default)
◦
◦
When the outdoor temperature reaches 3 C (37 F), this notication warns you of freezing
conditions.
19.5
Pressure drop notication (default)
When the pressure drops by more than 2 mbar (0.06 inHg) in the last hour, this notication
warns you that weather has deteriorated.
19.6
Room temperature notications (default)
◦
◦
When the indoor temperature drops below 10 C (50 F) this notication warns you of
potential heating system failure.
◦
◦
Similarly, when the indoor temperature drops below 3 C (37 F), this notication warns
you of freezing conditions indoors.
27
19.7
Humidity notication (default)
When the humidity rises by 20% within a short time, you are notied.
19.8
NOAA Weather Alerts (US)
Weather alerts from the National Weather Service are sent as notications to your Netatmo
app. They are selected according to your station's location.
Typical message will look like Dense Fog Advisory issued February 01 at 4:18AM
AKST until February 01 at 12:00PM AKST by NWS .
More information about those alerts and sources can be found on the National Weather
Service Website.
19.9
MeteoAlarm Weather Alerts (Europe)
Weather alerts in Europe are provided thanks to the MeteoAlarm service.
Typical message looks like Fog alert (meteoalarm). Station's name: reduced visibility
(Level 1/3) This service is provided by Eumetnet, the Network of European Meteorological Services.
More information can be found on the MeteoAlarm Website.
20 Highlights
20.1
What are highlights?
Highlights are personalized analyses based on one week worth of measurement data: every
week-end, 1 or 2 remarkable facts are highlighted from your station's raw data.
Highlights are displayed in the event timeline of the Netatmo App.
20.2
Example
Your Netatmo station can detect temperature degradation over several weeks, CO2 peaks,
and large pressure variations.
21 Graphs
21.1
Automated recording
Your Netatmo station is automatically and constantly recording measurements.
Those
measurements are accessible as graphs that you can easily access in your Netatmo app.
28
21.2
Navigating from dashboard to graphs on a smartphone
You can access to graphs by tilting your smartphone into landscape mode.
You can zoom in and out by pinching the graphs in and out.
21.3
Navigating from dashboard to graphs on a tablet
You can access to graphs by tapping the graph button on the upper right corner.
You can zoom in and out by pinching the graphs in and out.
29
21.4
Showing graphs in the browser app
In the Netatmo browser app (available here) graphs are displayed in the middle of the
screen. To display a given type of measure, select it in the left column.
You can display the graph by day, week, month or year.
30
Air Quality
22 Air Quality (USA)
22.1
Outdoor air quality index
The outdoor Air Quality Index AQI is displayed on the outdoor dashboard.
22.2
Complementary information available on the mobile app
By pressing the . . .
button on the air quality gauge, you can view complementary
information: the main pollutant and the time of the report.
31
22.3
AQI colors
EPA has assigned a specic color to each AQI category to make it easier for anyone to
understand quickly whether air pollution is reaching unhealthy levels in their communities.
For example, the color orange means that conditions are unhealthy for sensitive groups,
while the color red means that conditions may be unhealthy for everyone, and so on.
22.4
Understanding the AQI
The AQI is divided into six categories:
Good AQI is 0 - 50. Air quality is considered satisfactory, and air pollution poses
little or no risk.
Moderate AQI is 51 - 100. Air quality is acceptable; however, for some pollutants
there may be a moderate health concern for a very small number of people. For example,
people who are unusually sensitive to ozone may experience respiratory symptoms.
Unhealthy for Sensitive Groups AQI is 101 - 150. Although general public is not
likely to be aected at this AQI range, people with lung disease, older adults and children
are at a greater risk from exposure to ozone, whereas persons with heart and lung disease,
older adults and children are at greater risk from the presence of particles in the air.
Unhealthy AQI is 151 - 200. Everyone may begin to experience some adverse health
eects, and members of the sensitive groups may experience more serious eects.
Very Unhealthy AQI is 201 - 300. This would trigger a health alert signifying that
everyone may experience more serious health eects.
32
Hazardous AQI higher than 300. This would trigger a health warning of emergency
condition. The entire population is then more likely to be aected.
22.5
Where does the outdoor air quality index come from?
The outdoor air quality index (AQI) in the United States is provided by the U.S. Environmental Protection Agency (EPA) as part of the AIRNow program. A list of sources and
AIRNow partners can be found here.
23 Air Quality (Canada)
23.1
Outdoor: Air Quality Health Index
The outdoor Air Quality Health Index (AQHI) is displayed on the outdoor dashboard.
This index is not available outside the 74 largest Canadian cities.
23.2
AQHI colors
This color code scale makes it easier to understand air pollution at a glance.
23.3
Understanding the AQHI
The AQHI is divided into four categories:
Low AQHI is 1 - 3.
At Risk Population:
Enjoy your usual outdoor activities.
General Population: Ideal air quality for outdoor activities.
33
Moderate AQHI is 4 - 6. At Risk Population: Consider reducing or rescheduling
strenuous activities outdoors if you are experiencing symptoms. General Population: No
need to modify your usual outdoor activities unless you experience symptoms such as
coughing and throat irritation.
High AQHI is 7 - 10. At Risk Population: Reduce or reschedule strenuous activities
outdoors. Children and the elderly should also take it easy. General Population: Consider
reducing or rescheduling strenuous activities outdoors if you experience symptoms such as
coughing and throat irritation.
Very high AQHI higher than 10. At Risk Population: Avoid strenuous activities
outdoors. Children and the elderly should also avoid outdoor physical exertion. General
Population: Reduce or reschedule strenuous activities outdoors, especially if you experience
symptoms such as coughing and throat irritation.
For more information about At Risk Population , please follow this link
23.4
Where does the AQHI come from?
The Air Quality Health Index (AQHI) is a new public information tool that helps Canadians protect their health on a daily basis from the negative eects of air pollution. This tool
has been developed by Health Canada and Environment Canada, in collaboration with the
provinces and key health and environment stakeholders.
The use Licence can be found here.
24 Air Quality (Europe - Citeair)
24.1
Outdoor air quality: pollution index
The European Citeair indices for air pollution (Common information to European Air)
are displayed on the outdoor dashboard. They are computed by Citeair using real-time
pollutant monitoring. This monitoring is provided by partner air quality surveillance organisms.
24.2
Complementary information available on the mobile app
By touching on the icon button on the air quality gauge, you may switch between background air pollution index, trac air pollution index and complementary information about
the main pollutant.
34
24.3
Citeair indices color code scale
This color scale makes it easier to understand air pollution at a glance.
24.4
Understanding the Citeair indices
Those indices have 5 levels using a scale from 0 (very low) to >100 (very high) and are a
relative measure of the amount of air pollution. They are based on 3 pollutants of major
concern in Europe: particles (PM10), nitrogen-dioxyde (NO2), and ozone (O3) and will be
able to take into account to 3 additional pollutants (CO, PM2.5 and SO2) where data are
also available.
Two indices have been developed to inform the public on two types of pollution exposure:
- Background, representing the general situation of the given agglomeration (based on
urban background monitoring sites),
35
- Roadside, being representative of city streets with a lot of trac, (based on roadside
monitoring stations).
24.5
Source and Acknowledgement
These indices have been developed under the framework of the Citeair project (Common
information to European air) and co-funded by the INTERREG IIIC and INTERREG
IVC programs. Those indices are computed based on data provided by partner air quality
surveillance organisms and are available on the website here.
25 Air Quality (Europe - Citeair/MACC)
25.1
Outdoor air quality: pollution index
The European Citeair index for air pollution (Common information to European Air) is
displayed on the outdoor dashboard. It is computed from forecast results provided by the
European pollution model MACC.
25.2
Complementary information available on the mobile app
By touching on the icon button in the air quality gauge, you can view complementary
information about the main pollutant.
25.3
CiteAir index color code
This color code scale makes it easier to understand air pollution at a glance.
36
25.4
Understanding the Citeair index
This index has 5 levels using a scale from 0 (very low) to >100 (very high), it is a relative
estimation of the amount of air pollution. It is based on 5 pollutants of major concern in
Europe: particles (PM10), nitrogen dioxyde (NO2), ozone (O3), carbon monoxyde (CO)
and sulfur dioxyde (SO2).
This index is a background estimated index representing the overall pollution level.
25.5
Source and Acknowledgement
Those indices have been developed under the framework of the Citeair project (Common
information to European air) and co-funded by the INTERREG IIIC and INTERREG
IVC programs: Air Quality Now
The computation method for those indices, provided by Citeair, has been applied to
forecast results provided by the European pollution model MACC-II.
The MACC-II (Monitoring Atmospheric Composition and Climate - Interim Implementation) is the current pre-operational atmospheric service of the European GMES programme.
MACC-II is a Collaborative Project (2011-2014) funded by the European Union under
the 7th Framework Program. It is coordinated by the European Centre for Medium-Range
Weather Forecasts and operated by a 36-member consortium.
The GEMS project (Global and regional Earth-system Monitoring using Satellite and
in-situ data) is funded by the European Commission within the 6th Framework Program
for Research and Development under the contract SIP4_CT-2004-516099
37
26 Air quality (Australia)
26.1
Outdoor air quality index
The outdoor Australian Air Quality index AQI is displayed on the outdoor dashboard.
This index is available through air quality monitoring stations in New South Wales,
South Australia, Queensland and Victoria.
26.2
Complementary information available on the mobile app
By touching on the ... button in the air quality gauge, you can view complementary
information such as the main pollutant.
26.3
Australian AQI Colors
This color code scale makes it easier to understand air quality at a glance.
38
26.4
Understanding the Australian AQI
The Australian AQI is divided into six categories:
Very good AQI is 0 - 33.
Good AQI is 34 - 66.
Fair AQI is 67 - 99.
Poor AQI is 100 - 149.
Very poor AQI is 150 - 199.
Hazardous AQI higher than 200.
Details about AQI calculation are provided by the ocial authorities for Queensland.
26.5
Where does the Australian AQI come from?
The Australian air quality index is provided in New South Wales by the Department of
Environment and Heritage Protection QLD.
27 Air Quality (China US embassy)
27.1
Outdoor air quality index
The outdoor Air Quality Index AQI is displayed on the outdoor dashboard.
39
This index is made available by the US embassy's air quality monitoring stations.
27.2
Complementary information available on the mobile app
By touching on the ... button in the air quality gauge, you can view complementary
information (when available): main pollutant, hour and location of the report.
27.3
AQI colors
This color code scale makes it easier for anyone to understand quickly whether air pollution
is reaching unhealthy levels in their communities. For example, the color orange means
that conditions are unhealthy for sensitive groups, while the color red means that
conditions may be unhealthy for everyone, and so on.
40
27.4
Understanding the AQI
The AQI is divided into six categories:
Good AQI is 0 - 50. Air quality is considered satisfactory, and air pollution poses
little or no risk.
Moderate AQI is 51 - 100. Air quality is acceptable; however, for some pollutants
there may be a moderate health concern for a very small number of people. For example,
people who are unusually sensitive to ozone may experience respiratory symptoms.
Unhealthy for Sensitive Groups AQI is 101 - 150. Although general public is not
likely to be aected at this AQI range, people with lung disease, older adults and children
are at a greater risk from exposure to ozone, whereas persons with heart and lung disease,
older adults and children are at greater risk from the presence of particles in the air.
Unhealthy AQI is 151 - 200. Everyone may begin to experience some adverse health
eects, and members of the sensitive groups may experience more serious eects.
Very Unhealthy AQI is 201 - 300. This would trigger a health alert signifying that
everyone may experience more serious health eects.
Hazardous AQI higher than 300. This would trigger a health warning of emergency
condition. The entire population is then more likely to be aected.
27.5
Where does the outdoor AQI come from?
The AQI in China is provided by the United States Embassy in Beijing, the US Consulate
in Guangzhou and the US Consulate in Shanghai. More information can be found here for
Guangzhou.
28 Air Quality (China)
28.1
Outdoor Air Pollution Index
The Outdoor Air Pollution Index is displayed on the outdoor dashboard.
28.2
Complementary information available on the mobile app
By touching on the ... button in the air quality gauge, you can view complementary
information (when available): main pollutant, hour and location of the report.
41
28.3
Air pollution colors
This color code scale makes it easier for anyone to understand quickly whether the air is
polluted.
28.4
Understanding the Air Pollution Index
The Air Pollution Index is divided into seven categories:
Excellent Air Pollution Index is 0 - 50. No health implications.
Good Air Pollution Index is 51 - 100. No health implications.
Slightly Polluted Air Pollution Index is 101 - 150.
Slight iritations may occur,
individuals with breathing or heart problems should reduce outdoor activities.
42
Lightly Polluted Air Pollution Index is 151 - 200.
Slight iritations may occur,
individuals with breathing or heart problems should reduce outdoor activities.
Moderately Polluted Air Pollution Index is 201 - 250. Healthy people will be noticeably aected. People with breathing or heart problems will experience reduced endurance
in activities. These individuals and elders should remain indoors and restrict activities.
Heavily Polluted Air Pollution Index is 251 - 300. Healthy people will be noticeably
aected. People with breathing or heart problems will experience reduced endurance in
activities. These individuals and elders should remain indoors and restrict activities.
Severely Polluted Air Pollution Index higher than 300. Healthy people will experience reduced endurance in activities.
There may be strong irritations and symptoms
and this may trigger other illnesses. Elders and the sick should remain indoors and avoid
exercise. Healthy individuals should avoid outdoor activities.
28.5
Where does the outdoor Air Pollution Index come from?
The Air Pollution Index in China is provided by the Ministry of Environmental Protection
of the People's Republic of China. More information can be found here.
29 Air Quality (Hong Kong)
29.1
Outdoor Air Pollution Index (API)
The Outdoor Air Pollution Index (API) is displayed on the outdoor dashboard.
29.2
Complementary information available on the mobile app
By touching on the ... button in the air quality gauge, you can view complementary
information (when available): main pollutant, hour and location of the report.
29.3
API colors
This color code scale makes it easier for anyone to understand quickly whether the air is
polluted.
43
29.4
Understanding the Air Pollution Index
The Air Pollution Index is divided into seven categories:
Low API is 0 - 25. No response action required.
Medium API is 26 - 50. No response action required.
High API is 51 - 100. No immediate response action is suggested. Long-term eects
may, however, be observed if exposed at such level persistently for months or years.
Very High API is 101 - 200.
Persons with existing heart or respiratory illnesses,
childrens and the elderly are advised to reduce physical exertion and outdoor activities.
They are also advised to seek advice from a medical doctor before participating in sport
activities and take more breaks during the activities.
Severe API higher than 200. Persons with existing heart or respiratory illnesses,
childrens and the elderly are advised to avoid physical exertion and outdoor activities. The
general public is advised to reduce physical exertion and outdoor activities. They are also
advised to seek advice from a medical doctor before participating in sport activities and
take more breaks during the activities.
29.5
Where does the outdoor API come from?
The API in Hong Kong is provided by the Environmental Protection Department of the
Government of the Hong Kong Administratif Special Region.
found here.
44
More information can be
30 Air Quality (Japan)
30.1
Outdoor Air Pollution Index (AQI)
The Outdoor Air Pollution Index (AQI) in Japan is displayed on the outdoor dashboard.
30.2
Complementary information available on the mobile app
By touching on the ... button in the air quality gauge, you can view complementary
information (when available): main pollutant, hour and location of the report.
30.3
AQI colors
This color code scale makes it easier for anyone to understand quickly whether the air is
polluted.
45
30.4
Understanding the Air Pollution Index
The Air Pollution Index is based on the following pollutants: SO2, NO, NO2, OX, NMHC,
PM10 and PM2.5. It is divided into seven categories:
Good AQI is 0 - 100. Air quality is considered satisfactory, and air pollution poses
little or no risk.
Moderate AQI is 101 - 200. Air quality is acceptable; however, for some pollutants
there may be a moderate health concern for a very small number of people. For example,
people who are unusually sensitive to ozone may experience respiratory symptoms.
Unhealthy for Sensitive Groups AQI is 201 - 300. Although general public is not
likely to be aected at this AQI range, people with lung disease, older adults and children
are at a greater risk from exposure to ozone, whereas persons with heart and lung disease,
older adults and children are at greater risk from the presence of particles in the air.
Unhealthy AQI is 301 - 400. Everyone may begin to experience some adverse health
eects, and members of the sensitive groups may experience more serious eects.
Very Unhealthy AQI is 401 - 500. This would trigger a health alert signifying that
everyone may experience more serious health eects.
Hazardous AQI higher than 500. This would trigger a health warning of emergency
condition. The entire population is then more likely to be aected.
46
30.5
Where does the outdoor AQI in Japan come from?
The AQI in Japan is based on Air Pollution data provided by the Atmospheric Environmental Regional Observation System : AEROS. This Air Pollution data is summed-up as a
comprehensive Air Quality Index (AQI) using formulae similar to American and European
standard formulae. The Air Pollution data can be found here.
31 Air Quality (Taiwan)
31.1
Outdoor Pollutant Standards Index (PSI)
The Pollutant Standards Index (PSI) in Taiwan is displayed on the outdoor dashboard.
31.2
Complementary information available on the mobile app
By touching on the ... button in the air quality gauge, you can view complementary
information (when available): main pollutant, hour and location of the report.
31.3
PSI colors
This color code scale makes it easier for anyone to understand quickly whether the air is
polluted.
47
31.4
Understanding the Pollutant Standards Index
The Air pollution index (PSI) is based on air monitoring station on the same day PM10
(does not include the 10-micron particle size of suspended particles than coarse-grained)
values, the concentration of sulfur dioxide, nitrogen dioxide, carbon monoxide and ozone
concentrations.
It is divided into 5 categories:
Good PSI is 0 - 50.
Moderate PSI is 51 - 100.
Unhealthy PSI is 101 - 199.
Very Unhealthy PSI is 200 - 299.
Hazardous PSI higher than 300.
31.5
Where does the outdoor PSI in Taiwan come from?
The PSI in Taiwan is provided by the Environmental Protection Administration, Executive
Yuan R.O.C. (Taiwan). More information can be found here.
32 Air Quality (Greater Mexico City)
32.1
Metropolitan Air Quality Index (IMECA)
Metropolitan Air Quality Index (IMECA) in Mexico is displayed on the outdoor dashboard.
48
32.2
Complementary information available on the mobile app
By touching on the ... button in the air quality gauge, you can view complementary
information (when available): main pollutant, hour and location of the report.
32.3
IMECA colors
This color code scale makes it easier for anyone to understand quickly whether the air is
polluted.
32.4
Understanding the IMECA index
The IMECA index is calculated using the Air Quality measurements by SIMAT (Sistema
de Monitoreo Atmosférico de la Ciudad de México).
The IMECA is calculated using
averaged measurements of ozone (O3), sulphur dioxide (SO2), nitrogen dioxide (NO2),
carbon monoxide (CO) and particles lower than 10 micrometers (PM10).
49
It is divided into 5 categories:
Good IMECA is 0 - 50.
Moderate IMECA is 51 - 100.
Unhealthy IMECA is 101 - 150.
Very Unhealthy IMECA is 151 - 200.
Hazardous IMECA higher than 200.
32.5
Where does the IMECA in Mexico come from?
The IMECA in Mexico is provided by SIMAT. More information can be found here.
50