1
E. Data Analysis
E.1. Open the analysis software GeneMapper or GeneScan.
E.2. Follow the instructions to add the data for analysis.
The instructions are provided online:
GeneMapper: www.trimgen.com/docs/PartIII-Data-AnalysisGeneMapper.pdf
GeneScan: www.trimgen.com/docs/PartIV-Genescan.pdf.
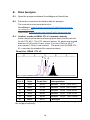
E.3. Confirm results of KRAS CTL-61 (mutant controls)
In the sample plot window (shows graphic data), find the results
for the CTL-K61. The CTL shows 6 peaks. All peaks are located
between 32-42 on the X-axis, zoom in on the X-axis to 25 (2 nd
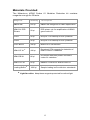
size marker) - 80 (6 th size marker). The peak size of KRAS CTL61 is used as the standard for sample analysis.
Result for KRAS CTL-61
2 3 4
6
5
1
Peak #
Peak
Color
Peak Size*
1
Red
36.83
Mutation
Q61H (CAA >CAT)
2
Blue
37.48
Mutation
Q61R (CAA >CGA)
3
Black
37.94
Mutation
Q61H (CAA >CAC)
4
Red
38.20
Mutation
Q 61L (CAA >CTA)
5
Blue
38.40
Mutation
Q 61E (CAA >GAA)
Interpretation
6
Black
39.51
Wild type
*Peak size may vary slightly depending on instrument, polymer type and
the length of capillary.
15