1
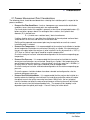
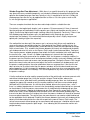
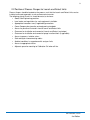
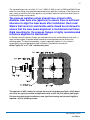
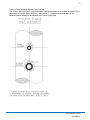
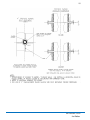
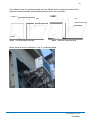
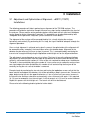
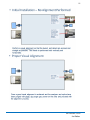
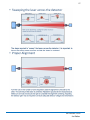
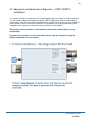
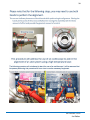
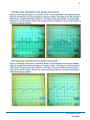
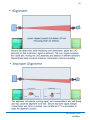
1
TDLS200 Tunable Diode Laser Analyzer
Addendum Instruction Manual
Furnaces, Heaters &
Large Scale Combustion
IM11Y01B01-12E-A
2nd Edition
2
This ADDENDUM to Instruction Manual has been compiled for
Owners/Operators of the Model TDLS200 Tunable Diode Laser
Analyzer specifically for installations on Furnaces, Heaters and
Large Scale Combustion process
©Copyright 2012 by Yokogawa Laser Analysis Division
All Rights Reserved
Product development is a continuous policy of Yokogawa Laser Analysis Division and therefore
specifications may be subject to change without notice.
SAFETY should be considered first and foremost importance when working on the equipment
described in this manual. All persons using this manual in conjunction with the equipment must
evaluate all aspects of the task for potential risks, hazards and dangerous situations that may exist
or potentially exist. Please take appropriate action to prevent ALL POTENTIAL ACCIDENTS.
AVOID SHOCK AND IMPACT TO THE ANALYZER THE LASERS
CAN BE PERMANENTLY DAMAGED
Laser Safety & Classification according to FDA Regulations.
The TDLS200 is registered with the United States FDA as a Laser Product
Please carefully read the appropriate Sections of this User Guide. The TDLS200
Tunable Diode Laser (TDL) Analyzer is a technologically advanced instrument that
requires the appropriate care when handling, installing and operating.
Failure to do so may result in damage and can void any warranties!
If there is any doubt about any aspect of the Instrument or its use, the please
contact Yokogawa Laser Analysis Division and/or your authorized
Representative/Distributor.
In this addendum to the Users Guide for TDLS200, the
installation to Furnaces, Heaters and Large Scale
Combustion is specifically outlined. Items contained
IM11Y01B01-12E-A
2nd Edition
3
within this addendum supersede any conflicting
statement contained within the standard Users Guide.
IM11Y01B01-12E-A
2nd Edition
4
1 Combustion Overview
1.1 Introduction
In this addendum to the Users Guide for TDLS200, the installation for combustion is detailed. This
information pertains to oxygen and CO/CH4 analyzers. Some typical combustion related
installations are outlined below:
• Ethylene Cracking Furnaces, Refinery Heaters, Reformer Units, VCM Cracking
Furnaces, Waste Incineration, Power Generation systems, etc.
• Radiant section, OPL 1-30m (~99ft), +/- atmospheric pressure, <1200C (~2200F):
o Oxygen 0-21% - for control or monitoring
o CO 0-5,000ppm – for control, monitoring or safety
+ CH4 0-5% - breakthrough monitoring and/or safety <800C (~1475F)
• Convection-Economizer section, OPL 1-30m (~99ft), +/- atmospheric pressure, <1200C
(~2200F):
o Oxygen 0-21% - for control or monitoring
o CO 0-5,000ppm – for control, monitoring or safety
+ CH4 0-5% - breakthrough monitoring and/or safety <800C (~1475F)
• Combustion flue, OPL 1-10m (~33ft), +/- atmospheric pressure, <500C (~930F):
o Oxygen 0-21% - for control or monitoring
o CO 0-5,000ppm – for control, monitoring or safety
+ CH4 0-5% - breakthrough monitoring and/or safety <800C (~1475F)
• Waste Incineration, OPL 1-10m (~33ft), +/- atmospheric pressure, <1200C (~2200F):
o Oxygen 0-21% - for control or monitoring
o CO 0-5,000ppm – for control, monitoring or safety
+ CH4 0-5% - breakthrough monitoring and/or safety <800C (~1475F)
For in-situ application (typically large scale combustion) the optical path lengths are generally very
long (7-30m for large scale combustion and ethylene furnaces). Standard TDL optics and laser
beam configurations are unsuitable because of the mechanical stability of these large scale
combustion systems. Yokogawa Laser Analysis Division therefore designed and developed the
concept of a diverging beam (i.e. a laser beam that expands over distance) and a large aperture
optics detector scheme (i.e. a large target for the laser to hit).
The general concept of diverging beam and large aperture optics is shown below:
IM11Y01B01-12E-A
2nd Edition
5
In a standard TruePeak TDLS200 analyzer, the laser beam exiting the launch unit is normally
collimated parallel before hitting the opposing detect unit. The collimated beam size is typically less
than 1” diameter. However, this optical layout is not appropriate for long-path applications (the
dimension of process is longer than 23’). During the initial installation, it is also not so easy to align
the laser beam so that it can hit the targeted detect unit over a long distance (small changes in the
launch unit angle are magnified over long distances). Also it is almost impossible to keep good
alignment with varying ambient and process conditions – especially during cold starts and shutdowns (the most extreme thermal changes on the mechanical structures).
To resolve the above issues, Yokogawa Laser Analysis Division has developed diverging beam
and large aperture optics strategy. At the launch side, the output laser beam has a small diverging
angle. For example, the beam size is about 20” (~50cm) diameter at 60’ (~18m) optical distance.
The optical aperture at the detect unit is enlarged from original diameter. With these two changes,
it is much easier to do initial alignment and keep good transmission at all operating conditions. It is
however, still important to mechanically strengthen the analyzer attachment nozzles onto the
combustion unit walls.
IM11Y01B01-12E-A
2nd Edition
6
2 Installation
2.1 Process Measurement Point Considerations
The following criteria should be considered when selecting the installation point in respect to the
process conditions:
• Process Gas Flow Conditions – Laminar, homogenous gas concentration distribution
conditions across the measurement point are recommended.
For circular ducts/stacks this condition is generally at least three unimpaired diameters (D)
before and after a process bend. For rectangular cross sections, the hydraulic duct
diameter (D) is derived from:
D = (4 x duct cross sectional area) / duct circumference
If neither situation exists or is possible, then distribution of the unimpaired section of duct
should be 66% on the inlet side and 34% on the outlet side.
Profiling of the proposed measurement point may be required to ensure that a correct
installation point is selected.
• Process Gas Temperature – It is recommended that the analyzer be installed at a location
where temperature fluctuations are minimized. Generally as a guide, if the temperature of
the gas at the point where the analyzer is to be installed is to vary by more than +/-10oC (+/18oF) then an “Active” input signal should be used for compensation.
Ensure the analyzer has been selected and configured to suit the maximum operating gas
temperature.
• Process Gas Pressure – It is recommended that the analyzer be installed at a location
where pressure fluctuations are minimized. Generally as a guide, if the temperature of the
gas at the point where the analyzer is to be installed is to vary by more than +/-0.05Bar (+/0.725psi) then an “Active” input signal should be used for compensation.
Ensure the analyzer has been selected and configured to suit the maximum operating gas
pressure.
Ensure the process isolation windows have been selected and configured to suite the
maximum design gas pressure.
• Process Dust/Particulate Matter – It is recommended that the analyzer be installed at a
location where dust loadings are minimized. Dust and other particulate matter will reduce
the optical transmission of the measuring laser beam. Within limits, the loss of optical
transmission does not affect the measurement however a Warning alarm will be initiated
when the transmission falls below allowable limits. The amount of dust loading is also
dependent upon the optical path length – Consult Factory for further details.
IM11Y01B01-12E-A
2nd Edition
7
Window Purge Gas Flow Adjustment – While there is no specific formula for this purge gas flow
rate (due to the many variables/complexity), we include the following information that might help
optimize the window purge gas flow rates actually at site. As mentioned in the User’s Guide, the
window purge flow rate can vary by application from as little as 5 lts./min up to as much as 50
lts./min for typical process applications.
There are a couple of methods that can be used to help establish a suitable flow rate.
For relatively short optical path lengths (such as process O2 measurements) if there is too much
flow the purge gas will protrude/mix into the process gas slightly and therefore possibly cause a
slightly shorter actual optical path length (readings lower than expected). Conversely, if there is too
little window purge flow the process gas may protrude/mix with the purge gas (worst case
contaminate the windows) in the connection nozzle and possibly cause a slightly longer actual
optical path (readings higher than expected).
One method that can be used (if the process gas is not excessively dirty or wet) would be to
measure the process gas without purge for a short period of time. Before starting this test, the
process measurement (O2 concentration) should be relatively stable and not expected to change
within a few minutes. First, establish the distance between the launch unit window and the detect
unit window and enter this value as the Process Path Length (under Advanced Menu, Configure).
Then stop the process window purge gas flow to both the launch and detect units while observing
the transmission – note, if there is a sudden large decrease in transmission then probably
contamination/fouling has occurred on the windows! Wait for the process reading to stabilize (i.e.
the process gas has filled the nozzle and alignment bellows sections up to each window), take note
of the measurement value and resume some window purge flow. Change the Process Path Length
back to the normal value and now resume/adjust the launch and detect unit window purges until
the process reading matches the value noted when there was no purge flow. If the transmission
does not return to its original value then the process windows will have to be cleaned to ensure
optimal operation. It is best to repeat this procedure two or three times to ensure repeatable results
that establish confidence in the readings. This can be repeated at any time at a later date to verify
the process readings.
A similar method can also be used by comparing ratios of the path lengths and measurements with
and without window purge flow. Using the analyzers integral Trend function, observe the
measurement values when both launch and detect window purge gas flows are simultaneously
stopped (for approx. 30 seconds or until the reading stabilizes) and then resume window purge
flow back to the initial flow rates. As with the other method, observe the transmission – note, if
there is a sudden large decrease in transmission then probably contamination/fouling has occurred
on the windows! Once the process measurement has re-stabilized with window purge gas flow,
repeat the simultaneous stopping of window purge gas flow. Repeat this several times until the
trend screen clearly shows repeatable measurement results with and without window purge. If the
transmission does not return to its original value then the process windows will have to be cleaned
to ensure optimal operation. The ratio of these two measurements can now be established based
on the repeatable results obtained. Establish the distance between the launch unit window and the
detect unit window and calculate the ratio with respect to the normal Process Path Length. The
ratio of ‘measurement without purge gas to measurement with purge gas’ should be equal to ‘path
length window-window to process path length’ – thus indicating that the connection nozzles are
purged correctly.
IM11Y01B01-12E-A
2nd Edition
8
2.2 Position of Process Flanges for Launch and Detect Units:
Process flanges should be located on the process such that the Launch and Detect Units can be
installed, accessed removed in a safe and convenient manner.
The following criteria/Check List should be met at a minimum:
• Good, Safe Engineering practices
• Local codes and regulations for such equipment installation
• Appropriate hazardous area (if applicable) precautions
• Owner Company best practice and engineering standards
• Access for personnel to stand in front of launch and Detect Units
• Clearance for installation and removal of Launch and Detect (see below)
• Clearance for installation and removal of purge insertion tubes (if applicable)
• Access to process isolation valves
• Safe routing for interconnecting cables
• Ambient conditions in accordance with analyzer limits
• Access to appropriate utilities
• Adjacent space for mounting to Calibration Cell when off-line
IM11Y01B01-12E-A
2nd Edition
9
Clearance for Launch Unit:
Ensure there is sufficient clearance and access for the Launch unit:
IM11Y01B01-12E-A
2nd Edition
10
Clearance for Detect Unit:
Ensure there is sufficient clearance and access for the Detect unit:
IM11Y01B01-12E-A
2nd Edition
11
Dimensions for combustion process interface devices:
Above: 3” 150# ANSI RF (option for Launch unit alignment bellows)
Above: 4” 150# ANSI RF (option for Launch unit alignment bellows)
Above: 4” 150# ANSI RF Large Aperture Optics (detect side, LAO)
IM11Y01B01-12E-A
2nd Edition
12
The standard flange sizes are either 2” 3” or 4” 150# R.F. ANSI as well as DN50 and DN80. Please
check the exact flange size specified and provided for the particular installation. Other flange sizes
and a variety of materials (to suit the process) are available so please check these details prior to
installing the flanges on the process.
The process isolation valves should have at least a 95%
diameter clear bore size (aperture) to ensure there is sufficient
tolerance to align the laser beam after installation. Ducts and
Stacks that have thin and flexible walls should be reinforced to
ensure that the laser beam alignment is maintained at all times.
Rigid mounting for the process flanges is highly recommended
to ensure alignment is maintained.
In situations where the process flanges are mounted to these thin and flexible duct/stack walls, a
larger reinforcing plate should be welded around the mounting flange area to increase the
attaching region. The figure below depicts a typical suggestion however; it is the installer’s
responsibility to ensure appropriately rigid installation is provided for the analyzer.
Below: Typical 24” x 24” x 3/8” reinforcement plate.
This approach is NOT suitable for systems that use the Large Aperture Optics (LAO) detect
unit, these are typically installed on applications with at least 7m (21ft) optical path length.
For these long path length installations, more significant bracing and structural rigidity is
required – refer to following section:
IM11Y01B01-12E-A
2nd Edition
13
Process Flange Welding Alignment and Line-Up
The Launch and Detect units are provided with alignment mechanisms that allow for some manual
adjustment of the laser beam direction in both planes. It is however recommended that the
following angular tolerances be adhered to as closely as possible.
IM11Y01B01-12E-A
2nd Edition
14
IM11Y01B01-12E-A
2nd Edition
15
IM11Y01B01-12E-A
2nd Edition
16
Details of supporting structural steel for long optical path length systems (>7m/21ft):
It is important that the angle support steel (used for supporting the nozzle) be welded directly to
both the walls and the adjacent heater/furnace structural steel as shown conceptually below –
Note; horizontal/vertical bracing tied to the adjacent structural steel and walls of the unit:
Diagram below shows the ‘preferred’ nozzle reinforcement method:
NOTE: Ensure you have sufficient clearance behind the flange between the angle support to
allow for the alignment flange and LAO attachment using appropriate nuts and bolts/studs!
IM11Y01B01-12E-A
2nd Edition
17
≥10”
≥10”
Note: The TDLS200 flange must be at least 10” from the furnace wall. Heat will damage the optics
at distances less than 10” from the furnace wall!!!
The above preferred method may not be possible in every site specific situation. The actual
dimensions may have to be adjusted to suit the practical installation considerations in each case
but it should remain as close as possible to the above ‘preferred’ method.
IM11Y01B01-12E-A
2nd Edition
18
Case A below shows this preferred method and case B below shows an alternative method if the
‘preferred’ method cannot be accommodated at the particular site installations:
Above – Preferred angle mounting
above – Alternate angle mounting
Below: Image of actual installation as Case A – preferred method
IM11Y01B01-12E-A
2nd Edition
19
Mounting the Launch and Detect Units to the Process Flange
Securely bolt the Launch and Detect (LAO) Units to the process flanges using the standard bolt
holes/studs provided. Ensure the correct size bolts, nuts, and gasket are used in accordance with
the flange specifications and in accordance with the process specifications when applicable.
CAUTION: Use anti-seize paste on threads to avoid possible metallic galling on
nuts/bolts/studs!
START flow to the clean dry window purge gases as soon as possible if the process valve is
open – this will prevent contamination to the optical surfaces. Before starting the actual
purge flows, ensure the lines have been blown out to remove all debris, dirt, oil, water and
other media that could contaminate the optical surfaces and impaired the optical
transmission/measurement performance.
NOTE: the optical surface temperatures MUST NOT exceed 70degC!!!
NOTE: If the process isolation valve flange is excessively hot due to the process temperature or
radiant heat, then a thermal insolating flange gasket should be used in order to minimize the heat
transfer to the analyzer flange face.
It is generally beneficial to make the flange of the Launch and Detect Units and the flange of the
process concentric with each other. Due to the large clearance provided by standard flanges and
bolts, it is possible to mount the two flanges in an un-concentric manner – this should be avoided
to aid laser beam alignment.
IM11Y01B01-12E-A
2nd Edition
20
3 Installation
3.1 Adjustment and Optimization of Alignment - <600oC (1100oF)
Installations:
The following procedure will aide in performing an alignment of the TDLS200 analyzer. The
procedure will guide the technician through the necessary steps to align and optimize the signal of
the analyzer. Please read the entire procedure before starting work and ask your local Yokogawa
service group for further information if required. This procedure can also be performed by local
Yokogawa service personnel if required – please contact for further details.
The alignment of the analyzer will be accomplished by first, visually aligning the analyzer
horizontally and vertically. By performing this first step, the signal should be adequate to begin the
alignment procedure.
Once a visual alignment is achieved and a signal is present, the optimization of the alignment will
be accomplished by “sweeping” the launch beam across the detector beam. Alignment of the
detector may be necessary to insure a signal is present. This is accomplished by monitoring the
transmission strength while adjusting the top/bottom and left/right nuts on the alignment bellows.
The adjustments are performed on one axis at a time. The intent is to use the alignment bellows
adjustments to move the beam from one edge of the detector to the other (both horizontally and
vertically), while counting the number of ¼ turns of the nuts required to sweep across the detector.
The beam is then centered by taking the number of ¼ turns necessary to sweep the analyzer from
one signal edge to the other and dividing this number in half and returning the analyzer to the
center by turning the nuts so that the beam is centered.
Example, begin by monitoring the transmission and turning the top/bottom screws so that that the
beam reaches one edge of the detector, this will be noticed by a drop in transmission. Once on the
edge, begin turning the nuts the opposite direction a ¼ turn at a time until you see an increase in
the transmission and then a decrease and eventually a loss of transmission again. If this required
18 (¼) turns to accomplish, turn the nuts back ½ of that amount, or 9 (¼) turns to center the beam.
Repeat this process for the left/right axis. The launch unit will then be centered.
Please refer to the following pictorial guide for further details.
IM11Y01B01-12E-A
2nd Edition
21
IM11Y01B01-12E-A
2nd Edition
22
Above: Zero Transmission/No Signal
Above: 0.2% Transmission/small signal
IM11Y01B01-12E-A
2nd Edition
23
•
•
•
Once visual alignment is achieved on both the launch and detect and clean, dry purge gas
has been flowing, power may be applied to the analyzer.
Begin the alignment process by starting at the launch end; maximize the signal (using the
transmission signal and value) by moving the launch around using the alignment bellows.
Once maximum signal is achieved, move to the detect end and using the method described
in the previous slide, move the LAO/detect assembly around, until maximum signal is
achieved. (Note: CO detectors are more sensitive to miss-alignment than the O2 detector)
IM11Y01B01-12E-A
2nd Edition
24
•
•
•
The launch and detect alignment steps may need to be repeated several times to ensure
maximum transmission.
Once maximum transmission is achieved, move to the next step and ensure the laser is
centered.
This is done by “sweeping” the laser across the detector in both the horizontal and vertical
axis. To accomplish this, use the nuts on the launch alignment bellows to “sweep” the
beam.
IM11Y01B01-12E-A
2nd Edition
25
IM11Y01B01-12E-A
2nd Edition
26
IM11Y01B01-12E-A
2nd Edition
27
IM11Y01B01-12E-A
2nd Edition
28
3.2 Adjustment and Optimization of Alignment - <1200oC (2200oF)
Installations:
This section will aide in the alignment of the large aperture optics assembly in a high temperature
(i.e. with variable degree of background radiation >800oC) application using an oscilloscope (or
scope-meter). Please read the entire procedure before starting work and ask your local Yokogawa
service group for further information if required. This procedure can also be performed by local
Yokogawa service personnel if required – please contact for further details.
Please note that this procedure is not intended to teach/train someone how to use an
oscilloscope!
If you do not know how to use an oscilloscope, please align the analyzer by using the
method mentioned in the user manual.
IM11Y01B01-12E-A
2nd Edition
29
IM11Y01B01-12E-A
2nd Edition
30
IM11Y01B01-12E-A
2nd Edition
31
IM11Y01B01-12E-A
2nd Edition
32
•
•
•
•
•
•
Once visual alignment is achieved on both the launch and detect, power may be applied to
the analyzer.
Begin the alignment process by starting at the launch unit to maximize the signal by moving
the launch around using the alignment bellows while watching the scope screen. .
Once maximum signal is achieved, (Note that the signal may be very small initially, as
low as 0.1 volts) move to the detect end and using the method described in the previous
slide, move the LAO/detect assembly around, until maximum signal is achieved.
The launch and detect alignment steps may need to be repeated several times to ensure
maximum transmission.
Once maximum transmission is achieved, move to the next step and ensure the laser is
centered.
This is done by “sweeping” the laser across the detector in both the horizontal and vertical
axis. To accomplish this, use the nuts on the alignment bellows to “sweep” the beam.
IM11Y01B01-12E-A
2nd Edition
33
IM11Y01B01-12E-A
2nd Edition
34
IM11Y01B01-12E-A
2nd Edition
35
IM11Y01B01-12E-A
2nd Edition
36
Adjustment of Detector Gain after Optimization of Alignment –
Please read these directions carefully before attempting work and contact your local Yokogawa
service center if there is any doubt about how to perform this procedure.
Alternatively, Yokogawa service personnel can perform this procedure – please contact you local
service center for details, rates, availability, etc.
Caution – Electrostatic Sensitive!
INTRODUCTION
•
For TDLS200 measurement over long optical path length, the laser beam is usually configured with
a small diverging angle (either with or without large aperture detector lens). In factory, the detector
signal gain is not optimized for the real installation. During the analyzer field start up service, the
detector gain needs to be adjusted to achieve the best analyzer performance.
•
This document gives the guidance and procedures to adjust the detector board gain for services
and customers after the analyzer is installed and powered up.
•
This operation should be done by qualified personnel. Read instructions fully before starting this
operation. Any doubts or questions, please contact Yokogawa.
PHOTOS OF DETECTOR BOARD
High-temp detector board (> 600°C)
Low-temp detector board (< 600°C)
RESISTOR KIT BAG
•
For a TDLS200 analyzer with diverging laser beam configuration (either with or without large
aperture detector lens), a resistor bag is attached inside the detector box. The resistor bag contains
the resistors with the following values. All of them are ¼ W, 5% tolerance metal film through-hole
resistors.
Resistor Bag for Analyzers With Diverging Beam Optics
Resistance (Ω)
Quantity
100
1
1k
2
1.5k
2
2.2k
2
3.3k
2
5.1k
2
7.5k
2
11k
2
15.8k
2
24.3k
2
IM11Y01B01-12E-A
2nd Edition
37
•
Factory gain resistors on the detector board: R21 = ________; R22 = ________; R23 = ________.
PROCEDURE
1. This procedure requires wearing a grounding strap connected to one of the grounding lugs of the
analyzer to prevent any electrostatic damage.
2. Open the detector enclosure and put on a grounding strap.
3. Identify the gain resistors R21, R22 and R23 on the detector board as shown in the photo above.
They are all plugged in sockets instead of being soldered, easy to be modified by a pair of small
pliers. The existing gain resistors have factory resistance values optimized on a calibration cell.
4. [Optional] For a high-process-temperature application and if the current process temperature is
higher than 600°C, apply a multi-meter to measure the voltage across R21. If the measured
voltage absolute value is greater than 5V, change R21 to the 100Ω resistor from the resistor bag.
Keep the original R21 in the resistor bag as it can be used for future off-line calibration.
5. Remove R22 and R23 from the detector board and replace them with the 11kΩ resistors from the
resistor bag. Please keep the original R22 and R23 in the resistor bag as they can be used for future
offline calibration.
6. Optimize the analyzer alignment for both the launch and detector sides. Stop the alignment if
Detector Signal High fault activates.
7. In the TruePeak user interface software, navigate to Advanced Menu (password) -> Configure ->
Laser Spectra & Control screen to check the raw detector signal. Write down the raw detector
signal MAX and MIN values for later use.
MAX
MIN
8. Change R22 and R23 accordingly based on the current raw detector signal. Perform one item of the
following selections (a, b, or c).
a. If Detector Signal High fault is active, change both R22 and R23 to the next smaller value
available in the resistor bag, and then go back to STEP 6. For example, if the current R22 and
R23 values are 11kΩ, the new R22 and R23 values should be 7.5kΩ. NOTE: please access
Active Alarm in the main user interface panel to check if Detector Signal High fault is active.
b. If the raw detector signal is within requirement, remove R22 and R23 (and R21 if it was
changed to 100Ω in STEP 3) and cut their leads properly to fit the sockets tight and low, and
then go to STEP 9. NOTE: (1) for a low-process-temperature analyzer (with no capacitor on
R3), the raw detector signal is within requirement if MAX is between 0.0 and 4.0; (2) for a
IM11Y01B01-12E-A
2nd Edition
38
high-process-temperature analyzer (with a capacitor on R3), the raw detector signal is within
requirement if MIN is between -4.0 and -8.5.
c. If the raw detector signal is too low (other than a and b), change either R22 or R23 to the next
greater value available in the resistor bag, and then go back to STEP 7. How to decide which
resistor to change:
i. If the current R22 value is greater than the current R23 value, change R23 to the
next greater value available in the resistor bag.
ii. If the current R22 value is same as the current R23 value, change R22 to the next
greater value available in the resistor bag.
iii. If the current R22 and R23 are already 24.3kΩ (the greatest value available in the
resistor bag), please contact Yokogawa for assistance.
9. Close the detector enclosure. Write down the final values of R21, R22 and R23 below for record.
R21 = ____________; R22 = ____________; R23 = ____________.
10. Enter these new resistor values into the analyzer configuration under Advanced Menu >
Configure > System > Adjustable Resistors > Detect – R21, Detect – R22, and Detect – R23. All
resistor values are entered in K ohm unit.
11. Keep the resistor bag and this procedure document by customer. DO NOT leave them in the
detector box or throw them away.
TIPS
•
How to remove a gain resistor? On the detector board, find the location of the gain resistor. Please
note that the resistor is not soldered but resting in sockets. Carefully remove the resistor from the
socket on the board. Since the analyzer is still powered on, please take extreme caution to
prevent a short circuit on the board, i.e. loose wires or touching adjacent components with pliers
or tool used to remove resistor.
•
How to install a new gain resistor? First try the new resistor by molding and clipping the resistor
leads to fit into the socket. Then carefully insert the resistor into the socket on the detector board.
Since the analyzer is still powered on, please take extreme caution to prevent a short circuit on
the board, i.e. loose wires or touching adjacent components with pliers or tool used to install
resistor.
•
Please keep the factory/original gain resistors in the resistor bag as they will be used in the future
for offline calibration or test.
•
The raw detector signal (MAX-MIN) is proportional to R21·R22·R23. Usually R21 is maintained as
factory value. R22 and R23 are optimized in the field. We want to avoid the situation where one of
R22 and R23 resistors has extreme low resistance and the other one has extreme high resistance.
The analyzer gives best performance when R22 and R23 are balanced. Based on this relation
between raw detector signal and gain resistors, service technician or customer can select R22 and
R23 faster with the help of a calculator.
•
Multiple alignment actions might be needed if Detector Signal High fault happens. Reduce the gain
resistor first as described in STEP 8-a, and then optimize the alignment again.
NOTE: If the alignment has been performed on a ‘cold’ (shut-down) heater/furnace, then it is
highly recommended when the heater/furnace is at normal operating temperature, the
transmission/alignment be checked again to ensure >10% (ideally >25%) transmission exists and
that there are no alarms. Validation gas should also be introduced through the validation cell to
ensure peak response, especially if a line-locking gas is not being used.
IM11Y01B01-12E-A
2nd Edition
39
4 Contact for Further Assistance
Should you require any further information or details not contained herein, then please contact your
local Yokogawa Office, Yokogawa Distributor or Yokogawa Sales Representative or Yokogawa
Laser Analysis Division directly as listed below:
Yokogawa Laser Analysis Division
910 Gemini Street
Houston, Texas 77058
USA
Telephone:
Facsimile:
SERVICE:
281 488 0409
281 488 4971
1 800 524 7378 (USA toll free)
Service:
website:
TDLS website:
[email protected]
www.us.yokogawa.com
www.truepeaktdls.com
IM11Y01B01-12E-A
2nd Edition