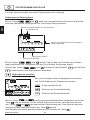
1
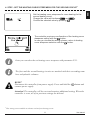
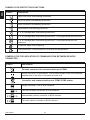
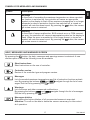
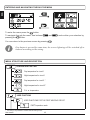
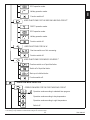
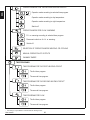
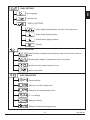
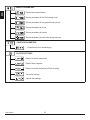
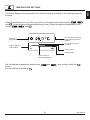
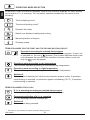
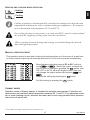
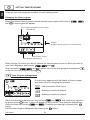
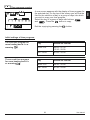
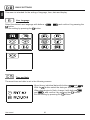
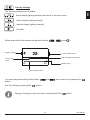
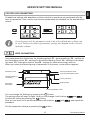
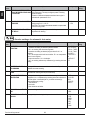
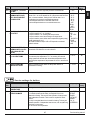
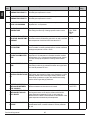
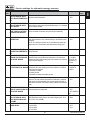
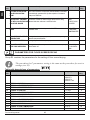
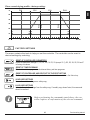
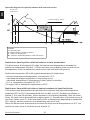
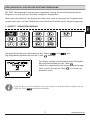
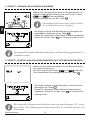
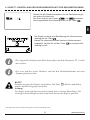
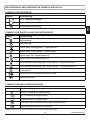
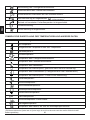
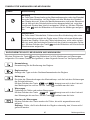
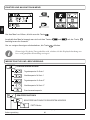
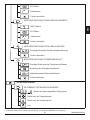
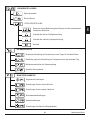
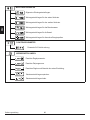
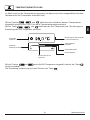
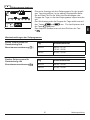
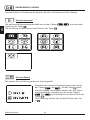
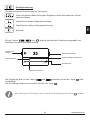
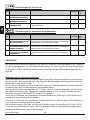
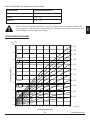
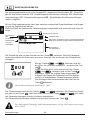
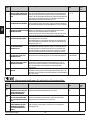
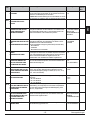
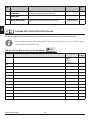
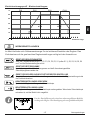
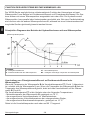
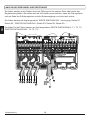
ENG
DATA OVERVIEW
The following icons for accessing data on the controller operations are available in the menu:
TEMPERATURES DISPLAY FOR THE PERIOD OF ONE WEEK
Graphic display of temperature course according to days for each sensor. Temperatures are recorded for the past week of operation.
DETAILED DISPLAY OF TEMPERATURES FOR CURRENT DAY
Detailed graphic display of temperature course in the current day for each sensor. The frequency of temperature recording can be set with parameter P1.7.
COUNTERS OF CONTROL OUTPUTS OPERATION HOURS
Counters of operation hours of the controller's control outputs.
SPECIAL SERVICE DATA
These serve to provide diagnostics to technical support.
You can review graphs of the sensors by moving between sensors with buttons
and
. Select the sensor, for which you wish to review the temperatures of a previous period with the
button. Now move between days with
buttons
and
. You can change the range of temperature display on
the graph with the
button.
Exit data overview option by pressing the
button.
User manual
32