1
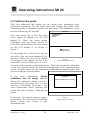
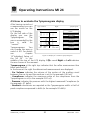
Operating Instructions MI 24 4.5 How to evaluate the Tympanogram display After having carried out Right Tympanogram a measurement you can Tymp 1000 Hz see the results on the Status ml LCD display. 3 READY On the left side of the Ear Volume display you see the 2 0.94 ml Tympanogram. The Compliance area surrounded by the 0.81 ml 1 box is valid for Pressure - 37 daPa 0 “normal” Gradient Tympanograms. You -600 -300 300 daPa 32 daPa can change the area or switch it off. For details see chapter Figure 15 Display of a 1000 Hz Tympanogram 12“Individual Setup of the MI 24". In the middle of the top of the LCD display ➄ the word Right or Left indicates the ear chosen at the moment. Tympanogram at the right top indicates that the reflex measurement has been switched off. In the boxes at the right the determined measurements are displayed: - Ear Volume indicates the volume of the section of the auditory canal between the ear tip and the eardrum in ml (in the example 0.94 ml). - Compliance indicates the maximum value of the compliance from the Tympanogram in ml (in the example 0.81 ml). - Pressure indicates the pressure with the highest measured Compliance (in the example -37 daPa). - Gradient calculations are reported as the Tympanogram width at half of peak compliance expressed in daPa (in the example 32 daPa). GEBAmi24e_11a.docx 20 850 234/9 07/11