1
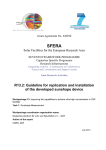
COVIS 3.0 User manual Revision: 3.0 [2012 – April – 1st] Prepared by G. Pennucci, A. Alvarez and C. Trees NURC – NATO Research Centre 19100 La Spezia Viale San Bartolomeo 400 Italy Tel (+39) 0187 527 318 Fax (+39) 0187 527 354 Copyright © 2012 - All rights reserved Copyright COVIS 3.0 - User Manual 1 Copyright © 2012, all rights reserved worldwide. This user’s guide is protected by federal copyright law. No part of this user’s manual bay be copied or distributed, transmitted, transcribed, stored in a retrieval system, or translated into any human or computer language, in any form or by any means, except by prior written permission of NATO Research Centre – NURC, Italy or Naval Research Laboratory – NRL, Stennis Space Center, MS. Technical Support Technical support for COVIS 3.0 can be obtained in accordance with the user’s license agreement from: Giuliana Pennucci Tel (+39) 0187 527 318 Fax (+39) 0187 527 354 [email protected] If you encounter a problem during a COVIS 3.0 run, please send an e-mail with the MATLAB printout error along with a description of the problem. This will greatly increase the speed at which we can help troubleshoot any problem. COVIS 3.0 - User Manual 2 TABLE OF CONTENTS 1. INTRODUCTION_____________________________________________________________4 1.1 Ways in which COVIS 3.0 can be used_________________________________________5 2. SYSTEM REQUIREMENTS____________________________________________________5 3. INSTALLING COVIS 3.0______________________________________________________6 4. OVERVIEW_________________________________________________________________6 4.1 Ways in which COVIS 3.0 can be used_________________________________________6 4.2 Inputs___________________________________________________________________6 4.3 Outputs__________________________________________________________________7 5. GRAPHICAL USER INTERFACE ORGANIZATION________________________________8 5.1 Data Ingestion_____________________________________________________________8 5.1.1 TIF and GEOTIFF format_____________________________________9 5.1.2 MATLAB format___________________________________________10 5.1.3 Hierarchical data format_____________________________________10 5.2 Data Visualization and Inspection____________________________________________13 5.3 Data Processing and Outputs results from Standard runs__________________________16 5.3.1 Covariance Evaluation______________________________________16 5.3.2 Merging Procedure_________________________________________18 6. EXAMPLE COVIS 3.0 RUNS__________________________________________________20 7. REFERENCES______________________________________________________________23 COVIS 3.0 - User Manual 3 1. INTRODUCTION With an increasing availability of satellite time-series imagery, it has become possible to monitor temporal and spatial variability of coastal and open areas. Satellite data provides a great improvement over the more limited spatial sampling offered by ship and in situ (such as a buoy, Boussole mooring or autonomous vehicles) observational platforms. Generally, merging remote sensing data with in situ measurements has become a standard procedure to increase the quality of satellite derived products. Conventionally, covariance analysis is applied to oceanographic and meteorological data sets to decompose space and time distributed data into modes ranked by their temporal variance, while optimum sampling analysis is applied to find adequate numbers of in situ data to improve satellite quality by reducing their observational error. COVIS 3.0 is a Toolbox for implementing such concepts; in particular it can be used to: Evaluate the covariance from satellite imagery; Merge of satellite and in situ measurements. Generate uncertainty maps and uncertainty indices from the available time-series of images and historical information. These methodologies can be applied to several optical satellite data sets, such as the Moderate Advanced Very High Resolution Radiometer (MODIS), the Medium Resolution Imaging Spectrometer (MERIS), the Advanced Very High Resolution Radiometer (AVHRR) and the Visible Infrared Imager Radiometer (VIIRS) sensors as well as several optical in situ platforms, such as the AErosol RObotic NETwork AERONET and the Marine Optical BuoY- MOBY platforms. COVIS 3.0 can be used to assess the locations of where in situ data should be collected in order to determine the uncertainty when using these data for their calibration and validation efforts. The main goal of COVIS 3.0 is to merge remotely sensed data with the available in situ measurements thus increasing the quality of satellite derived products. This User Guide’s is independent from any other publication and should be adequate for users who whish to run COVIS 3.0 as a “black box” to visualize and processing satellite data. This User’s Guide for assumes that the reader is familiar with the basic terminology and notation of optical oceanography and statistical analysis. If this is not the case, then the reader should first consult the review manuscript[1] by G. Pennucci, A. Alvarez and C. Trees available at NURC or the paper[2] by G. Pennucci, G. Fargion, A. Alvarez , C. Trees and R. Arnone available in the SPIE public Journal. COVIS 3.0 is currently supported by Naval Research Laboratory (Stennis) and developed at NATO research Centre – NURC (Italy). The COVIS 3.0 source code is written entirely in MATALB, in order to make it easily portable to almost any computer with a MATLAB compiler. Throughout this report, the names of mathematical variables are written in italics, e.g. C or cov or covariance. The names of computer programs, directories and files are written in Courier font. COVIS 3.0 - User Manual 4 1.1 Comments and Warnings It’s important to understand that the COVIS 3.0 tool per se is an implementation of a statistical model; therefore its results are directly related to the size and quality of the input parameters. For example, a limitation of COVIS 3.0 is the quality (in terms of noise/cloud coverage percentage) of the satellite images used as input. It is you job to select areas with low cloud coverage and to build consistent data-set before using them as input to COVIS 3.0 (for more details see Paragraph 5.2). COVIS 3.0 is reasonably robust in checking for bad input, but there is still great opportunity for entering bas input and getting bad covariance output. More details on this type of problem can be found in Reference [3]. Another limitation of COVIS 3.0 is related to the memory of your machine’s CPU and to the size of the selected working-image for the covariance evaluation. For a proper covariance analysis, we suggest sizes sub-areas no bigger than 60 x 60 pixels. For the above explained reasons a requirement for user input requires considerable forethought and effort on the user’s part, in order to select an appropriate working area and an appropriate size and inputs (such as latitude and longitudes corners). COVIS 3.0 has been a work in progress since G. Pennucci and A. Alvarez first started working out the numerical MATLAB algorithms at the core of COVIS 3.0, and it will continue to be so. The invariant imbedding MATLAB algorithms at the core of COVIS 3.0 are mature and well debugged after many simulations and tests. However, many features of the Graphical User Interface (GUI) are new with Version 3.0 and may evolve quickly as feedback is received from the users. 2. SYSTEM REQUIREMENTS COVIS 3.0’s source code is written and compiled entirely in standard MATLAB in order to make the code as portable as possible. The GUI was developed with the 7.5.0.342 (R2007b) MATLAB Version. The minimum system requirements for COVIS 3.0 are as follow: Operating System: Microsoft Windows 2000/2003/XP/Vista or MAC OS Processor (CPU): 1 GHz 32-bit (x86) Memory (RAM): 1 GHz Free Disk space: 50 MB MATLAB version: 7 or superior MATLAB Toolbox: Mapping Toolbox Intel 3.1 COVIS 3.0 GUI is designed for optimum use on monitors with 2014 x 768 pixels. Lower-resolution monitors cause some of the GUI forms to display as larger than the monitor screen. Higher-resolution monitors could make the GUI form appear smaller than intended, in which makes the forms harder to read. COVIS 3.0 - User Manual 5 3. INSTALLING COVIS 3.0 This section describes how to install COVIS 3.0 on a PC. It is assumed that you will be running COVIS 3.0 with a MATLAB compiler of Version 7 or more. COVIS 3.0 is available as a standard MATLAB GUI as a single self program from your MATLAB Command Window. COVIS 3.0 software package is distributed as one directory named COVIS 3.0. To install the code on your PC, do the following steps: 1. Open MATLAB and set the current directory in which COVIS 3.0 code will be installed (COVIS 3.0); 2. From the Command Window launch the program COVIS and the COVIS 3.0 GUI will appear. 3. Follow the instruction on Chapter 5 to ingest and process data pushing the button on the screen. 4. OVERVIEW OF COVIS 3.0 4.1 Ways in which COVIS 3.0 can be used This section gives brief description on how COVIS 3.0 can be used: what assumptions are building into the code, what input is required, and what output can be obtained from a COVIS 3.0 run. Some of the ways in which COVIS 3.0 can be used are as follows: COVIS 3.0 can be run to ingest and visualize several remote sensing satellite images, such as from SeaWiFS, AVHRR, MODIS, MERIS, VIIRS and all the satellite outputs that have a standard input (e.g. HDF, HDF4, HDF5 and Geotiff format). COVIS 3.0 can be run with satellite remote sensing input images to generate covariance map. Such information is fundamental to merging satellite image with in situ and to perform uncertainty analysis of the area of interest. COVIS 3.0 can be run with several types of in situ data to merge remote sensing acquisitions with the available in situ measurements. As written before, COVIS 3.0 is a work in progress tool and additional MATLAB algorithms are ready to be integrated in the core of COVIS 3.0. In particular, we are working on the possibility to run COVIS 3.0 on time-series of satellite imagery (tridimensional array) to perform uncertainty analysis. This function will allow the user to automatically produce uncertainty maps that can be used to characterize the background environments in a particular month (for more details see References [1] and [2]). 4.2 Inputs In order to run COVIS 3.0 to evaluate the covariance distribution of a particular image during a particular environmental condition, the user supplies the core mode with the following information (or via direct input or via user-written or via user-supplied data files): A satellite image. To directly ingest the image of interest, the file format must be Geotiff, HDF4 or HDF5. Otherwise the user can provide a MATALB (.mat) file format in which was saved as a grid or vector the longitude and latitude (X and Y COVIS 3.0 - User Manual 6 respectively) information and a grid with the same X and Y size for the image pixels physical values. In situ data (if available). The user can provide k in situ measurements that have to be stored in a MATALB (.mat) as a grid of k rows by 3 columns (with longitude, latitude and in situ physical value, respectively). 4.3 Outputs Output from COVIS 3.0 consists of both “print-out” (a MATLAB figure to view, to save and/or to print final results) and digital data (stored in MATLAB format: .mat). The default printout gives a moderate amount of information showing the standard the quantities of interest (such as covariance map, merged and difference images and uncertainty maps). Figures are useful for taking a quick look of results, or for cutting and pasting a particular part of the output into another document. If the user is interested in processing the outputs or in a more detailed analysis, the MATLAB variables stored in the MATLAB workspace can be used. COVIS 3.0 - User Manual 7 5. GRAPHICAL USER INTERFACE ORGANIZATION In this Chapter we describe in detail the processing context of COVIS 3.0 that defines all the parameters necessary to process satellite and in situ data for covariance computation and data merging. The processing context is made of up three parts: Data ingestion; Data visualization - data inspection (sub-area definition for covariance computation); Data processing and outputs results. Figure 1 displays COVIS 3.0 GUI with its main buttons that have been regrouped following the above described context parts. Figure 1: COVIS 3.0 MATLAB GUI for covariance estimation and merging. 5.1 Data Ingestion COVIS 3.0 requires two files as input for covariance and merging computation: Remote sensing satellite data. Clicking on the button [Load Satellite Image] a folder will appear; the user has to select the desired file format and to find the file of interest navigating from the Look in search bar (as displayed in Figure 2). Allowed file format: GeoTIFF, TIF, HDF4, HDF5 and MATLAB file format. In situ data (if available). Clicking on the button [Load in situ data] a folder will appear as above; the user has to select the desired file format and define the path of the file of interest in the Look in search bar. Allowed format: TEXT, EXCEL and MATLAB file format. NOTE: in situ data are needed just for merging and data matchup but they are not required for covariance analysis. COVIS 3.0 - User Manual 8 Before to describe in detail each procedure for the different satellite format, it’s important to point the attention on one important common property: Because COVIS 3.0 was written to process georeferenced data (for a proper covariance, merging and match-up analysis), the satellite and in situ file used have to contain GIS standard products. In other words, the working file has to contain (at least) one projected image and the relative latitude and longitude information. Figure 2: Remote sensing data ingestion from using COVIS 3.0 3.0. 5.1.1 TIF and GeoTIFF format (*.tif, *.gtiff or *.gtif) This type of format is used by over different remote sensing companies and organizations as an interchange format for georeferenced raster imagery. The potential additional information is stored in a structure and it includes map projection, coordinate systems, ellipsoids, datums, and everything else necessary to establish the exact spatial reference for the file. It’s important to note that, COVIS 3.0 was written to read any GeoTIFF file that contains one georeferenced image (that means a two-dimensional of M-by-N pixels) array. Moreover, to a proper covariance processing, the info GeoTIFF structure have to contain the following field: ImageDescription describing the image information such as COVIS 3.0 - User Manual 9 units, scaling slope and intercept. This information is important to a proper signal processing because is required to convert data from numerical to physical. If no description is included in the file (the field is empty or without this information), COVIS 3.0 will show the image as was stored in the file, considering the data as physical (supposing that the numerical to physical conversion have been performed by the TIFF/GeoTIFF provider). 5.1.2 MATLAB format (*.mat) This type of input format was introduced in COVIS 3.0 for expert MATLAB users that want to process directly MATLAB gridded data. The input *.mat file has to contain the following parameters: 1. Image: a grid of M rows by N columns (that represents the image of interest, physical values); 2. Latitude (decimal degrees): a vector of 1 row by M columns (size has to be the same of the grid image); 3. Longitude (decimal degrees): a vector of 1 row by N columns. In particular, when a *.mat file is selected from the user, the MATLAB file data ingestion folder will appear (as in Figure 3). The user has to type the name of the three required input as have been stored in the original file (name are case sensitive) and click on the button “Display Image” to visualize and to ingest the image in COVIS 3.0. Figure 3: MATLAB (*.mat) data ingestion procedure. 5.1.3 Hierarchical Data Format - HDF, HDF4 and HDF5 (*.hdf,*.hdf4,*.hdf5 or *.h5) Hierarchical Data Format is the name of a set of file formats and libraries designed to store and organize large amounts of data, such as remote sensing satellite products. In 1993, NASA chose the Hierarchical Data Format Version 4 (HDF4) to be the official format for all data products derived by the Earth Observing System (EOS). In 2008, due to some limitations, the HDF4 format was improved in terms of data compression and organization and a new HDF format was introduced: HDF5. Because HDF4 and HDF5 are completely independent formats, the calling interfaces of COVIS 3.0 were different. Unfortunately, this is not enough to ensure consistent data COVIS 3.0 - User Manual 10 ingestion because the storage formats of HDF/HDF4/HDF5 is different and depends on several the processing Level of the stored products and from the processing tool used for their generation (such as APS, ADR, SeaDAS etc...). For this reason COVIS 3.0 was developed to ingest several of the more used HDF/HDF4/HDF5, as listed below: a. Generic HDF/HDF4 data file: when the processing tool is unknown. b. Standard HDF/HDF4 Level 3: for files generated with APS; c. HDF5 VIIRS SDR: for files generated with ADL 3.1; d. HDF5 VIIRS EDR: for files produced with IDPS. a. Generic HDF/HDF4 data file This case represents the more general situation in which the user doesn’t know the HDF source provider. This is a general interface that requires expert users because they have to manually select the appropriate variables for data ingestion and processing. In particular, when a generic HDF (*.hdf) file is selected, the HDF data selection GUI will appear, as showed in Figure 4. This GUI requires three inputs that have to manually typed by the user choosing the variables from those available listed in the left side of the screen (Note that name are case sensitive). Figure 4: Generic HDF/HDF4 (*.hdf) GUI for data ingestion procedure. In particular, the name of the physical parameter of interest has to be written in the “Image” box (for example: La_488); while the “Lon” and “Lat” empty fields require the name of the variables that contains longitudes and latitudes information (in decimal degrees). It’s important to note that the size of the longitude and latitude information has to be consistent with the size of the selected image. In the following table are resumed the size allowed (on the basis of the HDF files processed until now). CASE 1 CASE 2 IMAGE SIZE mxn mxn LONGITUDE SIZE LATITUDE SIZE i x j (with i ,j < m, n) 1xn i x j (with i ,j < m, n) 1xm COVIS 3.0 - User Manual 11 Once time these empty fields were compiled, the user can store and visualized them in COVIS clicking on the button “Display Image” (as showed in Figure 5). After this procedure, the selected parameters are ready to be processed for covariance analysis and/or in situ match-up (as explained in detail in Chapter 6). Figure 5: HDF data viewer of COVIS 3.0 with a user selection (La_488) and data visualization. To test this GUI procedure, we have provided two examples of HDF files that contain MERIS (as showed in Figure 5) and MODIS satellite data. These files-tests have been provided with the COVIS 3.0 MATLAB program under following directories: COVIS 3.0\SAMPLE_IMAGE\HDF_HDF4\MERIS\MER_FRS_2PNPDE20090317.hdf COVIS 3.0\SAMPLE_IMAGE\HDF_HDF4\MODIS\MODPM2009076125154.hdf b. Standard HDF/HDF4 Level 3 data file generated by APS This function was specifically written to process HDF/HDF4 files that have been generated by the Automated Processing System (APS). APS is a collection of programs designed to generate co-registered image databases of geophysical parameters derived from remotely sensed images. One of the main characteristic of that system is the automation that is the technique of making a system operates without human effort or decision. This procedure allows the generation of standard HDF structure (same names for geographic data, same map projection, etc …) that can be read using automatic procedures. For this reason, we have decided to develop a specific GUI that can be use to visualize and ingest APS Level 3 products in COVIS 3.0. As displayed in the following Figure, this GUI is faster and automatic to respect the GUI developed for the generic HDF file. Indeed, in that case the user has to select only the physical data of interest (that has to be a two dimensional grid of data) while the geographic parameters are automatically ingested in COVIS 3.0 (this is possible because APS produces COVIS 3.0 - User Manual 12 standard products and the geographic information have same name and same format for each output). User Selection Figure 6: HDF data viewer for files generated with APS software. The user has to select the desired product from the left list and then click on the button “Display Image” to visualize. The user can chose the product to process repeating this procedure several time, when an interesting image was identified he has to click on the button “Ingest in COVIS 3.0” to start with the processing. Once time an interesting product was identified, the user can start with the data processing clicking on the button “Ingest in COVIS 3.0” (as explained in detail Chapter 6). To test this procedure, we have provided three examples of HDF generated with APS software: COVIS 3.0\SAMPLE_IMAGE\HDF_HDF4\MODIS\npp.2011326.1122.D.L3_Mosaic.viirs.NEA_npp.v02.750m.hdf COVIS 3.0\SAMPLE_IMAGE\HDF_HDF4\VIIRS\npp.2011326.1122.D.L3_Mosaic.viirs.NEA_npp.v02.750m.hdf COVIS 3.0\SAMPLE_IMAGE\HDF_HDF4\VIIRS\npp.2011326.1122.D.L3_Mosaic.viirs.NEA_npp.v02.750m.hdf 5.2 Data Visualization and data Inspection Once time a parameter was selected, the visualization program displays the satellite image as it is in the original file (this means with flags, colorbar and color scale as they have been stored in the source file). However, these parameters can be manually changed using the button in the lower side of the GUI. For example, in the MERIS HDF file test (in COVIS 3.0\SAMPLE_IMAGE\HDF_HDF4\MERIS\MER_FRS_2PNPDE20090317.hdf), the physical parameter available for visualization is the chlorophyll (chl) as showed in Figure 7. It’s possible to note that the chl image is not clear because it has a bad colorscale: shapes and fronts structures are not well represented due the land-flags. For this reason the user can decide to explore the image changing the minimum and maximum value of the color-scale and or the color-map. In Figure 8 have been represented the COVIS 3.0 - User Manual 13 result changing the maximum values of chl from the land-flag (high value) to the expected (and more consistent) value of chl=0.8 (in color and black & white version). Figure 7: Chl visualization from a MERIS acquisition. Using the color-scale of the file that image is not well represented; therefore the user can also decide to change the color representation using the lower buttons in the lower part of the GUI (as in the black box). COVIS 3.0 - User Manual 14 Figure 8: Chl visualization of the same a MERIS acquisition of Figure 7 but using user defined min and max values of the colormap. If desired, the user can decide to use gray scale color clicking on the button “Display Image (Gray)”. Once time the image was ingested and visualized represented, the user has to define a working area of interest (to zoom on a particular area click on the button "Zoom in") for data processing. This step is very important for a proper covariance analysis, therefore we have analysed different scenario (using Monte Carlo simulations) to define the following guidelines that have to be considered by the user for a proper selection of the area of interest: 1. Due to computational reasons, we suggest sizes no bigger than 60 by 60 kilometres (that for MODIS acquisition means about 60 x 60 pixels); this because the A-optimum calculation requires a number of computation proportional to the size of the area (this operation will take some time depending on the speed of your machine’s CPU). This limitation in size it’s also due to the intrinsic definition of the covariance on a satellite image (don’t make sense to find correlation between pixel that are so far); 2. Due to statistical reasons, the covariance computation has to be performed on cloud and noise free areas (with a coverage <10-15%). This consideration was the result of several simulations for the evaluation of the covariance field as a function of cloud and noise coverage (for more details see Reference [3]). The results show that the analysis of the covariance depends on clouds/noise size and position. In other words, we have demonstrated that the introduction of not valid pixels causes a loss of information and decrease the correlation length. Once time the working area was identified, it has to be defined inserting four latitude and longitude corners (decimal degrees) in the right side of the GUI. After the 4-corners introduction, it’s possible to verify the selection clicking on the button "display subarea” (a black box will appear). The selected area can be changed, clicking on the button "RESET LAT/LON” and inserting the new corners. COVIS 3.0 - User Manual 15 5.3 Data processing and outputs results from standard runs As described in the introduction of this User Manual, the core of our study is the evaluation of the covariance matrix of satellite images to describe the spatial variability of the area of interest. This information can be also used to increase the quality of the satellite products using in situ observational resources (if available) for merging with the image under study. In this paragraph we briefly introduce methods and algorithms that we have developed (more details can be found in references [2] and [3]) to explain in details the procedures to implement them with COVIS 3.0. 5.3.1 Covariance evaluation One of goals of the COVIS 3.0 is to evaluate the covariance of satellite images to describe their spatial variability. To accomplish this, we have developed a method to decompose the observed fields into spatially varying mean and Gaussian residual fields. The approach is based on an isotropic diffusion operator that preserves frontal structures: − ∇ψ t K r (1), ψ ( x , t ) = ψ (0, t ) + ∫ ∇ ⋅ e ∇ψ dt 0 r where ψ ( x , t ) represents the oceanographic measured field from the satellite at a given time t and with a known observation error (in other words: the image). r Using an optimization process that finds the Gaussian residual field ( ε (x ) ), the r covariance of ε (x ) is assumed to be a function of the relative distance between two points: 2 r r v r ε ( x )ε ( x ' ) = cε ( x − x ' ) (2). This property will allow uncertainties to be computed at different locations without performing real in situ measurements. The Covariance in Equation (2) is computed numerically and fitted to a covariance model (Gaussian, exponential, spherical, etc). To better explain this concept, we present a covariance example using an image of Sea Surface Temperature (SST) with the Advanced Very High Resolution sensor AVHRR onboard NOA remote sensing satellite (this image have been provided with COVIS 3.0: COVIS 3.0/SAMPLE_IMAGE\GEOTIFF \ 2009.0606.1144.n18.sst.gtiff). In particular we present result from the working area with min LON = 14.2, max LON = 14.65, min LAT = 39.2 and max LAT = 39.65. To better appreciate the temperature fronts we have modified the colormap (min value = 21, max value 25.5 decimal degrees. That sub area was decomposed using Equation 1 into a spatially varying mean and Gaussian Noise fields (as showed in Figure 10). That covariance evaluation was performed using a default satellite standard deviation of 0.5 that represents the satellite error. However, if this is known a priori (from in situ match-up) the user can alter. COVIS 3.0 - User Manual 16 Figure 9: COVIS results after the STEP 2. The black box overlays the user selected area (size ~54 by 53 kilometres). Mean Field Selected Area Residual Field Residual’s Histogram Figure 10: Mean field and Gaussian Residual field r ε (x ) is a Gaussian realization with a mean of 0.0047 and a standard deviation of r ε (x ) µ ε = 0.0047 of the selected area. and a standard deviation of 0.2047. The covariance was evaluated using Equation 2 and fitted to a covariance model (as displayed in Figure 11), where the value at zero spatial lags is obtained by an exponential fitting of the obtained curve. In particular, in this case, the fitting law is given by the following equation: COVIS 3.0 - User Manual 17 r r Cε ( x − x ' ) = 0.0145 ⋅ e r r − x−x' 3476 (3). Figure 11: Covariance in terms of the spatial lag obtained on the clear SST area of Figure 10. The wave like behaviour starts around 14 kilometres. It’s important to note that the observed “wavelike behavior” (for distances bigger than 14 kilometers) is an artifact of the longitudinally banded structure in the original image (that depends of the sensor error). This step can be repeated on different areas, clicking on “Reset Lat/Lon”, while it’s also possible to load a new image, clicking on the button "Reload New Sat Image". The waiting time of this computation depends on the size of the selected area - if any sub-area are identified, the covariance will be evaluated on the entire image. 5.3.2 Merging procedure Merging remote sensed observations with in situ measurements is a standard procedure to improve the quality of satellite-derived products. The approach is to study spatial-temporal variability in the satellite imagery and to distribute in situ sampling over the image following the covariance criterion. Therefore, once the covariance C has been obtained from Equation (2), a new field, merging in situ and satellite data, is retrieved maximizing the following probability distribution: −1 P(ψ K ) ∝ exp[−(ψ obs − Hψ k ) T ∑obs (ψ obs − Hψ K ) − (ψ K − ψ ) T C −1 (ψ K − ψ )] (4), where ψ K represents the estimated pixel value, ψ obs is the observation vector, H is the observation matrix and ∑ obs is the observation error matrix. The first part in the exponential represents likelihood density while the second product of the matrices COVIS 3.0 - User Manual 18 represents a priori probability. This merging procedure is performed maximizing the a posteriori probability distribution; therefore the best estimation is represented by the field ψ: ( ) −1 ψ merged = arg min (ψ obs − Hψ k )T Σ obs (ψ obs − Hψ k ) − (ψ k −ψ )T Cε−1 (ψ k −ψ ) ψ (5). The solution of Equation (5) represents the merged image. In the next Chapter we present some results on the merging procedure, however before to proceed, it is important to point out the fact that the merging technique can be applied to in situ measurements that verify the following conditions (exclusion criteria): In situ and satellite acquisitions have to be measured at the same day and same time (or at least with +/-1 hour of difference); In situ acquisitions have to be taken with low wind condition (less than 12 ms) and when the solar zenith angle is lesser than 70 degrees. The satellite area has to be cloud free or with a cloud cover less than 10-15%. This condition is important because it has been demonstrated that covariance analysis is directly dependent on clouds size/position (amount of information), in the sense that the introduction of clouds causes a loss of information and decrease in the correlation length (as expected). More details can be found in References [2] and [3]. COVIS 3.0 - User Manual 19 6. EXAMPLE COVIS 3.0 RUNS In this paragraph we report an example of COVIS 3.0 utilization; in particular we present an example of implementation (covariance analysis and merging) that has been retrieved using SST AVHRR image and an in situ ship track that have been performed by the N/RV Alliance (NATO vessel). STEP 1. Set the MATLAB current directory in the GUI folder path (e.g. D:\Desktop\COVIS, as in Figure 12a). To launch the program from the Command Window: type covis in the MATLAB Command Window and press ENTER (as in Figure 12b). a b Figure 12: Initialization procedure to run COVIS 3.0: the user has to set own current directory and launch the program from the MATLAB Command Window. STEP 2. From the COVIS GUI, click on the button Load Satellite Image to ingest the SST AVHRR image (D:\Desktop\COVIS\SAMPLE_IMAGE\GEOTIFF\ 2008.0820.1211.n18.sst.gtif), following the instruction described in paragraph 5.1 and displayed Figure 2. STEP 3. To load the in situ data, click on the button "Load in situ data" and select the in situ that are available here: D:\Desktop\COVIS\sample_insitu_ligurian. The data set used in this example represents a SST track performed by the N/RV Alliance (NATO vessel) during a cruise that was performed at the same time of the AVHRR acquisition. STEP 4. To explore the image and to define the area of interest you have to click on the "Zoom in" and the right mouse button can be used to select the region of interest. The Min/Max values of the color-scale are displayed automatically but they can be changed, inserting the desired values on the lower part of the window (as in Figure 13). STEP 5. Once time the sub-area was identified for the processing (covariance evaluation), four corners have to be inserted. In this case we focus the attention on longitude from 9.2 to 9.7 (min and max LON) and latitude from 43.4 to 44.1 (min and max LAT), as showed in Figure 14. NOTE THAT: once time the black box area was defined and displayed in the GUI, it’s not possible to change the colormap values. STEP 6. To evaluate the covariance, click on the “Covariance” button. The calculation-time depends on the size of the area selected and the covariance results will be displayed in a GUI figure (Figure 15) that displays the covariance length for the area. STEP 7. Once the covariance have been evaluated, it is possible to merge the previously loaded in situ data with the original satellite image. Figure 16 displays the final results of merging. COVIS 3.0 - User Manual 20 Figure 13: Satellite and in situ data ingestion. NURC GUI can read several formats of data, as described in detail in Chapter 5. Once time the image and the in situ track have been ingested, click on the button Zoom in to zoom on the area of interest and to identify the corners for the processing. The Min/Max values of the color-scale are displayed automatically but they can be changed, inserting the desired values on the lower part of the window. In this case, to better visualize shapes the color-scale have been re-defined between 22 and 28 degrees. Figure 14: We focus the attention on longitude from 9.2 to 9.7 (min and max LON) and latitude from 43.4 to 44.1 degrees (min and max LAT). COVIS 3.0 - User Manual 21 Figure 15: (a) Mean field and Gaussian Residual field of the selected area. (b) Isotropic covariance is modelled by an exponential law. The intrinsic standard deviation of the filed is 0.035 and the e-folding distance around 7 km. Figure 16: Results from the merging, the white dots represent the ship trajectory. (a) Merged Image. (b) difference between merged and original image. COVIS 3.0 - User Manual 22 7. REFERENCES [1] G. Pennucci, A. Alvarez and C.Trees, A Satellite Covariance-Based Method to evaluate the variability in uncertainty maps generated from satellite ocean color imagery, NURC report. [2] G. Fargion, G. Pennucci, A. Alvarez, C. Trees, R. Arnone, A methodology for calibration of hyperspectral and multispectral satellite data in coastal areas, SPIE, paper number 8372-19 [3] G. Pennucci, A. Alvarez and C. Trees, Study of covariance as a function of cloud cover, NURC report, under progress, December 2010. COVIS 3.0 - User Manual 23