1
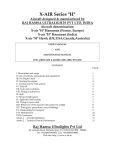
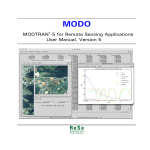
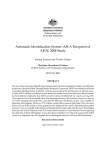
The Operation of a Three Wavelength Nephelometer and
some Measurements Made at Jabiru during 2002
S. B. Carr and M. A. Burridge
Intelligence, Surveillance and Reconnaissance Division
Information Sciences Laboratory
DSTO-TN-0594
ABSTRACT
The operation of a three wavelength integrating nephelometer is explained and summarised.
This instrument was purchased by ISRD for studies of atmospheric aerosols which play an
important role in the propagation of electro-magnetic radiation from the UV through to the
mid wave IR. Preliminary results are also reported on the aerosol scattering coefficient
measurements made during the months of September through Novemebr 2002 at Jabiru in
Kakadu National Park. This data will form the intial part of a long term aerosol monitoring
program in the region to be conducted jointly by DSTO and CSIRO. The instrument has been
re-installed at Jabiru from about mid September 2004 on an ongoing basis to enable data to be
collected on the seasonal variation in aerosol properties. Details on the instrument's
performance on an aircraft during experiments conducted during 2003 will be presented in
separate reports .
RELEASE LIMITATION
Approved for public release
Published by
DSTO Information Sciences Laboratory
PO Box 1500
Edinburgh South Australia 5111 Australia
Telephone: (08) 8259 5555
Fax: (08) 8259 6567
© Commonwealth of Australia 2004
AR-013-268
November 2004
APPROVED FOR PUBLIC RELEASE
The Operation of a Three Wavelength Nephelometer
and Some Measurements Made at Jabiru during 2002
Executive Summary
The principle aim of task LRR 01/205, part of which is outlined in this report, is to
improve DSTO’s knowledge and understanding of the atmospheric aerosol in the top
end of the Northern Territory. An aerosol is a suspension of finely divided matter
(liquid or solid) dispersed in a gaseous medium such as air. It primarily impacts on
sensors sensitive to radiation with wavelengths in the UV (10 nanometres) through to
the mid wave IR (5000 nanometres) range, through scattering of radiation causing
degradation in the signal received at the sensor.
To measure the optical properties of the atmospheric aerosol DSTO has acquired a
three wavelength integrating nephelometer from TSI (model 3563). This instrument
measures the scattering coefficient of the aerosol at three visible wavelengths denoted
here as blue, green and red. The extinction (absorption + scattering) coefficient is the
basic quantity that is used to predict the amount of transmission loss in the atmosphere
due to both molecular and particulate absorption and scattering. The outcome of the
activity reported on here forms a small part of the overall R&D output of the task,
which is dominated by the aircraft measurements of the atmospheric aerosol obtained
during experiments conducted in 2003. These aircraft measurements were undertaken
in the Northern Australian dry season around the region of Jabiru in Kakadu National
Park. This work will be reported on separately. The major outcomes of the work
reported on here are the obtaining of data on the diurnal properties of the aerosol
scattering coefficient over a three-month period at Jabiru and knowledge on the longterm performance of the nephelometer.
The instrument was installed in a laboratory located at ERISS [11] field station opposite
Jabiru airport. A suitable stack was identified as being ideal to allow access to external
air whilst providing shelter for the instrument itself. The instrument was installed and
sampling lines were used to both collect the aerosol, transport it to the instrument and
to exhaust the sample of air after the measurement was complete. Data was logged to
an in-situ PC via a standard serial connection. Proprietary TSI software was used to
interface with and control the nephelometer. To interface with the in-situ PC a dial-up
network connection was made from a laptop located at Edinburgh. The remote
desktop software that comes inbuilt with the windows XP operating system was used
to run the software located on the in-situ PC. Data was also transferred back to DSTO
on a daily basis and backed-up immediately. All aspects of this activity are unclassified
including most notably the data collected. Nonetheless a permission to operate was
obtained through the appropriate authorities covering the time the dial-up connection
was in use.
These results will form part of the larger study being undertaken for task LRR 01/205
Atmospheric Aerosol Research. The main outcome of this task will be to obtain
knowledge on regional aerosol properties and hence improve DSTO’s ability to apply
models of the atmosphere accurately to the prediction of the performance of electrooptic and infrared sensors. The atmosphere is one part of the total picture, which must
also include accurate knowledge on the effect background; targets and the sensor
architecture itself have on the performance of these types of sensors in our region and
beyond. Further results from the task will be reported on separately including the
detailed airborne studies conducted in 2003. The implications of all these
measurements on the use of atmospheric models such as MODTRAN will also be
covered in a separate report.
Contents
1. INTRODUCTION ............................................................................................................... 1
2. THE INSTRUMENT ........................................................................................................... 1
2.1 Calibration and Maintenance ................................................................................. 5
3. LOCATION AND SET-UP ................................................................................................ 7
4. NEPHELOMETER DATA................................................................................................ 10
5. CONCLUSIONS AND FUTURE WORK...................................................................... 14
6. ACKNOWLEDGEMENTS............................................................................................... 16
7. REFERENCES..................................................................................................................... 17
DSTO-TN-0594
1. Introduction
As part of the research activities being conducted under the umbrella of the long-range
research task LRR 01/205 Atmospheric Aerosol research, DSTO in collaboration with
CSIRO’s Earth Observation Centre (EOC) placed a three wavelength integrating
nephelometer (neph) at a site in Jabiru located inside Kakadu National Park. The
instrument was operated from the 3rd of September to the 20th of November 2002
covering the intense part of the dry season, which is dominated by biomass burning,
and, in the latter stages, heading into the beginning of the wet season (the build up).
The aim of this activity was to collect data on the variation in the aerosol scattering
coefficient over an approximate three-month period. It was also an opportunity to
assess the long term operating performance of the instrument.
CSIRO have a number of instruments in the field at Jabiru and other sites in Australia.
They have an ongoing research program characterising aerosol optical depth on a
seasonal basis as part of the AERONET global aerosol-monitoring program. Some of
the agencies involved in this global measurement program include NASA and the
National Oceanic and Atmospheric Administration (NOAA) from the US.
DSTO will be able to leverage this knowledge in exchange for the nephelometer data
which in turn can be used by CSIRO to test assumptions about how accurately
ground-based measurements are at predicting the aerosol extinction throughout the
entire atmospheric column. This will also be of benefit to DSTO as a complement to the
aircraft measurements and it is hoped that in combination a useful methodology will
be developed to make continued use of ground based measurements to monitor longterm seasonal trends in aerosols in the boundary layer. This will be achieved by
reinstalling the nephelometer at Jabiru on a long-term basis.
The purpose of this report is to set the context for the ongoing aerosol measurements
work being undertaken in DSTO’s Intelligence, Surveillance and Reconnaissance
Division (ISRD). The operation of the nephelometer is outlined and preliminary results
from the Jabiru deployment are presented. Future reports will cover the aircraft
measurements campaign conducted in June and September 2003 [1,2] and ongoing
ground-based aerosol measurements at Jabiru that commenced in mid 2004 in
collaboration with CSIRO.
2. The Instrument
A nephelometer [3] is an instrument designed to calculate the atmospheric aerosol
scattering coefficient. Two types of nephelometers are available; integrating and polar.
As the name suggests the integrating nephelometer covers all scattering angles giving a
total scattering coefficient. The polar nephelometer measures the scattered radiation in
1
DSTO-TN-0594
a specific direction defined by a scattering angle θ . Note this is a two dimensional
scattering plane defined by the incoming and outgoing (scattered) rays. DSTO owns
and runs a TSI Inc. model 3563 [4] three wavelength integrating nephelometer. This
instrument is designed for both ground-based and airborne measurements [5] and is
capable of being run autonomously for long-term aerosol sampling.
Figure 1: The nephelometer with and without the external cover. The lamp is clearly visible in
the first image as is the external blower and lamp fan (two black objects) in the RH
image.
The instrument is essentially an aluminium scattering chamber that is lined with light
absorbing flock paper to minimise scattering off the walls of the chamber. The aerosol
is drawn into the scattering chamber via the inlet port that has a valve enabling direct
air sampling or filtered air sampling. The filtered air option is used to measure the
Rayleigh scattering of molecules and is used to measure the background scattering
signal of the instrument due to wall scattering. During ordinary sampling the
instrument can become contaminated if the air is very polluted. Therefore it is
necessary to periodically measure the background signal to ensure that the most
accurate aerosol scattering coefficient is available to the user. The air is drawn into the
instrument using an external blower capable of delivering a variable flow depending
on the diameter and length of sampling line used and any restriction on the outlet of
the neph. A lamp provides illumination via a light pipe and cosine diffuser. A
backscatter shutter can be engaged if the backscatter signal is desired. The scattered
light passes through a series of apertures and the reference chopper and then a lens
2
DSTO-TN-0594
before being split via colour filters into blue (B), green (G) and red (R) wavelengths,
which are then detected by photo multiplier tubes (PMT) located at one end of the
instrument. At the other end of the instrument there is a light trap.
Figure 2: A schematic of the nephelometer showing the basic layout of the instrument and the
location of major components.
The reference chopper is a circular plate that makes a full rotation 23 times per second
providing the instrument with measurements of the lamp signal, PMT dark current
and direct scattering signal. Approximately half of the disc is open allowing the true
scattered light to pass through, about a quarter is opaque allowing transmission of the
light source alone and the other quarter is dark allowing measurement of the noise
signal of the PMT.
The backscatter shutter is located between the light source and the apertures when it is
engaged and then is rotated out of the way when the total scattering signal is desired.
The restricted internal geometry of the neph means that the angular integration is
truncated to between 7 and 170 degrees. This becomes particularly important when
forward scattering is expected to be important. Methods have been developed to make
corrections for the angular truncation of the neph and also to correct for the slight
non-Lambertian nature of the light source [6].
A Temperature (T), pressure (P) and a relative humidity (RH) sensor are also fitted to
the neph. Heating of the air can occur inside the instrument due to the lamp and
through the sampling line. This generally ensures that the temperature inside the neph
scattering chamber is higher than ambient, avoiding condensation. A heater is
provided to ensure that under all operating conditions sample temperature can be
maintained higher than the inlet temperature.
The instrument has an onboard signal processing capability with both calibration
constants and background wall scatter values stored in internal memory.
Communication with the instrument is via a computer running proprietary TSI
software either Nephwin or Nephlog. Alternatively data can be retrieved using a
terminal interface via a serial port. No special hardware is necessary to run the
3
DSTO-TN-0594
instrument. A single RS 232 serial port is all that is required. The instrument can be run
in two modes, polled or unpolled. In unpolled mode the neph outputs data to a
computer at predetermined intervals. This provides for very accurate timing signals.
However in unpolled mode communication with the instrument is stopped and can
only be resumed via the execution of a terminal command under the Nephwin
software or via the serial data port. In polled mode the instrument takes all of its
timing information from the logging computer and will output data at intervals set by
the user under the software. This provides the user with maximum control over the
instrument enabling alterations to be made to system parameters.
The basic functions of the instrument can be automated by placing the instrument in
auto mode. In this case the instrument will perform a zero baseline measurement
(ZBM) (background measurement) automatically according to the user-programmed
setting. Once this background measurement is complete the instrument will update its
internal settings and then revert back to measurement mode after purging the
scattering chamber. Purging of the scattering chamber is done before and after a
background measurement is made and is another timing parameter that is set by the
user. In manual mode the instrument will only enter a ZBM when instructed to by the
user via the software. Otherwise the instrument will remain in measurement mode
continuously.
In auto mode the time it takes the instrument to complete a measurement, perform a
ZBM and purge the chamber twice is referred to as the auto-zero period. Typically
sampling or averaging times are set between 1 and 5 minutes, the ZBM is 5 minutes
and the purge time varies depending on the flow rate of the instrument. As a general
rule passing about seven volumes of purged air through the scattering chamber is
desired. In reasonably clean air the auto-zero period is typically set to about 1 hour. In
very clean air often multiple ZBM are performed over longer time intervals and an
average taken. In very polluted air more frequent ZBM may be necessary. The
methodology for operating on the ground and on an aircraft is very different.
On the ground the user will typically use the auto mode for long-term unattended
monitoring of the atmospheric aerosol. The situation on an aircraft being a lot more
dynamic and generally of much shorter duration requires more flexibility as to when
ZBM measurements are performed and hence manual mode is preferred. In this case
the user determines when a ZBM is to be performed. In manual mode the averaging
time can be changed more easily with out causing a temporal misalignment between
the measurement, zeroing and purging modes, which are now engaged by the user
manually.
The raw output of the instrument is photon counts, which are then scaled and
corrected for time delays in the output of the PMT and the period of the reference
chopper. As mentioned earlier the reference chopper enables measurements of both
lamp and PMT dark current signals along with the measured signal. It is the
measurement of all these other signals that allows the neph to operate at high
4
DSTO-TN-0594
sensitivity measuring scattering coefficients two orders of magnitude better than other
nephelometers available on the market. The scaled and corrected photon count output
is then passed through a smoothing filter. This smoothing filter is a running boxcar
average that depends on the averaging time set by the user. For sampling times less
than 5 minutes the boxcar average is 1 second. Using calibration constants and frequent
measurements of the background scattering signal from the wall of the instrument the
neph then converts the smoothed scaled and corrected photon counts to scattering
coefficients which are then passed to the logging computer. Other data that is passed
to the computer includes the neph status, raw photon counts, reference chopper
revolutions and inlet T, sample T, sample RH and P. If the backscatter shutter mode is
invoked the backscatter scattering coefficients are also output. Any zero background
measurement carried out during the operation of the neph will also be logged.
For more detail on the nephelometer operation refer to the user manual [7]. For details
about nephelometer methodology and the performance of the instrument the papers
by Anderson and Ogren are excellent [6,8]. The user is cautioned against applying
results from other 3563 nephelometers to their own as each instrument will have
slightly different operating characteristics and hence noise performance and sensitivity
limits should be assessed on an instrument-by-instrument basis.
2.1 Calibration and Maintenance
The instrument requires calibration taking into account changes in the performance of
the PMT, lamp, any degradation in the colour filters and or reference chopper and
contamination of the scattering chamber. Calibration is typically undertaken using two
span gases CO2 and filtered ambient air. Ideally the filtered air low span gas should
always be at the same temperature and RH so the use of a controlled air source may be
preferred. Industrial grade 99.9% pure CO2 is used to provide the most accurate high
span gas scattering coefficients. The calibration procedure is outlined in the user
manual and under the Nephwin software where there is a calibration menu option
with a checklist of the procedures to be followed.
Depending on the blower power setting the neph should initially be purged with
filtered air for approximately 7 minutes. This is a slightly conservative figure and
assumes a very low flow rate of 5 litres per minute (lpm) but will guarantee that the
instrument is purged of any remaining particle laden air. Following the purging of the
instrument, filtered air measurements should follow for at least 300 seconds to obtain a
measured value for the Rayleigh scattering coefficients of air (the Nephwin software
displays photon counts during the calibration only). These values should then be
stored in the neph. The external cover then needs to be removed to allow access to the
small blue filter, which should be detached from the inlet. The neph main inlet port
and the outlet should then be plugged. CO2 should then be fed into the secondary inlet
connection at a rate of 5 lpm and should be felt exiting the blue filter in the opposite
direction to the arrow on the filter. This end of the filter should be connected to a
5
DSTO-TN-0594
sampling line and the CO2 exhausted outside for safety reasons. Again the neph
should be purged for 7 minutes and then a 300 second CO2 measurement should
commence. The results of the CO2 measurement should then be stored in the neph.
The displayed calibration constants should then be assessed for accuracy by
comparison with values referred to in the user manual and the previously stored
values. If the user is satisfied with these constants they should be saved along with a
calibration string identifying the time, date, span gases used and the individual who
undertook the calibration. The instrument should then be purged of CO2 and a ZBM
performed so the instrument is then ready for measurements again.
A calibration should be performed as necessary. In the case of long-term continuous
aerosol sampling this should be done routinely with the maintenance schedule. At a
minimum the lamp needs to be replaced after about every three to six months if
operated at 75 watts. Other nephelometer lamps have lasted six months at 75 watts
when left to run continuously [9]. The lamp current should be monitored regularly and
if the lamp starts to draw a large current then it should be replaced. This should be
done before the lamp stops working to avoid any potential damage to the onboard
circuitry of the instrument. Typically the lamp draws about 6 amps when operating at
75 watts. If the current rises above 7 amps the lamp should be replaced. At this time the
instrument should be cleaned and the components checked and then a calibration
should be performed. Currently, the manufacturer provides no expected lifetime of the
PMT but their performance should be monitored and if dark current levels become
unacceptably high they should be replaced. The colour filters should be examined for
any cloudiness, which is an indication of deterioration of the coating on them due to
high moisture levels (which should be avoided if possible). Again depending on the
level of cloudiness these filters may need to be replaced. The reference chopper, light
pipe lens, and back scatter shutter should be cleaned using a soft lint free cloth and in
the case of the light pipe lens and the opaque section of the reference chopper they
should be cleaned with a small amount of isopropyl alcohol. Under no circumstances
should isopropyl alcohol come into contact with any of the black surfaces. Other
groups suggest against cleaning these components unless absolutely necessary [10].
To clean these components of the instrument the scattering chamber will need to be
taken apart. The procedures for doing this and for maintenance of the components
mentioned above are contained in the user manual. Clean compressed air should be
used to clean the flock paper and remove any dirt or debris from within the scattering
chamber including the light trap. The temperature, pressure and humidity sensors
should be monitored for accuracy and replaced if they malfunction or become too
inaccurate. The High Efficiency Particulate Air (HEPA) filter used to provide the
filtered air measurement should be checked for blockages if there is a significant
increase in the pressure drop across the filter. Otherwise it should be replaced every six
months. The small blue DQ filter used to provide filtered airflow to the light pipe lens
should be replaced every 12 months.
6
DSTO-TN-0594
3. Location and Set-up
To protect the instrument from environmental impact it was decided that it should be
installed inside one of the laboratories located at the ERISS [11] field station in Jabiru. A
suitable stack was identified as being ideal for allowing access to outside air.
Due to the strict requirements of isokinetic sampling it was decided to mount the
nephelometer inlet directly under the stack so that a length of straight tubing could be
used to transport the aerosol to the instrument. Approximately 3 metres of 22.2 mm
I.D. stainless steel (ss) tube was used to transport the aerosol. Stainless steel was chosen
for its robustness and excellent sampling characteristics. The inlet end of the tube was
chamfered on the outside to a knife-edge providing a sharp edged inlet. We are not
interested in size selective sampling so this is the best that can be done to accommodate
the variable wind speed and directions encountered. A more sophisticated sampling
arrangement could be used that would involve drawing a huge volume of air through
the larger external stack (of the order of 1000 lpm) with the smaller nephelometer tube
sampling from this airflow within the stack. This is the optimal arrangement however
it is beyond the current financial and infrastructure restrictions that DSTO is currently
operating under.
The blower was set to operate at a 5% power setting producing a flow rate of
approximately 20 lpm. This is a relatively high flow rate and hence we can expect
some particle losses at the inlet of the ss tube as we are sampling from still air. Wind
speed and direction being variable will also affect sampling performance. The
mismatch in air speed and direction outside and inside the sampling line violate strict
isokinetic sampling conditions. This is most likely to impact on particle sizes above 5
µm and certainly above 10 µm since the larger diameter particles cannot follow the
streamlines if the airflow is convoluted. Estimates for aspiration and transport losses
[12] can be made using theoretically and empirically determined equations such as
found in the aerosol calculator program written by Paul Barron [13]. Transport losses
are expected to be small since a length of straight uniform diameter ss tube was used so
there are no gravitational settling losses or deposition losses due to the absence of
bends and constrictions. The tube Reynolds number is in a region that indicates the
flow can become turbulent depending on the initial conditions. We feel that based on
the measurements of the flow rate (stable) we made in the laboratory and the results
obtained for the measured scattering coefficient the flow was not likely to be turbulent.
Even so estimates for turbulent inertial deposition losses can be made using the aerosol
calculator program (similarly for other transport losses). Diffusion losses are expected
to be small since the relatively high flow rate means the sample does not have a very
long residence time in the sampling line. The same justification applies for
diffusiophoretic losses. Electrostatic losses are eliminated by using a grounded
conductive transport tube and thermophoretic losses are mitigated against since the ss
tube is housed inside a stack which is most likely at a higher temperature than outside
7
DSTO-TN-0594
air and the section in the laboratory is insulated using black insulating rubber.
Thermophoretic losses are difficult to estimate in a sampling line due to the difficulty
in measuring the required temperature gradients. There may be some small losses at
the ss tube neph interface. The ss tube slides inside an adaptor, which is threaded into
the inlet port (two grub screws in the adaptor hold the ss tube in place) and butts up
against a horizontal bar installed by the manufacturer presumably to prevent large
debris from entering the scattering chamber and to prevent the sampling line from
blocking the filtered air inlet.
For this report no attempt has been made to make corrections for aspiration and
transport losses or to correct for the effects of the angular truncation of the neph and
the slight non-ambertian nature of the light source. The major source of particle loss is
expected to be at the inlet of the ss tube. This analysis should be done for future
measurements and if this data is to be used in further studies.
The other end of the ss tube was covered with a wired mesh dome to protect the inlet
from insects and debris. This was then placed under a rain hat that had a wire fence
around it sealing the inlet off from larger pests such as birds and rodents. The inlet was
mounted above the roof and the ss tube then passed down though the stack into the
laboratory to the instrument. The lower part of the stack was then sealed around the ss
tube. Exhausting the aerosol from the neph is much less of an issue as strict sampling
requirements are not necessary. Three quarter inch plastic tubing was used connecting
the neph outlet to an exhaust port mounted on an aluminium plate that was fitted to
the window in the laboratory. In this way the inside of the laboratory was completely
sealed off from the outside and the neph was able to continuously sample outside air
whilst remaining secure and protected inside the lab.
8
DSTO-TN-0594
Figure 3: Left hand image shows the rain hat with wire fence and wire mesh dome visible. The
stainless steel tubing is barely visible protruding above the white section of the mesh
dome. The ss tube descends into the lab, contained inside the larger stack, where it
couples to the neph. The right hand image shows the ss tube protruding below the
lower half of the stack inside the lab. It is covered with black rubber to provide
thermal insulation from laboratory temperature variation. The plastic tube couples
the neph outlet to the exhaust port mounted in the aluminium plate situated in the
window.
Figure 4: The plastic tube couples to the exhaust port in the window (LHS). The RH image
shows an external view of the aluminium plate mounted in the window with another
wire mesh dome covering the outside of the exhaust port to prevent contamination.
The upper port was for external wires for the unused portable weather station.
9
DSTO-TN-0594
To neph was operated via software installed on a stand-alone computer. This computer
was also used to log data. The computer was connected to the neph via a standard RS
232 serial connection. All control of the neph was possible via this software except for
the turning on and off of the instrument power supply.
To interface with the instrument a standalone laptop was used at DSTO Edinburgh via
a dial-up network connection using the remote desktop software that comes in built
with the Windows XP operating system. This connection was sufficient to allow a user
to control the neph via the software located on the in-situ computer and to download
data files on a daily basis back to the laptop located at DSTO. The laptop located at
DSTO was an unclassified standalone machine as was the in-situ PC. The use of the
dialup connection over that three-month period was consistent with DSTO and
Defence security standing orders. All the data collected and the operation of the neph
is unclassified. Even so a permission to operate was sought and obtained for the period
of operation of the dialup connection.
4. Nephelometer Data
The nephelometer logs scattering coefficients for blue, green and red wavelengths
according to the averaging time set by the user. Averaging times can range between 1
second and typically 5 minutes depending on how clean the air being sampled is.
For these initial measurements the neph was operated in total scatter mode only. The
magnitude of the observed scattering coefficients was large and hence it was decided
to set the averaging time to 1 minute allowing the instrument to respond to any rapid
temporal changes in the aerosol. Whilst it is useful to have this data it is too much to
present. To simplify the data presentation hourly averages were calculated and
displayed as weekly temporal charts of the scattering coefficient. This is still a great
amount of data so further averaging was done to calculate weekly averages and
monthly averages. The monthly average will be of most value when multiple years’
worth of data has been collected to enable any changes in the seasonal properties of the
aerosol to be observed. For the limited deployment of approximately 3 months the
weekly average provides enough of a summary to show the major trend in the aerosol
over that period.
For select weeks we have also chosen to display the hourly average charts to highlight
how the aerosol varies diurnally mainly due to RH effects and then across days and
weeks due to local fires.
10
DSTO-TN-0594
Weekly Means - 2002
3.00E-04
Scattering Coefficient m-1
2.50E-04
Blue
Green
Red
2.00E-04
1.50E-04
1.00E-04
5.00E-05
0.00E+00
3-6 Sep 7-13 Sep
14-20
Sep
21-27
Sep
28Sep- 5-11 Oct
4Oct
12-18
Oct
19-25
Oct
26Oct1Nov
2-8 Nov 9-15 Nov
16-20
Nov
Week
Figure 5: This chart shows the weekly means covering the period of the sensor deployment. It
can be misleading in that although the site at Jabiru was exposed to larger levels of
biomass smoke in October resulting in the larger scattering coefficients there was in
fact no more biomass burning occurring over the top end as a whole in October as
can be seen by examining the fire maps (Fig. 5).
11
DSTO-TN-0594
Hourly Means
3.00E-04
Scattering Coefficient m-1
2.50E-04
Blue
2.00E-04
Green
Red
1.50E-04
1.00E-04
5.00E-05
0.00E+00
9/21/2002 9/21/2002 9/22/2002 9/22/2002 9/23/2002 9/23/2002 9/24/2002 9/24/2002 9/25/2002 9/25/2002 9/26/2002 9/26/2002 9/27/2002 9/27/2002 9/28/2002
0:00
12:00
0:00
12:00
0:00
12:00
0:00
12:00
0:00
12:00
0:00
12:00
0:00
12:00
0:00
Day
Hourly Means
2.50E-03
2.25E-03
2.00E-03
Scattering Coefficient m-1
1.75E-03
Blue
Green
1.50E-03
Red
1.25E-03
1.00E-03
7.50E-04
5.00E-04
2.50E-04
0.00E+00
10/19/02
0:00
10/19/02 10/20/02
12:00
0:00
10/20/02 10/21/02
12:00
0:00
10/21/02 10/22/02
12:00
0:00
10/22/02 10/23/02
12:00
0:00
10/23/02 10/24/02
12:00
0:00
10/24/02 10/25/02
12:00
0:00
10/25/02 10/26/02
12:00
0:00
Day
Figure 6: Hourly average temporal traces of the scattering coefficient over a week in September
and the last week of October.
The gaps in the data are due to power outages beyond the approximately 1 hour
lifetime of the UPS backup. The reliability of the power supply is an issue that has been
identified for the future as critical. This would not only avoid large gaps in the data but
12
DSTO-TN-0594
also would allow a much more straightforward analysis of the raw data to extract
initially hourly averages. Having the higher order temporal data is useful but in future
the averaging time of the neph shall be set to 5 minutes to limit the amount of collected
data. This will be sufficient to enable the major temporal trends in the atmospheric
aerosol in and around Jabiru to be observed whilst keeping the data to manageable
levels
Figure 7: Sentinel fire spot maps showing the total number of observed events during the
weeks under consideration. The top map is for the period 21-28 September and the
bottom map is for the 19-26 October. The white dot locates Jabiru.
Examining the sentinel fire spot data [14] for these two weeks we see that there is a
greater spread of fires in the region East of Jabiru across the Arnhem Land Plateau in
September. The most likely explanation for the increased scattering coefficient in
13
DSTO-TN-0594
October is that the prevailing winds over night were from the North exposing the site
at Jabiru to the smoke from the large cluster of fires just North of Jabiru. In September
with similar weather patterns the absence of fires in this region results in smaller
measured scattering coefficients. Furthermore the increase in RH over night results in
hydroscopic growth of the smaller smoke particles bringing them into a size range
where their impact on light scattering is much greater.
Historical met data support this with wind roses from Jabiru airport between 1978 and
2002 indicating that from 6pm through to about 12 am winds are predominately
Northerly in October.
The combination of the RH increase and wind direction overnight plus the location of
the cluster of fires to the North of Jabiru in October is the most likely explanation for
the large increase in scattering coefficients.
This highlights the need to carefully articulate the prevailing weather conditions and
burn conditions in the region for the period during which measurements are being
undertaken. Quite obviously prevailing weather conditions, particularly wind
direction, are likely to be more or less the same year after year. The exception may be
during unique weather events such as an El Nino event. However the location, number
and intensity of fires may change year to year in the same region for the same month.
Long term monitoring taking into account the quasi randomness of fires is necessary to
gain a long term appreciation of the ongoing effects of biomass burning on the aerosol
in the region and hence ultimately on the scattering of light.
We can also conclude that in all likelihood September’s and November’s results are
more representative of typical scattering coefficients across the Arnhem land plateau as
most of the smoke being measured in these months will have emanated from fires East
of Jabiru in Arnhem land (Fig 5). The winds are predominantly from the East in the
daytime. Smoke levels as a general rule during these latter months of the dry season
are very high and form a constant haze layer. October’s results tend to reflect the
potential (in this case realised) impact of specific local fires on measurements due to, as
was discussed, a combination of fire numbers, fire locations and weather conditions.
5. Conclusions and Future Work
The nephelometer was seen to operate reliably and continuously without any
problems. The issue of unreliable power was beyond the control of DSTO and attempts
were made to mitigate this by using a UPS capable of providing approximately 1 hour
of backup power.
After returning the instrument to DSTO it was taken apart to be cleaned and was found
to be in good condition with no major signs of deterioration. There was some
14
DSTO-TN-0594
indication that the colour filters were starting to deteriorate particularly the red filter
with a slight cloudy appearance around the edges.
This initial installation proved successful in that we have demonstrated that one can
sample reliably without exposing the instrument to the environment and without
contaminating the ambient air with debris, insects and birds. The initial results
highlight the need to have good ground truth about prevailing weather conditions and
good information about the number and location of fires. Future data analysis should
include comparison with column-integrated measurements such as those obtained
with a sun photometer. This would enable us to ascertain how well knowledge about
the ground level aerosol scattering coefficient can help to explain the aerosol extinction
throughout the entire atmospheric column.
The accuracy of the data will depend on how significant the sampling losses were and
to a lesser extent the angular truncation effect of the instrument itself. The use of a
thin-walled inlet is common practice since this produces the least disturbed airflow at
the entrance of the inlet. As mentioned there exists theoretically and empirically
determined expressions for losses at the entrance of a thin walled inlet under still air
and low airflow sampling conditions. Additional analysis of the meteorological data
should be undertaken to determine what the average wind speed and direction was
during periods of the deployment so that these values can be used as input to the
theoretical expressions. The transport time was relatively short such that effects of
aerosol agglomeration or break-up for larger particles would be insignificant.
Since RH affects the aerosol scattering coefficient, future measurements should attempt
to measure the aerosol at close to ambient RH or at a fixed RH by controlling the
temperature of the stainless steel sampling line. For year long sampling the preference
is to measure the scattering coefficient at a low RH <40% (dry scattering coefficient) to
avoid high levels of humid moist air entering the nephelometer, which can ultimately
increase and add to the deterioration of the coatings on the colour filters. This is
particularly the case at Jabiru where in the wet season the absolute water content of the
atmosphere is extremely high.
Meteorological data will also need to be collected again from the weather station at
Jabiru airport so that, in particular, knowledge about the ambient RH is available. The
RH sensor inside the neph will provide this for the sample air. Corrections can then be
made for the effect of RH changes using knowledge about f(RH) [1,15] obtained from
the region.
Future deployments will involve the semipermanent installation of the instrument for,
potentially, a period of years. With a reasonable maintenance schedule and based on
the performance of the instrument to this point we are reasonably confident that this
can be achieved at minimal cost and effort. Essentially then this becomes a free source
of data on the seasonal changes in aerosol properties in the region around Jabiru. When
combined with the airborne measurements conducted in 2003 this should provide a
15
DSTO-TN-0594
fairly comprehensive picture of the aerosol and hence enable knowledge about this to
be fed into atmospheric models such as MODTRAN or potentially even for correction
of satellite imagery and aerosol retrieval.
6. Acknowledgements
The authors would like to acknowledge discussions with CSIRO and Queensland
University of Technology, in particular with Dr Ross Mitchell and Dr John Grass of
CSIRO’s Division of Atmospheric Research. The assistance of DSTO Scientific and
Engineering services (SES), in particular Mr Ian Watson, at short notice is also much
appreciated. The assistance of Mr Peter Willcocks in producing some of the hourly
average nephelometer data is acknowledged.
The support and assistance of staff at ERISS was also extremely valuable. In particular
we wish to thank the manager of the Jabiru field station Don Elphick, Helen Waterson
for assisting with accommodation and minor technical support (those annoying
blackouts), Bruce Ryan who was the initial contact at ERISS and staff working at ERISS
who provided assistance at one time or another and for generally putting up with the
intrusion of the nephelometer.
16
DSTO-TN-0594
7. References
1. Carr S. B., Gras J. L., Hackett M. T. and Keywood M. D. (2004), Aerosol
Characterisation in the Northern Territory of Australia during the Dry Season with
an Emphasis on Biomass Burning, DSTO Research Report DSTO-RR-XXXX (to be
submitted November 2004)
2. Carr S. B. (2004), Transcontinental Aerosol Measurements from Adelaide to
Darwin, DSTO Research Report DSTO-RR-0285
3. Heintzenberg, J. and Charlson R. J. (1996) Design and Application of the Integrating
Nephelometer: A Review, J. Atmos. Oceanic Technol. 13 987-1000
4. http://www.tsi.com/particle/downloads/brochures/3563.pdf
5. Bodhaine B. A., Ahlquist N. C. and Schnell, R. C. (1991) Three-wavelength
Nephelometer Suitable for Aircraft Measurement of Background Aerosol Scattering
Coefficient, Atmospheric Environment 25A(10) 2267-2276
6. Anderson, T. L. and Ogren, J. A. (1998) Determining Aerosol Radiative Properties
Using the TSI 3563 Integrating Nephelometer, Aerosol Sci. Technol. 29 57-69
7. TSI Inc. (April 2001) Model 3550/3560 Series Integrating Nephelometer, Instruction.
Manual, part number 1933563
http://www.tsi.com/particle/downloads/manuals/1933563d-3550-3560.pdf
8. Anderson, T. L. etal. (1996) Performance Characteristics of a High-Sensitivity,
Three-Wavelength, Total Scatter/Backscatter Nephelometer, J. Atmos. Oceanic
Technol. 13 967-986
9. Ogren, J. A. (July 2004) Private Communication, NOAA Climate Monitoring and
Diagnostics Laboratory
10. Sheridan, P. J. and Ogren. J A. (2004) Private Communication, TSI Model 3563
Integrating Nephelometer Operations Reference Manual, NOAA Climate
Monitoring and Diagnostics Laboratory
11. ERISS – Environmental Research Institute of the Supervising Scientist field station
located at Jabiru East opposite Jabiru airport http://www.deh.gov.au/ssd/
12. Brockmann J. E. (2001), Sampling and Transport of Aerosols. In: Baron P. A. and
Willeke K. (eds) Aerosol Measurement: Principles, Techniques and Application, 2nd
Edition. John Wiley and Sons, New York, Chap 8.
17
DSTO-TN-0594
13. Barron P. A. (2001), Aerosol Calculator Program
http://www.tsi.com/particle/downloads/software/software.htm
14. Dyce, P. (May 2004) Sentinnel Hotspots, CSIRO Land and Water
http://www.sentinel.csiro.au/
15. Gras J. L. etal. (1999), Some Optical Properties of Smoke Aerosol in Indonesia and
Tropical Australia, Geophys. Res. Letters 26(10) 1393-1396
18
DISTRIBUTION LIST
The Operation of a Three Wavelength Nephelometer and some Measurements made at
Jabiru during 2002
S. B. Carr and M. A. Burridge
AUSTRALIA
DEFENCE ORGANISATION
No. of copies
Task Sponsor
Chief of ISR Division
S&T Program
Chief Defence Scientist
FAS Science Policy
AS Science Corporate Management
Director General Science Policy Development
Counsellor Defence Science, London
Counsellor Defence Science, Washington
Scientific Adviser Joint
Navy Scientific Adviser
Scientific Adviser – Army
Air Force Scientific Adviser
Scientific Adviser to the DMO M&A
Scientific Adviser to the DMO ELL
1
}
Information Sciences Laboratory
Research Leader – Imagery Systems (Jackie Craig)
Head IEOS
S. B. Carr
M. A. Burridge
shared copy
Doc Data Sheet
Doc Data Sheet
1
Doc Data Sht & Dist List
Doc Data Sht & Dist List
Doc Data Sht & Dist List
Doc Data Sht & Dist List
Doc Data Sht & Dist List
Doc Data Sht & Dist List
1
5
5
DSTO Library and Archives
Library Edinburgh
Defence Archives
2
1
Capability Development Group
Director General Maritime Development
Director General Capability and Plans
Assistant Secretary Investment Analysis
Director Capability Plans and Programming
Director Trials
Doc Data Sheet
Doc Data Sheet
Doc Data Sheet
Doc Data Sheet
Doc Data Sheet
Chief Information Officer Group
Deputy CIO
Director General Information Policy and Plans
AS Information Strategy and Futures
AS Information Architecture and Management
Director General Australian Defence Simulation Office
Director General Information Services
Doc Data Sheet
Doc Data Sheet
Doc Data Sheet
Doc Data Sheet
Doc Data Sheet
Doc Data Sheet
Strategy Group
Director General Military Strategy
Director General Preparedness
Assistant Secretary Strategic Policy
Assistant Secretary Governance and Counter-Proliferation
Doc Data Sheet
Doc Data Sheet
Doc Data Sheet
Doc Data Sheet
Navy
SO (SCIENCE), COMAUSNAVSURFGRP, NSW
Doc Data Sht & Dist List
Maritime Operational Analysis Centre, Building 89/90 Garden Island Sydney
Deputy Director (Operations) & Deputy Director (Analysis)
Doc Data Sht & Dist List
Director General Navy Capability, Performance and Plans, Navy Headquarters
Doc Data Sheet
Director General Navy Strategic Policy and Futures, Navy Headquarters
Doc Data Sheet
Air Force
SO (Science) - Headquarters Air Combat Group, RAAF Base, Williamtown
NSW 2314
Doc Data Sht & Exec Summ
Army
ABCA National Standardisation Officer, Land Warfare
Development Sector, Puckapunyal
e-mailed Doc Data Sheet
SO (Science) - Land Headquarters (LHQ), Victoria Barracks NSW
Doc Data & Exec Summ
SO (Science), Deployable Joint Force Headquarters (DJFHQ) (L), Enoggera QLD
Doc Data Sheet
Joint Operations Command
Director General Joint Operations
Chief of Staff Headquarters Joint Operations Command
Commandant ADF Warfare Centre
Doc Data Sheet
Doc Data Sheet
Doc Data Sheet
Director General Strategic Logistics
Doc Data Sheet
Intelligence and Security Group
DGSTA Defence Intelligence Organisation
1
Manager, Information Centre, Defence Intelligence
Organisation
1 (PDF)
Assistant Secretary Capability Provisioning
Doc Data Sheet
Assistant Secretary Capability and Systems
Doc Data Sheet
Assistant Secretary Corporate, Defence Imagery and Geospatial Organisation
Doc Data Sheet
Defence Materiel Organisation
Deputy CEO
Head Aerospace Systems Division
Head Maritime Systems Division
Chief Joint Logistics Command
Head Materiel Finance
Doc Data Sheet
Doc Data Sheet
Doc Data Sheet
Doc Data Sheet
Doc Data Sheet
Defence Libraries
Library Manager, DLS-Canberra
Library Manager, DLS - Sydney West
1
Doc Data Sheet
OTHER ORGANISATIONS
National Library of Australia
NASA (Canberra)
1
1
UNIVERSITIES AND COLLEGES
Australian Defence Force Academy
Library
Head of Aerospace and Mechanical Engineering
Hargrave Library, Monash University
Librarian, Flinders University
1
1
Doc Data Sheet
1
OUTSIDE AUSTRALIA
INTERNATIONAL DEFENCE INFORMATION CENTRES
US Defense Technical Information Center
2
UK Dstl Knowledge Services
2
Canada Defence Research Directorate R&D Knowledge & Information
Management (DRDKIM)
1
NZ Defence Information Centre
1
ABSTRACTING AND INFORMATION ORGANISATIONS
Library, Chemical Abstracts Reference Service
Engineering Societies Library, US
Materials Information, Cambridge Scientific Abstracts, US
Documents Librarian, The Center for Research Libraries, US
1
1
1
1
SPARES
5
Total number of copies: Printed 39
PDF 1
=
40
Page classification: UNCLASSIFIED
DEFENCE SCIENCE AND TECHNOLOGY ORGANISATION
DOCUMENT CONTROL DATA
2. TITLE
The Operation of a Three Wavelength Nephelometer and some
Measurements Made at Jabiru during 2002
1. PRIVACY MARKING/CAVEAT (OF DOCUMENT)
3. SECURITY CLASSIFICATION (FOR UNCLASSIFIED REPORTS
THAT ARE LIMITED RELEASE USE (L) NEXT TO DOCUMENT
CLASSIFICATION)
Document
Title
Abstract
(U)
(U)
(U)
4. AUTHOR(S)
5. CORPORATE AUTHOR
S. B Carr and M. A. Burridge
Information Sciences Laboratory
PO Box 1500
Edinburgh South Australia 5111 Australia
6a. DSTO NUMBER
6b. AR NUMBER
6c. TYPE OF REPORT
7. DOCUMENT DATE
DSTO-TN-0594
AR-013-268
Technical Note
November 2004
8. FILE NUMBER
9. TASK NUMBER
10. TASK SPONSOR
11. NO. OF PAGES
12. NO. OF REFERENCES
2004/1029111/1
LRR 01/205
CISRD
18
15
13. URL on the World Wide Web
14. RELEASE AUTHORITY
http://www.dsto.defence.gov.au/corporate/reports/DSTO-TN-0594.pdf
Chief, Intelligence, Surveillance and Reconnaissance
Division
15. SECONDARY RELEASE STATEMENT OF THIS DOCUMENT
Approved for public release
OVERSEAS ENQUIRIES OUTSIDE STATED LIMITATIONS SHOULD BE REFERRED THROUGH DOCUMENT EXCHANGE, PO BOX 1500, EDINBURGH, SA 5111
16. DELIBERATE ANNOUNCEMENT
No Limitations
17. CITATION IN OTHER DOCUMENTS
18. DEFTEST DESCRIPTORS
Yes
Nephelometers, Atmospheric scattering, Atmospheric models, Aerosols, Sensors, Performance prediction
19. ABSTRACT
The operation of a three wavelength integrating nephelometer is explained and summarised. This instrument
was purchased by ISRD for studies of atmospheric aerosols which play an important role in the propagation of
electro-magnetic radiation from the UV through to the mid wave IR. Preliminary results are also reported on
the aerosol scattering coefficient measurements made during the months of September through Novemebr
2002 at Jabiru in Kakadu National Park. This data will form the intial part of a long term aerosol monitoring
program in the region to be conducted jointly by DSTO and CSIRO. The instrument has been re-installed at
Jabiru from about mid September 2004 on an ongoing basis to enable data to be collected on the seasonal
variation in aerosol properties. Details on the instrument's performance on an aircraft during experiments
conducted during 2003 will be presented in separate reports .
Page classification: UNCLASSIFIED