1
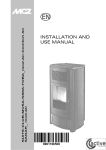
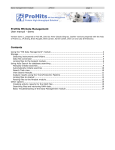
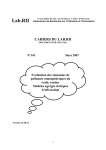
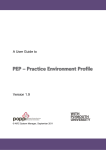
Ponko and Bienvenue BMC Research Notes 2012, 5:224
http://www.biomedcentral.com/1756-0500/5/224
TECHNICAL NOTE
Open Access
ProteinTracker: an application for managing
protein production and purification
Stefan C Ponko1* and David Bienvenue2
Abstract
Background: Laboratories that produce protein reagents for research and development face the challenge of
deciding whether to track batch-related data using simple file based storage mechanisms (e.g. spreadsheets and
notebooks), or commit the time and effort to install, configure and maintain a more complex laboratory
information management system (LIMS). Managing reagent data stored in files is challenging because files are often
copied, moved, and reformatted. Furthermore, there is no simple way to query the data if/when questions arise.
Commercial LIMS often include additional modules that may be paid for but not actually used, and often require
software expertise to truly customize them for a given environment.
Findings: This web-application allows small to medium-sized protein production groups to track data related to
plasmid DNA, conditioned media samples (supes), cell lines used for expression, and purified protein information,
including method of purification and quality control results. In addition, a request system was added that includes a
means of prioritizing requests to help manage the high demand of protein production resources at most
organizations. ProteinTracker makes extensive use of existing open-source libraries and is designed to track essential
data related to the production and purification of proteins.
Conclusions: ProteinTracker is an open-source web-based application that provides organizations with the ability
to track key data involved in the production and purification of proteins and may be modified to meet the specific
needs of an organization. The source code and database setup script can be downloaded from http://sourceforge.
net/projects/proteintracker. This site also contains installation instructions and a user guide. A demonstration
version of the application can be viewed at http://www.proteintracker.org.
Keywords: Protein, Production, Purification, Reagent, Tracking, Prioritization, Web, Application
Findings
Background and purpose
A challenge for any organization that produces protein
reagents is tracking batch information in a format that is
easily accessible to all users. Laboratory notebooks (traditional paper or electronic) should serve as the primary
repository of that information. However, due to the multiple steps involved in generating a single purified protein (molecular biology, cell culture, purification), the
batch data often resides in multiple places. This makes it
difficult to access all of the relevant information quickly.
Over time, even a relatively small group of 5–10
researchers can generate hundreds, if not thousands of
* Correspondence: [email protected]
1
Department of Biomedical Informatics and Medical Education, University of
Washington, 850 Republican, Seattle, WA 98109, USA
Full list of author information is available at the end of the article
pieces of information that may be used by internal or external collaborators. The current high-throughput
screening approaches that are employed by proteomics
labs magnify this issue.
One solution is to capture important batch information into some form of spreadsheet, which has obvious
limitations in versioning, ability to query the data, and
reporting. Spreadsheets typically become the intermediate step before moving towards a commercial LIMS solution, if in-house expertise is available, or external
resources are brought in to customize the LIMS. Regardless of the avenue that is selected, instituting a system
for tracking this information early in the organization’s
history is essential, as it only becomes more difficult as
the size and complexity of the data set grows.
ProteinTracker provides smaller organizations with a
LIMS solution that focuses solely on the key data
© 2012 Ponko and Bienvenue; licensee BioMed Central Ltd. This is an Open Access article distributed under the terms of the
Creative Commons Attribution License (http://creativecommons.org/licenses/by/2.0), which permits unrestricted use,
distribution, and reproduction in any medium, provided the original work is properly cited.
Ponko and Bienvenue BMC Research Notes 2012, 5:224
http://www.biomedcentral.com/1756-0500/5/224
required for protein production and purification, and
therefore should not require the same level of site-specific
customization as more complex commercial LIMS
solutions. The most useful aspects of implementing
ProteinTracker are traceability and transparency. The end
users of the protein reagents have a wealth of information
at their disposal without having to search through notebooks of 2–3 individuals to get the complete details of a
particular batch. Users can make their own assessment of
the batch quality. Changes in protein production methods
are easily related to the activity, purity or yield of the final
prep, since the “chain of custody” information from expression vector, conditioned media and purification are all
linked and accessible.
Additionally, ProteinTracker has been particularly useful
in facilitating the work performed with external contract
organizations and other collaborators. By design, samples
(expression constructs, purified proteins, etc.) are assigned
a unique identifier that can be used as a means of easily
identifying and tracking these samples at external sites. In
one situation, nearly one thousand samples of conditioned
media were sent to a collaborator, and a report summarizing the information on these samples was quickly generated using the data captured in ProteinTracker. In the
case of a therapeutic protein being developed for human
clinical trials, ProteinTracker was used to organize nearly
a hundred different expression vectors that were generated for this program, which included multiple variations
of the lead molecule and associated controls for in vitro
and in vivo testing. For small organizations or academic
groups involved in the preclinical development of protein
therapeutics, ProteinTracker can be used as an intermediate form of data organization that is typically provided by
formal quality control and quality assurance groups at
larger companies.
The application was primarily designed to manage the
data associated with protein reagent production, but not
the experimental data generated with these reagents.
However, it may potentially integrate with, or complement pre-existing workflow systems that do capture experimental data.
One enhancement made to ProteinTracker was the
addition of a reagent request and prioritization feature.
This proved to be very useful as a means of managing
the work flow within the reagent production group, as
well as keeping ‘customers’ informed of the status of the
proteins they had requested. This facilitated the planning
of experiments, while minimizing the amount of time
spent updating numerous lab staff on their particular
proteins of interest.
ProteinTracker has been in continuous use at VLST for
the past ~5 years and has become a valuable resource for
both the reagent service group and the researchers that
depend on it for key components for their experiments.
Page 2 of 11
The application currently manages over 9,000 records,
consisting of numerous plasmids, conditioned media
records, cell lines and protein batches. The extensive use
of open-source libraries and the source code licensing
allow academic and smaller industrial institutions the ability to use and further enhance the system free of charge
for their own specific situation.
Application design overview
ProteinTracker was developed using a three-tier client–
server web application architecture consisting of a data
tier, a logic tier and a presentation tier (Figure 1).
The data tier is managed primarily by a PostgreSQL
[1] relational database and secondarily by a network file
server. Nearly all application data are stored in the database, with the exception of quality control (QC) gel
images and DNA construct map files that are created
and managed by proprietary commercial software. The
QC gel images are stored on a network file server accessible to lab staff. The proprietary file-based DNA
construct database used by the commercial software also
resides on this file server, although this could potentially
be located on a different file server. The DNA construct
files are kept on the file server due to the inability of
the commercial software to save and load files from a
non-proprietary database. The software distribution
includes a script that will create the complete database schema (Figure 2) and user account required by
the application.
The web-based presentation layer was designed to
emulate the look and feel of a desktop application and
therefore does not use page-based navigation. Instead, the
presentation layer consists of HTML and Ajax-enabled
JavaScript rendered by the server-side open-source Echo3
framework components [2]. These synchronize state between the client browser and the server. The necessary
client components are downloaded to the browser when
the application is accessed over the network from a
server-side Java Servlet [3]. Browser events generated by
user interactions with the application are sent back to the
server for processing by the logic-tier. The framework
contains a number of standard user-interface components
that accelerate the development of a user-interface,
and allow for simplified user-interface design changes
by utilizing common style sheets.
The logic-tier consists of Java-based object components
running within the Echo3 framework. These components
receive client-browser events and process them to save,
update, load, or delete model objects to and from the
database, send events back to the client for updating the
screen, send email notifications, validate data, authenticate
users, handle application errors, and perform calculations.
Relational database persistence is provided using the
open-source Hibernate framework [4]. The Hibernate
Ponko and Bienvenue BMC Research Notes 2012, 5:224
http://www.biomedcentral.com/1756-0500/5/224
Page 3 of 11
Figure 1 High level schematic of ProteinTracker components. ProteinTracker is a web application developed using the Echo3 open-source
Ajax client–server framework that runs within a Java Servlet container. The presentation-tier consists of HTML and JavaScript rendered by serverside components. The logic-tier handles application logic including data management and validation, authentication, managing application errors
and performing calculations. Data, with the exception of QC image files and DNA construct maps, are stored in a PostgreSQL relational database
(data-tier). The open-source Hibernate Object Relational Management (ORM) library maps application data in the logic-tier to relational data in
the data-tier.
framework maps object components to database tables
using either annotations, or XML configuration files, and
supports caching and an object-based query language
(HQL) that is modelled after SQL. HQL supports querying
relational data using the logic-tier objects, which removes
the need to keep explicit database entity references in the
logic-tier.
External applications may integrate with data in ProteinTracker at either the database level, or through the
external links supported by ProteinTracker that allow
other applications to link directly to either reagent or
request records. The link format is described in the
user documentation.
Entering reagent data
At a high level, users interact with ProteinTracker in
one of two ways. The first is by entering, updating
and querying reagent records including DNA constructs,
cell lines, conditioned media samples (supes) and batches
of purified protein (Figure 3a). The second is by entering,
editing and prioritizing requests for reagents including
DNA, supes and either new or existing batches of purified
protein (Figure 3b).
The panel on the left-hand side of the application contains the main navigation links for managing requests and
records, while the right hand panel is updated dynamically
depending on the selection (Figure 4). Request-related
links are located at the top of the navigation panel, record
management links in the middle, and quick navigation
fields are at the bottom of the panel. Entering a record ID
in one of these fields opens the appropriate record in the
right panel. By default, all users of the application have
read-only access to all records; however, users must log in
using one of several administrator roles to add or edit any
records as well as to prioritize requests. These roles and
their configuration are specified in the application documentation. Typically, data entry begins with the submission of one or more DNA construct records (Figure 5).
Users are required to enter a mature sequence, from
which the theoretical monomeric molecular weight, absorbance, extinction coefficient, and number of N-linked
glycosylation sites are calculated during record submission. Users can select on-line help to see how the calculations are performed. Additional data fields include the
construct, project, vector, affinity purification tag and
insert names, and notebook reference. A field is provided for entry of a file name associated with a separate
construct map file. On-line help is also available on the
submission screen so that the submitter knows where to
store the construct map file. During record submission,
the application will verify that the file reference is valid. If
not, the user is notified that the file was not found. The
network path to the construct map file directory is specified as part of the application configuration.
Ponko and Bienvenue BMC Research Notes 2012, 5:224
http://www.biomedcentral.com/1756-0500/5/224
Page 4 of 11
Figure 2 Simplified database schema diagram. This entity relationship diagram illustrates the relationships between the database tables. Only
the primary and foreign key attributes are displayed to improve the readability and emphasize the relationships. Tables related to requests are
near the top of the figure. The core data tables for tracking protein batches, supes, cell lines and DNA constructs are near the center of the
figure. The ‘cm_’ prefix indicates conditioned media (supe) related tables.
Users can view previously entered construct records
by selecting the ‘View DNA’ link in the navigation panel.
This displays a sortable, paged table display of all construct records. The page size is selectable and clicking
on any construct record opens the record. It is also possible to page through the construct records one-by-one
by selecting the ‘Previous’ and ‘Next’ buttons while viewing individual construct records. This holds true for cell
line, supe and protein batch records as well. Selecting
the ‘Search DNA’ link displays a search screen that
exposes most of the construct attributes for searching.
Search results are displayed using the same table format
as that used by the ‘View DNA’ option.
A PDF report of the construct details can be displayed,
saved, and printed using the print button displayed on
the construct record. The cell line, supe and protein
batch records are also printable, with the exception that
when printing supes and protein batches, any related cell
lines and constructs used to generate those reagents are
included in the report.
Cell lines are entered in a similar manner as that for
constructs (Figure 6). When entering the record, the cell
Ponko and Bienvenue BMC Research Notes 2012, 5:224
http://www.biomedcentral.com/1756-0500/5/224
Page 5 of 11
Figure 3 Process flow diagram. a). High level block diagram indicating the primary types of reagent data entered in the system and the order
from left to right, in which they are typically entered. b). Block diagram indicating the basic operations and status changes for submission of
requests for transient or stable expression, production of plasmid DNA, or delivery of aliquots from an existing batch of purified protein.
Notification is in the form of an email with an embedded link to the originating request.
type must be specified. Cell types include stable, parental
and hybridoma. When creating a stable cell line record,
one or more (for co-transfections) DNA constructs previously entered must be selected. Additional fields are
provided for tracking cell line origin and current freezer
location, date that the cell line was banked, culture time,
mycoplasma test results and any additional user annotations. Viewing and searching cell lines follows the same
format as that for constructs.
Supe data entry begins with the selection of a specific
cell line entered previously (Figure 7). To create an entry
for a transient transfection, a parental cell line is selected,
followed by one or more DNA constructs to be transfected.
To instead create an entry for a stable transfection, one
must select the appropriate stable cell line. Additional data
fields support tracking of expression level, supe quality,
links to Western blot images, endotoxin results, protein
concentration, harvest related information, as well as
Figure 4 Main application screen. Application navigation options and quick-search fields are shown in this screenshot of the splash screen.
Ponko and Bienvenue BMC Research Notes 2012, 5:224
http://www.biomedcentral.com/1756-0500/5/224
Page 6 of 11
Figure 5 Screenshot of DNA construct details. Data entry typically begins with submission of a DNA construct. This screen captures
information such as the mature protein amino acid sequence, construct map file produced by an external application, insert, tag, vector,
notebook references, project name and several fields whose values are automatically calculated based on the mature sequence.
Figure 6 Screenshot of cell line details. The cell line data entry screen captures and displays information related to the cell line, including
whether it is a parental or stable line (and DNA construct used for the latter), storage location information, mycoplasma test results, and cell line
origin. The insert field is populated automatically for stable cell lines, depending on the selected DNA construct.
Ponko and Bienvenue BMC Research Notes 2012, 5:224
http://www.biomedcentral.com/1756-0500/5/224
Page 7 of 11
Figure 7 Screenshot of supe details. The supe screen captures and displays information related to the production of the protein supe such as
the cell line (and transfection DNA in the case of transient transfections), number of aliquots, storage location, notebook reference, culture media
information, endotoxin results, harvest information and several QC related fields. A field is also provided so that users may specify a link to a QC
file associated with this supe.
remaining supe quantity and current location. Fields such
as construct affinity tag, insert and molecular weight are
populated based on the related DNA construct information. Viewing and searching supes follows the same format
as that for cell lines and constructs.
Once one or more supe records have been entered
into the system, it is possible to select a supe for purification by selecting ‘Add Batch’ from the navigation panel
(Figure 8). When creating a record for a new batch of
purified protein a user may enter one or more purification steps, original and current number of aliquots, formulation buffer, protein concentration and purified
volume and quality control information. In addition, a
number of read-only fields are displayed based on the
construct information that may be of value during the
purification process, including the extinction coefficient,
molecular weight and absorbance. The final purified
protein mass and mass of remaining protein is calculated
automatically during form submission.
Requesting reagents
Users may submit a request for supe(s) to be generated
from a transient transfection or stable cell line, request
aliquots from an existing batch of purified protein, request a new batch of purified protein or request the
production of plasmid DNA. Each option is available
in the application navigation panel.
When requesting supes from a transient expression
(Figure 9), the request submitter selects a previously
entered construct, a cell type and whether secondary
requests should be submitted to the system for generating additional DNA or purification of the supe.
When selecting the cell type, additional fields will be
available to request the volume (for suspension cell
Ponko and Bienvenue BMC Research Notes 2012, 5:224
http://www.biomedcentral.com/1756-0500/5/224
Page 8 of 11
Figure 8 Screenshot of protein batch details. Information related to batches of purified protein include, among other items, the supe(s) that
the protein was purified from, purification steps, endotoxin test results, volume, original and current number of aliquots, inventory information, as
well as some basic protein characteristics calculated based on the theoretical amino acid sequence deduced from the DNA construct. An option
is available to enter a link to a gel QC file. The relationship of the protein batch to the original supe, cell line and DNA construct are listed at the
top left of the screen.
culture), or the number of flasks (for cells grown
adherently). A field is also provided to allow submitters to enter their email address to receive optional
notification of all status changes to their request, including fulfillment of the request. When requests are
initially submitted, a notification email is sent to all
users that have been assigned to the request management group. The request screens for supes from
stable cells lines or the production of DNA are selfexplanatory. These request options also send notification emails to the submitter as the request status
changes and is ultimately fulfilled.
Once it has been submitted into the system, a request
may be viewed by selecting the appropriate type under
‘View Requests’. Each screen displays all requests that
are Pending, Started or Fulfilled. All requests have a default status of ‘Pending’ after submission. Once lab staff
begin to work on a request, they may log in and update
the appropriate request status to ‘Started’. When all
work for the request has been completed, the request
status is updated to ‘Fulfilled’. Each status update will
trigger an email to the request submitter notifying them
of the status change that also provides a link to the request. Other fields in the requests may also be edited, and
any request may be printed or saved as a PDF document.
An administrator can prioritize requests by clicking on
the ‘Prioritize’ button at the bottom of the table view of
requests, selecting a request and using the arrow keys to
move it up and down in the request queue to change its
relative priority (Figure 10). This option is only available
when viewing requests for which work has not yet begun
(i.e. in a ‘Pending’ state).
Functionality comparison and performance
ProteinTracker has some similarities to other opensource LIMS such as PiMS [5] and OpenFreezer [6] that
support reagent and workflow tracking; however, it focuses specifically on the most critical data that is
Ponko and Bienvenue BMC Research Notes 2012, 5:224
http://www.biomedcentral.com/1756-0500/5/224
Page 9 of 11
Figure 9 Screenshot of a transfection request. Users may submit a request for a transient transfection. As part of the submission process, they
may also request that a DNA request and/or a purification request be automatically generated for (and associated with) this transfection request.
If the request submitter specifies their email address in the Requestor field, they will be notified by email of any status changes to the request,
including when work has begun on the request and when the request has been fulfilled.
generated in the course of protein reagent production.
It also adds the ability for users to request reagents
and be notified of status changes for requested reagents.
ProteinTracker does not manage experimental data or
workflow around such data. Smaller laboratories with limited staff and/or funding may find it difficult to invest the
time or resources in configuring and supporting a more
complex LIMS that supports workflow management for
experimental data. This is particularly true for smaller
laboratories that happen to have multiple, or rapidly changing workflows. ProteinTracker therefore represents an
intermediate solution that lies between tracking reagent
data manually and a more complex LIMS that may require significant customization.
ProteinTracker runs as a web application within Apache
Tomcat [7] or any Servlet container supporting Java Servlet specification 2.4, and requires the installation of a PostgreSQL database. Installation from the source code
distribution involves initial editing of the configuration
files, compilation, and deployment to the Servlet container
as a Web Application Archive (WAR) file. Per session
memory consumption is minimal but increases temporarily during marshalling of data for presentation to the client
tier. Memory settings for an installation will depend on
the maximum number of concurrent number of users and
amount of data accessed; however, a heap size setting of
1–2 GB for the Java virtual machine should be adequate
for most installations. Smaller laboratories may require
Ponko and Bienvenue BMC Research Notes 2012, 5:224
http://www.biomedcentral.com/1756-0500/5/224
Page 10 of 11
Figure 10 Screenshot of request prioritization. Requests for transfections, plasmid DNA, and batches of purified protein may be prioritized or
deleted by an application administrator. Once logged in, the administrator may move requests up or down in the queue to reflect the priority
of the request, by selecting the request and moving it towards the top of the queue for higher priority requests, or down for lower-priority
requests.
significantly less. For example, the public demonstration
web site uses a heap size of 64 MB.
new materials as well as accessing all the pertinent information relating to the manufacture of existing reagents.
Application development and testing
Future development
Testing of the application was performed using a combination of unit, functional, and user acceptance tests. A
regression suite that includes the unit and functional test
code written using the JUnit [8] test framework is included
in the source distribution. The unit and functional test
code verify that model objects, calculations, database
access, authentication, and various screen components
perform as expected when the application is modified.
The application was designed in discrete stages with
each stage designed to manage one additional type of protein production-related reagent e.g. constructs, supes, cell
lines, etc. At the completion of each stage, application
users were given a chance to fully test the application in a
test environment, with data cloned from the production
database, to confirm that the functionality matched expectations before deploying updates to the production environment. No application changes were made without final
user and management acceptance. The application was
developed early during the companies ramping-up of protein production, so some existing data had to be backfilled
and relational integrity established as each stage was
developed. The benefit was that users were able to make
use of the application early during the development-testrelease cycle and were therefore more engaged in testing
and providing feedback on desired functionality.
At this time, no further development is planned. The
open-source licensing allows other users to download
the application source code and libraries, and modify or
further enhance the source code for their own specific
work flows.
Availability and requirements
The source code for ProteinTracker is open-source and
freely available. Source code, installation instructions
and a user manual are provided on the project home
page listed below. Installation instructions and licensing
information are also provided as part of the source code
download.
Project name: ProteinTracker
Project home page: http://www.proteintracker.org
Operating system(s): Platform independent
Programming language: Java
Other requirements: Apache Tomcat or similar
application server supporting Servlet specification 2.4,
Java 1.6, PostgreSQL 8.3 or higher, and Apache Ant 1.7
[9] for compilation.
License: GNU LGPL v3.0 [10]
Any restrictions to use by non-academics: none
Availability of supporting data
Intended use
This application is to be used by service groups tasked with
generating DNA or protein-related research reagents to
support preclinical research programs. This provides the
users of these reagents with a structure for both requesting
The data sets supporting the results of this article are
included within the article (and its Additional file 1).
The data sets supporting the results of this article are
also available in the SourceForge repository, http://sourceforge.net/projects/proteintracker.
Ponko and Bienvenue BMC Research Notes 2012, 5:224
http://www.biomedcentral.com/1756-0500/5/224
Page 11 of 11
Additional file
Additional file 1: Source Code Distribution. ProteinTracker source
code. Source code and build instructions for ProteinTracker.
Abbreviations
DNA: Deoxyribonucleic acid; HQL: Hibernate Query Language;
HTML: HyperText Markup Language; JAR: Java Archive; LIMS: Laboratory
Information Management System; ORM: Object Relational Mapping;
PDF: Portable Document Format; QC: Quality Control; SQL: Structured Query
Language; WAR: Web Application Archive.
Competing interests
The authors declare they have no competing interests.
Authors’ contributions
SP designed and developed the application using requirements and
additional testing support provided by DB and team members of the Protein
Sciences group at VLST. Both authors read and approved the final
manuscript.
Acknowledgements
All work was funded and performed at VLST. We thank the Protein Sciences
group at VLST for critical feedback on functionality and testing of
ProteinTracker, and Daniel Van Atta for providing additional test code and
refactoring during the migration from the Echo2 to Echo3 framework.
Author details
1
Department of Biomedical Informatics and Medical Education, University of
Washington, 850 Republican, Seattle, WA 98109, USA. 2VLST Inc, 307 Westlake
Avenue North, Seattle, WA 98109, USA.
Received: 30 January 2012 Accepted: 2 May 2012
Published: 10 May 2012
References
1. PostgreSQL. [http://www.postgresql.org].
2. Echo Web Framework. [http://echo.nextapp.com/site/echo3].
3. Java. [http://www.oracle.com/technetwork/java].
4. Hibernate. [http://www.hibernate.com].
5. Morris C, Pajon A, Griffiths SL, Daniel E, Savitsky M, Lin B, Diprose JM, da
Silva AW, Pilicheva K, Troshin P, van Niekerk J, Isaacs N, Naismith J, Nave C,
Blake R, Wilson KS, Stuart DI, Henrick K, Esnouf RM: The Protein Information
Management System (PiMS): a generic tool for any structural biology
research laboratory. Acta Crystallogr D Biol Crystallogr 2011, D67:249–260.
6. Olhovsky M, Williton K, Dai AY, Pasculescu A, Lee JP, Goudreault M, Wells
CD, Park JG, Gingras AC, Linding R, Pawson T, Colwill K: OpenFreezer: a
reagent information management software system. Nat Methods 2011,
8:612–613.
7. Apache Tomcat. [http://tomcat.apache.org].
8. JUnit. [http://junit.sourceforge.net].
9. Apache Ant. [http:// ant.apache.org].
10. GNU Lesser Public License. [http://www.gnu.org/licenses/lgpl.html].
doi:10.1186/1756-0500-5-224
Cite this article as: Ponko and Bienvenue: ProteinTracker: an application
for managing protein production and purification. BMC Research Notes
2012 5:224.
Submit your next manuscript to BioMed Central
and take full advantage of:
• Convenient online submission
• Thorough peer review
• No space constraints or color figure charges
• Immediate publication on acceptance
• Inclusion in PubMed, CAS, Scopus and Google Scholar
• Research which is freely available for redistribution
Submit your manuscript at
www.biomedcentral.com/submit