1
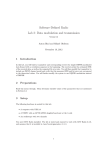
innovative solutions for electrochemical research
Ivium Technologies
De Zaale 11
5612 AJ Eindhoven
The Netherlands
www.ivium.com
QUICK GUIDE
A/ Software installation
B/ Connecting your instrument
• All Ivium potentiostats have a unique serial number that is connected with the device
1) Install IviumSoft from CD:
2) Pre-Install Drivers:
Use the "setup" application on the IviumSoft
installation CD (inside User Manual) and follow
instructions. IviumSoft will be installed on your Cor D-drive (default) in the "IviumStat" directory.
This directory will include example data files,
drivers, Labview example and all manuals. Also a
shortcut to IviumSoft will be placed on your
desktop.
Navigate to the newly created directory ..\IviumStat\iviumdrivers and
run "Ivium_driverinstaller.exe" to install 2 Ivium instrument drivers.
When prompted click "next"; then at the Windows Security pop-up click
"Install this driver software anyway"; upon completion click "Finish".
driver. The first time the potentiostat is connected to a specific computer, the driver
will be loaded. If prompted (Windows XP), choose "automatic" installation and to
"continue anyway". After the driver has been loaded, the IviumSoft can be started
and the device serial number is visible in the readout window at the top left of the
user interface.
• The pocketSTAT is USB powered: connect the delivered USB cable between
You can now connect your instrument via USB.
pocketSTAT and PC/Laptop and the instrument is ready to operate.
• The CompactStat can be used in USB- or adapterpowered mode. When using adapter-powered
mode, the correct order is to first insert the
adapter plug and then connect the USB-cable.
• For all other Ivium-potentiostats, first insert the power cable,
then connect the USB-cable. Next, switch the instrument on.
NOTE: Windows 8 may block third party
drivers; on your installation CD in the
manuals folder, refer to document:
T2.3 Ivium Driver Installation.pdf
C/ Software – user interface
1.
2.
3.
4.
5.
6.
7.
1. Device & software control
Device & software control
Operating parameters
Advanced parameters
Measurement results
Legend panel
Data file history list
Status bar
1
The menu bar:
File
Options
Tools
Help
About
-
Data and method file management.
Setting the device and data handling options, incl. FRA options
Device maintenance and special operations
HTML help file: content sensitive and topic search
Shows IviumSoft version and corresponding .dll [no#]
3
To start:
a. In the drop down menu select the device by Serial Number.
b. To operate this instrument, click "Connect".
5
2
2. Operating parameters
4
"Direct" mode: for direct control of the instrument
• Intended for diagnostic purposes
• Actual potential and current are displayed
• When not controlled, the open cell potential is displayed
(within specified accuracy)
Example:
a. Select configuration, i.e. "Cell Estat4".
b. Select current range
c. Check connect-box: cell on/off
d. Insert value
e. Press "Apply"
f. Above:
DC/AC - to toggle between AC/DC signal measurement
IRcorr - will open IR-drop correction window
HiSens - will make hi-sensitivity current ranges available
g. Below: direct control of the peripheral port and FRA are
possible.
"Method" mode: for executing electrochemical methods.
6
7
3. Advanced parameters
• In "method" mode, by default the basic parameters are • The "Project window" shows the active Project directory
shown. Selecting "Advanced" from the drop down menu in which data files are automatically stored. Select your
will add a number of advanced method parameters.
Project directory from the drop down menu. When typing
a new Project name in the window, it will automatically
be created when the next data file is stored.
• Indicators: the grey indicators will light up red when
the corresponding parameter reaches an overload. The
black indicator shows the actual current range in use
(useful when automatic current ranging is active).
Example:
a. Select desired method from the tree:
Expand method group and select method
b. The relevant method parameters are listed and
accessible in the window below
c. Once the relevant parameters are inserted the
measurement can be started by clicking the
"Start" button at the bottom of the window
d. Clicking the "Abort" button will abort the
measurement immediately at the next data point.
e. When for a specific method all parameters are set
to apropriate values by the user, this method can
be saved (.imf) for future use by selecting "File" in
the upper menu bar and choosing "Save method".
From "Menu bar>File" also previously saved
methods can be loaded.
• "SigView" opens a window that shows voltage and
current signal trace during an AC measurement.
Can be used to verify the quality of the signal and
to check for i.e. overload/oscillation situations.
• "BatchMode" opens the batch programming
window. This can be used for automating and
sequencing measurements, scheduling events, etc.
For instructions, refer to the Technote "T1 Batch
mode..." in you "IviumStat/Manuals" directory.
4. Measurement results
• When a measurement is started the data is shown real time in the
result graph. A right mouse click on the graph will give the user a
number of options, including changing the graph colour and
background, as well as copying the graph to clipboard.
• The buttons to the left allow additional data to be displayed. Data is
by default displayed "2D"; "3D" and "3Di" display may also be
chosen. Clicking the "Cor" button after the measurement has
finished, will start the correction mode, allowing the user to change
individual data-points. "X" shows the primary data, "Ain, ocp, pre,
Q, Rs, Cs" will all open a second graph that shows the
corresponding data when available: optional analog inputs, ocpmeasurement before scan, pre-treatment data, etc.
• The "Scale" button allows the scale of the graph to be adjusted via
the drop down menu; clicking on the button itself will auto-scale
the graph.
• "Analysis" will make a number of analysis methods available to the
data in active memory.
• "Edit" will allow smoothing of the scan data.
• The buttons on the top right of the graph activate different
representations of (impedance) measurement data.
• The tabs "Result graph" and "Result data" on top enable switching
between graphical and numerical representation of the scan data.
"E scan" will show the data for analysis when an impedance-scan
method has been carried out.
5. Legend panel
Three tabs:
1) "Scan" shows the list of scans that have just been measured or loaded as data from
memory.
"Hide all"/"Show all" will respectively hide and show all scans in the list.
In the list of scans, checking/unchecking the box next to the scan will
show/hide individual scans. Note that the scan that is highlighted blue is
the scan in active memory. This is the one that is evaluated in
"Analysis", or has the numerical data shown in "Result data", etc.
Clicking on a different scan will select that one (highlight it), making it
available for analysis, saving, etc.
Checking the box before "Hide previous" will hide all previous scans,
except the latest (useful when a large number of scans is listed).
"All extra data" will show the extra data, for example OCP measurement,
of all scans in the list.
"Delete" will remove the selected scan from the view screen
"Delete all" will remove all scans from the view screen
"Data appear" will allow user to change the appearance of the data:
lines, colours, symbols.
2) "Olay" will allow the user to load data from file, to overlay it so that it can be
compared to the scan data that was just recorded. Several scans can be loaded at
the same time. All the same options apply as in the scan-tab.
3) The "Chan" tab shows when analog inputs are sampled (advanced method
parameter), it allows the user to show/hide analog channels in the second graph.
Note that:
- A scan in the list can be selected (highlighted in blue), but not be
visible in the graph, and vice versa.
- When different electrochemical methods are used, the data cannot
always be represented in the same graph; i.e. running a FRA-scan after
a CV-scan without clearing the graph window will lead to unreadable
graphs.
- Running a CV-scan will automatically clear the graph when the next
experiment is started.
- Only data compliant with the active plot will be displayed.
innovative solutions for electrochemical research
Ivium Technologies
De Zaale 11
5612 AJ Eindhoven
The Netherlands
www.ivium.com
QUICK GUIDE (2)
E/ Software & Firmware upgrade
6. Data file history list
All Ivium experimental data is automatically saved upon completion or user-abort of a measurement. A data file is
created with an automatically generated (arbitrary) file name, containing of a unique scan id and instrument S/N.
After the data is saved it will be added to the history list of most recent data files, at the bottom of the user
interface.
After an experiment is completed and the datafile is stored, the user can enter a description
and click "Apply" to store the description in the view of the history list.
Checking the bookmark box and pressing "Apply" will bookmark the
selected datafile for future reference. Bookmarked files are underlined.
IviumSoft upgrade
The CD with IviumSoft control & data analysis software in the User Manual delivered with your instrument is
the latest release available at the time of shipment. However, IviumSoft is frequently updated with new
features, often at a customers request. When a new version of IviumSoft is available, it is published on our
website at: www.ivium.nl/Support. Here the new version can be downloaded as .zip file. The .zip file contains
the IviumSoft.exe and whatever auxiliary files necessary. Note that this does NOT contain a full installation
package, so using this file for a new installation is not possible.
To upgrade the IviumSoft, download the latest version of the software from www.ivium.nl/Support. Open the
.zip file and copy all files to clipboard. Browse to your IviumStat file folder: ..\IviumStat, and paste (replace
the files already there with the new ones).
Now your IviumSoft has been upgraded. After this proceed to upgrade the firmware of your instrument.
Firmware upgrade
Ivium instruments are equipped with an internal micro PC that operates the electronics, and is used to store
data during a HiSpeed experiment. The firmware that runs on the micro PC is specific to the version of
IviumSoft. For correct communication (and operation) these versions need to match, that is why IviumSoft
has the correct version of firmware embedded. To upgrade the firmware of your instrument:
Double clicking on a file in the history list will load that file into the result window. Holding the [Shift] key will allow
multiple data files to be selected simultaneously. A Right mouse click will open a pop-up:
• Load Scans: will load selected scans into the result window.
• Add Scans: will add selected scans to the result window and the scans already there.
• Copy file: will copy data file to clipboard, for example for easy pasting into an e-mail, or a file directory.
• Add to Bookmarks: will add the selected scan to the bookmarks for future reference. Book marked scans can be
identified by their underline. All bookmarked files in the history list can be shown by clicking [Bmrks] to the left
of the history list.
• Move to active project: will move the data file to the active project (see 3. Advanced parameters).
• Move to tempfiles: will move the data file to the tempfile directory. Data files in the "tempfile" project are
displayed in red.
• Delete permanently: will delete the data file permanently.
1. Connect to your instrument in the IviumSoft and go to
"Tools>Device maintenance"
2. In the pop-up window click on "Firmware upgrade"
3. In the second pop-up click "Start", let the file
upload, and when finished (successfully uploaded)
click "Close".
Data Storage:
Data files are stored in a Library\project structure. In the menu "File>Data Explorer" data files in
all libraries and projects can be explored, with a list of method parameters and result graph
preview. In the menu "Options>Datahandling Options" the data storing options can be specified,
such as: timed intermediate saving, automatic storage of a file copy to another designation (i.e.
network drive), temp file properties, etc.
4. After this, click "Reboot device".
7. Status bar
5. Then close IviumSoft and restart your instrument.
At the bottom of the user interface the Status bar is located. Depending on the status of the instrument (idle,
running a method, etc.) and/or the method that is running, a series of parameters is shown.
For more instructions refer to Technote T4: "Software
and Firmware Upgrade".
In the case of a CV scan (see figure above) it shows the real time E, I, number of acquired data points so
far, cycle number, elapsed runtime of the scan and the notification that a measurement is in progress (or
completed). In case for example an OCP measurement is carried out, the OCP value can also be found in
the status bar. During an impedance measurement for example, it will show the real time E and I, the
current frequency of the datapoint measured and the percentage of progress.
Ivium Options & Modules
Bipotentiostat
(BiStat)
Hardware option that enables a second working electrode (WE2) with
programmable potential offset wrt RE or WE1:
● 2 configurations
♦ "standard": fixed potential w.r.t. RE
♦ "scanning": fixed offset potential w.r.t. the primary WE
● Applied offset potential range ±2.0 V
● Maximum current ±30 mA
True linear scan
(LinScan)
Hardware option that applies a smooth analog ramp, instead of the
standard staircase sweep:
● Scan range ±2 V, 0.125 mV resolution
● Scanrate 1 µV/s - 10.000 V/s
● Available in the techniques: LSV and CV
D/Special operations
From the top menu "Tools" will open a list of special operations:
"Performance test" (only available when an instrument is connected)
"Performance test" will open a pop-up window that
allows a self-diagnostic test of the instrument. This
test is intended for occasional use, for example to
determine if the calibration is still correct or whether
the instrument is in proper working order. At a
service request you can be asked to run this test by
a service engineer to determine if the problem is
hardware related. The performance test can only be
executed when the instrument is in the "standard"
configuration (= no extended range or modules
activated).
The IviumBoost is a power booster that has been designed to
increase the current and or potential of the main instrument. The
IviumBoost is connected in front of the main instrument in-line with
the cell cable. The IviumBoost is available in various configurations:
● ±10V@±10A
● ±10V@±40A
● ±100V@±0.6A
To run the test, connect the cell cable to Testcell1,
uncheck all options in the menu "Options>Options",
and run the test. All status reports should read
"pass". If one, or more, reads "fail" after repetitive
runs, the instrument may need calibration.
This cannot be done by the user, you should contact
your supplier.
FastScan module
"Pulse generator"
"Pulse generator" is a direct function that will apply
a pulse according to the selected parameters:
● ±10V@±5A
● ±20V@±5A
The FastScan module is a 20MHz data recorder in combination with
an ultra fast scan generator. It connects to the peripheral port and
has a built in memory.
Data sampling:
Scan generator:
● 2 channels, 16 bits
● CV/LSV: Staircase & TrueLinear
● Max. acq. speed 20 Msamples/s ● Max. scan rate 10,000,000 V/s
● Data memory 10,000,000 pts
● Vertex res. 0,125V at ±4V
● Input bandwidth >8MHz
● Transients: Chronopot./Chronoamp.
The MultiWE32 is a multi-channel potentiostat unit that can control
up to 32 working electrodes that share a single CE and RE. The
potential is not multiplexed: it is applied simultaneously and
continuously!
It is used in combination with either a CompactStat or an IviumStat
and is developed especially to be used in micro and nano
electrochemistry. The maximum applied voltage is determined by the
controlling potentiostat, max. current ±1 mA per WE.
The Ivium Technologies high performance electrochemical
multiplexer (HiMUX) can work with 8 individual cells with 4
electrodes each and is fully compatible with all Ivium potentiostats.
Because each channel has its own electrometer, its performance is
superior to the switchbox approach. Furthermore, the multiplexer
units can be stacked so that a maximum of 64 channels can be
controlled by a single potentiostat: ±20V @ ±5A.
By selection a potentiostatic or galvanostatic pulse
can be generated with user selectable height and
duration. The pulse generator is intended for
preparation/conditioning of a sample, data is not
measured or stored.
"Current Interrupt"
"Current Interrupt" will open a window that allows
use of the Ivium Current Interrupt module (CIM).
The CIM can be purchased separately. The current
interrupt technique can be used to determine the
ohmic drop of an electrochemical system. This value
can then be used for ohmic drop compensation
during various electrochemical methods.
The Peripheral Differential Amplifier (PDA) module allows the
simultaneous recording of differential bipolar high-ohmic external
voltages, such as reference or pH meters. The PDA has 8 differential
input channels, and it is stackable up to a total of 64 channels; each
channel ±2V floating, with high input impedance (> 10^12 Ohm). Next
to that the PDA module is a connection box for the various analog and
digital inputs&outputs that are available in each Ivium potentiostat.
The Peripheral Level Transformer (PLT) is an adapter module that
increases the voltage of the analog inputs&outputs for easy
communication with external devices. It is connected between the
instrument and the periphery. The PLT transforms the range of the
analog inputs 1&2 to ±10V, and the analog outputs to ±10V.
The Current Interrupt Module (CIM) is an adapter module for
measuring the IR-drop via the current-interrupt technique.This device
connects in-line with the cell-cable of the potentiostat.
"Define channels"
"Define channels" is only available for the Ivium-n-Stat. When no channels are
connected in the IviumSoft, it will open a pop-up window that allows to assign
the channel serial number to a channel number for easier designation and
reference (see: P11 Ivium-n-Stat User Guide).
The ModuLight-module is a programmable light source, specifically
designed to investigate photo-electrical devices, such as solar cells.
The module will operate in combination with all Ivium potentiostats,
through the peripheral I/O-port:
• Wavelength can be set programmatically: 465-635 nm in 7 steps.
• The light intensity can be modulated using the sinewave generator
of the potentiostat: 10µHz to 2MHz.
• Extensive Solar cell applications in the Ivium software, including E/I
curves as function of the light intensity, IMVS/IMPS, and solar cell
modelling resulting in all characteristic values of the studied object.
Ivium Technologies ® April 2014