1
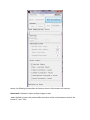
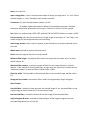
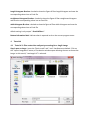
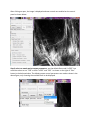
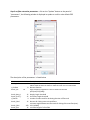
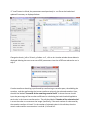
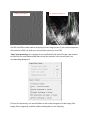
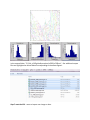
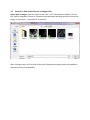
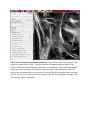
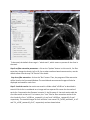
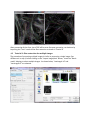
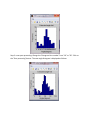
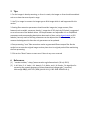
ctFIRE Beta Version 1.2.1 User's Manual (August, 2013)
Yuming Liu and Jeremy Bredfeldt
Laboratory for Optical and Computational Instrumentation, UW-Madison
1
Introduction .......................................................................................................................................... 1
2
Flow chart ............................................................................................................................................. 2
3
GUI control panel .................................................................................................................................. 3
4
Tutorials ................................................................................................................................................ 6
4.1
Tutorial 1: fiber extraction and post-processing for a single image ............................................. 6
4.2
Tutorial 2: fiber extraction for an image stack............................................................................ 13
4.3
Tutorial 3: fiber extraction for multiple images .......................................................................... 16
4.4
Tutorial 4: post processing for a ".mat" file ................................................................................ 17
5
Tips ...................................................................................................................................................... 19
6
References .......................................................................................................................................... 19
1 Introduction
The purpose of this standalone MATLAB package is to allow users to automatically extract
collagen fibers in an image, and quantify fibers with descriptive statistics, such as fiber angle,
fiber length, fiber straightness, and fiber width. The program reads in image files, extracts the
individual collagen fibers via ctFIRE ( curvelet transform plus FIRE algorithm) , which is an
approach combining the advantage of the fast discrete curvelet transform[1] for denoising the
image and enhancing the fiber edge features and the advantage of fiber extraction (FIRE)
algorithm [2] for extracting individual fibers. The output may be displayed on the screen and
written to .csv files.
In the ctFIRE program, user can choose to run ctFIRE, FIRE, or both of them. Parameters to run
FIRE and ctFIRE have default values and are also adjustable via GUI or .csv file. Optional
outputs include: overlaid image of the segmented fibers on the original image and the CT
reconstructed image, image of non-overlaid extracted fibers, fiber angle histogram, fiber length
histogram, fiber straightness histogram, and fiber width histogram, as well as the associated
values saved in .csv files. The detailed information about the parameters and output of ctFIRE
is automatically saved in .mat binary format for a later post-processing.
2
Flow chart
Flow chart for ctFIRE beta v1.2.1
load image/file
Y
Y
batch
mode?
N
.mat file?
Y
.mat file?
N
N
image
stack?
N
image
stack?
Y
Y
N
select run mode and ctFIRE
parameters, configure output
figures and files
select slices
range
get image
files number
get .mat files
number
fiber extraction for a
single image
N
Y
last slice
save .mat results and
parameters , output, for
example, overlaid image ,
fiber angle, fiber length
histograms and values
or last file?
update/load the
configuration of
output figures
and files
Y
image stack
or batch
mode?
N
.mat file
loaded?
Y
batch
mode?
Y
load fiber
extraction .mat
results
N
N
Y
post processing?
N
reset/end
N
last mat?
As shown in the flow chart, besides fiber extraction for a single image in version 1.0, the main
added features in beta version 1.2.1 include: batch mode fiber extract for both multiple image
files and .mat files, image stack fiber extraction, post-processing for both single image output,
single fiber extraction results " .mat" file and multiple fiber extraction results ".mat" files . Add
the features of outputting non-overlaid extracted fiber image, fiber straightness, and fiber
width besides fiber length and fiber angle. In addition, add the button to load parameters in
.csv files as well as to update and save the updated parameters for ctFIRE in .csv format.
To be noted, batch mode image stack is not supported. In addition, after fiber extraction for
image stack or batch image files, the post processing is not immediately available. However, as
shown above, since fiber extraction is applied to each image or slice and saved as individual
".mat" file, batch mode ".mat" can be imported for post processing of those results if needed.
Detailed description about the features will be demonstrated in the examples in section 4.
3 GUI control panel
The GUI in ctFIRE is modular, so that the main user interface is in a separate window from the
outputs. This allows for the users to resize the output windows to their preferred size. The
main user interface window is shown below.
where, the following list describes the function of each of the buttons and controls:
Batch-mode: checked to import multiple images or data.
.mat: checked to import the previous fiber extraction results and parameters saved in the
format of ".mat " files.
Reset: rerun the GUI.
Import Image/data: import the information about an image, an image stack , or ".mat" files or
multiple images, or ".mat" files when batch-mode is selected.
Parameters: (1) Load: load parameters saved in .csv file
(2) Update: update the loaded or default (if not loaded) parameters. Detailed
description about these parameters can be seen in Tutorial 1 in section 4 of this manual.
Run: select run mode among ctFIRE, FIRE, and both FIRE and ctFIRE. Default run mode is ctFIRE.
Post-processing: after the fiber extraction of a single image or the import of ".mat" file(s) , the
output setting can be configured to do post-processing.
Stack image preview: when a stack is opened, move the slide bar to view any selected slice in
the stack.
Whole stack: checked to process the whole stack.
Slices: enter the range of the slices to be processed.
Minimum fiber length: only display fibers which are longer than this value, unit is in pixels,
default value is 30.
Maximum fiber number: maximum number of fibers for the output figure(s) or statistic
analysis . If the number of the extracted fibers is larger than this value, only consider the first
"Maximum number" of extracted fibers. Default value is 2999.
Fiber line width: The line width of the extracted fibers in the overlaid image, default value is
0.5.
Histogram bins number: the number of bins used in the angle and/or length histogram.
Select Output:
Overlaid fibers: checked to show and save the overlaid image of the extracted fibers on the
original image as well as show the CT reconstruction image.
Non-overlaid fibers: checked to show and save the image of the extracted fibers .
Angle histogram & values: checked to show the figure of fiber angle histogram save the
corresponding values into an Excel file.
.
Length histogram & values: checked to show the figure of fiber length histogram and save the
corresponding values into an Excel file.
straightness histogram & values: checked to show the figure of fiber straightness histogram
and save the corresponding values into an Excel file.
width histogram & values: checked to show the figure of fiber width histogram and save the
corresponding values into an Excel file.
default setting is only output " Overlaid fibers ".
Bottom information label: indicate what is expected to do or the current program status.
4
Tutorials
4.1 Tutorial 1: fiber extraction and post-processing for a single image
Step 1 open an image: Leave the "Batch-mode" and ".mat" checkboxes unchecked. Click on
the "Import image/data" button, a file selection window opens allowing the user to choose the
image. In this tutorial, "testimage1.tif" is selected.
After clicking on open, the image is displayed and new controls are enabled on the control
panel as shown below.
Step 2 select run mode and set output parameters: use the default Run mode "ctFIRE", but
could also select to run "FIRE" or both "ctFIRE" and "FIRE " as shown on the right of "Run"
button in the below window. The default output control parameters are used as shown in the
above figure, only choosing the overlaid fibers to be displayed.
Step 3 set fiber extraction parameters : click on the "Update" button on the panel of
"parameters", the following window is displayed to update or confirm nine default FIRE
parameters:
The description of the parameters is listed below
Name
thresh_im2
s_xlinkbox
thresh_ext
thresh_dang_L
thresh_short_L
s_fiberdir
thresh_linkd
thresh_linka
thresh_flen
Value Description
5 thresh_im2 is for a hard value, main adjustable parameters
radius of box in which to check to make sure xlink is a local max of the
8 distance function
70
angle similarity required for a fiber to extend to the next
point(cos(70*pi/180))
15 dangler length threshold
15 short fiber length threshold
4 number of nodes used for calculating direction of fiber end
15 distance for linking same-oriented fibers
minimum angle between two fiber ends for linking of the two fibers(cos(-150 150 *pi/180))
15 minimum length of a free fiber
If "Load" button is clicked, the parameters saved previously in .csv file can be loaded and
updated if necessary as displayed below:
Change the thresh_im2 to 30 and s_xlinkbox to 5 , click on ok. Another window shown below is
displayed allowing the user to set two ctFIRE parameters since the ctFIRE was selected to run in
step 2.
Curvelet transform denoising is performed by transforming to curvelet space, thresholding the
curvelets , and then performing the inverse transform using only the selected curvelets. Here,
the edit box labeled "Percentile of the remaining curvelet coeffs" is where the user should
input the percentage of the curvelet coefficients for calculating the hard threshold applied to
each scale in the inverse transformation . The edit box labeled "Number of the selected scales"
is to set the scales to reconstruct the image. Specifically, if the total number of scales used by
the curvelet transform is N and 3 is the number of selected scales in this edit box, then the
actual scales used for reconstruction is scale N-1, N-2 and N-3.
In this tutorial, use the default values and click on OK to continue. Then, the button "Run" is
enabled.
Step 4 run fiber extraction: click on "Run" button. Then, the progress of fiber extraction will
be listed in the Command Window. The overlaid and reconstructed images will also be
displayed.
Step 5 check the results:
A ".mat" file containing the fiber extraction results and corresponding parameters is
automatically save to a new subfolder called "ctFIREout"(if not exit, the folder will be created
by ctFIRE automatically) of the folder where the image exists. In this case, the path for this
subfolder is "C:\CAA_x220\github\curvelets\ctFIRE\ctFIREout". Six output files are shown:
ctFIRE output:
ctFIREout_ testimage1.mat: the .mat file for the fiber extraction results by ctFIRE
OL_ctFIRE_ testimage1.tif : the .tiff overlaid image of ctFIRE
CTRimg_ testimage1.tif: the .tiff CT reconstruction image
ctfParam_testimage1.tif.csv: parameters for ctFIRE that can be loaded for later use.
The two displayed images are shown below:
CTRimg_testimage1.tif
OL_ctFIRE_testimage1.tif
If ctFIRE and FIRE are both used for analyzing this test image (in step 2), the results comparison
will show that ctFIRE can yield more accurate fiber extraction than FIRE.
Step 6 post-processing: Let's suppose we are satisfied with the overlaid image, now we want
to check the non-overlaid extracted fibers and all the statistics In the control panel, the
corresponding settings are:
Click on Post-processing, non-overlaid fibers as well as the histograms for fiber angle, fiber
length, fiber straightness, and fiber width are displayed as in the following.
In the output folder "C:\CAA_x220\github\curvelets\ctFIRE\ctFIREout", five additional output
files are highlighted as shown below corresponding to the above figures.
Step 7 reset the GUI: reset to import new image or data .
4.2 Tutorial 2: fiber extraction for an image stack
Step 1 open an image: Leave the "Batch-mode" and ".mat" checkboxes unchecked. Click on
the "Import image/data" button, a file selection window opens allowing the user to choose the
image. In this tutorial, "teststack3.tif" is selected.
After clicking on open, the first slice of the stack is displayed and new controls are enabled on
the control panel as shown below.
Step 2 select run mode and set output parameters: Leave the run mode on the right of "Run"
button as default value "ctFIRE", output parameters are default values as shown in the
follows. Compared to processing one single image, the controls for stack analysis are enabled
and allowing to preview the slices and select the slice range. Drag the slider or click on the
slider arrow to preview the slices in the stack. Select the 2nd slice to preview, select the slices
range as "slices 1 to 2", and set the minimum fiber length shown in the overlaid image to "50".
The following figure is displayed:
To be noted, the default slices range is "whole stack", which means to process all the slices in
the stack.
Step 3 set fiber extraction parameters : click on the "Update" button. In this tutorial , for fiber
extraction, change the thresh_im2 to 10; for curvelet transform based reconstruction, use the
default values. See the step 3 of Tutorial 1 for details.
Step 4 run fiber extraction: click on the "Run" button. Then, the progress of fiber extraction
will be listed in the Command Window. The overlaid and reconstructed images will also be
displayed and saved for each slices.
Step 5 check the results: the results are saved in a folder called "ctFIREout" as described in
tutorial 1.Each slice is considered as an image and has separate file names for the results of
each slice. Compared to the filename in tutorial 1, the file name of the stack results adds the
slice information to the end. For instance, the ".mat" files for fiber extraction results of the
slice 1 and slice 2 are "ctFIREout_ teststack3_s1.mat" and "ctFIREout_ teststack3_s2.mat"
respectively. The overlaid images of slice2 and slice 3 are named "OL_ctFIRE_teststack3_s1.tif"
and "OL_ctFIRE_teststack3_s2.tif", respectively and are shown below.
After processing all the slices, the ctFIRE will be reset. But post-processing can be done by
importing the ".mat" results of the fiber extraction as shown in Tutorial 4.
4.3 Tutorial 3: fiber extraction for multiple images
The procedure of processing multiple images is similar to processing a single image. One
difference is in step 1, before clicking on the "Import image/data" button, check the "Batchmode" allowing to select multiple images. As shown below, "testimage1.tif" and
"testimage2.tif" are selected.
The other difference is after processing all the images, the post-processing is not immediately
available and the ctFIRE will be reset. But post-processing can be done by importing the ".mat"
results of the fiber extraction as shown in Tutorial 4.
4.4 Tutorial 4: post processing for a ".mat" file
Step 1 import .mat file : check the ".mat" check box , then click on the "impart image/data"
button and select "ctFIREout_testimage1.mat". The associated original image is displayed and
output setting controls are enabled allowing to configure the output setting. Uncheck the
"Overlaying..." not to create new overlaid image and reconstruction image. Check the "Angle
histogram". The following figure is displayed.
step2 Post-processing the ".mat" file: uncheck the box for "Overlaid fiber" and check one for
"Angle histogram & values", then click on the "Post-processing" button. The angle histogram is
displayed as follows.
Step 3: rerun post-processing: Change the "Histogram bins number" from "10" to "20". Click on
the "Post-processing" button. The new angle histogram is displayed as follows.
5 Tips
1. For the images in batch processing, or slices in a stack, the images or slices should normalized
such as to have the same dynamic range.
2. Use Fiji or ImageJ to convert the image type to 8-bit image which is well supported for this
version
3. Setting fiber extraction parameters should consider image size, image contrast, fiber
features( such as width, curvature, density). Image size of 512 pixels by 512 pixels is suggested
so as to use most of the default values. All the parameters are adjustable via. csv file(default
parameters and corresponding description about each of them can be downloaded at LOCI
website ) but only some of the key parameters can be adjusted via GUI. The thresh_im2 to
remove the background is often the only parameters to be updated.
4. Post-processing ".mat" fiber extraction results to generate different output files. But be
careful not to move the original image to other place since its original path will be used during
the Post-processing.
5. Click on the "Reset" button to start over if there is any error occurred.
6 References
[1] “curvelet toolbox,” <http://www.curvelet.org/software.html> (19 July 2012).
[2] A. M. Stein, D. A. Vader, L. M. Jawerth, D. A. Weitz, and L. M. Sander, “An algorithm for
extracting the network geometry of three-dimensional collagen gels,” Journal of
Microscopy 232(3), 463–475 (2008) [doi:10.1111/j.1365-2818.2008.02141.x].