1
VIMOS User Manual
VLT-MAN-ESO-14610-3509
14
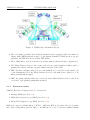
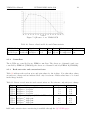
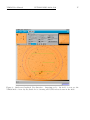
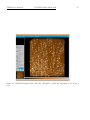
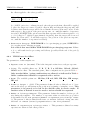
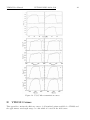
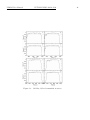
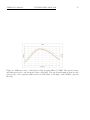
Figure 7: QE curve of one VIMOS CCD
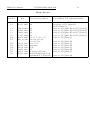
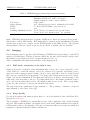
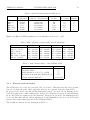
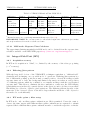
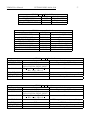
Table 10: Detector Readout Modes and Characteristics
VIMOS Mode
Imaging
Spectroscopy
2.5.2
Size
Speed
4×2k×2k 225kpx s−1
4×2k×4k 225kpx s−1
Binning Gain Port
Windowing
Readout time
1×1
Low 1-port Not supported 1 m
1×1
High 1-port Not supported 1 m
Controllers
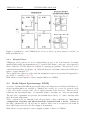
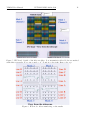
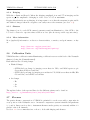
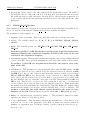
The 4 CCDs are controlled by two FIERA controllers. The detectors of channel 2 and 3 are
controlled by FIERA A (VIMOSA), the detectors of channel 1 and 4 by FIERA B (VIMOSB).
2.5.3
Read-out noise and conversion factor
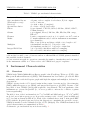
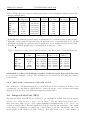
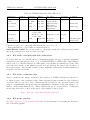
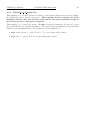
Table 11 indicates the readout noise and gain values for the 4 chips. Note that these values
are subject to change and are indicated here only for reference. Exact values have to be found
in the image headers.
Table 11: Detector read-out noise and conversion factors. For reference only, subject to change
Chip
CCD
CCD
CCD
CCD
CCD
CCD
CCD
CCD
1
2
3
4
1
2
3
4
Read-out Mode
RON [e− rms] K [e− /adu]
225 kpx s−1 , low gain (IMG mode)
5.3
1.70
−1
225 kpx s , low gain
5.2
1.86
225 kpx s−1 , low gain
5.3
1.95
−1
225 kpx s , low gain
4.9
1.80
−1
225 kpx s , high gain (MOS and IFU modes)
4.3
0.51
225 kpx s−1 , high gain
4.6
0.56
−1
225 kpx s , high gain
4.7
0.57
225 kpx s−1 , high gain
4.3
0.52
RON and conversion factor monitoring is available through the QC1 WEB pages