1
ServersMaster
Version 1.0.9
User Manual
ServersMaster User Manual
Copyright © Inteliance Corporation
All rights reserved. No part of this document may be reproduced in any form by any means without prior written
authorization of the publisher.
Other 3rd party products that are referred to in this document, are the property of, and may be either trademarks
and/or registered trademarks of the respective owners in the USA and/or other countries. The publisher and the
author make no claim to these products, trademarks or registered trademarks.
While care has been taken in the preparation of this document, the publisher and the author assume no
responsibility for errors or omissions, or for damages, including any consequential damages, of any kind that may
result from the use of information contained in this document or from the use of programs that are described in
it. In no event shall the publisher and the author be liable for any loss of profit or any other commercial damage
caused or alleged to have been caused directly or indirectly by this document.
Published: April 2013
Contents
Welcome to ServersMaster ............................................................................................................................................................................. 1
Introduction ..................................................................................................................................................................................................... 1
The Importance of Network Monitoring .............................................................................................................................................. 1
Why use ServersMaster? ............................................................................................................................................................................. 2
Key Features .................................................................................................................................................................................................... 2
Available Licenses .......................................................................................................................................................................................... 4
Software Installation .......................................................................................................................................................................................... 6
System Requirements .................................................................................................................................................................................. 6
Hardware Requirements ............................................................................................................................................................................. 6
Installation Instructions ............................................................................................................................................................................... 6
Quick Start Guide ............................................................................................................................................................................................... 8
Basic Concepts ..................................................................................................................................................................................................... 9
Check State Types ......................................................................................................................................................................................... 9
Global Settings ............................................................................................................................................................................................. 10
The difference between a Check Method and a Global Check ................................................................................................. 10
User Interface Overview ................................................................................................................................................................................. 12
Device Monitor Tab .................................................................................................................................................................................... 12
Device Timeline Tab ................................................................................................................................................................................... 13
Events Tab ...................................................................................................................................................................................................... 14
Reports Tab .................................................................................................................................................................................................... 14
Application Settings ................................................................................................................................................................................... 14
Events Management ........................................................................................................................................................................................ 15
Reports.................................................................................................................................................................................................................. 17
Device and Check Selection .................................................................................................................................................................... 17
Define Monitoring Period ........................................................................................................................................................................ 17
Displaying Non-Monitored Periods ..................................................................................................................................................... 17
Downtime Calculation Type .................................................................................................................................................................... 17
Report Components ................................................................................................................................................................................... 18
Save Report as HTML File......................................................................................................................................................................... 18
Application Settings ........................................................................................................................................................................................ 20
General Tab .................................................................................................................................................................................................... 20
Database Tab ................................................................................................................................................................................................ 20
Device Settings .................................................................................................................................................................................................. 21
General Tab .................................................................................................................................................................................................... 21
Checks Tab ..................................................................................................................................................................................................... 21
SSH Actions Tab ........................................................................................................................................................................................... 22
Service URLs Tab .......................................................................................................................................................................................... 22
Notes Tab ....................................................................................................................................................................................................... 22
Group Settings Template .............................................................................................................................................................................. 23
Check Methods.................................................................................................................................................................................................. 24
Ping ................................................................................................................................................................................................................... 25
Traceroute ...................................................................................................................................................................................................... 27
TCP Port Connect ........................................................................................................................................................................................ 28
TCP Port Advanced ..................................................................................................................................................................................... 29
TCP Port Range ............................................................................................................................................................................................ 31
HTTP Advanced ............................................................................................................................................................................................ 32
HTTP Transaction ......................................................................................................................................................................................... 34
HTTP SSL Certificate ................................................................................................................................................................................... 36
FTP Download Speed ................................................................................................................................................................................. 38
FTP Response ................................................................................................................................................................................................ 40
FTP File Size ................................................................................................................................................................................................... 41
SSH Cpu Load ............................................................................................................................................................................................... 43
SSH Memory Usage .................................................................................................................................................................................... 44
SSH HDD Usage ........................................................................................................................................................................................... 45
SSH Inodes Usage ....................................................................................................................................................................................... 46
SSH File/Dir count ....................................................................................................................................................................................... 47
SSH Remote Ping......................................................................................................................................................................................... 49
SSH Custom ................................................................................................................................................................................................... 51
SFTP File/Dir count...................................................................................................................................................................................... 53
SFTP File Size ................................................................................................................................................................................................. 55
Mail SMTP....................................................................................................................................................................................................... 56
Mail IMAP ....................................................................................................................................................................................................... 57
Mail POP3 ....................................................................................................................................................................................................... 59
Mail Route SMTP-IMAP ............................................................................................................................................................................ 61
Mail Route SMTP-POP3 ............................................................................................................................................................................ 63
SNMP Custom............................................................................................................................................................................................... 65
SNMP Traffic .................................................................................................................................................................................................. 67
DNS Black List ............................................................................................................................................................................................... 69
Reactions (Alerts & Remedies) .................................................................................................................................................................... 71
Appendix .............................................................................................................................................................................................................. 72
Abbreviations ................................................................................................................................................................................................ 73
Legal Notices ................................................................................................................................................................................................. 74
Support ............................................................................................................................................................................................................ 79
ServersMaster v1.0.8
User Manual
Welcome to ServersMaster
Introduction
ServersMaster is an easy-to-use and cost-effective Network Monitoring System (NMS). It monitors
network devices for failures and irregularities and automatically executes remedial actions in order to
fix problems before or right after they arise. Administrators can be notified on various network
conditions and they can use the integrated networking toolset to easily understand and troubleshoot
any issues.
The mission of the product is to safeguard your network infrastructure and your clients' satisfaction
through the automated system of recovery actions. As soon as a problem or anomaly is detected,
ServersMaster tries to fix it using a number of so-called Reactions that fire up when certain conditions
are met. This enables smooth operations of the websites and other applications in the monitored
network. Administrators can be immediately notified on the whole process of recovery, from the
problem detection till its final state. The event log provides interface similar to a mail client, allowing
you to filter events and write notes to a particular event. This enables you to have a better
understanding of the overall scenario and keep track what went wrong and in which part of the
network.
In a case when the problem requires human intervention, network administrators are just a click away
from the resolution as they can quickly use any of the following built-in networking tools: Ping,
Traceroute, Cross Ping, Cross Traceroute, Run SSH Commands, Open Service URL, Check Open Ports,
DNS Lookup, Reverse DNS, Domain Whois and IP Whois.
ServersMaster monitors the network for problems such as overloaded and/or crashed devices, low
performance of running services, huge traffic generation, to name a few. For example, to determine
the status of a webserver, ServersMaster may periodically send an HTTP request to fetch a page. For
email servers, a test message might be sent through SMTP and retrieved by IMAP or POP3. If there is
no reply or if the response is considered abnormal, ServersMaster can promptly take recovery actions.
Depending on the type of the Check a number of metrics can be measured such as response time;
availability; uptime; percentage or value of used resources; transfer speed and other metrics manually
defined by creating custom Checks. These metrics are used to define triggers for Check States, which
in turn can trigger execution of a number of alerts and/or remedial actions.
The Importance of Network Monitoring
Network service providers and online businesses can lose thousands of revenue dollars by the minute
as the network resources stay down. Their customers can demand compensation for their loss and
they may run away to the competition if problems are not resolved promptly enough.
The importance of keeping the network resources up and running has increased dramatically with the
reliance on technology in this modern era. The demand for capacity is growing at an exponential rate.
The number of servers being administrated and monitored is growing, and they are not necessarily
1
ServersMaster v1.0.8
User Manual
located in one data center. All these issues increase the value of network monitoring systems.
However, no worries in this regard, ServersMaster has exclusively low pricing model, keep reading the
following sections to find out more.
Why use ServersMaster?
ServersMaster in simple words means a reasonable spending on a network monitoring software. We
encourage you to try ServersMaster and protect your Business from unexpected network problems
while saving the investments for other important areas of your business. ServersMaster has all the
neat features discussed in this document at highly affordable prices.
To really know your network, you need a network monitoring solution that gives you real time
information about your network. ServersMaster has the monitoring and database engine, as well as
the user interface merged into a single desktop application. This provides super quick installation and
ease of use. More importantly, the Device Monitor screen updates the Check states on the screen
immediately when a new Check state is available.
As a desktop application, the user interface is quick and highly responsive, unlike network monitoring
solutions based on web technologies. Special C/C++ coding techniques and micro optimizations
enable ServersMaster to run thousands of Checks with low CPU and memory usage. The monitoring
window is able to display hundreds of Check states in only one visible page. In addition to the real
time status overview, administrators can easily track the lifetime of the device by generating reports in
graphical and tabular form.
Key Features
All-in-One application
Single Desktop Application
The monitoring and database engine, as well as the user interface are merged into a single
desktop application. This provides super quick installation and ease of use.
Instant Result Display
Having the engines and user interface merged into one application allows the status of
Checks to be updated on the screen as soon as Check results are available. This means that
you do not need to wait for a given interval (ex. each 60 sec) for the display to be refreshed.
Agent-less monitoring
No monitoring service (agent) is required on the monitored hosts.
Wide range of monitoring technologies
ICMP Checks
Ping, Traceroute.
TCP Port Checks
TCP Port Connectivity, TCP Port Advanced, TCP Port Range.
SSL Checks
SSL Certificate Expiry.
2
ServersMaster v1.0.8
User Manual
HTTP(S) Checks
HTTP Advanced, HTTP Transaction.
Note: Different types of response values can be inspected.
Disk, Memory and CPU Checks
SSH HDD Usage, SSH Inodes Usage, SSH Memory Usage, SSH CPU Load.
Mail Checks
IMAP, POP3, SMTP, Route SNMP-IMAP, Route SNMP-POP3.
SNMP Checks
SNMP Traffic, SNMP System Uptime, SNMP Custom.
Note: The integrated SNMP explorer helps creating custom SNMP checks.
File Checks
SSH File Count, SFTP File Size, SFTP File/Dir Count, FTP Download Speed, FTP Response, FTP
File Size.
Miscellaneous Checks
DNS Black List , SSH Custom.
Are you looking for a Check technology not already supported? Please let us know about your
requirement and we will do our best to implement it as soon as possible.
Automatic alerts and remedial actions
Provides a number of so-called Reactions that fire up when certain conditions are met. They can be
used to alert administrators on certain status or automatically execute actions in order to recover from
failure without human intervention. A number of actions are provided including:
Send email
Send SMS
SSH multi command execution
HTTP(S) action
Execute program
Play sound
Show popup message
Compact Monitoring Window
Devices are organized in groups in a tree view fashion. Checks and their status are displayed in only
one row per monitored device. This compact view makes it easy to track down problem location even
when hundreds of Checks are displayed in only one visible screen page
Network Recovery Toolset
Some network issues require human intervention to be resolved. Admins can use any of the following
tools via simple right click menu in the device list window: Ping, Traceroute, Cross Ping, Cross
Traceroute, Run SSH Commands, Open Service URL, Check Open Ports, DNS Lookup, Reverse DNS,
Domain Whois and IP Whois.
3
ServersMaster v1.0.8
User Manual
Advanced Events Log
When a Check state is negative, an event is saved in the event log. Events may be continuously
updated with the latest result until the state is changed. Admins can mark the importance of events
and can write notes to individual events in order to better track down and resolve issues.
Flexible Monitoring Data Storage
The network monitoring process can potentially store a large amount of information into the
database. ServersMaster can save full monitoring data, meaning the result values of each Check. In
case you need to decrease the database size an alternative is provided which uses special algorithm to
aggregate monitoring data. In most cases, the results are very similar between the aggregated and full
monitoring data.
Reports and real-time data view
Follow real time Check result data in chart and tabular form.
Generate graphical reports for one or multiple devices. Historical data of multiple devices can
be easily compared through combined charts.
A report can be exported to a single HTML file with charts embedded into the html code. This
way reports can be easily shared among people, printed or saved to other formats.
High performance
ServersMaster can run thousands of Checks with low CPU and memory usage. Even on a netbook, you
can run more than 1000 checks without any problem. This is enabled by the micro-optimized C/C++
code, asynchronous connections and threads re-usage.
Database security
The settings of some components (like SSH based Checks or Email alerts) require sensitive information
such as login credentials to be saved in the database. All these settings are stored with AES 256 bit
encryption using the admin password as the encryption key.
Available Licenses
You can start with a 30-day Trial Edition License that enables you to configure and test a fully
functional version for up to 30 days. When the trial period is over you can continue on to use a limited
version that has the monitoring engine disabled.
The commercial license comes in a number of editions. For more information about product editions
and ordering a license product key, please visit our website at
http://inteliance.com/go/store/serversmaster.
4
ServersMaster v1.0.8
User Manual
Installing the License Product Key
When the Trial Period is over you will be reminded to activate the product by a popup Activation
Dialog. To activate the product before the end of the trial period, at the application menu bar select
Help/About, and then in the About Dialog click the "Activate now" link.
The activation dialog requires you to enter (or copy/past) the product key. The activation process uses
the internet connection to validate the product key. When the key is validated, you will be informed
for the successful activation and you will be requested to restart the application for the license to take
effect.
5
ServersMaster v1.0.8
User Manual
Software Installation
System Requirements
These are the 32-bit and 64-bit supported operating systems:
Windows Server 2012
Windows Server 2008 (R1 and R2) – Standard, Enterprise
Windows 7 - Standard, Professional, Enterprise
Windows Vista – Enterprise, Business, Ultimate
Windows XP SP2 or later
Kubuntu version 12.10 or later *
Note: You can try Windows or Linux systems not currently supported, but in that case we may not be
able to fully assist you if you encounter an OS specific issue.
* The supported file systems on a Linux platform are ext3 and ext4, the latter one is recommended.
Hardware Requirements
Minimum requirement:
CPU: 2GHZ
RAM: 1 GB
Hard Disk space: 100 Mb
Recommended requirement for up to 1000 checks:
CPU: Dual Core 2 GHZ
RAM: 2 GB
Hard Disk space: 1 GB
Recommended requirement for up to 10000 checks:
CPU: Quad Core 3 GHZ
RAM: 8 GB
Hard Disk space: 4 GB
Installation Instructions
Installing on the Windows platform
1.
Download the ServersMaster installer from the Inteliance website. Select the file according to
your operating system and bit count.
2.
Run the installer and follow the steps of the installation Wizard to complete the install.
3.
Once the installer finishes, ServersMaster is available at the Windows Start Menu.
6
ServersMaster v1.0.8
4.
User Manual
ServersMaster application has only one executable file, which integrates the database and
monitoring engine, as well as the user management interface. This makes the installation of
the whole network monitoring system super quick and easy.
5.
ServersMaster requires administrator privileges in order to use ICMP protocol based
components, such as Ping and Traceroute Checks. Please refer to the manual of your
Windows version for how to run an application as administrator.
Installing on the Linux platform
1.
Download ServersMaster package file from the Inteliance website. Select the file according to
your operating system and bit count.
2.
Create a new directory under the user home directory and unpack the archive in there.
3.
Select all files in the directory and change their access permission to 777.
4.
To run the application use the "serversmaster" executable file. Create a desktop link if needed.
5.
The ServersMaster executable file integrates all the components of the network monitor
system, including the database and monitoring engine, as well as the user interface.
6.
ServersMaster requires administrator (root) privileges in order to use ICMP protocol based
components, such as Ping and Traceroute Checks. Please refer to the manual of your Linux
distribution for how to run an application as root.
7
ServersMaster v1.0.8
User Manual
Quick Start Guide
This is a 1-minute guide provided for experienced users to start using ServersMaster as fast as
possible.
1.
Download ServersMaster from Inteliance website and install it.
2.
When you start up ServersMaster, you will need to enter the admin password. The password is
used for database encryption (AES 256bit). Please note that there is no recovery option if you
lost the password.
3.
The main application window has 4 main sections separated as tab pages: Device Monitor,
Device Timeline, Events, and Reports.
4.
Device Monitor section is used for device management and monitoring. To add new device or
group, right click at the tree view and select Add New Device or Create Group from the menu.
5.
To open the device settings window, right click on a device item and select Settings. Here you
can add and configure the Checks, Alerts, Remedies, Service URLs and SSH Actions that are
activated per device. When the settings are saved, the Checks are instantly executed and
Checks state is updated on the screen.
6.
To start the monitoring, open device settings, select the Checks tab page, and add a Global
Check to the list of activated Checks. The Check settings by default are inherited from the
Global Check, but you can customize it by simply turning off the inheritance. A number of
built-in Global Checks are shipped with the installation, however there are many Check
Methods that you can use to create your own Global Checks that suit your needs.
7.
Below the tree view you can find the network tools window. There are two ways to use the
network tools: a) Enter the values and options in the respected tool page, or b) Right click on
a device in the tree list and select a tool from the Tools menu.
8.
The Device Timeline tab page provides overview of the current state of Checks per device. It
also shows the monitoring history in a graph and tabular view.
9.
The Events tab page provides a management interface that works in a similar way to a mail
client. When a Check state is negative (Unknown, Warning or Down) an event is saved in the
event log. Events are continuously updated with the latest result till the Check state is
changed. Admins can mark the importance of events and can write notes to individual events
in order to better track down and resolve issues.
10. The Reports tab page provides tabular and graphical view of the monitoring data for a given
period of time. A special feature is to merge reports from several devices into a single one, for
much clearer comparison and overview of a group of devices.
8
ServersMaster v1.0.8
User Manual
Basic Concepts
The Checks are the core actions that perform monitoring of devices. Checks execute functions to test
a target device or service. They return formatted result message and response values in several result
channels. The response values are inspected by state triggers used to change the current state of the
Check. When the Check state is changed, re-actions can fire up in order to notify administrators
and/or run remedial actions. This is the general process of monitoring and recovery.
Before going further, let us clear up some basic concepts on:
What are the different Check State types
What are the Global Settings
What is the difference between a Check Method and a Global Check
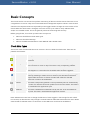
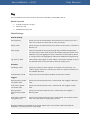
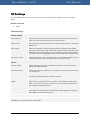
Check State Types
The current state of monitored devices or services in short is called the Check State. These are the
possible Check states:
Icon
State Name
Description
Up
The target device returned response value that is in the range of the OK
threshold.
Warning
The response value is outside the OK threshold. The Check State may soon
turn into Down or return to Up if the cause is only a temporary problem.
Down
The host or service is unavailable or returns invalid response. In addition, the
state happens in a case when the threshold value has been triggered.
Unknown
No response value can be obtained. The response value is required to trigger
either Up, Warning or Down state. For instance, the SSH CPU Load Check
requires SSH connection to obtain the CPU load values but the SSH
connection could not be established.
Paused
The Check is temporarily paused. It can be paused by users or automatically
in a case of a network connection problem on the local machine. This state is
not saved when the application quits.
Disabled
The Check is disabled for undefined time by the user. It can be enabled at
any time. This state is saved between application restarts.
Note: Administrators are free to change the behavior of state triggers in the settings for each Check.
For instance, an administrator may configure a Check based on SSH CPU Load method to return Down
state instead of Unknown state if a connection to the SSH server could not be established.
9
ServersMaster v1.0.8
User Manual
Global Settings
You may notice the word “Global” used for various settings in ServersMaster, in example: Global
Checks, Global SSH Actions, Global Service URLs, etc. We designed the software around the
philosophy of Global Settings to reduce the configuration time when new items are added for
monitoring.
The main things to remember for the Global Settings are:
1.
Available to all devices
You can activate a particular Global Setting to any device. For example, you create one Global
Check named "SMTP-IMAP route" and you can add it to any device for monitoring. You can
create a Global SSH Action called "MySQL restart" and activate it as a reaction to a Check
result to any device.
2. Unified management
Changes made to the Global Settings take effect immediately to any component that is using
it.
3. Placeholders
Most Global Settings can accept the usage of placeholders. For example, you can configure a
Global SMS Alert to send SMS to {ADMIN_PHONES}, which is a placeholder that will be
translated on the fly. When the alert is executed, SMS messages will be sent to the admin
phone numbers configured in the affected device settings.
4.
Configuration
All Global Settings are available in the "Options" menu under the menu bar. For simplicity of
use, you can manage Global Settings in the settings dialog per individual component. For
example, you can create new Global Check in the device settings window, under the Checks
tab page.
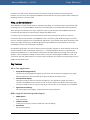
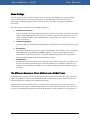
The difference between a Check Method and a Global Check
Check Methods are the base functions that perform tests that verify the condition of the given host,
service or application. They are not to be used directly as Checks for a certain device. They are the
base technology for creating the so-called Global Checks.
Global Checks can be activated per device to perform the monitoring action. They can be further
customized per each device if needed. Administrators can create unlimited Global Check types using
any of the Check Methods available. The following diagram puts this explanation into perspective:
10
ServersMaster v1.0.8
User Manual
Activated
Checks
per device
Global
Checks
Check
Methods
IMAP Message Find
IMAP Response
HTTP Transfer Speed
SNMP System
(custom down triggers)
Uptime
HTTP Transfer Speed
Time
SNMP System
Uptime
IMAP Message
HTTP Page Source
SSH My Service
Find
Check
Status
Mail IMAP
HTTP
SNMP Custom
11
SSH Custom
ServersMaster v1.0.8
User Manual
User Interface Overview
The first thing you have probably noticed is the simplified User Interface (UI). Our design goal is to
provide fast workflows through a clean UI. So let us see take a look at the basic UI and see if we can
quickly learn how ServersMaster works.
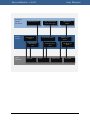
The application window is designed around a “tabbed layout” system. The tabs at the top that allow
you to quickly access the major sections of the program. The main application tabs are:
1.
Device Monitor
2.
Device Timeline
3.
Events
4.
Reports
The application menu bar contains options that are self-explanatory so it will not be covered in much
detail. The four major application tabs will be explained in the following pages.
Device Monitor Tab
The Device Monitor tab is separated into two parts:
1.
Device List Window
2.
Network Tools Window
Device List Window
This window displays the tree list of devices and separate columns for their current states. All checks
activated per device are displayed in one row and this provides at a glance view of hundreds of
Checks states in only one visible screen page. To further save screen space there is no classical toolbar.
All the options are available in the right-click menu (or the Context Menu).
If you open the menu over a group item, it will allow you to run actions for all devices under the same
group. Similarly, you can select a number of devices and run an option from the menu to the whole
selection. In example, you can open the menu on a group and select the Ping tool to execute pings for
all devices under the selected group.
The options in the right-click menu are as follows:
Timeline
Opens the Timeline for the selected device that shows an overview of the Check states, the
last response message and values, as well as the monitoring history in a graph and tabular
view.
Events
Opens the events log. The events displayed are filtered for the selected devices or groups at
the time when the right-click menu was opened.
12
ServersMaster v1.0.8
User Manual
Tools
Provides a sub-menu of network tools available for the selected devices or groups, such as:
Ping, Traceroute, Cross Ping, Cross Traceroute, DNS Lookup, Reverse DNS, etc. The network
tools window is displayed in the same tab - the Device Monitor Tab.
Reports
Opens a sub-menu with available checks for which reports can be generated. You can select
more devices or groups and invoke the menu option to create a combined report.
Pause Checks
Opens a submenu of available Checks that can be paused. This option temporarily pause the
Checks during the runtime of the application. Checks can be un-paused at any time using the
option Restart Checks. A paused Check and a disabled Check has different meaning. Users can
disable a Check for undefined time and this state is saved between application restarts, unlike
a paused Check, which is automatically activated when the application starts.
Restart Checks
Opens a submenu of available Checks that can be restarted. This option will activate the
paused Checks or will execute the Checks immediately without waiting for the check interval
to complete.
Service URL
Opens a sub-menu of predefined Service URLs for the selected device. The Service URLs can
be configured in the Device Settings dialog.
SSH Action
Opens a sub-menu of predefined SSH Actions enabled for the selected device. For the SSH
Actions to work you need to configure the SSH login credentials for the device. The SSH
Actions can be configured in the Device Settings dialog.
New
Opens a sub-menu that provides options for adding new devices or groups. The special
option "Edit as new" allows you to create a duplicate of the selected device.
Settings
Opens the Device Settings dialog used to configure the General Device Details, Checks, Alerts,
Remedies, Service URLs, SSH Actions and Notes.
Network Tools Window
This window provides a number of important networking tools available in different tabs. You can
change the window position using the following option in the menu bar: "View/ Network Tools
Orientation". You can hide the tools window using the arrow key located in the upper left corner (only
available if the window is positioned below the Device List Window).
Device Timeline Tab
The Device Timeline tab page provides overview of the current state of Checks per device. It also
shows the monitoring history in a graph and tabular view. To quickly access the timeline of a specific
Check simply double click on the Check item displayed in the Device List Window.
13
ServersMaster v1.0.8
User Manual
Events Tab
This tab provides a management interface for Events similar to a mail client. Events are triggered only
if a Check state is negative (Unknown, Warning or Down) or if there is an error while executing
reactions (alerts or remedies). To quickly filter events for particular devices simply select one or more
devices or a group in the Device List Window and double click on any selection in the position of the
Events Column.
Reports Tab
This tab provides a tabular and graphical view of the monitoring data for a given period of time.
Multiple devices can be selected in order to create a combined report. To create reports for one or
multiple devices, open the right-click menu over the selection of devices in the Device List Window
and select an option from the Reports sub-menu.
Application Settings
The application wide settings are available in "Options/Application Settings" under the menu bar.
Refer to the section "Application Settings" in this document for more information.
14
ServersMaster v1.0.8
User Manual
Events Management
The Events management interface is available under the Events tab. It provides functionality similar to
a mail client, with the difference that some events can update their data continuously.
There are two main event types:
1.
Device Issues
These events are triggered when a Check State changes to Unknown, Warning or Down (also
called Negative States). These events are continuously updated with the latest response
message and state duration until the Check state is changed.
2.
Reaction Errors
These events are triggered if there is an error during execution of reactions (Alerts or
Remedies). For instance, if the Check State is down for more than 30 min, an email action
could be made to inform administrators on the problem. However if the email could not be
sent a Reaction Error event is saved.
These are the main features of the Events interface:
Number of unread events
The Events Tab itself shows the number of unread events. When you click on event item, it is
marked as read. The administrator can turn back to unread state if needed.
Filtering per device and checks
To display events for particular devices and checks you can use the selection boxes at the. The
other way, and much more intuitive, is to do this from the Device Monitor window - simply
select devices in the Device List Window, open the right-click menu and click the Events item.
Additional filters
To get a better overview of the events, you can further filter the list by
a) Read/Unread events.
b) Starred/Not starred events.
c) Noted/Not noted events.
Current (live) events
Current or live events are those generated for the current Check State. In example, if a Check
turns to Down state, an Event in a red color appears in the log. Until the state is Down the
event cannot be deleted, because it may receive status updates.
Duration of a state
Events related to device issues are constantly updated with the total duration of the current
state shown in the corresponding column.
Result messages
The last result message is displayed in a separate text box on the right when you click on an
event item. If the event is related to a device issue, the initial result message is shown as well.
Notes per event
To write or update a note for an event, select a particular event and use the text box located
at the lower right corner. The [Save] button needs to be clicked for the changes to be saved.
15
ServersMaster v1.0.8
User Manual
Events and Alerts do not refer to the same thing. Alerts fire certain actions to send a notification to the
administrators by external means, outside the scope of the application. On the contrary, the Events log
is the internal notification system that displays the network problems detected during the monitoring
and errors encountered during the execution of reactions.
You can safely delete any event and keep only the important ones that relate to the current problem
or to an important problem from the past. When you delete an event, you do not delete any
monitoring data used by the Device Timeline or Reports, because Events are saved in a separate table
in the database.
By default, all negative states of devices such as Unknown, Warning or Down state are saved in the
Events log. However, you can adjust the events trigger for a particular Check to consider only specific
states. For instance, using the Check Settings dialog you can configure a Check to save Events to the
log only on Warning or Down state, but not when the state turns to Unknown.
16
ServersMaster v1.0.8
User Manual
Reports
The Reports interface is available under the Reports tab. It provides a tabular and graphical view of
the monitoring data for a specified period of time. Reports are generated for a specific Global Check
activated for a particular device. If more devices use the same Global Check, their monitoring data can
be incorporated into a single (or combined) report.
The key points of a Report generation workflow are:
Device and Check Selection
Use the device drop-down box to select a particular device. To select multiple devices, hold down the
control key while using the left-mouse click. Then select a particular Check from the second dropdown box.
Define Monitoring Period
Select any of the predefined earlier dates. You can manually define monitoring period using the
option "Specific period", then enter the start and end date.
Displaying Non-Monitored Periods
A non-monitored period may refer to a period when:
The Check was disabled or paused.
The Check state was Unknown. This means that there was no response value that could have
been used to determine the Down, Warning or Up state.
ServersMaster was not running or it was automatically paused. This can happen due to
network connection issues on the local machine.
If you check the option "Show non-monitored periods", ServersMaster will paint the non-monitored
area in a gray color for better overview. Otherwise, the chart lines will simply have gaps that represent
the non-monitored period.
Downtime Calculation Type
This option defines whether only one Down state is enough to count as a Down time or there must be
at least two consecutive Down states. Consider the following scenario:
1.
Check State: Up - time: 16:00
2.
Check State: Down - time: 16:10
3.
Check State: Up - time: 16:20
If the selected option is "Between arbitrary and Down state" then the single (non-consecutive) Down
state shown in the above example will be included in the total Down time in the report. This
17
ServersMaster v1.0.8
User Manual
calculation is not completely accurate when there is only a single Down state, and the reason is simply
because we need at least two Down states in a row to be able to measure the time span between
them. In such case, ServersMaster calculates the down time from the time of the previous state (any
state other than Down returned by the Check test) till the time of the Down state. In our example
above that would be 10 minutes of Down time.
If the selected option is "Between at least two Down states" then the single (non-consecutive) Down
state shown in the above example will be not be included in the total Down time in the report. This
option helps creating reports that are more accurate since they always show the exact duration of the
Down time. Administrators prefer to use this type of Down time calculation because in most cases a
single Down state is considered a temporary problem.
Temporary network delays may be the cause of "false" Down states. To make sure you only get a
"real" Down state, configure the Check to make more retries in a single run. In example, for a TCP Port
Check you can set a value of 3 connection retries.
Report Components
When you click the "Show Report" button, a report is generated that consists of two parts:
Graphs
One or more interactive charts will be displayed depending on the type of Check. If you select only
one device to generate report for, the areas in the graph will be filled with a color. If you combine
more devices into one report, each device will be represented with a separate line in a different color.
The interactive charts provide the following options:
1.
To see values of a specific line point, mouse hover over lines in the chart;
2.
To zoom a chart area, hold the shift key while moving the mouse wheel;
3.
To pan the chart area upon zooming, hold the mouse left-click and drag the area left or right.
Table of monitoring data
You can find the monitoring data organized in a table at the bottom of the report. Only one page with
a maximum of 50 items is displayed at a time. You can navigate to other pages using the controls
located in the table footer and header. If you have configured the data storage to a type of
aggregation instead of a raw data storage type, then the column "Number of Checks" will display the
number of Checks accounted by the aggregation algorithm for the corresponding record.
Save Report as HTML File
Use the "Save As" button positioned right below the "Show Report" button to exported the report to a
single HTML file. The charts will be embedded into the html code. Having all data and images in one
file makes it simple to share the report. To convert the report to another format, you will need to
open the html file in a browser and export it to other formats from there. Same goes for printing the
HTML based report, you will need to open in a browser first and use the browser's printing options.
18
ServersMaster v1.0.8
User Manual
The table of monitoring data that is a part of the HTML file will contain all the monitoring data for the
specified period. If there is many data it will take more time to generate the HTML file, please be
patient is such case.
19
ServersMaster v1.0.8
User Manual
Application Settings
To open the application settings interface select "Options/Application Settings" under the menu bar.
The main tabs provided in the application settings are: 1) General and 2) Database. The options in
these tabs will be explained in the following pages.
General Tab
This section provides the following options:
Localization
Allows you to modify the date and time format used across the application, including the
format used in the reports.
Administrator password
Allows you to change the administrator password used to login to the interface and to
encrypt the sensitive information in the database. The password change requires the database
to be re-encrypted. If the database is too large this process may take a while, please be
patient.
Updates
Allows you to configure whether ServersMaster should automatically check for version
updates when it is stared up.
Database Tab
This section provides information about the size of the database file and options to shrink it and
speed it up. The size of the database may grow faster if Checks are configured to store full monitoring
data instead of aggregated data. You can alter this behavior in the Check options.
If you find the size too big you can reduce it by deleting old records related to the monitoring data
storage.
If you experience slow downs when generating the monitoring history and reports you can use the
option "Defragment database". The defragmentation process will reconstruct the database file
resulting in a faster access time.
20
ServersMaster v1.0.8
User Manual
Device Settings
The device settings dialog provides options for all the aspects of a monitored device including the
configuration of checks and reactions. To open the settings dialog, right-click on a device under the
Device Monitor tab and select "Device Settings" from the pop-up menu.
The device settings dialog is organized in sections provided under the following tabs: General, Checks,
SSH Actions, Service URLs and Notes. These sections will be described in the following pages.
General Tab
This section allows you to specify the following options:
Display Name
Enter the name that will be displayed in the Device List.
DNS Name or IP Address
Enter the DNS Name or IP Address of the device.
Credentials for SSH enabled systems
Enter the SSH username, password and port if the device supports SSH protocol. If you don't
specify anything here you will not be able to run SSH based checks, alerts and remedies on
the device.
Admin contacts
Enter values for admin emails and phone numbers. You can use these values as placeholders
in Check or Reaction options. For example, when you configure an email alert action, you can
use {ADMIN_EMAIL} in the "To" field. The {ADMIN_EMAIL} placeholder will be translated to the
administrator's email configured in this section when the email is about to be sent.
Checks Tab
This tab provides an interface for the configuration of Checks used to monitor the device. The steps to
add a Check to the device are:
1.
Select a Global Check from the drop-down box located at the top of the tab window.
Note: A number of built-in Global Checks are shipped with the installation, but they do not
cover all the available Check Methods. You can create your own Global Checks that suit your
needs. To do that click the button "Create new Global Check" and follow the wizard.
2.
Click the button "Add Global Check to device". The Global Check will be included in the list of
activated Checks for the device.
3.
To open the Check Settings dialog, select one Check from the list of activated Checks and
click the "Customize" button. By default, options are inherited from the Global Check.
However, you can customize the Check settings by simply turning off the inheritance.
4.
You can notice a check box in front of the names of activated Checks. You can uncheck the
box if you want to disable the Check. This feature is provided in case you do not want to
delete the Check because you may reuse it some time in the future.
21
ServersMaster v1.0.8
User Manual
SSH Actions Tab
In this section, you can create a list of SSH Actions that will be available in the right-click menu
opened at the Device List under the Device Monitor Tab. The concept of Global options is used
meaning you will first need to create Global SSH Actions that can be included to any device, and then
select a number of them to be activated for the device that is being configured.
Service URLs Tab
In this section, you can create a list of Service URLs that will be available in the right-click menu
opened at the Device List under the Device Monitor Tab. The concept of Global options is used
meaning you will first need to create Global Service URLs that can be included to any device, and then
select a number of them to be activated for the device that is being configured.
Notes Tab
The Notes tab provides a text editor that you can use to write notes specific to the device being
configured. The notes are saved in the database in an encrypted form, which provides a safe way to
keep the notes that contain sensitive information.
22
ServersMaster v1.0.8
User Manual
Group Settings Template
The group settings template is a settings dialog that provides the exact same options like the Device
Settings dialog. The settings configured here are used as a template when you add a new device
under a particular group.
To open the settings dialog, right-click on a group under the Device Monitor tab and select "Group
Settings Template" from the pop-up menu.
23
ServersMaster v1.0.8
User Manual
Check Methods
Check Methods are the base functions that perform tests that verify the condition of the given host,
service or application. They are the base technology used by Global Checks.
When you configure the monitoring for a device, you apply a number of Global Checks. Each Global
Check uses one of the Check Methods like Ping, HTTP, SMNP, etc. These are the steps to create a
Global Check:
1.
Open "Options/Global Checks" located under the menu bar.
2.
Click the New button at the Global Checks dialog.
3.
Select a Check Method and then click "Next".
4.
Enter the parameters in the Check Settings dialog and then click "Save".
The different types of Check Methods available will be explained in the following pages.
24
ServersMaster v1.0.8
User Manual
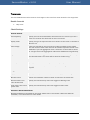
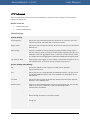
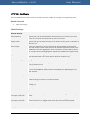
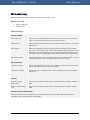
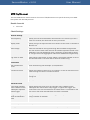
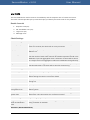
Ping
This Check Method is used to monitor devices for availability using ICMP protocol.
Result channels
1.
Average response time (ms)
2.
Packet loss (%)
3.
Standard deviation (ms)
Check Settings
General settings
Scan frequency
Specify the time interval between two executions of a Check. If you use a
value of 5 minutes, the Check will run every 5 minutes.
Display result
Specify the type of response value to be shown on the screen in the Device
Monitor List.
Data storage
Select the method for storing monitoring data. Full data storage means
that the results of each Check scan will be saved as separate records in the
database. If you use aggregation then a collection of results will be saved
as a single record. The aggregation reduces the database size significantly.
Log event on state
Select which states trigger an event. When a Check state changes to any of
the selected states a new event will be saved in the Event log.
Execution
Rounds per check
Specify the number of echo requests to send per one Check scan. You
need to specify more than 2 rounds if you want to track the fluctuations in
the standard deviation.
Time between rounds
Specify the time to wait before sending the next echo request.
Triggers
Warning state if packet
loss greater than
Specify the minimum packet loss, in milliseconds, that triggers a Warning
state.
Down state if packet
loss greater than
Specify the minimum packet loss, in milliseconds, that triggers a Down
state.
Warning state if
response time greater
than
Specify the minimum response time, in milliseconds, that triggers a
Warning state.
Down state if response
time greater than
Specify the minimum response time, in milliseconds, that triggers a Down
state. This value works as a ping reply timeout.
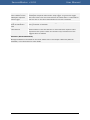
Reactions (Alerts & Remedies)
Manage the Reactions activated for the Check. Please refer to the chapter "Reactions (Alerts &
Remedies)" in this document for more details.
25
ServersMaster v1.0.8
User Manual
26
ServersMaster v1.0.8
User Manual
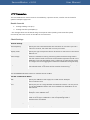
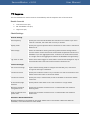
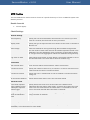
Traceroute
This Check Method is used to monitor the changes in the route from an IP network to the target host.
Result channels
1.
Hop count
Check Settings
General settings
Scan frequency
Specify the time interval between two executions of a Check. If you use a
value of 5 minutes, the Check will run every 5 minutes.
Display result
Specify the type of response value to be shown on the screen in the Device
Monitor List.
Data storage
Select the method for storing monitoring data. Full data storage means
that the results of each Check scan will be saved as separate records in the
database. If you use aggregation then a collection of results will be saved
as a single record. The aggregation reduces the database size significantly.
Log event on state
Select which states trigger an event. When a Check state changes to any of
the selected states a new event will be saved in the Event log.
Execution
Rounds per check
Specify the number of echo requests to send per hop.
Time between rounds
Specify the time to wait, in milliseconds, before sending the next echo
request.
Triggers
Reply timeout
Specify the time, in milliseconds, to wait for a reply before timing out.
Max hop count
Specify the maximum number of hops to search for the target host.
Warning state if hop
count greater than
Specify the minimum hop count that triggers a Warning state.
Down state if hop count
greater than
Specify the minimum hop count that triggers a Down state..
Reactions (Alerts & Remedies)
Manage the Reactions activated for the Check. Please refer to the chapter "Reactions (Alerts &
Remedies)" in this document for more details.
27
ServersMaster v1.0.8
User Manual
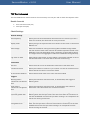
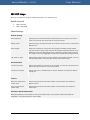
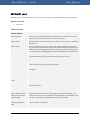
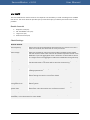
TCP Port Connect
This Check Method is used to monitor the connectivity to a TCP port.
Result channels
1.
Port connection time (ms)
Check Settings
General settings
Scan frequency
Specify the time interval between two executions of a Check. If you use a
value of 5 minutes, the Check will run every 5 minutes.
Display result
Specify the type of response value to be shown on the screen in the Device
Monitor List.
Data storage
Select the method for storing monitoring data. Full data storage means
that the results of each Check scan will be saved as separate records in the
database. If you use aggregation then a collection of results will be saved
as a single record. The aggregation reduces the database size significantly.
Log event on state
Select which states trigger an event. When a Check state changes to any of
the selected states a new event will be saved in the Event log.
Connection
TCP port
Specify the TCP port to be used when connecting to the target host.
Connection retries
Specify the number of times to try to connect in a case of connection error
before setting the result to connection failed.
At connection failed set
Specify which Check state to set if the connection failed.
Triggers
Warning state if
connection time greater
then
Specify the minimum connection time, in milliseconds, that triggers a
Warning state.
Down state if
connection time greater
then
Specify the minimum connection time, in milliseconds, that triggers a
Down state. This value works as a connection timeout.
Reactions (Alerts & Remedies)
Manage the Reactions activated for the Check. Please refer to the chapter "Reactions (Alerts &
Remedies)" in this document for more details.
28
ServersMaster v1.0.8
User Manual
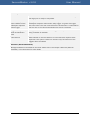
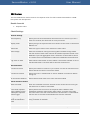
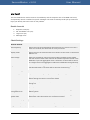
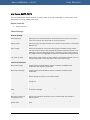
TCP Port Advanced
This Check Method is used to monitor the connectivity to a TCP port and to check the response value.
Result channels
1.
Port connection time (ms)
2.
First byte time (ms)
Check Settings
General settings
Scan frequency
Specify the time interval between two executions of a Check. If you use a
value of 5 minutes, the Check will run every 5 minutes.
Display result
Specify the type of response value to be shown on the screen in the Device
Monitor List.
Data storage
Select the method for storing monitoring data. Full data storage means
that the results of each Check scan will be saved as separate records in the
database. If you use aggregation then a collection of results will be saved
as a single record. The aggregation reduces the database size significantly.
Log event on state
Select which states trigger an event. When a Check state changes to any of
the selected states a new event will be saved in the Event log.
Connection
TCP port
Specify the TCP port to be used when connecting to the target host.
Connection retries
Specify the number of times to try to connect in a case of connection error
before setting the result to connection failed.
At connection failed set
Specify which Check state to set if the connection failed.
Triggers
Warning state if
connection time greater
then
Specify the minimum connection time, in milliseconds, that triggers a
Warning state.
Down state if
connection time greater
then
Specify the minimum connection time, in milliseconds, that triggers a
Down state. This value works as a connection timeout.
Warning state if first
byte time greater then
Specify the minimum first byte time, in milliseconds, that triggers a
Warning state. The first byte time is the time from when the connection to
the host established until the first byte starts coming in as a response from
the service running on the host.
Down state if first byte
time greater then
Specify the minimum first byte time, in milliseconds, that triggers a Down
state. The first byte time is the time from when the connection to the host
established until the first byte starts coming in as a response from the
service running on the host.
29
ServersMaster v1.0.8
User Manual
Check response content
Send command
Enter the command to send to the host as soon as the service running on
the target port is ready to accept data.
If the initial response
value is different form
subsequent response
values trigger
Specify which state to be set if the initial response value is different form
subsequent response values. Select "Skip trigger" to ignore this trigger.
The initial value is the one returned from the Check when it is executed for
the first time or the value returned when the Check is restarted.
Triggers for Up, Warn,
Down and Unknown
state
Configure the advanced Check state triggers that inspect the result values
using a number of methods.
Case sensitive
Select whether to use case sensitive or case insensitive response value
inspection. This option is taken into account only if at least one of the
triggers above is enabled.
Reactions (Alerts & Remedies)
Manage the Reactions activated for the Check. Please refer to the chapter "Reactions (Alerts &
Remedies)" in this document for more details.
30
ServersMaster v1.0.8
User Manual
TCP Port Range
This Check Method is used to monitor the status on a range of ports (open/closed) on the target
device.
Result channels
1.
None
Check Settings
General settings
Scan frequency
Specify the time interval between two executions of a Check. If you use a
value of 5 minutes, the Check will run every 5 minutes.
Display result
Specify the type of response value to be shown on the screen in the Device
Monitor List.
Data storage
Select the method for storing monitoring data. Full data storage means
that the results of each Check scan will be saved as separate records in the
database. If you use aggregation then a collection of results will be saved
as a single record. The aggregation reduces the database size significantly.
Log event on state
Select which states trigger an event. When a Check state changes to any of
the selected states a new event will be saved in the Event log.
Execute
TCP port range
Specify the TCP ports to be scanned for connectivity on the target host.
Example: 80,9000-9010,143
Connection retries
Specify the number of times to try to connect in a case of connection error
to a single port.
Connection timeout
Specify the time, in milliseconds, to wait to establish a connection before
timing out and setting the port status to Closed.
If any port is open
trigger
Specify which state to set in case if any port in the specified range is open.
Select "Down" state if you want to monitor if the firewall is working fine.
Select "Up" state if you want to monitor if the host accepts connection on
ports used by important services.
Port scan delay
Specify the time to wait before scanning another port from the specified
port range. Increase this value if the Firewall on the target host treats the
port range scan as malicious activity.
Reactions (Alerts & Remedies)
Manage the Reactions activated for the Check. Please refer to the chapter "Reactions (Alerts &
Remedies)" in this document for more details.
31
ServersMaster v1.0.8
User Manual
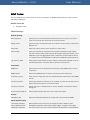
HTTP Advanced
This Check Method is used to monitor the availability, response content, transfer time and transfer
speed of an http(s) site.
Result channels
1.
Loading time (ms)
2.
Transfer speed (Kbit/s)
Check Settings
General settings
Scan frequency
Specify the time interval between two executions of a Check. If you use a
value of 5 minutes, the Check will run every 5 minutes.
Display result
Specify the type of response value to be shown on the screen in the Device
Monitor List.
Data storage
Select the method for storing monitoring data. Full data storage means
that the results of each Check scan will be saved as separate records in the
database. If you use aggregation then a collection of results will be saved
as a single record. The aggregation reduces the database size significantly.
Log event on state
Select which states trigger an event. When a Check state changes to any of
the selected states a new event will be saved in the Event log.
Specific Settings (New Dialog)
URL
Specify the address of the http(s) site in URL format. Example:
http://inteliance.com
Port
Specify the port in a range between 0 and 65535 inclusive. Set the port to
0 to let ServersMaster detect and use a standard port depending on the
URL scheme.
Post data
Specify the data to send along with the request using the POST method.
Example: "Var1=5&Var2=test"
Authentication
Select the type of authentication if the http site requires one. You will also
need to enter logon credentials in the corresponding fields if
authentication is enabled.
Connection settings
Connection retries
Specify the number of times to try to connect in a case of connection error
before setting the result to connection failed.
Connection timeout
Specify the time, in milliseconds, to wait to establish a connection before
timing out.
At connection failed set
Specify which Check state to set if the connection failed.
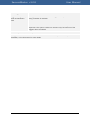
Check response
32
ServersMaster v1.0.8
User Manual
If the initial response
value is different form
subsequent response
values trigger
Specify which state to be set if the initial response value is different form
subsequent response values. Select "Skip trigger" to ignore this trigger.
The initial value is the one returned from the Check when it is executed for
the first time or the value returned when the Check is restarted.
Triggers for Up, Warn,
Down and Unknown
state
Configure the advanced Check state triggers that inspect the result values
using a number of methods.
Case sensitive
Select whether to use case sensitive or case insensitive response value
inspection. This option is taken into account only if at least one of the
triggers above is enabled.
Reactions (Alerts & Remedies)
Manage the Reactions activated for the Check. Please refer to the chapter "Reactions (Alerts &
Remedies)" in this document for more details.
33
ServersMaster v1.0.8
User Manual
HTTP Transaction
This Check Method is used to monitor the availability, response content, transfer time and transfer
speed of multiple http(s) sites.
Result channels
1.
Average loading time (ms) *
2.
Average transfer speed (Kbit/s) *
* The average values are calculated using the response values (loading time & transfer speed)
returned by the scans to each of the URLs in the transaction.
Check Settings
General settings
Scan frequency
Specify the time interval between two executions of a Check. If you use a
value of 5 minutes, the Check will run every 5 minutes.
Display result
Specify the type of response value to be shown on the screen in the Device
Monitor List.
Data storage
Select the method for storing monitoring data. Full data storage means
that the results of each Check scan will be saved as separate records in the
database. If you use aggregation then a collection of results will be saved
as a single record. The aggregation reduces the database size significantly.
Log event on state
Select which states trigger an event. When a Check state changes to any of
the selected states a new event will be saved in the Event log.
List of HTTP URLs to check
Use the Add/Edit/Remove buttons to manage the list of URLs.
Per URL configuration dialog
URL
Specify the address of the http(s) site in URL format. Example:
http://inteliance.com
Port
Specify the port in a range between 0 and 65535 inclusive. Set the port to
0 to let ServersMaster detect and use a standard port depending on the
URL scheme.
Post data
Specify the data to send along with the request using the POST method.
Example: "Var1=5&Var2=test"
Authentication
Select the type of authentication if the http site requires one. You will also
need to enter logon credentials in the corresponding fields if
authentication is enabled.
Connection settings
Connection retries
Specify the number of times to try to connect in a case of connection error
34
ServersMaster v1.0.8
User Manual
before setting the result to connection failed.
Connection timeout
Specify the time, in milliseconds, to wait to establish a connection before
timing out.
At connection failed set
Specify which Check state to set if the connection failed.
Check response
If the initial response
value is different form
subsequent response
values trigger
Specify which state to be set if the initial response value is different form
subsequent response values. Select "Skip trigger" to ignore this trigger.
The initial value is the one returned from the Check when it is executed for
the first time or the value returned when the Check is restarted.
Triggers for Up, Warn,
Down and Unknown
state
Configure the advanced Check state triggers that inspect the result values
using a number of methods.
Case sensitive
Select whether to use case sensitive or case insensitive response value
inspection. This option is taken into account only if at least one of the
triggers above is enabled.
Reactions (Alerts & Remedies)
Manage the Reactions activated for the Check. Please refer to the chapter "Reactions (Alerts &
Remedies)" in this document for more details.
35
ServersMaster v1.0.8
User Manual
HTTP SSL Certificate
This Check Method is used to monitor the SSL certificate validity on a single or multiple https sites.
Result channels
1.
Days until expiry
Check Settings
General settings
Scan frequency
Specify the time interval between two executions of a Check. If you use a
value of 5 minutes, the Check will run every 5 minutes.
Display result
Specify the type of response value to be shown on the screen in the Device
Monitor List.
Data storage
Select the method for storing monitoring data. Full data storage means
that the results of each Check scan will be saved as separate records in the
database. If you use aggregation then a collection of results will be saved
as a single record. The aggregation reduces the database size significantly.
Log event on state
Select which states trigger an event. When a Check state changes to any of
the selected states a new event will be saved in the Event log.
Specific Settings (New Dialog)
URL
Specify the address of the http(s) site in URL format. Example:
http://inteliance.com
Port
Specify the port in a range between 0 and 65535 inclusive. Set the port to
0 to let ServersMaster detect and use a standard port depending on the
URL scheme.
Connection settings
Connection retries
Specify the number of times to try to connect in a case of connection error
before setting the result to connection failed.
Connection timeout
Specify the time, in milliseconds, to wait to establish a connection before
timing out.
At connection failed set
Specify which Check state to set if the connection failed.
Check SSL certificate
State "Warning" if days
until expiry less than
Specify the days till expiry of the SSL certificate, that triggers a Warning
state.
State "Down" if days
until expiry less than
Specify the days till expiry of the SSL certificate, that triggers a Down state.
Set this value to 0 to trigger Down state when the certificate expired.
Reactions (Alerts & Remedies)
Manage the Reactions activated for the Check. Please refer to the chapter "Reactions (Alerts &
36
ServersMaster v1.0.8
User Manual
Remedies)" in this document for more details.
37
ServersMaster v1.0.8
User Manual
FTP Download Speed
This Check Method is used to monitor the download speed by downloading a file using the FTP
protocol.
Result channels
1.
Download speed (Kbit/s)
Check Settings
General settings
Scan frequency
Specify the time interval between two executions of a Check. If you use a
value of 5 minutes, the Check will run every 5 minutes.
Display result
Specify the type of response value to be shown on the screen in the Device
Monitor List.
Data storage
Select the method for storing monitoring data. Full data storage means
that the results of each Check scan will be saved as separate records in the
database. If you use aggregation then a collection of results will be saved
as a single record. The aggregation reduces the database size significantly.
Log event on state
Select which states trigger an event. When a Check state changes to any of
the selected states a new event will be saved in the Event log.
Specific Settings (New Dialog)
URL
Specify the address of the FTP resource in URL format. Example:
ftp://ftp.inteliance.com/test.zip. Note: FTPS protocol is not supported on
this Check.
Port
Specify the port in a range between 0 and 65535 inclusive. Set the port to
0 to let ServersMaster detect and use a standard port depending on the
URL scheme.
Connection settings
Connection retries
Specify the number of times to try to connect in a case of connection error
before setting the result to connection failed.
Connection timeout
Specify the time, in milliseconds, to wait to establish a connection before
timing out.
At connection failed set
Specify which Check state to set if the connection failed.
Check download speed
State "Warning" if
download speed lower
than
Specify the download speed, in Kbit/s, that triggers a Warning state.
State "Down" if
download speed lower
Specify the download speed, in Kbit/s, that triggers a Down state.
38
ServersMaster v1.0.8
User Manual
than
Reactions (Alerts & Remedies)
Manage the Reactions activated for the Check. Please refer to the chapter "Reactions (Alerts &
Remedies)" in this document for more details.
39
ServersMaster v1.0.8
User Manual
FTP Response
This Check Method is used to monitor the availability and the response time of an FTP server.
Result channels
1.
Connection time (ms)
2.
SSL handshake time (ms)
3.
Login time (ms)
Check Settings
General settings
Scan frequency
Specify the time interval between two executions of a Check. If you use a
value of 5 minutes, the Check will run every 5 minutes.
Display result
Specify the type of response value to be shown on the screen in the Device
Monitor List.
Data storage
Select the method for storing monitoring data. Full data storage means
that the results of each Check scan will be saved as separate records in the
database. If you use aggregation then a collection of results will be saved
as a single record. The aggregation reduces the database size significantly.
Log event on state
Select which states trigger an event. When a Check state changes to any of
the selected states a new event will be saved in the Event log.
Connect and login
FTP account settings
Opens another dialog used to configure the FTP URL, port, connection
encryption and logon credentials.
Connection retries
Specify the number of times to try to connect in a case of connection error
before setting the result to connection failed.
Connection timeout
Specify the time, in milliseconds, to wait to establish a connection before
timing out.
At connection/login
failed set
Specify which Check state to set if the connection or login failed.
Warning if response
time greater than
Specify the minimum connection time, in milliseconds, that triggers a
Warning state.
Down if response time
greater than
Specify the minimum connection time, in milliseconds, that triggers a
Down state.
Reactions (Alerts & Remedies)
Manage the Reactions activated for the Check. Please refer to the chapter "Reactions (Alerts &
Remedies)" in this document for more details.
40
ServersMaster v1.0.8
User Manual
FTP File Size
This Check Method is used to monitor the size of a file using an FTP server.
Result channels
1.
File size (bytes)
Check Settings
General settings
Scan frequency
Specify the time interval between two executions of a Check. If you use a
value of 5 minutes, the Check will run every 5 minutes.
Display result
Specify the type of response value to be shown on the screen in the Device
Monitor List.
Data storage
Select the method for storing monitoring data. Full data storage means
that the results of each Check scan will be saved as separate records in the
database. If you use aggregation then a collection of results will be saved
as a single record. The aggregation reduces the database size significantly.
Log event on state
Select which states trigger an event. When a Check state changes to any of
the selected states a new event will be saved in the Event log.
Connect and login
FTP account settings
Opens another dialog used to configure the FTP URL, port, connection
encryption and logon credentials.
Connection retries
Specify the number of times to try to connect in a case of connection error
before setting the result to connection failed.
Connection timeout
Specify the time, in milliseconds, to wait to establish a connection before
timing out.
At connection/login
failed set
Specify which Check state to set if the connection or login failed.
Warning if response
time greater than
Specify the minimum connection time, in milliseconds, that triggers a
Warning state.
Down if response time
greater than
Specify the minimum connection time, in milliseconds, that triggers a
Down state.
File size triggers
Path and file name
Enter the path and file name. Exampe: public_html/test.zip
Triggers for Up, Warn,
Down and Unknown
state
Configure the advanced Check state triggers that inspect the result values
using a number of methods
Reactions (Alerts & Remedies)
41
ServersMaster v1.0.8
User Manual
Manage the Reactions activated for the Check. Please refer to the chapter "Reactions (Alerts &
Remedies)" in this document for more details.
42
ServersMaster v1.0.8
User Manual
SSH Cpu Load
This Check Method is used to monitor the CPU load on UNIX-like systems over SSH protocol.
Result channels
1.
Last 1 min load
2.
Last 5 min load
3.
Last 15 min load
4.
Number of CPUs
Check Settings
General settings
Scan frequency
Specify the time interval between two executions of a Check. If you use a
value of 5 minutes, the Check will run every 5 minutes.
Display result
Specify the type of response value to be shown on the screen in the Device
Monitor List.
Data storage
Select the method for storing monitoring data. Full data storage means
that the results of each Check scan will be saved as separate records in the
database. If you use aggregation then a collection of results will be saved
as a single record. The aggregation reduces the database size significantly.
Log event on state
Select which states trigger an event. When a Check state changes to any of
the selected states a new event will be saved in the Event log.
SSH Connection
Connection retries
Specify the number of times to try to connect in a case of connection error
before setting the result to connection failed.
Connection timeout
Specify the time, in milliseconds, to wait to establish a connection before
timing out.
At connection/login
failed set
Specify which Check state to set if the connection or login failed.
Triggers
Warning if CPU load
greater than
Specify the minimum CPU load that triggers a Warning state.
Down if CPU load
greater than
Specify the minimum CPU load that triggers a Down state.
Reactions (Alerts & Remedies)
Manage the Reactions activated for the Check. Please refer to the chapter "Reactions (Alerts &
Remedies)" in this document for more details.
43
ServersMaster v1.0.8
User Manual
SSH Memory Usage
This Check Method is used to monitor the memory usage on UNIX-like systems over SSH protocol.
Result channels
1.
Memory usage (%)
2.
Memory usage (MB)
Check Settings
General settings
Scan frequency
Specify the time interval between two executions of a Check. If you use a
value of 5 minutes, the Check will run every 5 minutes.
Display result
Specify the type of response value to be shown on the screen in the Device
Monitor List.
Data storage
Select the method for storing monitoring data. Full data storage means
that the results of each Check scan will be saved as separate records in the
database. If you use aggregation then a collection of results will be saved
as a single record. The aggregation reduces the database size significantly.
Log event on state
Select which states trigger an event. When a Check state changes to any of
the selected states a new event will be saved in the Event log.
SSH Connection
Connection retries
Specify the number of times to try to connect in a case of connection error
before setting the result to connection failed.
Connection timeout
Specify the time, in milliseconds, to wait to establish a connection before
timing out.
At connection failed set
Specify which Check state to set if the connection failed.
Triggers
Warning if real memory
usage greater than
Specify the minimum real memory usage, in percentage, that triggers a
Warning state. The real memory is the total memory without the cached
memory.
Down if real memory
usage greater than
Specify the minimum real memory usage, in percentage, that triggers a
Down state. The real memory is the total memory without the cached
memory.
Reactions (Alerts & Remedies)
Manage the Reactions activated for the Check. Please refer to the chapter "Reactions (Alerts &
Remedies)" in this document for more details.
44
ServersMaster v1.0.8
User Manual
SSH HDD Usage
Monitor the hard disk usage on UNIX-like systems over SSH protocol.
Result channels
1.
HDD usage (%)
2.
HDD usage (MB)
Check Settings
General settings
Scan frequency
Specify the time interval between two executions of a Check. If you use a
value of 5 minutes, the Check will run every 5 minutes.
Display result
Specify the type of response value to be shown on the screen in the Device
Monitor List.
Data storage
Select the method for storing monitoring data. Full data storage means
that the results of each Check scan will be saved as separate records in the
database. If you use aggregation then a collection of results will be saved
as a single record. The aggregation reduces the database size significantly.
Log event on state
Select which states trigger an event. When a Check state changes to any of
the selected states a new event will be saved in the Event log.
SSH Connection
Connection retries
Specify the number of times to try to connect in a case of connection error
before setting the result to connection failed.
Connection timeout
Specify the time, in milliseconds, to wait to establish a connection before
timing out.
At connection failed set
Specify which Check state to set if the connection failed.
Triggers
Warning if used space
greater than
Specify the minimum total space usage, in percentage, that triggers a
Warning state.
Down if used space
greater than
Specify the minimum total space usage, in percentage, that triggers a
Down state.
Reactions (Alerts & Remedies)
Manage the Reactions activated for the Check. Please refer to the chapter "Reactions (Alerts &
Remedies)" in this document for more details.
45
ServersMaster v1.0.8
User Manual
SSH Inodes Usage
Monitor the Inodes usage on UNIX-like systems over SSH protocol.
Result channels
1.
Inodes usage (%)
2.
Inodes count
Check Settings
General settings
Scan frequency
Specify the time interval between two executions of a Check. If you use a
value of 5 minutes, the Check will run every 5 minutes.
Display result
Specify the type of response value to be shown on the screen in the Device
Monitor List.
Data storage
Select the method for storing monitoring data. Full data storage means
that the results of each Check scan will be saved as separate records in the
database. If you use aggregation then a collection of results will be saved
as a single record. The aggregation reduces the database size significantly.
Log event on state
Select which states trigger an event. When a Check state changes to any of
the selected states a new event will be saved in the Event log.
SSH Connection
Connection retries
Specify the number of times to try to connect in a case of connection error
before setting the result to connection failed.
Connection timeout
Specify the time, in milliseconds, to wait to establish a connection before
timing out.
At connection failed set
Specify which Check state to set if the connection failed.
Triggers
Warning if usage
greater than
Specify the minimum Inodes usage, in percentage, that triggers a Warning
state.
Down if usage greater
than
Specify the minimum Inodes usage, in percentage, that triggers a Down
state.
Reactions (Alerts & Remedies)
Manage the Reactions activated for the Check. Please refer to the chapter "Reactions (Alerts &
Remedies)" in this document for more details.
46
ServersMaster v1.0.8
User Manual
SSH File/Dir count
Monitor the count of files/directories in a specific directory on a UNIX-like system over SSH protocol.
Result channels
1.
File count
Check Settings
General settings
Scan frequency
Specify the time interval between two executions of a Check. If you use a
value of 5 minutes, the Check will run every 5 minutes.
Display result
Specify the type of response value to be shown on the screen in the Device
Monitor List.
Data storage
Select the method for storing monitoring data. Full data storage means
that the results of each Check scan will be saved as separate records in the
database. If you use aggregation then a collection of results will be saved
as a single record. The aggregation reduces the database size significantly.
Log event on state
Select which states trigger an event. When a Check state changes to any of
the selected states a new event will be saved in the Event log.
SSH Connection
Connection retries
Specify the number of times to try to connect in a case of connection error
before setting the result to connection failed.
Connection timeout
Specify the time, in milliseconds, to wait to establish a connection before
timing out.
At connection failed set
Specify which Check state to set if the connection failed.
Execute
Path and directory
name
Enter the directory path. Example: "/home/testuser".
Recursive (inlc. sub-dirs)
Specify whether you want to count the files and directories inside subdirectories as well.
Check file count
If the initial response
value is different form
subsequent response
values trigger
Specify which state to be set if the initial file count is different from
subsequent file counts. Select "Skip trigger" to ignore this trigger. The
initial value is the one returned from the Check when it is executed for the
first time or the value returned when the Check is restarted.
Triggers for Up, Warn,
Down and Unknown
state
Configure the advanced Check state triggers that inspect the result values
using a number of methods.
47
ServersMaster v1.0.8
User Manual
Reactions (Alerts & Remedies)
Manage the Reactions activated for the Check. Please refer to the chapter "Reactions (Alerts &
Remedies)" in this document for more details.
48
ServersMaster v1.0.8
User Manual
SSH Remote Ping
This Check Method is used to monitor devices for availability using ICMP protocol through an
intermediary UNIX-like device connected by SSH Protocol.
Result channels
1.
Response time avrg (ms)
2.
Packet loss (%)
3.
Standard deviation (ms)
Check Settings
General settings
Scan frequency
Specify the time interval between two executions of a Check. If you use a
value of 5 minutes, the Check will run every 5 minutes.
Display result
Specify the type of response value to be shown on the screen in the Device
Monitor List.
Data storage
Select the method for storing monitoring data. Full data storage means
that the results of each Check scan will be saved as separate records in the
database. If you use aggregation then a collection of results will be saved
as a single record. The aggregation reduces the database size significantly.
Log event on state
Select which states trigger an event. When a Check state changes to any of
the selected states a new event will be saved in the Event log.
Connection
Ping from
Select the remote host to be used to ping the device that is being
configured. The remote host must support SSH protocol.
Rounds per check
Specify the number of echo requests to send per one Check scan. You
need to specify more than 2 rounds if you want to track the fluctuations in
the standard deviation.
SSH connection timeout
Specify the time, in milliseconds, to wait to establish a connection before
timing out.
At SSH connection
failed set
Specify which Check state to set if the connection failed.
Triggers
Warning state if packet
loss greater than
Specify the minimum packet loss, in milliseconds, that triggers a Warning
state.
Down state if packet
loss greater than
Specify the minimum packet loss, in milliseconds, that triggers a Down
state.
Warning state if
response time greater
Specify the minimum response time, in milliseconds, that triggers a
Warning state.
49
ServersMaster v1.0.8
User Manual
than
Down state if response
time greater than
Specify the minimum response time, in milliseconds, that triggers a Down
state. This value works as a ping reply timeout.
Reactions (Alerts & Remedies)
Manage the Reactions activated for the Check. Please refer to the chapter "Reactions (Alerts &
Remedies)" in this document for more details.
50
ServersMaster v1.0.8
User Manual
SSH Custom
This Check Method is used to monitor the response value of a shell command executed on a UNIXlike system over SSH protocol.
Result channels
1.
Response value
Check Settings
General settings
Scan frequency
Specify the time interval between two executions of a Check. If you use a
value of 5 minutes, the Check will run every 5 minutes.
Display result
Specify the type of response value to be shown on the screen in the Device
Monitor List.
Result Unit
Select the type of metric to be used for the result value.
Data storage
Select the method for storing monitoring data. Full data storage means
that the results of each Check scan will be saved as separate records in the
database. If you use aggregation then a collection of results will be saved
as a single record. The aggregation reduces the database size significantly.
Log event on state
Select which states trigger an event. When a Check state changes to any of
the selected states a new event will be saved in the Event log.
SSH Connection
Connection retries
Specify the number of times to try to connect in a case of connection error
before setting the result to connection failed.
Connection timeout
Specify the time, in milliseconds, to wait to establish a connection before
timing out.
At connection failed set
Specify which Check state to set if the connection failed.
Check response content
Send command
Enter the command to send to the host as soon as the service running on
the target port is ready to accept data.
If the initial response
value is different form
subsequent response
values trigger
Specify which state to be set if the response value is different form
subsequent response values. Select "Skip trigger" to ignore this trigger.
The initial value is the one returned from the Check when it is executed for
the first time or the value returned when the Check is restarted.
Triggers for Up, Warn,
Down and Unknown
state
Configure the advanced Check state triggers that inspect the result values
using a number of methods.
Case sensitive
Select whether to use case sensitive or case insensitive response value
51
ServersMaster v1.0.8
User Manual
inspection. This option is taken into account only if at least one of the
triggers above is enabled.
Reactions (Alerts & Remedies)
Manage the Reactions activated for the Check. Please refer to the chapter "Reactions (Alerts &
Remedies)" in this document for more details.
52
ServersMaster v1.0.8
User Manual
SFTP File/Dir count
This Check Method is used to monitor the count of files/directories in a specific directory on a UNIXlike system over SSH FTP protocol.
Result channels
1.
File count
Check Settings
General settings
Scan frequency
Specify the time interval between two executions of a Check. If you use a
value of 5 minutes, the Check will run every 5 minutes.
Display result
Specify the type of response value to be shown on the screen in the Device
Monitor List.
Data storage
Select the method for storing monitoring data. Full data storage means
that the results of each Check scan will be saved as separate records in the
database. If you use aggregation then a collection of results will be saved
as a single record. The aggregation reduces the database size significantly.
Log event on state
Select which states trigger an event. When a Check state changes to any of
the selected states a new event will be saved in the Event log.
Connection
Path and directory
name
Enter the directory path. Example: "/home/testuser".
Connection retries
Specify the number of times to try to connect in a case of connection error
before setting the result to connection failed.
Connection timeout
Specify the time, in milliseconds, to wait to establish a connection before
timing out.
At connection failed set
Specify which Check state to set if the connection failed.
Check file count
If the initial response
value is different form
subsequent response
values trigger
Specify which state to be set if the initial file count is different form
subsequent file counts. Select "Skip trigger" to ignore this trigger. The
initial value is the one returned from the Check when it is executed for the
first time or the value returned when the Check is restarted.
Triggers for Up, Warn,
Down and Unknown
state
Configure the advanced Check state triggers that inspect the result values
using a number of methods.
Reactions (Alerts & Remedies)
Manage the Reactions activated for the Check. Please refer to the chapter "Reactions (Alerts &
53
ServersMaster v1.0.8
User Manual
Remedies)" in this document for more details.
54
ServersMaster v1.0.8
User Manual
SFTP File Size
This Check Method is used to monitor the size of a specific directory or file on a UNIX-like system over
SSH FTP protocol.
Result channels
1.
File size (bytes)
Check Settings
General settings
Scan frequency
Specify the time interval between two executions of a Check. If you use a
value of 5 minutes, the Check will run every 5 minutes.
Display result
Specify the type of response value to be shown on the screen in the Device
Monitor List.
Data storage
Select the method for storing monitoring data. Full data storage means
that the results of each Check scan will be saved as separate records in the
database. If you use aggregation then a collection of results will be saved
as a single record. The aggregation reduces the database size significantly.
Log event on state
Select which states trigger an event. When a Check state changes to any of
the selected states a new event will be saved in the Event log.
Connection
Path and file name
Enter the path and file name. Exampe: "public_html/test.zip".
Connection retries
Specify the number of times to try to connect in a case of connection error
before setting the result to connection failed.
Connection timeout
Specify the time, in milliseconds, to wait to establish a connection before
timing out.
At connection failed set
Specify which Check state to set if the connection failed.
Check file count
If the initial response
value is different form
subsequent response
values trigger
Specify which state to be set if the initial file size is different form
subsequent file sizes. Select "Skip trigger" to ignore this trigger. The initial
value is the one returned from the Check when it is executed for the first
time or the value returned when the Check is restarted.
Triggers for Up, Warn,
Down and Unknown
state
Configure the advanced Check state triggers that inspect the result values
using a number of methods.
Reactions (Alerts & Remedies)
Manage the Reactions activated for the Check. Please refer to the chapter "Reactions (Alerts &
Remedies)" in this document for more details.
55
ServersMaster v1.0.8
User Manual
Mail SMTP
This Check Method is used to monitor the response time and ability to send a message over a SNMP
mail server. The result channels provide split up times that helps you identify the bottle-neck for the
problem.
Result channels
1.
Response time (ms)
2.
SSL handshake time (ms)
3.
Login time (ms)
4.
Email send time (ms)
Check Settings
General settings
Scan frequency
Specify the time interval between two executions of a Check. If you use a
value of 5 minutes, the Check will run every 5 minutes.
Data storage
Select the method for storing monitoring data. Full data storage means
that the results of each Check scan will be saved as separate records in the
database. If you use aggregation then a collection of results will be saved
as a single record. The aggregation reduces the database size significantly.
Log event on state
Select which states trigger an event. When a Check state changes to any of
the selected states a new event will be saved in the Event log.
Connect and send
SMTP settings
Opens another settings dialog used to configure the logon credentials and
message parameters.
Connection retries
Specify the number of times to try to connect in a case of connection error
before setting the result to connection failed.
At connection failed set
Specify which Check state to set if the connection failed.
Warning if connection
time greater than
Specify the minimum connection time, in milliseconds, that triggers a
Warning state.
Down if connection time
greater than
Specify the minimum connection time, in milliseconds, that triggers a
Down state. This value works as a connection timeout.
Reactions (Alerts & Remedies)
Manage the Reactions activated for the Check. Please refer to the chapter "Reactions (Alerts &
Remedies)" in this document for more details.
56
ServersMaster v1.0.8
User Manual
Mail IMAP
This Check Method is used to monitor the availability and the response time of an IMAP mail server,
and optionally search a mailbox for specific messages. The result channels provide split up times that
helps you identify the bottle-neck for the problem.
Result channels
1.
Response time (ms)
2.
SSL handshake time (ms)
3.
Login time (ms)
4.
Message count
Check Settings
General settings
Scan frequency
Specify the time interval between two executions of a Check. If you use a
value of 5 minutes, the Check will run every 5 minutes.
Display result
Specify the type of response value to be shown on the screen in the Device
Monitor List.
Data storage
Select the method for storing monitoring data. Full data storage means
that the results of each Check scan will be saved as separate records in the
database. If you use aggregation then a collection of results will be saved
as a single record. The aggregation reduces the database size significantly.
Log event on state
Select which states trigger an event. When a Check state changes to any of
the selected states a new event will be saved in the Event log.
Connect and login
IMAP settings
Opens another settings dialog used to configure the logon credentials.
Connection retries
Specify the number of times to try to connect in a case of connection error
before setting the result to connection failed.
Connection timeout
Specify the time, in milliseconds, to wait to establish a connection before
timing out.
At connection failed set
Specify which Check state to set if the connection failed.
Warning if connection
time greater than
Specify the minimum connection time, in milliseconds, that triggers a
Warning state.
Down if connection time
greater than
Specify the minimum connection time, in milliseconds, that triggers a
Down state. This value works as a connection timeout.
Check mailbox (optional)
Mailbox name (folder)
Enter then name of the mailbox. Example: "Inbox".
Triggers for Up, Warn,
Configure the advanced Check state triggers that inspect the result values
57
ServersMaster v1.0.8
User Manual
Down and Unknown
state
using a number of methods.
Search all messages
Select this option if you want the search to go through all the messages in
the mailbox.
Search messages arrived
in the last
Select this option if you want the search to check only the messages that
arrived in the specified number of last days
Reactions (Alerts & Remedies)
Manage the Reactions activated for the Check. Please refer to the chapter "Reactions (Alerts &
Remedies)" in this document for more details.
58
ServersMaster v1.0.8
User Manual
Mail POP3
This Check Method is used to monitor the availability and the response time of a POP3 mail server.
The result channels provide split up times that helps you identify the bottle-neck for the problem.
Result channels
1.
Response time (ms)
2.
SSL handshake time (ms)
3.
Login time (ms)
4.
Message count
Check Settings
General settings
Scan frequency
Specify the time interval between two executions of a Check. If you use a
value of 5 minutes, the Check will run every 5 minutes.
Display result
Specify the type of response value to be shown on the screen in the Device
Monitor List.
Data storage
Select the method for storing monitoring data. Full data storage means
that the results of each Check scan will be saved as separate records in the
database. If you use aggregation then a collection of results will be saved
as a single record. The aggregation reduces the database size significantly.
Log event on state
Select which states trigger an event. When a Check state changes to any of
the selected states a new event will be saved in the Event log.
Connect and login
POP3 settings
Opens another settings dialog used to configure the logon credentials.
Connection retries
Specify the number of times to try to connect in a case of connection error
before setting the result to connection failed.
Connection timeout
Specify the time, in milliseconds, to wait to establish a connection before
timing out.
At connection failed set
Specify which Check state to set if the connection failed.
Warning if connection
time greater than
Specify the minimum connection time, in milliseconds, that triggers a
Warning state.
Down if connection time
greater than
Specify the minimum connection time, in milliseconds, that triggers a
Down state. This value works as a connection timeout.
Check message count and space usage (optional)
Triggers for Up, Warn,
Down and Unknown
state
Configure the advanced Check state triggers that inspect the result values
using a number of methods.
Reactions (Alerts & Remedies)
59
ServersMaster v1.0.8
User Manual
Manage the Reactions activated for the Check. Please refer to the chapter "Reactions (Alerts &
Remedies)" in this document for more details.
60
ServersMaster v1.0.8
User Manual
Mail Route SMTP-IMAP
This Check Method is used to monitor the time it takes to receive a messages on an IMAP mail server
after being sent using a SMTP mail server.
Result channels
1.
Round trip time
Check Settings
General settings
Scan frequency
Specify the time interval between two executions of a Check. If you use a
value of 5 minutes, the Check will run every 5 minutes.
Display result
Specify the type of response value to be shown on the screen in the Device
Monitor List.
Data storage
Select the method for storing monitoring data. Full data storage means
that the results of each Check scan will be saved as separate records in the
database. If you use aggregation then a collection of results will be saved
as a single record. The aggregation reduces the database size significantly.
Log event on state
Select which states trigger an event. When a Check state changes to any of
the selected states a new event will be saved in the Event log.
Connect and execute
Mail send settings
Opens another settings dialog used to configure the SMTP logon
credentials and recipient parameters.
Mail receive settings
Opens another settings dialog used to configure the IMAP logon
credentials,
Connection retries
Specify the number of times to try to connect in a case of connection error
before setting the result to connection failed.
Connection timeout
Specify the time, in milliseconds, to wait to establish a connection before
timing out.
At failure set
Specify which Check state to set if the email send-receive process failed.
Check for new message
every
Specify the time to wait before checking the IMAP account for the arrival
of the test message.
Triggers
Warning if round trip
time greater than
Specify the minimum round trip time, in milliseconds, that triggers a
Warning state.
Down if round trip time
greater than
Specify the minimum round trip time, in milliseconds, that triggers a Down
state.
Reactions (Alerts & Remedies)
61
ServersMaster v1.0.8
User Manual
Manage the Reactions activated for the Check. Please refer to the chapter "Reactions (Alerts &
Remedies)" in this document for more details.
62
ServersMaster v1.0.8
User Manual
Mail Route SMTP-POP3
This Check Method is used to monitor the time it takes to receive a messages on a POP3 mail server
after being sent using a SMTP mail server.
Result channels
1.
Round trip time
Check Settings
General settings
Scan frequency
Specify the time interval between two executions of a Check. If you use a
value of 5 minutes, the Check will run every 5 minutes.
Display result
Specify the type of response value to be shown on the screen in the Device
Monitor List.
Data storage
Select the method for storing monitoring data. Full data storage means
that the results of each Check scan will be saved as separate records in the
database. If you use aggregation then a collection of results will be saved
as a single record. The aggregation reduces the database size significantly.
Log event on state
Select which states trigger an event. When a Check state changes to any of
the selected states a new event will be saved in the Event log.
Connect and execute
Mail send settings
Opens another settings dialog used to configure the SMTP logon
credentials and recipient parameters.
Mail receive settings
Opens another settings dialog used to configure the POP3 logon
credentials,
Connection retries
Specify the number of times to try to connect in a case of connection error
before setting the result to connection failed.
Connection timeout
Specify the time, in milliseconds, to wait to establish a connection before
timing out.
At failure set
Specify which Check state to set if the email send-receive process failed.
Check for new message
every
Specify the time to wait before checking the POP3 account for the arrival
of the test message.
Triggers
Warning if round trip
time greater than
Specify the minimum round trip time, in milliseconds, that triggers a
Warning state.
Down if round trip time
greater than
Specify the minimum round trip time, in milliseconds, that triggers a Down
state.
Reactions (Alerts & Remedies)
63
ServersMaster v1.0.8
User Manual
Manage the Reactions activated for the Check. Please refer to the chapter "Reactions (Alerts &
Remedies)" in this document for more details.
64
ServersMaster v1.0.8
User Manual
SNMP Custom
This Check Method is used to monitor various parameters on SNMP enabled devices using a custom
OID (Object Identifier).
Result channels
1.
Response value
Check Settings
General settings
Scan frequency
Specify the time interval between two executions of a Check. If you use a
value of 5 minutes, the Check will run every 5 minutes.
Display result
Specify the type of response value to be shown on the screen in the Device
Monitor List.
Result Unit
Select the type of metric to be used for the result value.
Data storage
Select the method for storing monitoring data. Full data storage means
that the results of each Check scan will be saved as separate records in the
database. If you use aggregation then a collection of results will be saved
as a single record. The aggregation reduces the database size significantly.
Log event on state
Select which states trigger an event. When a Check state changes to any of
the selected states a new event will be saved in the Event log.
Connection
SNMP port
Specify the port to be used when connecting to the SNMP service on the
target host.
SNMP version
Specify the SNMP protocol version supported on the target host.
Community string
Enter the text string that acts as a password when connecting to the SNMP
service.
Connection retries
Specify the number of times to try to connect in a case of connection error
before setting the result to connection failed.
Connection timeout
Specify the time, in milliseconds, to wait to establish a connection before
timing out.
At connection failed set
Specify which Check state to set if the connection failed.
Execute
OID (Object ID)
Specify the OID that identifies a variable that can be read via SNMP.
Check response value
If the initial response
value is different form
subsequent response
Specify which state to be set if the response value is different form
subsequent response values. Select "Skip trigger" to ignore this trigger.
The initial value is the one returned from the Check when it is executed for
65
ServersMaster v1.0.8
User Manual
values trigger
the first time or the value returned when the Check is restarted.
Triggers for Up, Warn,
Down and Unknown
state
Configure the advanced Check state triggers that inspect the result values
using a number of methods.
Case sensitive
Select whether to use case sensitive or case insensitive response value
inspection. This option is taken into account only if at least one of the
triggers above is enabled.
Reactions (Alerts & Remedies)
Manage the Reactions activated for the Check. Please refer to the chapter "Reactions (Alerts &
Remedies)" in this document for more details.
66
ServersMaster v1.0.8
User Manual
SNMP Traffic
This Check Method is used to monitor inbound and outbound traffic data, errors, discards and
unicast/non-unicast packets on SNMP enabled devices.
Result channels
1.
Traffic inbound
2.
Traffic outbound
3.
Traffic sum
Check Settings
General settings
Scan frequency
Specify the time interval between two executions of a Check. If you use a
value of 5 minutes, the Check will run every 5 minutes.
Display result
Specify the type of response value to be shown on the screen in the Device
Monitor List.
Result Unit
Select the type of metric to be used for the result value.
Data storage
Select the method for storing monitoring data. Full data storage means
that the results of each Check scan will be saved as separate records in the
database. If you use aggregation then a collection of results will be saved
as a single record. The aggregation reduces the database size significantly.
Log event on state
Select which states trigger an event. When a Check state changes to any of
the selected states a new event will be saved in the Event log.
Connection
SNMP port
Specify the port to be used when connecting to the SNMP service on the
target host.
SNMP version
Specify the SNMP protocol version supported on the target host.
Community string
Enter the text string that acts as a password when connecting to the SNMP
service.
Connection retries
Specify the number of times to try to connect in a case of connection error
before setting the result to connection failed.
Connection timeout
Specify the time, in milliseconds, to wait to establish a connection before
timing out.
At connection failed set
Specify which Check state to set if the connection failed.
Execute
Traffic type
Select the traffic type which can be any of the following: data, errors,
discards , unicast packets, non-unicast packets and unknown protocols.
Interface
Select the network interface on the target host that will be monitored for a
67
ServersMaster v1.0.8
User Manual
certain traffic type. Make sure you first click the button "Detect" to fetch
the available interfaces on the target host.
Check response value
Triggers for Up, Warn,
Down and Unknown
state
Configure the advanced Check state triggers that inspect the result values
using a number of methods.
Reactions (Alerts & Remedies)
Manage the Reactions activated for the Check. Please refer to the chapter "Reactions (Alerts &
Remedies)" in this document for more details.
68
ServersMaster v1.0.8
User Manual
DNS Black List
This Check Method is used to test if the IP address of the host is listed on any of the specified DNS
Black List servers.
Result channels
1.
Number of Black List servers where the host is listed
2.
Number of Black List servers where the host is not listed
3.
Number of Black List servers that are offline
Check Settings
General settings
Scan frequency
Specify the time interval between two executions of a Check. If you use a
value of 5 minutes, the Check will run every 5 minutes.
Display result
Specify the type of response value to be shown on the screen in the Device
Monitor List.
Data storage
Select the method for storing monitoring data. Full data storage means
that the results of each Check scan will be saved as separate records in the
database. If you use aggregation then a collection of results will be saved
as a single record. The aggregation reduces the database size significantly.
Log event on state
Select which states trigger an event. When a Check state changes to any of
the selected states a new event will be saved in the Event log.
Connection
Black List servers
Opens another dialog used to manage the list of servers.
Mode
Specify whether the Black List servers support IP address only or they
support domain records as well.
Connection retries
Specify the number of times to try to connect to a single Black List server
in a case of connection error before setting the result to connection failed.
Connection timeout
Specify the time, in milliseconds, to wait to establish a connection before
timing out.
Triggers
Warning if number of
hits greater then
Specify the minimum number of Black List servers which has the host
listed, that triggers a Warning state.
Down if number of hits
greater then
Specify the minimum number of Black List servers which has the host
listed, that triggers a Down state.
Warning if offline
servers greater then
Specify the minimum number of Black List servers which are offline, that
triggers a Warning state.
Down if offline servers
greater then
Specify the minimum number of Black List servers which are offline, that
triggers a Down state.
69
ServersMaster v1.0.8
User Manual
Reactions (Alerts & Remedies)
Manage the Reactions activated for the Check. Please refer to the chapter "Reactions (Alerts &
Remedies)" in this document for more details.
70
ServersMaster v1.0.8
User Manual
Reactions (Alerts & Remedies)
Every Check can be configured with a number of Reactions. The purpose of Reactions is to notify
administrators for a certain problem or automatically fix a problem without human intervention. You
can setup multiple Reactions per Check. Each Reaction is fired when specific conditions are met,
depending on how the action triggers are configured.
The Reactions can be managed under the Check Settings dialog. For instance, if you want to add an
Email alert to a Ping Check you would do the following:
1.
Open the Device Settings dialog.
2.
Select the Checks Tab.
3.
Double-click the Check in the list of activated Checks.
4.
Click the Add button under the Reactions section.
5.
Select the Email as a type of Reaction and enter the necessary settings.
6.
Click OK to add the Reaction to the list.
Here is a sample scenario:
A Ping Check is configured to set the Check state to Warning if the packet loss is above 50%.
In addition, the following Reactions are configured:
1) An Email Reaction that fires up when the Check state is Warning for more than 30 min.
2) A SSH Command Reaction that fires up when the Check state is down.
3) An Email Reaction that fires up when the Check states returns to Up state.
Due to the issue on the target server, the Ping Check started to return a packet loss in the
range of 60-70%.
After 30 minutes of monitoring, the last Ping Check returned a packet loss that was still not
satisfactory and above 50%. This condition triggered the Email Alert that sent email to all the
administrators.
After 60 minutes, the packet loss hit 100%. ServersMaster activates the SSH Command
Reaction that executes a server restart command.
After 80 minutes, the packet loss dropped to 10%. Serversmaster fires the Email Reaction used
to inform administrators that the Device is back to normal function.
The available Reaction types are: Email, SMS, HTTP(S), SSH Command, Execute Program, Play Sound,
Popup Message.
71
ServersMaster v1.0.8
User Manual
Appendix
This chapter contains the following sections:
Abbreviations
Legal Notices
Support
72
ServersMaster v1.0.8
User Manual
Abbreviations
Please find below the list of most common Abbreviations used in this document:
DNS: Domain Name Service
HTML: Hypertext Markup Language
HTTP: Hypertext Transfer Protocol
ICMP: Internet Control Message Protocol
IMAP: Internet Message Access Protocol
OID: Object Identifier
PDF: Portable Document Format
POP3: Post Office Protocol version 3
SFTP: SSH File Transfer Protocol
SMTP: Simple Mail Transfer Protocol
SNMP: Simple Network Management Protocol
SSH: Secure Shell
SSL: Secure Sockets Layer
TCP: Transmission Control Protocol
73
ServersMaster v1.0.8
User Manual
Legal Notices
This text consists of two parts:
Part 1: The actual license that covers Inteliance ServersMaster.
Part 2: 3rd party software licenses.
--Part 1:
SOFTWARE PRODUCT LICENSE AGREEMENT
This License Agreement (the "Agreement") is a legal agreement between you (an
individual or an entity) and Inteliance Corporation for some or all of the software
products identified below (each, a SOFTWARE PRODUCT), which includes computer
software and electronic documentation. You should carefully read the following
terms and conditions before using the SOFTWARE PRODUCT.
The SOFTWARE PRODUCT is licensed, not sold. The SOFTWARE PRODUCT is protected by
copyright laws and international copyright treaties, as well as other intellectual
property laws and treaties. By installing, copying, or otherwise using the SOFTWARE
PRODUCT, you are agreeing to be bound by the terms of this Agreement. If you do not
agree to all of the terms of this Agreement, you are not authorized to use the
SOFTWARE PRODUCT.
1. GRANT OF LICENSE. If you purchased a license, Inteliance Corporation grants you
the non-exclusive right to install and use the licensed SOFTWARE PRODUCT as
follows: Install and use the software on a number of computers equal to the number
of user licenses purchased. Use of the SOFTWARE PRODUCT without purchase of a
License shall be limited to evaluation purposes only. If you install the trialware
version of the SOFTWARE PRODUCT, you must purchase a license to continue using the
SOFTWARE PRODUCT after the 15-day trial period. This license is not transferable.
2. RESTRICTIONS. (A) You must comply with all applicable laws regarding the use of
the SOFTWARE PRODUCT. (B) You may not decompile, or disassemble the SOFTWARE
PRODUCT. (C) You may not rent or lease the SOFTWARE PRODUCT. (D) You may not
distribute copies of the activated SOFTWARE PRODUCT or license keys to third
parties. (E) You may not exceed the scope of your licensed SOFTWARE PRODUCT. (F)
You may not activate the SOFTWARE PRODUCT with a license key that you did not
legally obtain. (G) You must properly pay for any SOFTWARE PRODUCT license keys
used. (H) You may not use the private programming interfaces of the SOFTWARE
PRODUCT.
3. AUDITING. You give your consent for Inteliance Corporation to monitor SOFTWARE
PRODUCT license key usage for the purpose of auditing compliance with the terms of
this Agreement.
4. TERMINATION. Inteliance Corporation may terminate this Agreement and disable the
SOFTWARE PRODUCT for any length of time, including in perpetuity, without prior
notice if you fail to comply, or Inteliance Corporation has reasonable belief that
you failed to comply, with the terms and conditions of this Agreement. In such
event, you must destroy all copies of the SOFTWARE PRODUCT.
5. NO WARRANTY. Any use of the
extent permitted by applicable
employees, agents, associates,
and conditions, either express
warranties of merchantability,
noninfringement.
SOFTWARE PRODUCT is at your own risk. To the maximum
law, Inteliance Corporation and its owners,
affiliates, and suppliers disclaim all warranties
or implied, including, but not limited to, implied
fitness for a particular purpose, and
6. NO LIABILITY FOR CONSEQUENTIAL DAMAGES. To the maximum extent permitted by
applicable law, in no event shall Inteliance Corporation or its owners, employees,
agents, associates, affiliates, or suppliers be liable for any special, incidental,
indirect, or consequential damages whatsoever (including, without limitation,
damages for loss of business profits, business interruption, loss of business
information, or any other pecuniary loss) arising out of the use of or inability to
use the SOFTWARE PRODUCT (whether due to license termination or any other reason),
even if Inteliance Corporation has been advised of the possibility of such damages.
74
ServersMaster v1.0.8
User Manual
7. LIMITATION OF LIABILITY. Inteliance Corporation's entire liability and your
exclusive remedy under this Agreement shall not exceed your purchase price.
8. THIRD PARTY SOFTWARE AND/OR COMPONENTS. ANY THIRD PARTY SOFTWARE, INCLUDING ANY
THIRD PARTY'S PLUG-IN, THAT MAY BE PROVIDED WITH THE SOFTWARE PRODUCT IS INCLUDED
FOR USE AT YOUR OPTION. IF YOU CHOOSE TO USE SUCH THIRD PARTY SOFTWARE, THEN SUCH
USE SHALL BE GOVERNED BY SUCH THIRD PARTY'S LICENSE AGREEMENT. INTELIANCE
CORPORATION IS NOT RESPONSIBLE FOR ANY THIRD PARTY'S SOFTWARE AND SHALL HAVE NO
LIABILITY FOR YOUR USE OF THIRD PARTY SOFTWARE. YOU MAY ACCESS ANY THIRD PARTY
LICENSE INCLUDED WITH THE SOFTWARE PRODUCT AT http://www.inteliance.com/go/legal,
OR IN THE FILE "LICENSES.txt" LOCATED IN THE APPLICATION INSTALLATION FOLDER.
Nothing in this EULA limits an end user's rights under, or grants the end user
rights that supersede, the terms of any applicable Third-Party Open Source Program
end user license agreement.
--Part 2:
Parts of this software use third-party components that are licensed as follows.
2.1 Qt Toolkit, QtCreator and other code used by these products
This SOFTWARE PRODUCT dynamically links to unmodified Qt5 toolkit and QtCreator2
Library.
The Qt5 Toolkit and QtCreator2 Library is Copyright (C) 2012 Digia Plc and/or its
subsidiary(-ies) and other contributors, and are licensed under the GNU Lesser
General Public License version 2.1 with Digia Qt LGPL exception version 1.1.
Qt5 library is free software; you can redistribute it and/or modify it under the
terms of the GNU Lesser General Public License, version 2.1, as published by the
Free Software Foundation.
As a special exception to the GNU Lesser General Public License version 2.1, the
object code form of a "work that uses the Library" may incorporate material from a
header file that is part of the Library. You may distribute such object code under
terms of your choice, provided that the incorporated material (i) does not exceed
more than 5% of the total size of the Library; and (ii) is limited to numerical
parameters, data structure layouts, accessors, macros, inline functions and
templates.
Qt5 library is provided "AS IS", without WARRANTIES OR CONDITIONS OF ANY KIND,
EITHER EXPRESS OR IMPLIED INCLUDING, WITHOUT LIMITATION, ANY WARRANTIES OR
CONDITIONS OF TITLE, NON-INFRINGEMENT, MERCHANTABILITY OR FITNESS FOR A PARTICULAR
PURPOSE.
Contact: http://www.qt-project.org/legal
The source code for Qt5.0.1 is available from Digia here: http://releases.qtproject.org/qt5/5.0.1/single/qt-everywhere-opensource-src-5.0.1.zip
The source code for QtCreator2.7.0 is available from Digia here:
http://releases.qt-project.org/qtcreator/2.7.0/qt-creator-2.7.0-src.zip
It is also available on request from Inteliance Corporation [[email protected]].
Reference to the GNU Lesser General Public License:
http://www.gnu.org/licenses/old-licenses/lgpl-2.1.html
You should have received a copy of the GNU Lesser General Public License along with
the Qt5 toolkit and QtCreator2 package; if not, write to the Free Software
Foundation, Inc., 51 Franklin Street, Fifth Floor, Boston, MA 02110-1301 USA
Qt contains some code that is provided under specific licenses from the original
authors. Qt also includes a number of third-party libraries that are used to
provide certain features, and are supplied alongside the Qt modules. A list of
third party components, including their licenses and names of the authors can be
accessed at: http://www.inteliance.com/go/legal
2.2 jQuery Library
jQuery JavaScript Library v1.5.1
75
ServersMaster v1.0.8
User Manual
http://jquery.com/
Copyright 2011, John Resig
Dual licensed under the MIT or GPL Version 2 licenses.
http://jquery.org/license
Includes Sizzle.js
http://sizzlejs.com/
Copyright 2011, The Dojo Foundation
Released under the MIT, BSD, and GPL Licenses.
Date: Wed Feb 23 13:55:29 2011 -0500
2.3 Flot Javascript plotting library for jQuery
Copyright (c) 2007-2009 IOLA and Ole Laursen
Permission is hereby granted, free of charge, to any person
obtaining a copy of this software and associated documentation
files (the "Software"), to deal in the Software without
restriction, including without limitation the rights to use,
copy, modify, merge, publish, distribute, sublicense, and/or sell
copies of the Software, and to permit persons to whom the
Software is furnished to do so, subject to the following
conditions:
The above copyright notice and this permission notice shall be
included in all copies or substantial portions of the Software.
THE SOFTWARE IS PROVIDED "AS IS", WITHOUT WARRANTY OF ANY KIND,
EXPRESS OR IMPLIED, INCLUDING BUT NOT LIMITED TO THE WARRANTIES
OF MERCHANTABILITY, FITNESS FOR A PARTICULAR PURPOSE AND
NONINFRINGEMENT. IN NO EVENT SHALL THE AUTHORS OR COPYRIGHT
HOLDERS BE LIABLE FOR ANY CLAIM, DAMAGES OR OTHER LIABILITY,
WHETHER IN AN ACTION OF CONTRACT, TORT OR OTHERWISE, ARISING
FROM, OUT OF OR IN CONNECTION WITH THE SOFTWARE OR THE USE OR
OTHER DEALINGS IN THE SOFTWARE.
2.4 OpenSSL Library
Copyright (c) 1998-2008 The OpenSSL Project.
All rights reserved.
Redistribution and use in source and binary forms, with or without
modification, are permitted provided that the following conditions
are met:
1. Redistributions of source code must retain the above copyright
notice, this list of conditions and the following disclaimer.
2. Redistributions in binary form must reproduce the above copyright
notice, this list of conditions and the following disclaimer in
the documentation and/or other materials provided with the
distribution.
3. All advertising materials mentioning features or use of this
software must display the following acknowledgment:
"This product includes software developed by the OpenSSL Project
for use in the OpenSSL Toolkit. (http://www.openssl.org/)"
4. The names "OpenSSL Toolkit" and "OpenSSL Project" must not be used to
endorse or promote products derived from this software without
prior written permission. For written permission, please contact
[email protected].
5. Products derived from this software may not be called "OpenSSL"
nor may "OpenSSL" appear in their names without prior written
permission of the OpenSSL Project.
76
ServersMaster v1.0.8
User Manual
6. Redistributions of any form whatsoever must retain the following
acknowledgment:
"This product includes software developed by the OpenSSL Project
for use in the OpenSSL Toolkit (http://www.openssl.org/)"
THIS SOFTWARE IS PROVIDED BY THE OpenSSL PROJECT ``AS IS'' AND ANY
EXPRESSED OR IMPLIED WARRANTIES, INCLUDING, BUT NOT LIMITED TO, THE
IMPLIED WARRANTIES OF MERCHANTABILITY AND FITNESS FOR A PARTICULAR
PURPOSE ARE DISCLAIMED. IN NO EVENT SHALL THE OpenSSL PROJECT OR
ITS CONTRIBUTORS BE LIABLE FOR ANY DIRECT, INDIRECT, INCIDENTAL,
SPECIAL, EXEMPLARY, OR CONSEQUENTIAL DAMAGES (INCLUDING, BUT
NOT LIMITED TO, PROCUREMENT OF SUBSTITUTE GOODS OR SERVICES;
LOSS OF USE, DATA, OR PROFITS; OR BUSINESS INTERRUPTION)
HOWEVER CAUSED AND ON ANY THEORY OF LIABILITY, WHETHER IN CONTRACT,
STRICT LIABILITY, OR TORT (INCLUDING NEGLIGENCE OR OTHERWISE)
ARISING IN ANY WAY OUT OF THE USE OF THIS SOFTWARE, EVEN IF ADVISED
OF THE POSSIBILITY OF SUCH DAMAGE.
====================================================================
This product includes cryptographic software written by Eric Young
([email protected]). This product includes software written by Tim
Hudson ([email protected]).
2.5 SNMP++ Library
/*_############################################################################
_##
_## SNMP++v3.2.25
_## ----------------------------------------------_## Copyright (c) 2001-2010 Jochen Katz, Frank Fock
_##
_## This software is based on SNMP++2.6 from Hewlett Packard:
_##
_##
Copyright (c) 1996
_##
Hewlett-Packard Company
_##
_## ATTENTION: USE OF THIS SOFTWARE IS SUBJECT TO THE FOLLOWING TERMS.
_## Permission to use, copy, modify, distribute and/or sell this software
_## and/or its documentation is hereby granted without fee. User agrees
_## to display the above copyright notice and this license notice in all
_## copies of the software and any documentation of the software. User
_## agrees to assume all liability for the use of the software;
_## Hewlett-Packard and Jochen Katz make no representations about the
_## suitability of this software for any purpose. It is provided
_## "AS-IS" without warranty of any kind, either express or implied. User
_## hereby grants a royalty-free license to any and all derivatives based
_## upon this software code base.
_##
_## Stuttgart, Germany, Thu Sep 2 00:07:47 CEST 2010
_##
_##########################################################################*/
/*
* Copyright (C) 2004, 2005 Internet Systems Consortium, Inc. ("ISC")
* Copyright (C) 1996-2001 Internet Software Consortium.
*
* Permission to use, copy, modify, and distribute this software for any
* purpose with or without fee is hereby granted, provided that the above
* copyright notice and this permission notice appear in all copies.
*
* THE SOFTWARE IS PROVIDED "AS IS" AND ISC DISCLAIMS ALL WARRANTIES WITH
* REGARD TO THIS SOFTWARE INCLUDING ALL IMPLIED WARRANTIES OF MERCHANTABILITY
* AND FITNESS. IN NO EVENT SHALL ISC BE LIABLE FOR ANY SPECIAL, DIRECT,
* INDIRECT, OR CONSEQUENTIAL DAMAGES OR ANY DAMAGES WHATSOEVER RESULTING FROM
* LOSS OF USE, DATA OR PROFITS, WHETHER IN AN ACTION OF CONTRACT, NEGLIGENCE
* OR OTHER TORTIOUS ACTION, ARISING OUT OF OR IN CONNECTION WITH THE USE OR
* PERFORMANCE OF THIS SOFTWARE.
*/
77
ServersMaster v1.0.8
User Manual
2.6 Botan Library
Botan (http://botan.randombit.net/) is distributed under these terms:
Copyright (C) 1999-2011 Jack Lloyd
2001 Peter J Jones
2004-2007 Justin Karneges
2004 Vaclav Ovsik
2005 Matthew Gregan
2005-2006 Matt Johnston
2006 Luca Piccarreta
2007 Yves Jerschow
2007-2008 FlexSecure GmbH
2007-2008 Technische Universitat Darmstadt
2007-2008 Falko Strenzke
2007-2008 Martin Doering
2007 Manuel Hartl
2007 Christoph Ludwig
2007 Patrick Sona
2010 Olivier de Gaalon
All rights reserved.
Redistribution and use in source and binary forms, with or without
modification, are permitted provided that the following conditions are
met:
1. Redistributions of source code must retain the above copyright
notice, this list of conditions, and the following disclaimer.
2. Redistributions in binary form must reproduce the above copyright
notice, this list of conditions, and the following disclaimer in the
documentation and/or other materials provided with the distribution.
THIS SOFTWARE IS PROVIDED BY THE AUTHOR(S) "AS IS" AND ANY EXPRESS OR
IMPLIED WARRANTIES, INCLUDING, BUT NOT LIMITED TO, THE IMPLIED
WARRANTIES OF MERCHANTABILITY AND FITNESS FOR A PARTICULAR PURPOSE,
ARE DISCLAIMED. IN NO EVENT SHALL THE AUTHOR(S) OR CONTRIBUTOR(S) BE
LIABLE FOR ANY DIRECT, INDIRECT, INCIDENTAL, SPECIAL, EXEMPLARY, OR
CONSEQUENTIAL DAMAGES (INCLUDING, BUT NOT LIMITED TO, PROCUREMENT OF
SUBSTITUTE GOODS OR SERVICES; LOSS OF USE, DATA, OR PROFITS; OR
BUSINESS INTERRUPTION) HOWEVER CAUSED AND ON ANY THEORY OF LIABILITY,
WHETHER IN CONTRACT, STRICT LIABILITY, OR TORT (INCLUDING NEGLIGENCE
OR OTHERWISE) ARISING IN ANY WAY OUT OF THE USE OF THIS SOFTWARE, EVEN
IF ADVISED OF THE POSSIBILITY OF SUCH DAMAGE.
2.7 ASIO Library
Copyright (c) 2003-2011 Christopher M. Kohlhoff (chris at kohlhoff dot com)
Distributed under the Boost Software License, Version 1.0.
See a copy of the license at http://www.boost.org/LICENSE_1_0.txt
78
ServersMaster v1.0.8
User Manual
Support
The fastest way to get personalized help and troubleshooting is to contact the Inteliance support
department. This way a professional can review the issue, consult with the team and give you the best
answer.
There are two ways to contact the support department:
1.
Submit a support ticket using the online form at http://inteliance.com/go/supportticket.
2.
Write an email to [email protected].
79