1
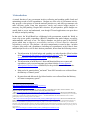
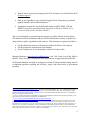
User’s Manual to the BOOST Database for Mexico The World Bank June 2014 1 Contents 1. Introduction ........................................................................................................................ 3 2. Structure of the Database .................................................................................................... 5 Federal Government ........................................................................................................... 5 State and Municipal Governments ..................................................................................... 6 2.1 Particularities of the Data of the Federal Government ................................................. 6 3. How to use the Mexico Database. Some examples ............................................................ 7 3.1. Example 1. Trend Analysis by Administrative Unit ................................................... 9 3.2. Example 2. Composition Breakdown ........................................................................ 10 3.3. Example 3. Initial budget by entities in the Health Sector ........................................ 11 3.4. Example 4. Deviation Analysis ................................................................................. 11 2 1. Introduction A central function of any government involves collecting and spending public funds and maintaining records of such expenditures. Budgets are at the core of government activity: they provide a clear picture of what the national priorities are, and where governments can make efficiency gains. From that perspective, timely and concise budget analysis is necessary for policymaking. Despite their relevance for policymakers, public budgets are usually hard to access and understand, even though IT-based applications can open doors for analysis and policymaking. In that spirit, the World Bank has collaborated with governments around the World to create easy-to-use public expenditure (BOOST) databases that make budgets accessible, understandable, and ready to use. The Mexico database was built as part of the BOOST project which aims to improve accessibility and use of fiscal data for enhanced expenditure analysis. The platform – the most comprehensive created to date - includes revenues, debt stocks and expenditures (including tax expenditures) at the Federal, State and Municipal levels as well as basic data on parastatals, drawn from the following sources: The information for federal budget and spending was taken from the official website of the Secretaría de Hacienda y Crédito Público website1 and by the Transparencia Presupuestaria, Observatorio del Gasto2 from 2008 onwards. The information to build Mexico’s State and Municipal data on revenues and expenditures (only executed amounts) was taken from the Sistema Estatal y Municipal de Base de Datos3 (SIMBAD) for the period between 1989 onwards4. Debt stocks for municipalities5 and states6 from 2005 onwards were collected from the Ministry of Finance portal.7 Revenue data and debt stocks for federal entities were collected from the Ministry of Finance transparency portal.8 1 http://www.shcp.gob.mx/Paginas/default.aspx http://www.transparenciapresupuestaria.gob.mx/ptp/index.jsp 3 http://sc.inegi.org.mx/sistemas/cobdem/ 4 User should select “"Estadistica de finanzas publicas estatales y municipales" then select relevant variables – once output is produced, make sure to expand columns and finally download to excel 5 URL: http://www.hacienda.gob.mx/Estados/Deuda_Publica_EFM/Paginas/registro.aspx, then click on indicadores de deuda and select appropriate year (and 4 trimestre) – finally Select “Obligaciones Financieras de Municipios con la Banca Comercial, de Desarrollo, Emisiones Bursátiles y Otros.” – the downoaded file will need substantial work to match municipality names to existing codes in the dataset. 6 URL: http://www.hacienda.gob.mx/Estados/Deuda_Publica_EFM/Paginas/registro.aspx, then click on indicadores de deuda and select appropriate year (and 4 trimestre) – finally Select Obligaciones Financieras de Entidades Federativas y Municipios garantizada con participaciones e ingresos propios, con la banca comercial, de desarrollo y en emisiones bursátiles. Note that from 2010 onwards, state data included municipal debt therefore amounts reported in the site need to be discounted by the total debt reported by individual municipalities in each state downloaded from transparency portal as per footnote 5. 7 http://www.hacienda.gob.mx/Estados/Deuda_Publica_EFM/Paginas/Presentacion.aspx 2 3 Data on arrears to electricity company from 2013 onwards were collected from IFAI (infomex.org.mx)9. Data on tax expenditures were collected from the Fiscal Transparency portal and inputed manually into the BOOSt database.10 Expenditure amounts for four federal public entities (ISSTE, IMSS, CFE and PEMEX) were taken from Estadísticas Oportunas de Finanzas Públicas de la Secrtearía de Hacienda y Cuentas Públicas.11 This is a tool designed to promote budgetary analysis by public officials and researchers. This manual describes the database and provides the information necessary to update and analyze Mexico public expenditures and revenues. This document is organized as follows: Part II outlines the structure of the data provided by the Mexico Government. Part III presents the organization of the database. Part IV explains how to use the database with an Excel pivot table. Massimo Mastruzzi ([email protected]) is the Task Team Lead of the Mexico BOOST. Please feel free to contact him with any questions or suggestions about BOOST. We hope this database is helpful in opening new avenues of analysis and providing answers to important questions regarding the efficiency, equity, and effectiveness of government spending. 8 http://www.transparenciapresupuestaria.gob.mx then click on “Finanzas Publicas” tab. For revenues,click on ingresos, then gobierno federal and choose ingresos again. For debt, click on deuda publica, then select sequentially first deuda interna and externa for gobierno federal. Do the same for sector public federal from which only data on “organisismos y empresas” will be placed into the boost. 9 A query to the IFAI was made to request data on arrears of municipalities towards the CFE (electricity company) – this data , starting from 2013 will be incorporated in the BOOST file 10 http://www.shcp.gob.mx/INGRESOS/Paginas/presupuestoGastos.aspx 11 http://www.shcp.gob.mx/Paginas/default.aspx. For approved amounts, click on Presupuesto (tab), then on the dropdown menu select Presupuestp de egresos de la federacion..On the left hand side menu select presupuesto de egresos , then select the Presupuesto de egresos de la federacion ejercicio and the year you are looking for, then choose Tomo V Entidades de Control Directo and finally, select the information contain in the document APE. For executed amounts, click on Finazas Publicas (tab), then select Estadisticas Oportunas de Finzas Publicas, then select Flujos de Fondos and finally select Situacion financiera de Pemex, IMSS, CFE and ISSSTE. 4 2. Structure of the Database Federal Government The data for the Mexico’s Federal Government includes budget and expenditures executed by different agencies of the Federal Government. The data is disaggregated by administrative, functional, economic and program classification. The source of funding for each budget line is also identified. Also, there is a geographic variable that identifies the region area where budget amounts were executed for the year 2012. Table 1 classifies the variables of the Mexico’s Federal Government database according to classifications of other BOOST public expenditure databases created by the World Bank. Table 1. Variable description BOOST labels Original Variables Administrative variables ADMIN1 Ramo ADMIN2 Unidad Responsible FUNCTION1 Grupo Funcional FUNCTION2 Función FUNCTION3 Subfunción Functional Variables Economic classification variables ECON0* Egresos, ingresos, acervo de la deuda ECON1* Tipo Gasto ECON2* Economic Level 2 ECON3* Economic Level 3 ECON4* Objeto del Gasto (2008-10) Economic Level 4 (20112012) variable created by BOOST team. ECON5* Objeto del Gasto (2011-12) PROGRAM1 Actividad Institucional PROGRAM2 Identificador del Programa Presupuestario PROGRAM3 Programa Presupuestario Program variables Source of funding variables SOURCE_FIN1 Fuente de Financiamiento Other Variables GEO1 Entidad Federativa Expenditure variables APPROVED Original Autorizado EXECUTED Presupuesto Total Ejercido * Notes: Variable created by the BOOST team. 5 State and Municipal Governments The data for Mexico’s State and Municipal Governments includes expenditures executed by different agencies of the State and Municipal Governments. The data is disaggregated by administrative and economic classification. Additionally, it identifies a geographical classification for the executed amounts. Table 2 classifies the variables of the Mexico’s State and Municipal Governments database according to classifications of other BOOST public expenditure databases created by the World Bank. Table 2. Variable description BOOST Variables Original Variables Administrative variables ADMIN1 ADMIN2 Estado o Municipalidad Nombre de Estado o Municipalidad Economic classification variables Egresos, ingresos, acervo ECON0* de la deuda ECON1 GEO1 Categoría Other Variables Estado Expenditure variables EXECUTED Presupuesto Total Ejercido * Notes: Variable created by the BOOST team. 2.1 Particularities of the Data of the Federal Government The Mexico database presents the following particularities: The data on budgets and expenditures executed by the Federal Government (20082012) comes from Transparencia Presupuestaria, Observatorio del Gasto (Fiscal Transparency Portal). However, the Fiscal Transparency Portal did not present data on budget and expenditure amounts for the following federal public entities: o Instituto Mexicano del Seguro Social (IMSS), o Instituto de Seguridad y Servicios Sociales de los Trabajadores del Estado (ISSTE), o Petróleos Mexicanos (Consolidado) (Pemex) 6 The Fiscal Transparency Portal provided information on the expenditures executed by the Comisión Federal de Electricidad (CFE) (another federal public entity) for the period between 2008 to 2012. However; these amounts were under-estimated if compared to the data found in the website of the Secretaría de Hacienda y Cuenta Pública (Ministry of Finance). For consistency purposes, the BOOST team decided to use the data found in the official website of the Ministry of Finance. Expenditure amounts (for the four federal public entities mentioned above) were taken from Estadísticas Oportunas de Finanzas Públicas de la Secrtearía de Hacienda y Cuentas Públicas (the Public Finance Statistics section of the Ministry of Finance website.) Budget amounts (for the four federal public entities mentioned above) were taken from Presupuesto de Egresos de la Federación de la Secretaría de Hacienda y Cuentas Públicas (Budget of the Federation section of the Ministry of Finance website.) The Fiscal Transparency Portal provided information on Budget and expenditure amounts for the public entity Desarrollo Social (Social Development) for the year 2010. However; these amounts were under-estimated if compared to the data found in the website of the Ministry of Finance. For consistency purposes, the BOOST team decided to use the data found in the official website of the Ministry of Finance. ECON0 was a variable created by the BOOST team, which contains Egresos (Expenditures), Ingresos (Revenues) and Acervo de Deuda (Debt). For the period 2008-2010, the data presented information on Tipo de Gasto (ECON1) and Objeto del Gasto (ECON4). The BOOST team created, using the Clasificador por Objeto del Gasto para la Administración Pública Federal (chart of accounts), two additional economic classifications (ECON2 and ECON3) to provide a clearer sequence of the economic classification of the Federal Government. For the period 2011-2012, the data presented information on Tipo de Gasto (ECON1) and a more desegregated Objeto del Gasto (ECON5). The BOOST team created, using the Clasificador por Objeto del Gasto para la Administración Pública Federal (chart of accounts), three additional economic classifications (ECON2, ECON3 and ECON4) to provide a clearer sequence of the economic classification of the Federal Government. 3. How to use the Mexico Database. Some examples For ease of use, the BOOST team has developed a standard user interface through which to access the BOOST government expenditure database with the help of Excel PivotTables. 7 A PivotTable report is an interactive way to quickly summarize large amounts of data. Use a PivotTable report to analyze numerical data in detail and to answer unanticipated questions about your data. A PivotTable report is especially designed for: Querying large amounts of data in many userfriendly ways. Subtotaling and aggregating numeric data, summarizing data by categories and subcategories, and creating custom calculations and formulas. Expanding and collapsing levels of data to focus your results, and drilling down to details from the summary data for areas of interest to you. Moving rows to columns or columns to rows (or “pivoting”) to see different summaries of the source data. Filtering, sorting, grouping, and conditionally formatting the most useful and interesting subset of data to enable you to focus on the information that you want. Presenting concise, attractive, online or printed reports.12 PivotTables are straightforward and easy to use and allow for quick, customizable analyses of large amounts of data. This section presents several examples of using the BOOST PivotTable interface to general custom reports. With BOOST, as with many things in life, the best way to learn is by doing.13 12 For more information on Excel PivotTables, please consult the help function in Microsoft Excel or this helpful overview of the Microsoft website: http://office.microsoft.com/en-us/excel-help/overview-ofpivottable-and- pivotchart-reports-HP010177384.aspx. 13 The minimum technical requirements for using the Moldova BOOST government expenditure database are as follows: (i) a computer with at least 1 GB of RAM (2 GB preferred); (ii) Microsoft Excel version 2007 or later (or similar database software that allows loading of files with at least one million lines of data). 8 3.1. Example 1. Trend Analysis by Administrative Unit Figure 2 below presents a simple example of time trend analysis at the macro level. It reports total federal government expenditures from 2008 to 2012, broken down by the toplevel administrative classification. To generate this PivotTable, ADMIN1 is placed in the Row Labels box, Year in the Column Labels box, ECON0 in the Report Filter, and the values in the body of the table consist of the sum of the EXECUTED variable. Note: It is necessary to filter ECON0 by clicking on the gray square in the right side of cell and ticking off “Acervo de deuda” and “Ingresos” to have only expenditures amount. Figure1. Examining Government Expenditure across years 9 Do it yourself: how would you generate a similar table using the functional (FUNCTION1) instead of the administrative classification? 3.2. Example 2. Composition Breakdown Figure 3 below presents a breakdown of 2012 government expenditures by economic category and sub-category for each sector in the Mexico functional budget classification. To generate this PivotTable, ECON1 and ECON2 are placed in the Row Labels box, FUNCTION1 in the Column Labels box and the Year (2012) variable and ECON0 is used as a filter. The values in the body of the table consist of the sum of the EXECUTED variable. Note: To only obtain expenditures figures ECON0 must be filtered; tick off “Acervo de deuda” and “Ingresos” as done in the previous example. Figure 2. Examining the Composition of Expenditure by Sector 10 3.3. Example 3. Initial budget by entities in the Health Sector Go back to the dataset for the Administration Entities. Leave Year in the Column Labels box and ADMIN2 in the Row Labels box. Replace EXECUTED amounts for APPROVED amounts in the Values box. Then, drag and drop ADMIN1 into Report Filter box (Keep ECON0 into Report Filter box). Click on the right arrow sign of the ADMIN1 tab and select “12 - Salud”. Figure 3: Example of Time Series Analysis: Initial Budget by Entities in the Health sector (2008-2012) 3.4. Example 4. Deviation Analysis One of the most basic but revealing exercises you can do with BOOST is a deviation analysis; i.e., how much of the budget authorized by the Legislative Assembly was executed at the end of the year. To do this, you need to follow the following steps: 1. Place ADMIN1 is the Row Labels box, Year in the Column Labels box. The values in the body of the table consist of the sum of the APPROVED and PAYMENT variables. You should get a table like the following one: 11 2. Create a new sheet called “Deviation”. 3. Go back to sheet Pivot Table. Copy the Table you created in step 1. 4. Paste the table in the cell A1 of sheet “Deviation”. We need to copy and paste the table in a different sheet because Pivot Tables erase data in case modifications are done. In other words, any analysis you do in this sheet will get lost if you create a new pivot table. At the end of this step, sheet “Deviation” should look like this: 5. 6. In cell L4, write “Deviation 2008”. We will estimate the deviation between executed and budgeted amounts in this column. 7. In cell L5, write down the following formula: =C5-B5. This is the estimation of the difference between the executed and the budgeted amounts for 2008. 12 8. Extend the formula until it reaches the end of your table. At the end of this step, your table should look like this: 9. Repeat the process for the other years. 13