1
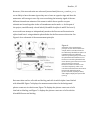
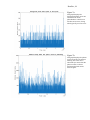
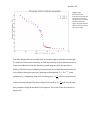
Doerfler, 39 signal is read. The size of the photodiode should be greater than the diameter of the laser, and, in case M4 isn’t precisely on the optical axis and moves slightly in the image plane (no more than the radius of the laser spot), L3 will redirect the laser to hit the photodiode in the center. This ensures that the entire signal is recorded. f. Starting at Ω=0 degrees, rotate M4 approximately 10 microns, and record the movement of the laser spot. Repeat until Ω is past the 65-‐ degree mark. If the laser spot moves more than L3 can redirect it to the photodiode, M4 is not correctly positioned. i. What to do if M4 is not correctly positioned 1. If the laser does not hit M4 in the exact middle, or if it is not at the image distance position of L2, then the spot size will move too much in the image plane of the microscope for the photodiode to record all of the intensity. 2. First check that the laser hits the exact center of M4, and that the mirror is in the exact middle of rotation. If the first requirement is not met, change the position of M3. If the latter requirement is not met change the position of M4. Manipulating TS2 and TS3 can change the positions of M3 and M4. Furthermore, continually ensure that the laser goes straight through AP1/2 and is at the center of the field of view. 3. Recheck the movement of the laser spot on the photodiode as in step 10 f. above. If the laser no longer moves, skip to step 10 g. If it still moves too much check the position of M4 in relation to L2. If M4 is not at the image distance of L2, then move TS1 accordingly. Then, again, check the movement of the laser until the laser spot no longer moves more than the length of its own radius. g. Create a fluorescent solution that will be the sample used in the following steps. This project used a Calcein solution with a concentration of .1 g/L and a pH of 7.2 (see Appendix 1.4). h. In a very dark room, starting at Ω=0 degrees take measurements of intensity vs. micrometer setting. Note: the recommendation is to take measurements every 3 microns until 57 degrees, then take measurements every 2 microns. Total Internal Reflection should occur between Ω=62.5-‐65 degrees, and the intensity of the sample’s signal will drop approximately by a factor of 5. i. Graph intensity vs. micrometer setting, and then graph intensity vs. Ω. Again, the intensity should drop by a factor of 5 when in TIRF, and this should be reflected in the graph. 11. Set up for FCS