1
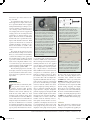
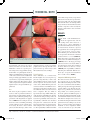
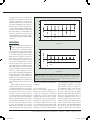
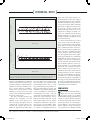
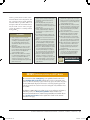
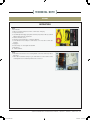
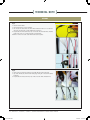
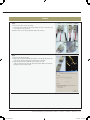
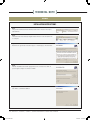
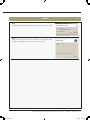
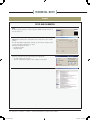
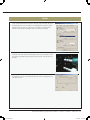
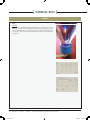
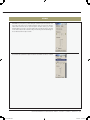
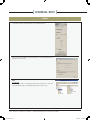
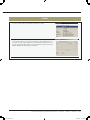
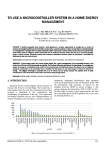
[ technical note ] NEIL TUTTLE, BSc, GradDipAdvManipTher, MPhil, PhD1 • GUILLERMO JACUINDE, MEngTech2 Design and Construction of a Novel Low-Cost Device to Provide Feedback on Manually Applied Forces P force transmitted through the pahysical therapists commonly use their hands to perform tient to the treatment table2,5,7,9 or, manual therapy techniques. While the magnitude of the with the therapist on a force platforce applied during these techniques is thought to be SUPPLEMENTAL VIDEO ONLINE form, the reduction of ground reimportant,10 it can vary between practitioners by as much as action force under the therapist.6 4,11 12 500% and sometimes approach potentially dangerous levels. These methods can accurately Providing students with contemporaneous feedback is one method measure the net applied load but may not that has been shown to improve the consistency of force application.1,6-7 reflect the load applied to the structures Providing feedback for students is complicated by the nature of the techniques performed. Therapists typically use multiple points of contact with both TTSTUDY DESIGN: Design and evaluation, technical note. TTOBJECTIVES: To describe the design of a simple, low-cost device for providing feedback of manually applied forces to the cervical spine, and to assess the device against specific design criteria. TTBACKGROUND: The forces applied during manual therapy may vary by as much as 500% between practitioners. But consistency can be improved in students when they are provided with contemporaneous feedback. The current methods of providing feedback, however, are expensive, complex, and/or preclude their performance in a clinically relevant manner. TTMETHODS: The design of the device was as- sessed in accordance of the following criteria: (1) ease of use, (2) low cost, (3) minimal interference with technique, (4) ability to provide feedback with suitable accuracy at forces up to 50 N, and (5) no requirement of specialized skills to construct. hands, while maintaining adequate support and control, to produce the desired movement. Some investigators have evaluated the net applied load by measuring TTRESULTS: A device is described that interfaces with standard computers through the sound card and measures force, using thin, low-cost, forcesensing resistors. Evaluated against the design criteria, the device (1) is easy to set-up and use, (2) can be produced for under $30 US dollars, (3) creates minimal interference with performance of a variety of techniques, (4) has limits of agreement from –3.8 to 4.2 N for forces of 5 to 45 N and repeatability coefficients of 2.0 N or 12%, and (5) can be constructed without specialized skills or knowledge. TTCONCLUSION: A device is described that fulfils most of the design criteria for providing feedback on forces for physical therapy students and may have applications in other fields. J Orthop Sports Phys Ther 2011;41(3):174-179, Epub 5 January 2011. doi:10.2519/jospt.2011.3461 TTKEY WORDS: education, force feedback, manual therapy of interest. In addition, these methods of measuring the net load are expensive and electronically and procedurally complex. Other investigators have measured the load applied at a single point, the simplest example of which employed a hand dynamometer interposed between the therapist and the patient.16 A sensor positioned between the therapist and the patient can accurately measure the load applied locally; but a dynamometer, due to its size, may prevent the evaluation of some techniques and significantly alter the performance of others. Although not reported as a means to provide feedback, another method of assessing forces applied at a single point of contact is the use of thin, flexible, forcesensing resistors (FSRs), which minimize interference with the therapist’s performance of techniques and sensitivity.8 FSRs have a reported repeatability of approximately 5%, which would be more than sufficient to provide feedback for students; however, the accuracy of the system described would likely be re- Senior Lecturer in Musculoskeletal Physiotherapy, School of Physiotherapy and Exercise Science, Gold Coast Campus, Griffith University, Queensland, Australia. 2Senior Scientific Officer, School of Physiotherapy and Exercise Science, Gold Coast Campus, Griffith University, Queensland, Australia. No grant support was received for the material presented in this manuscript. The authors do not have a financial interest in the device or any components used in its construction. Readers should ensure the suitability of the device for their computer before installing and using the device described in this article. Address correspondence to Dr Neil Tuttle, School of Physiotherapy and Exercise Science, Griffith University, Gold Coast Campus, Queensland, 4222, Australia. E-mail: [email protected] 1 174 | march 2011 | volume 41 | number 3 | journal of orthopaedic & sports physical therapy 41-03 Tuttle.indd 174 2/24/2011 4:40:07 PM duced, due to the contact surface not being controlled.3 In consultation with colleagues, we found support for a simple, low-cost device to provide feedback on forces applied during manual therapy techniques, to be used as a teaching tool. Therefore, we set out to develop a device that would measure, display, and store forces applied at a single point to the cervical spine in the performance of manual therapy techniques. The device had to be affordable and allow the user to perform most techniques with minimal restriction. With regard to its intended use as a means of providing feedback to students, we considered it reasonable to sacrifice some accuracy for lower cost and greater ease of use. The design criteria of the device were that it should (1) be simple to use and calibrate, (2) cost less than $100 US dollars, (3) allow the techniques to be performed in as normal a way as possible, (4) be able to provide real-time and archived feedback on force magnitude within 20% or 5 N for forces up to 45 N, and (5) be constructed from readily available parts without requiring specialist skills. The aim of this paper was to describe the design, construction, and repeatability of measurements of this device and to assess the device against the stated design criteria. METHODS Device Construction F SRs are thin (0.2 mm thick), lowcost pressure sensors whose resistance decreases with pressure applied on the sensor surface. We used Flexiforce A201 sensors (Tekscan, Inc, South Boston, MA), which are rated as having a 1-lb (0.454 kg) range and a 9.53-mm-diameter active area. Glued to 2 sides of the sensor are rounded silicone bumpers and/or metal washers to ensure that force is distributed over a constant area. During development of the device, we collected pilot data to determine what type of “pucks,” when attached to the sen- 2 3.5-mm 3 stereo 2 plugs 1 1 Flexiforce sensor 3 FIGURE 1. The components used to construct the device. The parts shown are (1) an audio jumper lead with 2 male, 3.5-mm plugs, cut in half and wire ends stripped, (2) a 2-element screw connector, (3) a Zelman ZM-EC1 cable (Zalman USA, Inc, Garden Grove, CA), with the male plug removed and wire ends stripped, and (4) a Flexiforce A201 1-lb sensor (Tekscan, Inc, South Boston, MA), with an 11-mm-diameter washer affixed to one side by epoxy adhesive and a 7.9-mm diameter self-adhesive silicone bumper (Bumpon SJ 5302; 3M, St Paul, MN) on the other. More detailed instructions for construction are contained in the APPENDIX (available online at www.jospt.org). The device is symmetrical, so either plug can be inserted into the headphone socket and the other into the microphone socket on a PC or laptop. sor, would result in consistent changes in resistance of FSRs and to ensure that the silicone bumper and washer performed similarly, whether forces were applied over soft tissue or bony prominences. A typical configuration used for performing computer-based measurements with an FSR includes external electronic components to condition the signal, an analogue-to-digital converter to interface with the computer, and software to process the data.13 We used simple wiring, without additional electronic components, and the computer’s soundcard in place of an external analogue-to-digital converter. Custom software was developed for signal processing, which produces a continuous 1000-Hz sine wave output from the computer headphone jack. The signal passes through the FSR and the modified signal returns via the microphone jack, such that the FSR essentially acts as a volume control. The software reads the intensity of the return signal, converts the value to a force equivalent, and displays the force both as an instantaneous value and a time series graph. A target force level can be displayed on the graph and, if required, FIGURE 2. Wiring diagram. One plug is inserted into the headphone socket and the other into the microphone socket of a standard computer soundcard. The output from both channels of the headphones goes through the sensor, and the modified signal returns as input to the microphone socket. Note that a few computers with low specification sound cards will not produce sufficient power to operate the device. FIGURE 3. Screenshot of the software in operation. The force is shown in Newtons on the top right, and a 5-second history of the applied force is shown on the graph. A target force can be included on the graph and appears as a red horizontal line. Start data and stop data recording buttons enable the data to be saved for viewing or analysis at a later time. the force data can be saved for review. The device, the wiring diagram, and a screenshot of the software are shown in FIGURES 1, 2, and 3, respectively. The APPENDIX (available online at www.jospt. org) presents a simple method of construction that does not require any skills beyond cutting, stripping, and taping wires, the use of a screwdriver, and gluing a washer to the sensor. Alternatively, the device can be hardwired and built according to the wiring diagram presented in FIGURE 2. An installable version of the software is available online at www.jospt. org. Calibration The sensor should be conditioned and calibrated prior to each session. Conditioning is accomplished by applying an journal of orthopaedic & sports physical therapy | volume 41 | number 3 | march 2011 | 175 41-03 Tuttle.indd 175 2/24/2011 4:40:08 PM [ technical note ] to the limits of agreement, except that it indicates how closely the repeated measures agree with each other, rather than with a known value. For example, limits of agreement are relevant when a student intends to reproduce a force used by the instructor rather than a force of known magnitude. RESULTS Accuracy T FIGURE 4. Use of the device. (A) The device in relation to a finger with the rounded bumper facing the finger. (B-D)The use of the device during 3 techniques to the cervical spine with an arrow indicating the location of the sensor. approximately 5-kg load to the sensor 5 times, for about 5 seconds each time. Calibration consists of a 1-point procedure using a mass of approximately 4 kg. A full 4-liter or 1-gallon plastic bottle of milk or soft drink, balanced upside-down on the sensor, can be used as a calibration mass (producing approximately 39.5 and 37.5 N of force, respectively, including the weight of the bottle). The volume control of the computer is then adjusted until the digital readout corresponds with the applied load. Use The device is placed against a surface, such as a desk or padded treatment table, and force is applied with a thumb or finger to assist students in gaining an appreciation of the magnitudes of applied forces. FIGURE 4 shows examples of how the device can be used while performing several techniques on the cervical spine. If necessary, the device can be held in place by double-sided tape, either on the therapist’s hand or on the person being palpated. Note that tape should not be placed over the top of the sensor, as this will result in inaccurate readings. Test of Accuracy After calibration, as a vertical load, known weights of 0.5 to 4.5 kg were applied at 0.5-kg intervals, 3 times each, using 4 different sensors on each of 3 different computers. To assess the accuracy of the device, Bland-Altman plots were constructed for the mean differences between the actual values and those measured with the device across the 4 sensors and 3 computers. The 95% limits of agreement (the range within which 95% of the measures would fall) were calculated in Newtons and percentage values. To assess the repeatability of the device, the repeatability coefficient was calculated and plots were constructed for the differences between the repeated measures, when using the same computer and sensor. The repeatability coefficient is similar he mean SD difference between the applied load and the reading on the device was 0.20 2.00 N or 0.3% 14.9%. The limits of agreement that indicate how closely 95% of measurements would be expected to approximate the actual applied load were –3.8 to 4.2 N or –29.5% to 30.1%. Bland-Altman plots show that the limits of agreement in Newtons remained consistent from 5 to 45 N (FIGURE 5A). When expressed as percentages, the differences decreased with increasing force (FIGURE 5B). Due to the large percentage differences for forces of 5 N, the limits of agreement in percentage were calculated for forces from 10 to 45 N as 22.6% (FIGURE 5B). The repeatability coefficients indicating the maximum difference between 95% of repeated measurements were 2.0 N or 12.1% (FIGURE 6). Comparison With Design Criteria The device met most of the design criteria. (1) It was easy to use and calibrate, with calibration taking less than a minute. (2) It cost less than $100 US dollars, having been produced for approximately $30 US dollars. (3) It allowed the techniques to be performed in as normal a way possible, as it could be placed between the patient and different parts of the therapist’s hand and was thin enough (3 mm thick if 2 washers were used and 8 mm thick if 2 bumpers were used) to be used with the therapist’s hands in normal positions for most techniques. (4) It was able to provide real-time and archived feedback on force magnitude within 20% or 5 N for forces up to 45 N, with 176 | march 2011 | volume 41 | number 3 | journal of orthopaedic & sports physical therapy 41-03 Tuttle.indd 176 2/24/2011 4:40:10 PM A 6 Difference From Applied Load (N) contemporaneous visual feedback and feedback from applied-force data stored for later evaluation. Its accuracy was within the design criteria, except that the percentage variability for forces below 5 N were greater than the specified 20%. (5) It was either available off-the-shelf or could be constructed from readily available parts without specialist skills: the device was made from parts that were readily available from electronic suppliers and did not require specialist skills to construct. 4 2 0 –2 –4 –6 0 DISCUSSION 20 30 40 50 Applied Load (N) he described device provides a low-cost, practical method for measuring forces manually applied through 1 point of contact and is considered capable of providing useful feedback for students learning manual therapy skills. The device is able to assess forces applied at 1 point and is only accurate over a relatively narrow range of forces (5 to 45 N). A maximum force of 45 N was selected because the device was designed primarily for use with the cervical spine. Our previous research found that changes in stiffness of the cervical spine related to patient symptoms occur at forces as low as 4 N and predominantly at those below 25 N.14,15 These findings are consistent with those of an earlier study by Marcotte et al,8 who found that pressures applied during motion palpation of the cervical spine ranged from 4.0 to 41 N/cm2. One strength of the device is that it directly measures the force between the user and the patient; however, as a result, it cannot measure net forces that include all points of contact. Nor can its measurements include contact between the user and patient that extends beyond the sensor, such as other parts of the finger, thumb, or hand. Compared to the device presented in this technical note, other devices used to provide feedback are more accurate and applicable over a larger range of forces; but these are at least an order of magnitude more expensive and B 60 Difference From Applied Load (%) T 10 40 20 0 –20 –40 –60 0 10 20 30 40 50 Applied Load (N) FIGURE 5. Bland-Altman plots of accuracy across all sensors, computers, and repeated trials. For both plots, the y-axis indicates the difference between applied load and measured load, with (A) differences in Newtons and (B) in percentages. Dashed lines indicate the 95% limits of agreement. The limits of agreement are shown for forces of 9.8 N and above, due to the large variation with the lower load. interfere more with the performance of techniques. Force Versus Pressure There is an important difference between force as we have considered it up to this point and pressure as discussed by Marcotte et al.8 Force is the relevant parameter if the movement of a vertebra is thought to be related to the magnitude and direction of the applied force. Pressure, which is defined as force per unit area, may be the relevant parameter with respect to tenderness (eg, pressure pain threshold), or soft tissue characteristics, such as swelling or lymphoedema. The characteristics of FSRs are such that their resistance changes in response to the maximum pressure at any point on the sensor area. Marcotte et al,8 who used bare, unmounted sensors, rightly described their results as pressure rather than force. We produced the effect of varying the distribution of force across a sensor, by using either the pad or a fingertip to apply force to an FSR resting on a scale, to reach a series of target values. The resistance of the bare FSRs differed by as much as 100% when pressure was applied by different parts of the finger. journal of orthopaedic & sports physical therapy | volume 41 | number 3 | march 2011 | 177 41-03 Tuttle.indd 177 2/24/2011 4:40:11 PM [ technical note ] A 6 Difference From Mean (N) 4 2 0 –2 –4 –6 0 10 20 30 40 50 Mean Force (N) B 60 Difference From Mean (%) 40 20 0 –20 –40 –60 0 10 20 30 40 50 Mean Force (N) FIGURE 6. Bland-Altman plots of repeatability for trials using the same condition (same sensor and computer). The y-axis indicates the difference between measured load and mean for that condition (shown on the x-axis), with (A) differences in Newtons and (B) in percentages. Dashed lines indicate the 95% repeatability coefficients. Therefore, bare FSRs may be useful when pressure is the parameter of interest (eg, assessment of pressure pain thresholds or palpation of soft tissue, swelling, tenderness, or surface anatomy). For FSRs to measure force, pressure must be evenly distributed over the sensor area, using pucks, such as the washers and bumpers used in the current device.13 The device described in this paper minimizes the complexity, cost, and difficulty of use at some expense of accuracy and range. Though the device is configured for a specific purpose, discussions with colleagues have raised a number of applications for which simi- lar devices might be used. These range from assessing forces applied through partial–weight-bearing casts to teaching postural drainage for premature infants. The relatively slow response time of FSRs does not significantly affect their accuracy at loading rates commonly used in mobilization (less than 2 Hz), but could result in underestimation of force during more rapid techniques, such as high-velocity thrusts. Hall et al6 provide an in-depth description of more complex configuration, calibration, and preparation procedures used for FSRs to maximize dynamic range and accuracy. There are a variety of configurations between those used in this study and those described by Hall et al3 that can be adapted for specific applications. Some configurations include using (1) a range of sensors to assess forces from tenths to hundreds of Newtons or applied over larger areas, (2) electronic circuitry to improve the linearity and range of response, (3) more sophisticated analogue-to-digital converters for simultaneously monitoring multiple channels or to achieve greater resolution and faster sampling rates, and (4) wireless interfaces. Positive feedback has been received on the device from both staff and students of undergraduate and postgraduate programs, as well as students after short continuing-education courses. Using the sensors to measure applied forces before and after 2 continuing-education courses, therapists reduced the average force they applied during motion palpation by approximately 50%. Preliminary feedback from clinical educators, postgraduate students, and undergraduate students is that the device has been valuable in assisting students to more accurately modulate forces applied during assessment and treatment techniques. There is further research needed to determine the effectiveness of this device in assisting students to produce consistent forces and in maintaining force application skills over a period of months. We are also investigating the repeatability of assessing pressure pain thresholds using the device, as well as variations of the device using bare FSR sensors and/or more sophisticated electronic interfaces. CONCLUSION T his technical note describes a simple, low-cost device that fulfils the design criteria for providing feedback while teaching physical therapy students to perform manual techniques on the cervical spine. The device met each of its design criteria, as it was simple to use and calibrate, cost less than $30 US dollars, enabled a variety of techniques to be performed in a clinically relevant 178 | march 2011 | volume 41 | number 3 | journal of orthopaedic & sports physical therapy 41-03 Tuttle.indd 178 2/24/2011 4:40:12 PM manner, provided both real-time and archived feedback on force magnitude, and was constructed from readily available materials without specialist skills. It is anticipated that this and similar devices may be useful across a variety of applications, in addition to teaching manual therapy skills. t REFERENCES 1. C hang JY, Chang GL, Chien CJ, Chung KC, Hsu AT. Effectiveness of two forms of feedback on training of a joint mobilization skill by using a joint translation simulator. Phys Ther. 2007;87:418-430. http://dx.doi.org/10.2522/ ptj.20060154 2. Chiradejnant A, Maher CG, Latimer J. Development of an instrumented couch to measure forces during manual physiotherapy treatment. Man Ther. 2001;6:229-234. http://dx.doi. org/10.1054/math.2001.0418 3. Hall RS, Desmoulin GT, Milner TE. A technique for conditioning and calibrating force-sensing resistors for repeatable and reliable measurement of compressive force. J Biomech. 2008;41:3492-3495. http://dx.doi.org/10.1016/j. jbiomech.2008.09.031 4. H arms MC, Bader DL. Variability of forces applied by experienced therapists during spinal mobilization. Clin Biomech (Bristol, Avon). 1997;12:393-399. 5. Harms MC, Milton AM, Cusick G, Bader DL. Instrumentation of a mobilization couch for dynamic load measurement. J Med Eng Technol. 1995;19:119-122. 6. Keating J, Matyas TA, Bach TM. The effect of training on physical therapists’ ability to apply specified forces of palpation. Phys Ther. 1993;73:45-53. 7. Lee M, Moseley A, Refshauge K. Effect of feedback on learning a vertebral joint mobilization skill. Phys Ther. 1990;70:97-102; discussion 103-104. 8. Marcotte J, Normand MC, Black P. Measurement of the pressure applied during motion palpation and reliability for cervical spine rotation. J Manipulative Physiol Ther. 2005;28:591-596. http://dx.doi.org/10.1016/j.jmpt.2005.08.003 9. Snodgrass SJ, Rivett DA, Robertson VJ. Calibration of an instrumented treatment table for measuring manual therapy forces applied to the cervical spine. Man Ther. 2008;13:171-179. http://dx.doi.org/10.1016/j.math.2007.04.002 10. Snodgrass SJ, Rivett DA, Robertson VJ, Stojanovski E. A comparison of cervical spine mobilization forces applied by experienced and novice physiotherapists. J Orthop Sports Phys Ther. 40:392-401. http://dx.doi.org/10.2519/ jospt.2010.3274 11. S nodgrass SJ, Rivett DA, Robertson VJ, Stojanovski E. Forces applied to the cervical spine during posteroanterior mobilization. J Manipulative Physiol Ther. 2009;32:72-83. http://dx.doi. org/10.1016/j.jmpt.2008.09.012 12. Sran MM, Khan KM, Zhu Q, McKay HA, Oxland TR. Failure characteristics of the thoracic spine with a posteroanterior load: investigating the safety of spinal mobilization. Spine (Phila Pa 1976). 2004;29:2382-2388. 13. Tekscan, Inc. FlexiForce Sensors User Manual. Available at: http://www.tekscan.com/pdfs/ FlexiforceUserManual.pdf. Accessed 2010. 14. Tuttle N, Barrett R, Laakso L. Posteroanterior movements in tender and less tender locations of the cervical spine. Man Ther. 2009;14:28-35. http://dx.doi.org/10.1016/j.math.2007.09.003 15. Tuttle N, Barrett R, Laakso L. Relation between changes in posteroanterior stiffness and active range of movement of the cervical spine following manual therapy treatment. Spine. 2008;33:E673-679. 16. Waddington GS, Adams RD. Initial development of a device for controlling manually applied forces. Man Ther. 2007;12:133-138. http:// dx.doi.org/10.1016/j.math.2006.06.009 @ MORE INFORMATION WWW.JOSPT.ORG BROWSE Collections of Articles on JOSPT’s Website The Journal’s website (www.jospt.org) sorts published articles into more than 50 distinct clinical collections, which can be used as convenient entry points to clinical content by region of the body, sport, and other categories such as differential diagnosis and exercise or muscle physiology. In each collection, articles are cited in reverse chronological order, with the most recent first. In addition, JOSPT offers easy online access to special issues and features, including a series on clinical practice guidelines that are linked to the International Classification of Functioning, Disability and Health. Please see “Special Issues & Features” in the right-hand column of the Journal website’s home page. journal of orthopaedic & sports physical therapy | volume 41 | number 3 | march 2011 | 179 41-03 Tuttle.indd 179 2/24/2011 4:40:14 PM [ technical note ] APPENDIX INSTRUCTIONS Step 1 List of materials: 1. Audio lead, 3.5-mm (1/8 in) stereo male to 3.5-mm stereo male plug 2. Strip connector block 3. Lead with 3-pin female plug, square pin at 2.54-mm (0.1 in) centers. In this case, Zalman ZM EC1 extension lead for computer fan 4. Flexiforce A201 1-lb sensors 5. Thin steel or brass washers (8- to 9-mm outer diameter) 6. 9-mm-diameter silicone bumpers or thin washers of no more than a 9-mm outer diameter 7. Epoxy glue 8. Electrical tape or 2 short lengths of heat-shrink 9. Wire clippers 10. Small screwdriver Step 2 1. Glue washer to back side of sensor, ensuring that the center hole is filled to produce a flat surface. 2. Either attach self-adhesive bumper or glue small washer to front of Flexiforce A201, ensuring that it does not extend beyond the active colored area. journal of orthopaedic & sports physical therapy | volume 41 | number 3 | march 2011 | a1 41-03 Tuttle.indd 1 2/24/2011 4:43:01 PM [ technical note ] APPENDIX Step 3 1. Cut audio lead in middle. 2. Cut back 25 mm (1 in) of outer insulation. 3. Cut off outer wire shield and/or foil shield. Ensure that this shield does not contact the other wires. Electrical tape or heat-shrink may be useful here. 4. Strip insulation from about 12 mm (½ in) of each of the inner insulated wires and twist together the 2 wires on each cable (usually 1 red and 1 black). NOTE: The 2 halves of the audio cable will be identical, but separate. Step 4 1. Cut fan cable near male plug, leaving a long length attached to the female plug. 2. Clip off the middle (red) wire from the female plug, leaving the 2 outside wires (white and black). 3. Strip insulation from about 12 mm (½ in) off the ends of the white and black wires. a2 | march 2011 | volume 41 | number 3 | journal of orthopaedic & sports physical therapy 41-03 Tuttle.indd 2 2/24/2011 4:43:01 PM APPENDIX Step 5 1. Cut 2 sections off the connector block strip. 2. Connect the 2 wires from the fan cable and the twisted wires from ½ of the audio cable to each side of the connector block. NOTE: These wires can be soldered rather than using screw connectors. Step 6 1. Plug sensor into female 3-pin plug. 2. Plug 1 of the 3.5-mm audio leads into the headphone socket and the other into the mic socket on your computer. If prompted, select microphone as the input. 3. Ensure microphone boost is off. Double-click on volume icon. Click “Options”>”Properties”>select the “Recording” radio button>”Advanced.” Ensure the microphone boost box is NOT selected. journal of orthopaedic & sports physical therapy | volume 41 | number 3 | march 2011 | a3 41-03 Tuttle.indd 3 2/24/2011 4:43:02 PM [ technical note ] APPENDIX INSTALLATION INSTRUCTIONS Step 1 Once you have downloaded and saved the file, double-click on “Pressure Sensor.zip” to extract the files. Step 2 Once the files have been extracted, navigate inside the “Release” folder and double-click on “setup.exe.” Step 3 Read the license agreement, select either “I Agree” or “I Do Not Agree,” and click “Next.” Step 4 Select the installation folder and the appropriate users in case there is more than one person using the computer. To continue click “Next.” Step 5 Click “Next” to confirm the installation. a4 | march 2011 | volume 41 | number 3 | journal of orthopaedic & sports physical therapy 41-03 Tuttle.indd 4 2/24/2011 4:43:03 PM APPENDIX Step 6 A new installation window will appear, showing a security warning. Click “Install” to continue. Step 7 The program will deploy and a confirmation screen will pop up, showing that the program has been successfully installed in your computer. Click “Close” to finish. journal of orthopaedic & sports physical therapy | volume 41 | number 3 | march 2011 | a5 41-03 Tuttle.indd 5 2/24/2011 4:43:03 PM [ technical note ] APPENDIX SETUP AND CALIBRATION Step 1 To run the program, simply go to “Start”>”Programs”>”Griffith University” and click on “Pressure Sensor 3-1.” Step 2 WARNING: This step will produce a high-pitched sound coming out from your computer speakers. Press the “Start” button. A high-pitched sound will come out from your computer’s speakers. If you can hear the sound, please go to Step 3. NOTE: If you cannot hear the sound: • Unmute the computer • Adjust the volume NOTE: If you still cannot hear the sound after the previous adjustments: • Check the setting of your sound card • Open the “Control Panel” by going to “Start”>”Settings”>”Control Panel” Once the Control Panel is opened, double-click in “Sound and Audio Devices.” a6 | march 2011 | volume 41 | number 3 | journal of orthopaedic & sports physical therapy 41-03 Tuttle.indd 6 2/24/2011 4:43:04 PM APPENDIX On the “Sounds and Audio Devices Properties” dialog box, click on the “Audio” tab. Select the appropriate devices for your computer for “Sound playback” and “Sound recording” NOTE: if you have more than one sound card in your computer, you should select the card with your microphone and headphone jacks on the front of your computer. Step 3 Connect the device to the microphone and headphones jacks on your computer, as shown in the picture. If prompted by an audio system event pop-up menu, select microphone as the input. Step 4 Press down the force sensor resistor with your finger and check for any change in the raw count value, as shown. journal of orthopaedic & sports physical therapy | volume 41 | number 3 | march 2011 | a7 41-03 Tuttle.indd 7 2/24/2011 4:43:04 PM [ technical note ] APPENDIX Step 5 Calibration Calibration is accomplished by applying a known load of 30 to 40 N to the sensor. A 4-kg weight equals 39.2 N. A full 4-L or 1-gal plastic drink bottle, as shown at right, produces loads of approximately 39.5 or 37.5 N, respectively. Once the known weight is placed on top of the force sensor resistor, adjust the volume until you get the corresponding value on the graph. a8 | march 2011 | volume 41 | number 3 | journal of orthopaedic & sports physical therapy 41-03 Tuttle.indd 8 2/24/2011 4:43:05 PM APPENDIX IMPORTANT: If you experience problems during the calibration (the value saturates even if you reduce the volume of your computer headphone jack), you may need to alter the volume and/or remove the “boost” of your microphone. In order to do this, go to “Sound and Audio Devices Properties,” click on the “Audio” tab (as described in step 2), and click on the “Volume” button of the “Sound Recording.” The following control window will appear. You can then alter the microphone volume. To deselect the boost, click in the “Options” menu and select “Advanced Controls,” as shown journal of orthopaedic & sports physical therapy | volume 41 | number 3 | march 2011 | a9 41-03 Tuttle.indd 9 2/24/2011 4:43:06 PM [ technical note ] APPENDIX A new “Advanced” button at the bottom of the control window will appear. Click on it to access the “Advance Controls for Microphone” control window. Deselect the “Microphone boost” as shown Step 6 Recording Data IMPORTANT: If you need to record the data from the device, first you have to create a new folder using Windows Explorer. Open Windows Explorer and select the C: drive a10 | march 2011 | volume 41 | number 3 | journal of orthopaedic & sports physical therapy 41-03 Tuttle.indd 10 2/24/2011 4:43:06 PM APPENDIX Go to “File”>”New”>”Folder” and rename the new folder “Force_Data” The system is ready to record your data in a coma-separated value format (csv), which can be opened using Excel. You can find your data files in the following directory: C:\ Force_Data. To start recording, simply press the "Start Data Recording" button. To stop, press the “Stop Data Recording" button. To stop the high-pitched sound, press the pause button (remember that it will stop the data acquisition) journal of orthopaedic & sports physical therapy | volume 41 | number 3 | march 2011 | a11 41-03 Tuttle.indd 11 2/24/2011 4:43:07 PM