1
χSuds
Software Understanding System
User’s Manual
Release 1.2
User’s Manual
Release 1.2
First Edition (July 1998)
This edition applies to Release 1.2 of χSuds Software Understanding System for AIX,
Solaris, Windows 95 and Windows NT and to all subsequent versions and releases until
otherwise indicated in new editions.
Copyright© Bellcore 1989, 1998. All rights reserved.
SPARC, SunOS, Solaris and SUN are trademarks of Sun Microsystems, Inc.
Microsoft, Windows, Windows NT and the Windows logo are registered trademarks of
Microsoft Corporation.
UNIX is a registered trademark of The Open Group.
χSuds is a registered trademark of Bellcore.
AIX, OS/2, VisualAge, and IBM are trademarks of the IBM Corporation in the United
States or other countries or both.
Other company, product, or service names may be trademarks or service marks of others.
ii
Table of Contents
User’s Manual
Table of Contents
Chapter 1 Introduction ................................................................................. 1−1
1.1 The Purpose of This Manual ......................................................... 1-2
1.2 The Contents of This Manual ........................................................ 1-2
1.3 How to Use This Manual............................................................... 1-3
1.3.1 About Examples ................................................................. 1-4
1.3.2 Type Conventions .............................................................. 1-4
1.4 Other Sources of Information ........................................................ 1-4
Chapter 2 ATAC: A Tutorial ....................................................................... 2−1
Chapter 3 ATAC: Overview ........................................................................ 3−1
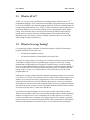
3.1 What is ATAC? ............................................................................. 3-2
3.2 What is Coverage Testing?............................................................ 3-2
3.3 What Does ATAC Do?.................................................................. 3-3
3.3.1 Function-Entry, Function-Return, Function-Call and Block
Coverage ....................................................................................... 3-4
3.3.2 Decision Coverage ............................................................. 3-5
3.3.3 C-Use, P-use, and coverage criteria All-Uses Coverage ...3-6
3.4 How Does ATAC Work? .............................................................. 3-8
3.5 What Will Using ATAC Cost You? .............................................. 3-9
3.6 How Does ATAC Fit into the Development Process? ................3-10
Chapter 4 ATAC: Setting Up Your Execution Environment ....................... 4-1
4.1 Common Environment Variables .................................................. 4-2
4.1.1 ATAC_BLOCKONLY ...................................................... 4-2
4.1.2 ATAC_COMPRESS .......................................................... 4-2
4.1.3 ATAC_COST ..................................................................... 4-2
4.1.4 ATAC_DIR ........................................................................ 4-3
4.1.5 ATAC_TEST ..................................................................... 4-3
4.1.6 ATAC_TMP ....................................................................... 4-3
4.1.7 ATAC_TRACE .................................................................. 4-3
4.2 UNIX Only Environment Information .......................................... 4-4
4.2.1 ATAC_NOTRACE ............................................................ 4-4
4.2.2 ATAC_SIGNAL ................................................................ 4-4
4.2.3 ATAC_TEST_FILE ........................................................... 4-4
4.2.4 PATH ................................................................................. 4-5
4.2.5 TERM ................................................................................. 4-5
4.2.6 ATACLIB .......................................................................... 4-5
4.2.7 ATAC_UMASK ............................................................... 4-5
4.3 Windows Only Environment Information ..................................... 4-5
iv
Table of Contents
User’s Manual
4.3.1
4.3.2
4.3.3
4.3.4
4.3.5
4.3.6
4.3.7
4.3.8
ATAC_CL .......................................................................... 4-6
ATAC_ICC ....................................................................... 4-6
ATAC_LIB ........................................................................ 4-6
ATAC_BIN ........................................................................ 4-6
ROOT ................................................................................. 4-6
DEFINE ............................................................................. 4-6
DEFINEPP ......................................................................... 4-7
VERSION .......................................................................... 4-7
Chapter 5 ATAC: Instrumenting Your Software......................................... 5−1
5.1 Instrumenting on UNIX................................................................. 5-2
5.1.1 Basic Instrumentation ....................................................... 5-2
5.1.2 Integrating with Makefiles ................................................. 5-2
5.1.3 Selectively Instrumenting Software ................................... 5-2
5.1.4 Linking with ld ................................................................... 5-3
5.1.5 Suppressing Instrumentation of Include Files ....................5-5
5.2 Instrumenting on Windows ........................................................... 5-6
5.2.1 Basic Instrumentation ........................................................ 5-6
5.2.2 Integrating with Makefiles ................................................. 5-6
5.2.3 Selectively Instrumenting Software ................................... 5-7
5.2.4 Building Executables with Installed Linkers .....................5-8
5.2.5 Suppressing Instrumentation of Include Files ....................5-8
5.3 Common Instrumentation Options ................................................ 5-9
5.3.1 Code Inside Macros ........................................................... 5-9
5.3.2 Marking Code for Selective Reporting .............................. 5-9
5.4 Compilation and Link Errors ....................................................... 5-12
Chapter 6 ATAC: Executing Software Tests............................................... 6−1
6.1 Naming the Trace File ................................................................... 6-2
6.2 Trace File Compression................................................................. 6-2
6.2.1 Forcing Trace File Compression ........................................ 6-2
6.3 Temporary Trace Files................................................................... 6-3
6.4 Trace File Locking......................................................................... 6-4
6.5 Trace File Permission .................................................................... 6-4
6.6 Parallel Test Execution .................................................................. 6-5
6.7 Improving Execution Speed and Saving Disk Space ....................6-5
6.8 Explaining Run-Time Errors ......................................................... 6-7
Chapter 7 ATAC: Managing Your Test Cases ............................................ 7−1
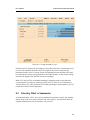
7.1 Listing Test Cases.......................................................................... 7-2
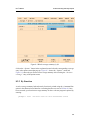
7.2 Selecting Test Cases ...................................................................... 7-3
7.3 Naming Test Cases ........................................................................ 7-4
7.3.1 Renaming Test Cases ......................................................... 7-5
7.3.2 What’s in a Name? ............................................................. 7-6
7.4 Extracting Test Cases and Merging Trace Files ............................ 7-6
v
User’s Manual
7.5
7.6
7.7
7.8
Table of Contents
Deleting Test Cases ....................................................................... 7-7
Assigning Cost to Test Cases ........................................................ 7-7
Dealing with Source Code Modifications ..................................... 7-8
Concerning Trace File Compression ............................................. 7-9
Chapter 8 ATAC: Generating Summary Reports ........................................ 8−1
8.1 Generating Coverage Summaries .................................................. 8-2
8.2 Selecting What to Summarize ....................................................... 8-3
8.2.1 By File ................................................................................ 8-4
8.2.2 By Function ........................................................................ 8-5
8.2.3 By Test Case ...................................................................... 8-8
8.3 Restricting Summary Information ............................................... 8-10
8.3.1 By File .............................................................................. 8-10
8.3.2 By Function ...................................................................... 8-10
8.3.3 By Coverage Criteria ....................................................... 8-11
8.4 Additional Test Case Summaries ................................................ 8-11
8.4.1 Including Cumulative Coverage ...................................... 8-12
8.4.2 Including Test Cost .......................................................... 8-13
8.4.3 Sorting by Coverage ......................................................... 8-13
8.4.4 Sorting by Cumulative Cost per Additional Coverage ....8-14
8.5 Ignoring What is Out-of-Date...................................................... 8-14
Chapter 9 ATAC: Displaying Uncovered Code .......................................... 9−1
9.1 Displaying Uncovered Code.......................................................... 9-2
9.2 Selecting What to Display ............................................................. 9-5
9.2.1 By File ................................................................................ 9-5
9.2.2 By Function ........................................................................ 9-6
9.2.3 By Coverage Criteria ......................................................... 9-7
9.2.4 By Test Case ...................................................................... 9-8
9.2.5 All Uncovered Testable Attributes .................................. 9-10
9.3 Ignoring What is Out-of-Date...................................................... 9-10
9.4 Using Underscoring Rather Than Highlighting........................... 9-11
Chapter 10 ATAC: Testing Modified Code............................................... 10−1
10.1 Coverage of Modified Code ........................................................ 10-2
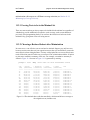
10.2 Modification-Based Regression Test Selection........................... 10-5
Chapter 11 χRegress: A Tool for Effective Regression Testing ................11-1
11.1 Background.................................................................................. 11-2
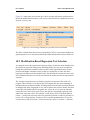
11.2 Test set minimization via a character-based user interface .........11-3
11.2.1 Forcing Tests to be in the Minimal Set ........................... 11-6
11.2.2 Choosing a Reduced Subset after Minimization .............11-6
11.2.3 Minimizing by Coverage Criteria ................................... 11-7
11.2.4 Minimizing by File .......................................................... 11-7
11.2.5 Minimizing by Function .................................................. 11-8
vi
User’s Manual
Table of Contents
11.2. Minimizing by Test Case ........................................................... 11-8
11.3 Test set prioritization via a character-based user interface..........11-9
11.4 Test set minimization and prioritization via a graphical user interface ................................................................................................... 11-11
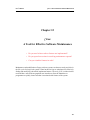
Chapter 12 χVue: A Tool for Effective Software Maintenance .................12-1
12.1 Background.................................................................................. 12-2
12.2 A Tutorial .................................................................................... 12-3
Chapter 13 χSlice: A Tool for Program Debugging................................... 13-1
13.1 Background.................................................................................. 13-2
13.2 A Tutorial .................................................................................... 13-3
Chapter 14 χProf: A Tool for Detailed Performance Analysis...................14-1
14.1 Background.................................................................................. 14-2
14.2 A Tutorial .................................................................................... 14-2
Chapter 15 χFind: A Tool for Transitive Pattern Recognition ...................15-1
15.1 Background.................................................................................. 15-2
15.2 A Tutorial .................................................................................... 15-2
Chapter 16 χDiff: A Tool for Displaying Program Differences.................16-1
16.1 Background.................................................................................. 16-2
16.2 A Tutorial .................................................................................... 16-2
Appendix A: Platform Specific Information................................................ A-1
A.1 UNIX ............................................................................................ A-1
A.2 Windows NT/ Windows 95 .......................................................... A-4
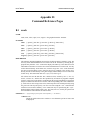
Appendix B: Command Reference Pages.................................................... B-1
B.1 xsuds ............................................................................................. B-1
B.2 atac................................................................................................ B-3
B.3 atac cc (UNIX only) ..................................................................... B-7
B.4 ataclib.......................................................................................... B-11
B.5 atactm.......................................................................................... B-12
B.6 atacdiff ........................................................................................ B-15
B.7 atacid (UNIX only) ..................................................................... B-16
B.8 atac_env_create (UNIX only)..................................................... B-17
B.9 atacCL (Windows only).............................................................. B-18
B.10 atacICC (Windows only) ............................................................ B-20
B.11 prformat (Windows only) ........................................................... B-22
B.12 xconfig (Windows only) ............................................................. B-23
B.13 xfind............................................................................................ B-25
B.14 xdiff ............................................................................................ B-26
vii
Introduction
User’s Manual
Chapter 1
Introduction
Software testing and maintenance are the two most expensive phases of the software life
cycle. Why? And why, in general, are customers not satisfied with the quality of software?
As much as 70% of the cost of an average software system over its lifetime is estimated to
be dedicated to these two tasks. Are there techniques and tools which can help us reduce
the development cost and also improve productivity and quality? Yes. χSuds Software
Understanding System developed at Bellcore, hereafter referred to as the Toolsuite, is just
such a solution. The Toolsuite emphasizes dynamic behavior, and uses software
visualization and heuristic guidance in the solution of software problems.
1-1
User’s Manual
1.1
Introduction
The Purpose of This Manual
This manual covers the use of the Toolsuite. PART 1 explains the basic ideas behind
coverage testing, how ATAC and χATAC work, how to invoke the various features of
each, and how one might use ATAC or χATAC to test a program. PART 2 looks at other
tools including χRegress, a tool for effective regression testing; χVue, a tool for effective
software maintenance; χSlice, a tool for dynamic program debugging; χProf, a tool for
detailed performance analysis; χFind, a tool for transitive pattern recognition; and χDiff, a
tool for better displaying program differences.
1.2
The Contents of This Manual
In addition to this Introduction, this manual is comprised of fifteen other chapters, two
appendices and an index:
PART I
•
Chapter 2, ATAC: A Tutorial, describes how χATAC might be used to test a simple
program;
•
Chapter 3, ATAC: Overview, explains the basic ideas behind coverage testing and
describes how χATAC and ATAC work;
•
Chapter 4, ATAC: Setting Up Your Execution Environment, tells you how to modify your execution environment in order to use χATAC and ATAC;
•
Chapter 5, ATAC: Instrumenting Your Software, describes how to instrument a
program using the ATAC compiler;
•
Chapter 6, ATAC: Executing Software Tests, describes how to manipulate the trace
file and identifies problems that might occur during test execution;
•
Chapter 7, ATAC: Managing Your Test Cases, describes how to manage the contents of an execution trace file;
•
Chapter 8, ATAC: Generating Summary Reports, describes how to generate a
report summarizing the current level of code coverage;
•
Chapter 9, ATAC: Displaying Uncovered Code, describes how to display source
code that has not yet been covered;
•
Chapter 10, ATAC: Testing Modified Code, describes how to find code which has
been modified from one release to the next to facilitate test modification;
PART II
•
Chapter 11, χRegress: A Tool for Effective Regression Testing, describes the tool
1-2
User’s Manual
Introduction
used to identify a representative subset of tests to revalidate modified software;
•
Chapter 12, χVue: A Tool for Effective Software Maintenance, describes how to
use the tool which locates where features are implemented;
•
Chapter 13, χSlice: A Tool for Program Debugging, describes how to use the tool
which is the dynamic program debugger;
•
Chapter 14, χProf: A Tool for Detailed Performance Analysis, describes how to
use the tool which identifies poorly performing parts of code;
•
Chapter 15, χFind: A Tool for Transitive Pattern Recognition, describes the tool
used to assist in identifying pieces of code that are related to one another in a thematic way;
•
Chapter 16, χDiff: A Tool for Displaying Program Differences, describes how to
use the tool which graphically displays differences between files;
APPENDIX
•
Appendix A, Platform Specific Information, provides the specific commands to be
executed for the various operating systems/compilers (primarily for Chapter2).
•
Appendix B, Command Reference Pages, contains UNIX-style manual page
entries for some components of the Toolsuite.
1.3
How to Use This Manual
This manual contains both background material and reference material. The former
explains the basic ideas behind coverage testing and describes how the various components
work. This is what you read if you want to find out ‘‘what a coverage tool is good for’’ or
‘‘what χATAC is all about.’’ The latter describes how to analyze a program using the
various tools.
When you are ready to instrument your code, refer to Chapter 5, ATAC: Instrumenting Your
Software. If you want to avoid reading this manual in its entirety, but want to use χATAC,
read Chapter 2, ATAC: A Tutorial, working through the example as you go. Turn to the
other chapters in this manual, most likely, Chapter 3, ATAC: Overview and the relevant
sections of Chapter 4, ATAC: Setting Up Your Execution Environment, only if necessary.
If you are a software manager, you may only need to read Chapter 3. Looking through the
example provided for each tool (Chapter 2 and 12-16), is useful in bringing all the details
together and seeing how the various tools are used in testing software.
1-3
User’s Manual
Introduction
1.3.1 About Examples
Throughout this manual, descriptive examples have been used to illustrate what is
discussed and whenever possible real output has been incorporated. Commands input by
the user are preceded by:
prompt:>
to assist the user in distinguishing inputs from outputs.
Most of the examples in this manual originate from using the various components of the
Toolsuite to test wordcount, a small program consisting of two source files, wc.c and
main.c (and it’s variants), which counts the number of characters, words and/or lines in its
input. A complete source code listing appears in Appendix A, Platform Specific
Information, and specific examples appear in the chapters describing each tool.
1.3.2 Type Conventions
All text that represents input to or output from programs in the surrounding computing
environment appear in a font whose typeface has constant width. Environment
variables appear in ALL_CAPS. The names of executable programs, source code files, and
references to files created by the tools (.atac and .trace files), symbols, command-line
options, and significant terminology (first usage) appear in italics, as does descriptive text
representative of the actual words or phrases that are to appear. For example, filename is
representative of any file name that might be referenced. Representations of interface
displays are as truthful to the color screen displays as possible. Widget labels (buttons and
pull down menu items) are in italics and ‘‘quoted’’. Finally, some insets and figures are
annotated with descriptive comments or tags that may be referred to later in this manual.
The presence of these annotations and the points to which they refer are indicated by
arrows, like this:
That marks the end of this subsection!
1.4
Other Sources of Information
Additional information concerning ATAC may be found in:
•
J. R. Horgan and S. London, ‘‘Data Flow Coverage and the C Language,’’ in Proceedings of the Fourth Symposium on Software Testing, Analysis, and Verification,
pp 87-97, Victoria, British Columbia, Canada, October 1991.
•
J. R. Horgan and S. London, ‘‘ATAC: A Data Flow Coverage Testing Tool for C,’’
1-4
User’s Manual
Introduction
in Proceedings of Symposium on Assessment of Quality Software Development
Tools, pp 2-10, New Orleans, LA, May 1992.
More information and an explanation of the ideas and terminology underlying coverage
testing may also be found in:
•
R. A. DeMillo, R. J. Lipton and F. G. Sayward, ‘‘Hints on Test Data Selection:
Help for the Practicing Programmer,’’ IEEE Computer, 11(4), 1978.
•
J. R. Horgan and A. P. Mathur, ‘‘Assessing Tools in Research and Education,’’
IEEE Software, 9(3), May 1992.
•
J. R. Horgan, Saul London and M. R. Lyu, ‘‘Achieving Software Quality with
Testing Coverage Measures,’’ IEEE Computer, 27(9), September 1994.
•
H. Agrawal, ‘‘Dominators, Super Blocks, and Program Coverage,’’ in Proceedings of the 21st ACM SIGPLAN-SIGACT Symposium on Principles of Programming Languages, pp 25-34, Portland, Oregon, January 1994.
Information regarding other tools providing automated support for testing may be found in:
•
Berczik, Kenneth, ‘‘Release 5.2 MYNAH System Administration Guide,’’ Issue3,
October 1997. Bellcore Document 00750252005.
The value of coverage testing in detecting faults is explored in:
•
W. E. Wong, J. R. Horgan, S. London and A. P. Mathur, ‘‘Effect of Test Set Size
and Block Coverage on Fault Detection Effectiveness,’’ in Proceedings of the 5th
IEEE International Symposium on Software Reliability Engineering, pp 41-50,
Monterey, CA, November 1994.
•
W. E. Wong, J. R. Horgan, S. London and A. P. Mathur, ‘‘Effect of Test Set Minimization on Fault Detection Effectiveness,’’ Software - Practice and Experience,
28(4):347-369, April 1998.
•
W. E. Wong, J. R. Horgan, A. P. Mathur and A. Pasquini, ‘‘Test Set Size Minimization and Fault Detection Effectiveness: A Case Study in a Space Application,’’
in Proceedings of the 21st IEEE International Computer Software and Application
Conference, pp 522-528, Washington, D.C., August 1997.
•
W. E. Wong, J. R. Horgan, S. London and H. Agrawal, ‘‘A Study of Effective
Regression Testing in Practice,’’ in Proceedings of the 8th IEEE International
Symposium on Software Reliability Engineering, pp 264-274, Albuquerque, New
Mexico, November, 1997.
•
H. Agrawal, J. R. Horgan, S. London and W. E. Wong, ‘‘Fault Localization using
Execution Slices and Dataflow Tests,’’ in Proceedings of the 6th IEEE International Symposium on Software Reliability Engineering, pp 143-151, Toulouse,
France, October 1995.
1-5
User’s Manual
•
Introduction
P. Piwowarski, M. Ohba, J. Caruso, ‘‘Coverage Measurement Experience During
Function Test,’’ in Proceedings of the 15th IEEE International Conference on
Software Engineering, pp 287-301, Baltimore, MD, May 1993.
Other related studies:
•
H. Agrawal and J. R. Horgan, ‘‘Dynamic Program Slicing,’’ in Proceedings of the
ACM SIGPLAN’90 Conference on Programming Language Design and Implementation, pp 246-256, White Plains, NY, June 1990.
•
H. Agrawal, J. R. Horgan, E. W. Krauser and S. London, ‘‘Incremental Regression
Testing,’’ in Proceedings of the 1993 IEEE Conference on Software Maintenance,
Montreal, Canada, September, 1993.
•
W. E. Wong, S. S. Gokhale, J. R. Horgan and K. S. Trivedi, ‘‘Locating Program
Features using Execution Slices,’’ in Proceedings of the Second IEEE Symposium
on Application-Specific Systems and Software Engineering Technology, Richardson, TX, March, 1999.
1-6
PART I
User’s Manual
PART I
ATAC & χATAC
User’s Manual
PART I
Testing is an essential part of software development. However, testing software can be both
complex and expensive. Automated support for effective testing techniques makes it easier
and cheaper to do a better job of testing and to produce higher quality software.
ATAC (Automatic Test Analysis for C) is a coverage analysis tool that allows testers to
measure how thoroughly a program has been exercised by a set of tests. ATAC uses data
flow coverage techniques to provide automated support for ‘‘white-box’’ testing. That is,
ATAC allows testing based upon a program’s structure, in addition to its requirements.
ATAC measures how well a set of tests exercise a program by how well it covers flow
control and data flow relationships within the program’s code. Test sets that yield higher
coverage do a better job of testing. ATAC provides a feedback mechanism to measure and
guide the user to improve test coverage. Such feedback is very difficult, if not impossible,
to obtain without a tool like ATAC.
χATAC (X-based Automatic Test Analysis for C) extends the functionality of ATAC by
using state of the art color graphical interfaces. The ease of use improvement of χATAC
over ATAC is dramatic. Test cases are easy to create and coverage testing is a pleasure
rather than a chore. Notwithstanding the marked superiority of χATAC, ATAC is a
valuable tool when only an ASCII terminal is available. Moreover, much of the
functionality of ATAC and χATAC are the same, so knowledge of one is valuable in
understanding the other. For these reasons, this manual is as much about ATAC as it is
about χATAC.
ATAC and χATAC have many useful features, some of which are:
•
Support for block, decision, and data flow coverage testing;
•
Display of coverage summary information;
•
Display of uncovered source code;
•
Guidance in creating effective tests;
•
Display of coverage overlap among test cases;
•
Support for test set management and minimization.
ATAC: A Tutorial
User’s Manual
Chapter 2
ATAC:
A Tutorial
This chapter illustrates how the basic features of ATAC and χATAC can be used in
reporting code coverage and identifying uncovered source code.
2-1
ATAC: A Tutorial
User’s Manual
In this tutorial we illustrate how the basic features of ATAC and χATAC can be used in
testing by way of a running example. ATAC is used to test wordcount, a program that
counts the number of lines, words, and/or characters given to it as input. Within this
chapter, general terminology is used. See Appendix A, Platform Specific Information, if
you need help determining exactly what to type, and to see expected output samples.
The word counting program takes as arguments an optional list of files and an optional
combination of the flags -l, -w, and -c, each respectively indicating whether to count lines,
words, or characters within the argument files. By default, all input is read from standard
input and all lines, words, and characters are counted. The source code and sample input
for the wordcount program are contained in the files main.c, wc.c, Makefile, input1, input2,
and input3. The complete source listings of the first three files appear in Appendix A,
Platform Specific Information. These files are also installed with ATAC so you may
execute these commands as you read this tutorial. To copy these files, create a new
directory, cd to it, and copy the contents of the directory in which the tutorial files are
installed into the new directory.
Before using ATAC, check that the word counting program compiles and runs on a sample
input. To create your executable program, type the appropriate make or nmake command
to build on your system. If you are unsure which command to use, refer to Appendix A,
Platform Specific Information.
The output should indicate that the source (.c) files are processed and an executable called
wordcount(.exe) is created.
An alternative way to build the executable is to run your compile command including all
the source files in the directory and specifying or renaming wordcount(.exe) as your output
file name.
Once wordcount has been built, run it against a sample input:
prompt:> wordcount input1
The file input1 contains the following line (the first character is a tab):
test input file 1
The output of wordcount should look like this:
1
1
4
4
19
19
input1
total
Now you are ready to use ATAC. Remove the previously created object files and the
executable file. One way to do this is to use the clean command appropriate for your setup.
2-2
User’s Manual
ATAC: A Tutorial
Recompile the wordcount program with ATAC. Refer to Appendix A, Platform Specific
Information for assistance determining these exact commands and for an approximate
example of the output you will see.
As discussed in Section 5.2.2, Integrating with Makefiles, ATAC is easily integrated with
existing makefiles. Again, if you do not wish to use (n)make, you may compile the program
under ATAC by entering the appropriate compile command at your system prompt. If
errors are encountered during compilation refer to Section 5.4, Compilation and Link
Errors.
Notice that in addition to creating the .o or .obj files and the executable file, ATAC has
created main.atac and wc.atac. ATAC creates a .atac file for each .c file it compiles. Each
.atac file contains a list of what needs to be covered when testing its corresponding .c file.
This static coverage information is used later during test analysis.
Now invoke χATAC by entering the following command:
prompt:> xsuds main.atac wc.atac
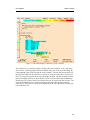
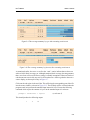
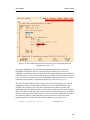
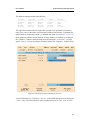
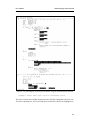
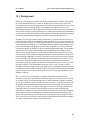
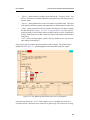
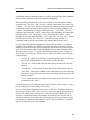
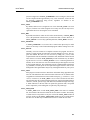
Figure 2-1 shows the main χATAC window display. The source window in the middle
displays the first source file, main.c, with all of its basic blocks1 highlighted in various
colors. Each color represents a certain weight. χATAC determines these weights by doing
a detailed control flow analysis of the program. If, for example, a block has weight 30, it
means any test case that causes that block to be exercised, or covered, is guaranteed to cover
a minimum of 29 other blocks as well. White represents zero weight and red represents the
highest weight among all blocks in the file. Thus, if a block is highlighted in white, it means
that it has already been covered by a test case and covering it again will not add new
coverage. If, on the other extreme, a block is highlighted in red, it means that it has not been
covered by any test case so far and covering it first is the most efficient way to add new
coverage to the program; it is the best way to add maximum coverage in a single program
execution.
The color spectrum chart above the source window displays the actual weights associated
with each color. For example, the chart in Figure 2-1 indicates that all yellow blocks in
main.c have the weight 9, and the red blocks have the weight 15.
The scroll bar to the left of the source window displays a thumbnail sketch of the entire file.
Note that there are no white regions in the scroll bar at this point as we have not run the
instrumented program (the executable compiled with ATAC) on any inputs, so no blocks
in the file have been covered yet.
1. A basic block, or simply, a block, is a code sequence that is always executed sequentially, i.e., it has no internal
branching constructs. It is also described as any ‘‘single-entry-single-exit’’ region of code; see Section 3.3, What
Does ATAC Do?.
2-3
ATAC: A Tutorial
User’s Manual
Figure 2-1 The initial display of the main χATAC window
The scroll bar is very useful in quickly locating where the red blocks, or the ‘‘hot spots,’’
in the file are. Clicking with the left mouse button at any spot in the scroll bar brings the
corresponding region of the file into the source window. You may also use the arrows at
the top or the bottom of the scroll bar to scroll up or down the source file a few lines at a
time. You may also drag the mouse up or down the scroll bar with the left mouse button
pressed to rapidly scroll up or down the file. χATAC also provides keyboard shortcuts.
Pressing the Up or Down arrow key will move the text up or down one line at a time. The
PageUp and PageDown keys scroll up and down the source file one page at a time,
respectively. The Home key scrolls to the beginning of the file, whereas the End key goes
to the end of the file.
2-4
ATAC: A Tutorial
User’s Manual
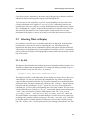
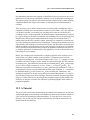
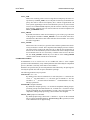
The scroll bar indicates that there is a red spot towards the bottom of the file2. Click on or
near the red spot so that part of the file becomes visible in the source window. Figure 2-2
shows the resulting display.
Figure 2-2 The source display showing the red blocks or ‘‘hot spots’’
Analysis of the code reveals that the two red blocks are exercised whenever the program
reads its input from a file (as opposed to the standard input which is the default behavior).
Let us run wordcount on an input file, input1:
prompt:> wordcount input1
(wordcount.1)
This test should produce the same output as that produced by the version of wordcount
compiled without ATAC as shown earlier.
2. Although the red region, in this case, appears to consist of a single block, it is a sequence of two contiguous basic
blocks, as the first one of the two is a function call. A function call, in general, may never return, e.g., if it invokes
exit under certain conditions. Thus a function call breaks the ‘‘single-entry-single-exit’’ property of a basic block
and results in the start of a new basic block at a statement immediately following the function call.
2-5
ATAC: A Tutorial
User’s Manual
Note that in addition to the expected output, running this test case has created an execution
trace file called wordcount.trace. This file contains dynamic coverage information used in
test analysis. Subsequent tests will cause additional dynamic information to be logged to
the same file.
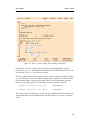
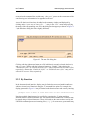
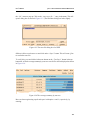
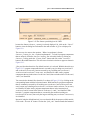
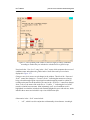
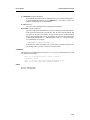
To tell χATAC to incorporate the dynamic information from this trace file into its display,
click with the left mouse button on the ‘‘File’’ button in the top button bar. This will cause
the file menu to pop up. Select the ‘‘open trace file...’’ entry in the menu. This will open a
dialog box as shown in Figure 2-3. (The Windows dialog box looks slightly different.)
Figure 2-3 The trace file dialog box for UNIX
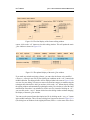
Select wordcount.trace and click on the ‘‘Open’’ button. This will cause χATAC to read
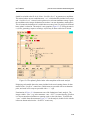
the trace file and update the source window display. Figure 2-4 shows the updated display.
Note that both the previously red blocks, along with several others, have turned in color to
white indicating that they were, indeed, covered by the test case you just ran. The scroll bar
also indicates that several other blocks not currently visible in the source window were
covered as well. Also note that the ‘‘hot spot’’ has now shifted to another statement in the
file. χATAC reassigns colors to all uncovered blocks each time it incorporates new
dynamic information from a trace file.
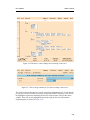
Click on the new red spot in the scroll bar to make that part of the file visible in the source
window. Figure 2-5 shows the new display. The red block, as you can see by analyzing the
code, will be executed only when the program is invoked with an invalid command line
option. Let us run wordcount with an invalid option, ‘‘-x’’:
prompt:> wordcount -x input1
(wordcount.2)
2-6
ATAC: A Tutorial
User’s Manual
Figure 2-4 The source display after executing wordcount.1
It should produce an appropriate error message. Note that χATAC highlights the covered
and uncovered blocks in the source code and prioritizes them into an order in which you
should try to cover them. It does not construct the tests or determine what inputs are needed
to cover the uncovered code. Constructing the tests is the role of the tester. It does, however,
simplify the tester’s job by guiding him or her into creating a small set of high-efficiency,
high-leverage test cases that yield high coverage quickly.
Running wordcount.2 causes its coverage information to be added to the trace file. Note
that χATAC has highlighted the ‘‘Update’’ button in the top button bar, as shown in
Figure 2-6, to alert you to this fact. χATAC continuously monitors the specified trace files
to see if any new coverage information has been added to them. If so, it highlights the
‘‘Update’’ button to indicate this to you. You may choose to click on this button now to
update the display with the coverage information from the test case you just ran, or you may
choose to wait until you have run several test cases.
Click on the ‘‘Update’’ button to tell χATAC to incorporate the coverage information
from wordcount.2 into its display. Figure 2-7 shows the updated display.
2-7
ATAC: A Tutorial
User’s Manual
Figure 2-5 The source display showing the new ‘‘hot spot’’
Figure 2-6 The highlighted Update button
Again notice that the block you were trying to cover, as well as some other previously
uncovered blocks, have changed in color to white indicating that they were covered by the
test you just ran. Also note that the ‘‘hot spot’’ has now shifted to yet another part of the
program.
The scroll bar in Figure 2-7 indicates that there are very few colored blocks left in the file.
Recall, however, that the program consists of two files, main.c and wc.c, and so far we have
only been looking at main.c. To look at the overall picture involving both files, click on the
‘‘Summary’’ button in the top button bar. χATAC displays the per file block coverage
2-8
User’s Manual
ATAC: A Tutorial
Figure 2-7 The main.c source display after executing wordcount.2
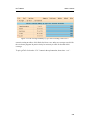
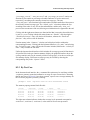
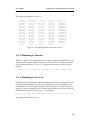
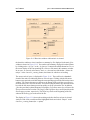
summary, as shown in Figure 2-8.3 The summary window shows that the two tests you have
run so far have covered 28 of the total 38 blocks in main.c and all 13 of the 13 blocks in
wc.c. Overall, they have covered 41 of the 51 blocks, as indicated by the ‘‘total’’ entry
towards the bottom of the display. The bars on the right display the coverages in terms of
percentages. The top two bars indicate that the tests you have run so far have covered 73.7%
of the blocks in main.c and 100% of the blocks in wc.c, respectively. The bottom bar
indicates that they have covered 80.4% of the total number of blocks.
Note that each coverage bar is actually made up of two bars, one contained inside the other.
The length of the outer bar represents the maximum possible (100%) coverage for the
corresponding file and that of the inner bar represents the actual coverage attained so far
for that file. As the actual coverage increases, the length of the inner bar increases
accordingly. When it reaches 100%, the inner bar spans the entire length of the outer bar as
in the case of the wc.c bar in Figure 2-8.
3. If there are more files than can fit in the summary window, a scroll bar appears to the left of the window. You may
use it to scroll through the list of files.
2-9
User’s Manual
ATAC: A Tutorial
Figure 2-8 The coverage summary by-file after executing wordcount.2
The relative lengths of the outer bars of individual files represent the relative sizes of
various files in terms of, in this case, blocks. As wc.c has about one-third the number of
blocks compared to main.c, the outer bar of the former is about one-third the size of the
latter.
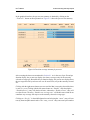
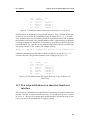
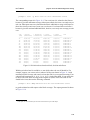
If you want to see the summary with respect to each type, click on ‘‘by-type’’ in the middle
button bar. The result is shown in Figure 2-9. Similarly, click on ‘‘by-function’’ for the
summary with respect to each function as shown in Figure 2-10.
You may click on a file name in the summary window as shown in Figure 2-8 to see the
source display of the corresponding file. For now, click on the wc.c label in that window to
see its source display. Figure 2-11 shows the resulting display. As expected, every block in
the file is highlighted in white as each one of them has been covered.
To go back to the summary window, click on the ‘‘Summary’’ button in the top button bar.
This causes the summary window of Figure 2-8 to be redisplayed with one exception: the
wc.c label now appears selected instead of the main.c label indicating that wc.c was the last
file selected.
2-10
ATAC: A Tutorial
User’s Manual
Figure 2-9 The coverage summary by-type after executing wordcount.2
Figure 2-10 The coverage summary by-function, after executing wordcount.2
As mentioned earlier, the main.c as well as the ‘‘total’’ entries indicate that we have not
achieved 100% block coverage yet. Although complete block coverage does not guarantee
that a set of tests will reveal all errors, testing is certainly incomplete if there are blocks of
code that are not exercised by any test. So click on the main.c label to go back to the main.c
source display, as shown previously in Figure 2-7.
Click near the red region in the scroll bar. This will bring the corresponding part of the file
into the source window, as shown in Figure 2-12. The red block will be executed when the
program reads its input from the standard input instead of a file. Execute the following
command which copies the contents of input1 to the standard input of wordcount:
prompt:> wordcount < input1
(wordcount.3)
This should produce the following output:
1
4
19
2-11
ATAC: A Tutorial
User’s Manual
Figure 2-11 The wc.c source display after executing wordcount.2
Note that the ‘‘Update’’ button in the top button bar is again highlighted, as shown
previously in Figure 2-6, indicating that new information is available in the trace file. Click
on this button. Figure 2-13 shows the new display.
The new red block indicates that we need a test case where the input file cannot be opened,
e.g., if the file does not exist. Scrolling through the source window to see other nonwhite
blocks indicates that we need a test case where the line, word, and character counting
options are specified explicitly. The following test cases cover these situations:
prompt:> wordcount nosuchfile
(wordcount.4)
prompt:> wordcount -wlc input1
(wordcount.5)
The former test case should produce an error message indicating that the file could not be
found and the latter test case should produce the same output as wordcount.1, as shown
earlier.
2-12
User’s Manual
ATAC: A Tutorial
Figure 2-12 The main.c source display showing the new ‘‘hot spot’’
Click on the ‘‘Update’’ button. Figure 2-14 shows the updated display. The scroll bar
indicates that all blocks in the file have now been covered. To view the by file summary
again, click on the ‘‘Summary’’ button in the top button bar. Figure 2-15 shows the new
summary. As you can see, the five tests you have run so far have achieved 100% block
coverage over both files. They do not, however, constitute a complete set of tests. There
may be errors not revealed by these tests that will be revealed when different combinations
of statements are executed, or when they are executed in a different order. The remaining
coverage measures are designed to help create tests that will reveal these errors.
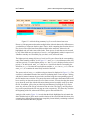
Click on the ‘‘by-type’’ button. This will show the coverages achieved so far using various
coverage measures, as shown in Figure 2-16. The first two entries indicate that the five tests
you ran have covered all 3 of 3 function entries and 51 of 51 blocks in all source files. The
next three entries provide the coverage status for other coverage measures known as
decision, c-use, and p-use (see Section 3.3, What Does ATAC Do? for an explanation of
these measures). Note that none of these measures have reached a 100% coverage status
yet. Let us now try to raise the decision coverage to 100%.
2-13
User’s Manual
ATAC: A Tutorial
Figure 2-13 The main.c source display after executing wordcount.3
A decision is a conditional branch from one block to another. As can be seen from the
coverage summary in Figure 2-16, it is possible that a set of tests will cover all blocks in a
program without covering some of the decisions. In this example, 30 of the total 35
decisions have been covered. In order to determine what additional test cases are needed to
cover the remaining five decisions, click on the ‘‘decision’’ button in the third row. Figure
2-17 shows the resulting display.
Alternatively, to switch to decision coverage, you may also click on the ‘‘Options’’ button
in the top button bar and select the ‘‘decision coverage’’ entry from the resulting menu, as
shown in Figure 2-18.
In a decision display, all conditional expressions in a file are highlighted. If an expression
is highlighted in white, it means all branches originating at that expression have been
covered. If, on the other hand, it is highlighted in a nonwhite color, it means there is at least
one branch originating there that has not been covered yet. To find out which one, you may
click on the highlighted expression. This will pop up a window showing a list of all
branches originating there highlighted in colors that indicate their coverage status and
current weights.
2-14
User’s Manual
ATAC: A Tutorial
Figure 2-14 The main.c source display after executing wordcount.5
Figure 2-15 The coverage summary by-file after executing wordcount.5
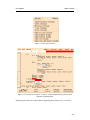
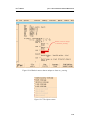
The scroll bar shows that there are several expressions highlighted in red. Use the bottom
(or top) arrow in the scroll bar to scroll up (or down) the source window by a few lines so
the highlighted expression controlling the do-while loop becomes visible in the source
window. Then click on the highlighted expression to pop up the list of all branches
originating there, as shown in Figure 2-19.
2-15
User’s Manual
ATAC: A Tutorial
Figure 2-16 The coverage summary by-type after executing wordcount.5
Figure 2-17 The main.c decision display after executing wordcount.5
Note that, of the two possible outcomes of the highlighted conditional expression, true and
false, the latter is highlighted in white indicating that the false branch of the loop expression
has already been covered. The former, however, is highlighted in red implying that the true
branch is yet to be covered. Note that the loop expression itself is highlighted in red
2-16
ATAC: A Tutorial
User’s Manual
Figure 2-18 The Options menu
Figure 2-19 A decision ‘‘hot spot’’ in main.c with a window showing the list of all
branches originating there
indicating that at least one of the branches originating there remains to be covered. In
2-17
ATAC: A Tutorial
User’s Manual
general, the color of a conditional expression at any time is the same as the color of the
‘‘heaviest’’ branch originating there at that time.
To cover the true branch of the loop expression, you must invoke wordcount with more
than one input file. Execute the following command to do this:
prompt:> wordcount input1 input2
(wordcount.6)
It should produce the following output:
1
2
3
4
8
12
19
38
57
input1
input2
total
Click on the highlighted ‘‘Update’’ button to read the coverage information from the above
test case. Figure 2-20 shows the relevant part of the updated display.
Figure 2-20 A part of the main.c
decision display after executing
wordcount.6
Figure 2-21 A decision ‘‘hot spot’’ in
main.c with its branch list after executing
wordcount.6
Click on the ‘‘dismiss’’ entry at the bottom of the decision branch list (Figure 2-20). This
will remove the branch list window from the display.4
The scroll bar now indicates that there are still three nonwhite conditional expressions
towards the bottom of the file and one towards the top of the file. Click near the top of the
scroll bar to bring the corresponding text in the source window. Then click on the
4. A branch list window that pops up when you click on a highlighted conditional expressions in a source window
‘‘sticks’’ to the display at the point where the mouse was clicked. It does not scroll up or down with the source
window. Therefore you should always close it by clicking on the ‘‘dismiss’’ entry before scrolling the source window. You may, however, invoke χATAC with the -nosticky option to make its behavior similar to that of a pulldown menu. In that case, a branch list window will remain popped up as long as you keep the mouse button
pressed. It will be automatically closed when you release the button.
2-18
ATAC: A Tutorial
User’s Manual
highlighted switch expression to show the corresponding branch list, as shown in
Figure 2-21. The branch list indicates that four of the five possible branches of the switch
statement have already been covered. The remaining branch can be covered by invoking
the wordcount program with a ‘‘-?’’ option. The following command accomplishes this5:
prompt:> wordcount -?
(wordcount.7)
This test case should print an appropriate usage message. Click on the ‘‘Update’’ button to
confirm that it has, indeed, covered the desired branch of the switch statement. Then close
the branch list window by clicking on the ‘‘dismiss’’ entry.
So far we have invoked wordcount with options that have caused it to print all three - line,
word, and character - counts. We have never invoked it to print only one or two of these
counts. Examining the remaining uncovered decisions reveals that we should invoke the
program with only one of the three options, -l, -w, and -c, in order to cover these uncovered
decisions. The following two commands achieve this:
prompt:> wordcount -l input1
(wordcount.8)
prompt:> wordcount -w input1
(wordcount.9)
They should produce appropriate line and word counts, respectively, for the file, input1.
Click on the ‘‘Update’’ button and you will see that all decisions in the file have been
covered. Now go back to the summary window to check the overall coverage status by
clicking on the ‘‘Summary’’ button and selecting the ‘‘by-type’’ coverage option. Figure 222 shows the new coverage summary.
Figure 2-22 The coverage summary by-type after executing wordcount.9
5. You may need quotes around the question mark depending on whether or not the command processor you are using
interprets it as a wildcard character.
2-19
User’s Manual
ATAC: A Tutorial
All blocks and decisions have now been covered. The fourth row in the summary display,
however, indicates that there are some c-uses that have not been exercised. A c-use, or a
computational variable use, is a combination of an assignment to a variable and a
subsequent use of that variable in a computation that is not part of a conditional expression
(see Section 3.3, What Does ATAC Do?). Typically one attempts to achieve high c-use
coverage only for code which must be tested very thoroughly. Let us now try to cover the
remaining c-uses that have not yet been covered.
Click on the ‘‘c_use’’ button in the summary display. Figure 2-23 shows the resulting
display. A c-use display for a file highlights all the definitions of, or the assignments to, the
Figure 2-23 The c-use definitions display for main.c after executing wordcount.9
variables involved in all c-uses in the file. If a c-use assignment is highlighted in white, it
means all c-uses originating at that assignment have been covered. If, on the other hand, it
is highlighted in a nonwhite color it means that there is at least one c-use originating at this
assignment that has not been covered yet. For example, the white highlighting of the
assignment to the variable p in the loop initialization of the for loop in Figure 2-23 indicates
that all c-uses involving this assignment have already been covered. The assignment of the
2-20
ATAC: A Tutorial
User’s Manual
variable doline in the first switch branch inside the for loop, on the other hand, is
highlighted in red. This means there are one or more c-uses of this assignment that have not
been covered yet. To see which ones, click on the assignment statement. Figure 2-24 shows
the resulting display after scrolling down the file so the highlighted c-uses become visible
in the source window. Note that the highlighting of the assignment is also retained for easy
Figure 2-24 The display showing the c-uses of the highlighted assignment to the variable
doline in Figure 2-23
reference, although in a different color so as not to confuse it with the corresponding uses.
Of the three c-uses of the assignment to doline, two are highlighted in white indicating that
they have been covered. To cover the remaining uncovered c-use, we must invoke the
program asking it explicitly to count the number of lines when the input is supplied via the
standard input. The following test case achieves this:
prompt:> wordcount -l < input1
(wordcount.10)
2-21
ATAC: A Tutorial
User’s Manual
Updating the display with the ‘‘Update’’ button confirms that the uncovered c-use of doline
has been covered.
Click on the ‘‘Summary’’ button and select the ‘‘c_use’’ entry to go back to the c-use
definitions display. Execute the following two tests to cover the analogous c-uses involving
the assignments to the variables doword and dochar inside the switch statement in
Figure 2-23:
prompt:> wordcount -w < input1
(wordcount.11)
prompt:> wordcount -c < input1
(wordcount.12)
Examining the remaining uncovered c-uses reveals that we have never tested the program
to see if it works correctly in the following situations:
•
Invoking the program with a valid command line option in combination with an
input file that does not exist;
•
Invoking it with one valid and one invalid command line option at the same time;
•
Invoking it with one valid and one invalid input file at the same time.
Execute the following test cases to address the above situations:
prompt:> wordcount -l nosuchfile
(wordcount.13)
prompt:> wordcount -lx input1
(wordcount.14)
prompt:> wordcount input1 nosuchfile (wordcount.15)
Update the display with the ‘‘Update’’ button. All c-uses in the file have now been covered.
Display the overall coverage summary by clicking on the ‘‘Summary’’ button and selecting
the ‘‘by-type’’ coverage option, as shown in Figure 2-25. The c-use summary indicates that
only 89 of the total 92 c-uses have been covered yet. But all c-use assignments in main.c
were highlighted in white indicating that all c-uses in that file have been covered. This
means the remaining three uncovered c-uses must be in the file wc.c.
To switch to wc.c display, click on the ‘‘File’’ button in the top button bar and select the
‘‘wc.c’’ entry from the resulting file menu. Figure 2-26 shows the c-use display for wc.c.
Click on the first highlighted assignment. Figure 2-27 shows the corresponding c-uses. The
only remaining uncovered c-use in the display can be covered if the control never enters
the body of the while statement. This is possible only when the program is invoked with an
empty input file. Execute the following test case to achieve this:
prompt:> wordcount empty
(wordcount.16)
2-22
User’s Manual
ATAC: A Tutorial
Figure 2-25 The coverage summary by-type after executing wordcount.15
Figure 2-26 The c-use definitions display for wc.c after executing wordcount.15
Update the display using the ‘‘Update’’ button to check that the uncovered c-use is covered
by the last test case. Click on the ‘‘Summary’’ button and select the ‘‘c-use’’ entry to go
back to the c-use definitions display, as shown in Figure 2-28. Note that besides covering
the desired c-use involving the variable nl, the last test case also covered the analogous cuses involving the variables nw and nc. Figure 2-29 shows the new coverage summary. As
the c-use entry in the summary indicates, you have now achieved a 100% c-use coverage.
The fifth row of the coverage summary in Figure 2-29 indicates the current p-use coverage
status. A p-use, or a predicate variable use, is a combination of an assignment to a variable,
a subsequent use of that variable in a conditional expression, and a particular branch
originating at that conditional expression (see Section 3.3, What Does ATAC Do?). Thus a
p-use is like a c-use except that the variable use is in a branch originating at a conditional
expression. Note that 30 of the total 31 p-uses have already been covered.
2-23
User’s Manual
ATAC: A Tutorial
Figure 2-27 The display showing the c-uses of the first highlighted assignment in
Figure 2-26
Figure 2-28 The c-use definitions display for wc.c after executing wordcount.16
To see the only remaining uncovered p-use, click on the ‘‘p_use’’ button in the summary
display. Figure 2-30 shows the resulting display. Like the c-use display, the p-use display
highlights all the definitions of, or assignments to, the variables involved in all p-uses in
the file. If a p-use assignment is highlighted in white, it means all p-uses originating at that
assignment have been covered. Four of the five highlighted assignments6 in Figure 2-30 are
6. Highlighting of a type declaration of a function argument, as in the case of the first highlighted definition in
Figure 2-30, refers to the implicit assignment of the formal argument with the actual argument in the corresponding function call.
2-24
User’s Manual
ATAC: A Tutorial
Figure 2-29 The coverage summary by-type after executing wordcount.16
Figure 2-30 The p-use definitions display for wc.c after executing wordcount.16
highlighted in white. The nonwhite color of the remaining assignment indicates that there
is at least one p-use originating at that assignment that is yet to be covered. To see all the
p-uses of this assignment, click on the highlighted assignment expression. Figure 2-31
shows the resulting display. It highlights all conditional expressions that use the variable
assigned by the assignment in question. In this case there is only one such conditional
2-25
ATAC: A Tutorial
User’s Manual
Figure 2-31 The conditional expressions involved in p-uses originating at the red
assignment in Figure 2-30
expression, highlighted in red. Note that the assignment in question has also been
highlighted in a different color for your reference. Recall that a p-use involves an
assignment, a conditional expression, and a particular branch originating at the conditional
expression. So far, we have only seen the former two elements of the remaining uncovered
p-use. To see the last element, click on the highlighted conditional expression. A window
containing a list of branches originating there pops up, as shown in Figure 2-32.
The color of a branch indicates the coverage status of the corresponding p-use. The red
highlighting of the true branch indicates that the p-use involving the definition of the
variable state outside the while loop and its subsequent use in the true branch of the
highlighted expression inside the loop is yet to be covered. Analysis of the code reveals that
this p-use will be covered only if the very first character read by the program is a nonwhite
character. Both input files we have used so far, input1 and input2, contained a tab in their
first character positions. On the other hand, input3 does not have white space at the
beginning of the file. So the following command should cover the above p-use:
prompt:> wordcount input3
(wordcount.17)
2-26
User’s Manual
Figure 2-32 A part of the wc.c p-use
display after executing wordcount.16
ATAC: A Tutorial
Figure 2-33 A part of the wc.c p-use
display after executing wordcount.17
Click on the ‘‘Update’’ button. Figure 2-33 shows the updated branch list indicating that
the p-use we were trying to cover was indeed covered.
Note that the false entry in the branch list is not highlighted at all (Figure 2-32 and
Figure 2-33) either in white or in a nonwhite color. This is because the corresponding p-use
is an infeasible p-use -- it is impossible to cover it by any test case. The assignment involved
assigns the value, OUT, to the variable, state. The conditional expression involved checks
to see if state has the value OUT. Whenever the value examined by the latter is that assigned
by the former, the conditional expression will evaluate to true. Thus it is impossible to
cover the corresponding p-use involving the false branch. ATAC automatically detects
many infeasible decisions, c-uses and p-uses and ignores them. It cannot, however, detect
all such decisions, c-uses or p-uses.7
Click on the ‘‘dismiss’’ entry to close the branch list. Then click on the ‘‘Summary’’ button
in the top button bar and select the ‘‘by-type’’ entry. Figure 2-34 shows the resulting
coverage summary. All coverage criteria measured by ATAC are now covered. From
ATAC’s point of view, these 17 tests are a completely adequate test of wordcount. Of
course, all we have done is create a set of tests that will thoroughly test the program. You
must check that the program actually passed the tests. This may be done while using
χATAC or after recompiling the program with the standard compiler.
There is no guarantee that a program which has passed a completely adequate set of tests
has no errors.8 However, in addition to producing test sets that reveal errors, the use of
ATAC and χATAC to achieve high coverage places the source code under intensive
scrutiny which also tends to reveal errors. A complete test set combined with the effort to
create such a test set is very effective at revealing errors. For large programs, it may require
7. No program can automatically detect all infeasible decisions, c-uses or p-uses as the general problem of determining if a decision, a c-use or a p-use is infeasible is an unsolvable problem.
8. In general, only when all possible inputs have been tested does passing the tests imply the program is error free.
For most programs this is impossible.
2-27
User’s Manual
ATAC: A Tutorial
Figure 2-34 The coverage summary by-type after executing wordcount.17
extensive testing to achieve 100% block, decision, c-use, and p-use coverage as we did for
the wordcount program. In practice it may be necessary to settle for less than 100%
coverage.
To quit χATAC click on the ‘‘File’’ button in the top button bar, then select ‘‘exit’’.
2-28
ATAC: Overview
User’s Manual
Chapter 3
ATAC:
Overview
This chapter provides an overview of ATAC and is recommended reading for first-time
users or those who want a summary of ATAC.
3-1
User’s Manual
3.1
ATAC: Overview
What is ATAC?
ATAC is a coverage analysis tool that aids in testing programs written in the C or C++
programming language. ATAC measures how thoroughly a program has been exercised by
a set of tests, identifies code within the program that is not well tested, and determines the
overlap among individual test cases. ATAC is used by software developers and testers to
measure the adequacy of a test set and identify areas in a program that require further
testing. These measures may be used for project tracking to indicate progress during
testing, and as acceptance criteria to subsequent stages of development and testing.
Regression testers also may use ATAC to identify a particular subset of a test set that
achieves high coverage at limited cost.
3.2
What is Coverage Testing?
Coverage testing suggests a number of criteria that should be satisfied when testing a
program. Examples of such criteria are:
•
All statements should be executed;
•
All decisions should be evaluated both to true and to false.
The goal of coverage testing is to develop a set of tests that satisfy the criteria. Notice that
each of these example criteria are dependent upon a program’s source code. Testing
methods that use information about a program’s internal structure are said to perform
white-box testing. Methods that only consider a program’s inputs and outputs, making no
use of its source code, are said to perform black-box testing. ATAC supports white-box
testing, so the coverage criteria discussed here will be tied to the source code of the
program under test.
Each specific coverage criterion identifies a number of program constructs to be exercised
(covered) by a set of tests. The constructs to be covered are called testable attributes. For
instance, in covering all decisions as suggested above, there is one testable attribute for
each true branch and one for each false branch in the program. A tester covers them by
developing a test set that executes each of these branches. A test set is considered adequate
with respect to a given coverage criterion if all testable attributes identified by the criterion
are exercised, at least once, by some test within the set.
It is harder to develop an adequate test set for some coverage criteria than for others.
Weaker criteria usually require fewer test cases than stronger criteria to obtain completely
adequate coverage. However, a test set adequate for a weaker criterion is less likely to
reveal an error than a test set adequate for a stronger criterion. For example, it generally
requires fewer test cases to ensure that all functions within a program are invoked than to
ensure that all statements are executed. However, a test set that executes all program
3-2
ATAC: Overview
User’s Manual
statements tends to test a program more thoroughly than a test set that invokes all functions.
This is because it is possible to invoke all functions without executing all of their
statements. The converse is not true.
One coverage criterion is stronger than another if, for any program, completely adequate
coverage for the first implies completely adequate coverage for the second and, as with
statement and function coverage, the converse is not true. If the converse is also true, then
the coverage criteria are of equal strength.
In practice, for many coverage criteria, a completely adequate test set is not easy to create
for most programs. As a test set is being developed, it exhibits a level of adequacy called a
coverage measure - the percentage of testable attributes exercised by its set of tests. As a
test set’s coverage measure improves, it becomes harder to create test cases that cover the
remaining, uncovered testable attributes. In some cases, it may be impossible or impractical
to achieve completely adequate coverage. For example, a program may contain code to
detect and handle error conditions that are very hard to simulate during testing. The
appropriate target coverage measures for any program under test depend on the
characteristics and reliability requirements of that program.
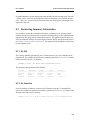
3.3
What Does ATAC Do?
ATAC provides an integrated suite of software tools that support coverage testing for a
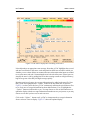
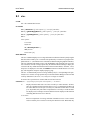
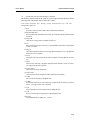
number of coverage criteria (as described later): function-entry, function-call, functionreturn, block, decision, c-use, p-use, and all-uses. It should be noted that c-use, p-use and
all-uses coverage is not available for C++, and that function-call and function-return are not
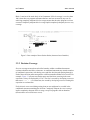
currently available in χATAC, the graphical interface. Figure 3-1 depicts an approximate
All-Uses
P-Use
C-Use
Decision
Block
Function Return
Function Call
Function Entry
Figure 3-1 An approximate partial ordering of ATAC coverage criteria
partial ordering of these coverage criteria from weak to strong. Given a program to test,
ATAC computes its set of testable attributes and instruments it to record trace information
during test execution. As subsequent tests are executed, the trace information is appended
3-3
User’s Manual
ATAC: Overview
to a trace file. At any point, a tester can selectively report coverage measures or display
source code associated with any uncovered testable attributes. The former allows the tester
to assess how the test is progressing, the latter aids in developing new tests to exercise what
has not been covered.
ATAC can instrument all, or a selected portion, of the files making up a software system.
This allows testing to be targeted at a specific portion of the system and makes it possible
to incrementally manage the overhead of testing a large system. The coverage measures
reported only pertain to that source code which has been instrumented, and any
instrumentation added has no effect on non-instrumented code.
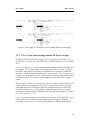
3.3.1 Function-Entry, Function-Return, Function-Call and Block
Coverage
The weakest coverage criteria measured by ATAC are function-entry, function-return, and
function-call. Function-entry coverage ensures that all functions within a program are
called at least once. Function-return coverage ensures that all explicit and implicit returns
or exits from a function are executed at least once. Function-call coverage ensures that each
call to a function is covered at least once. As indicated in Figure 3-1 complete functionreturn coverage usually guarantees complete function-entry coverage, since, a function
usually has at least one return or exit1. Complete function-call coverage does not guarantee
complete function-entry coverage since it is possible to have a function that does not
contain any function calls.
Block coverage ensures that all basic blocks are executed at least once. A basic block is a
sequence of instructions that, except for the last instruction, is free of branches and function
calls. So, the instructions in any basic block are either executed all together, or not at all. In
C and C++, a block may contain more than one statement if no branching occurs between
statements; a statement may contain multiple blocks if branching occurs inside the
statement; an expression may contain multiple blocks if branching is implied within the
expression (e.g., conditional, logical-and, and logical-or expressions). ATAC begins a new
basic block after a function call because it is possible that the function call will not return
(e.g. if exit is called within the function). ATAC provides an option to allow basic blocks
to span function calls.
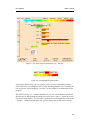
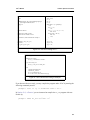
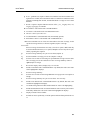
Figure 3-2 presents an example of three distinct blocks, as they are displayed in ATAC’s
character-based interface. Block 1 consists of a logical-expression embedded within a
compound conditional-expression; Block 2 consists of an entire conditional expression;
1. It is possible to create a function with no implicit or explicit return or exit (for example, a function that loops indefinitely until killed by an interrupt signal). In such cases, complete function-return coverage does not guarantee
complete function-entry coverage.
3-4
User’s Manual
ATAC: Overview
Block 3 consists of the entire body of an if-statement. If block coverage is ever less than
100%, then there are program statements that have not been executed by any test. So,
achieving completely adequate block coverage ensures that the entire program is at least
executed. Completely adequate block coverage implies completely adequate function-entry
coverage.
Figure 3-2 An example of three distinct blocks (character-based interface)
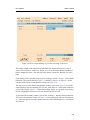
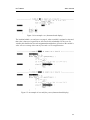
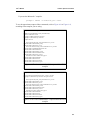
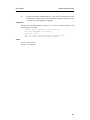
3.3.2 Decision Coverage
Decision coverage ensures that each of the branches within a conditional statement
evaluate to both true and false, at least once. A conditional statement may contain a number
of conditional expressions, each having a true and false decision path passing through it.
Each of these decision paths corresponds to a different testable attribute to be covered. For
example, Figure 3-3 presents two distinct uncovered decisions occurring in the same
expression, as they are displayed by ATAC. The first is covered by developing a test case
that causes c == ' ' to evaluate true, the second by developing a test case causing this
expression to evaluate false.
If a decision is not covered during testing, then an error might not be revealed in the
conditional statement containing the decision. Completely adequate decision coverage
implies completely adequate block coverage, except for programs with no branches
(because there are no decisions to cover).
3-5
User’s Manual
ATAC: Overview
Figure 3-3 An example of true and false decision paths (character-based display)
3.3.3 C-Use, P-use, and coverage criteria All-Uses Coverage
In addition to block and decision coverage, ATAC also provides more advanced c-use, puse and all-uses coverage for C code. These more sophisticated analyses are not available
for C++.
C-use, p-use, and all-uses coverage criteria are based on both the control flow and data flow
of a program. C-use (computational use) coverage ensures that if a variable is defined
(assigned a value) and later used within a computation that is not part of a conditional
expression, at least one path between this def-use pair is executed. Figure 3-4 presents an
example c-use, as displayed by ATAC. Because functions and statements need not define
or use any variables, c-use coverage is not comparable to most of the other coverage
criteria.
P-use (predicate variable use) coverage ensures that if a variable is defined and later used
within a conditional expression, this def-use pair is executed at least once causing the
surrounding decision to evaluate true, and once causing the decision to evaluate false.
Completely adequate p-use coverage implies completely adequate decision coverage,
except when a program contains conditional expressions that do not contain any variables
(e.g., while (getchar() != '\n');).
Figure 3-5 presents two distinct p-uses, as they are displayed by ATAC. Much like decision
coverage, there are true and false execution paths passing through all conditional
expressions involved in p-uses, each path corresponding to a distinct testable attribute.
3-6
ATAC: Overview
User’s Manual
Figure 3-4 An example c-use (character-based display)
The intuition behind c-use and p-use coverage is, when a variable is assigned a value and
that value is later used, a good test set will exercise this relationship. For any use of a
variable, this should occur for each assignment that might have given rise to the variable’s
value. All-uses coverage is the sum of p-use and c-use coverage measures.
Figure 3-5 An example of true and false p-uses (character-based display)
3-7
User’s Manual
3.4
ATAC: Overview
How Does ATAC Work?
Using ATAC focuses on three main activities: instrumenting the software to be tested,
executing software tests, and determining how well the software has been tested.
Instrumentation of the software occurs at compile-time, and ATAC allows large systems to
be instrumented a-piece-at-a-time. Once instrumentation is complete and an executable has
been built, a tester executes tests and uses ATAC to generate reports or display uncovered
source code. The reports reveal the current coverage measures for each criteria, indicating
how adequate the existing test set is and providing a high-level view of progress during
testing. The tester can also display precisely what needs to be covered and develop new
tests to improve the current level of code coverage.
ATAC consists of the following tools: the ATAC compiler (atac cc on UNIX, atacCL or
atacICC on Windows), atac, atactm, and xatac. These are the user-layer components of
ATAC invoked by a tester from the command line. In addition, there are other executables
and a run-time library required by ATAC that are not of general interest to users. An
executable called ataclib (UNIX) or atac_lib (Windows) is invoked by all other ATAC
components when they need to locate the ATAC library. This helps minimize the need for
users to modify their personal computing environment in order to use ATAC.
Figure 3-6 depicts the key inputs and outputs during software instrumentation, test
execution, and coverage analysis. Instrumentation of the software to be tested is performed
by the ATAC compiler. The ATAC compiler replaces the standard compiler, while
accepting all the same command line options. The ATAC compiler supports separate
compilation and can be easily used in conjunction with the make or nmake programs. The
ATAC compiler accepts one or more .c source files as input and, for each, computes its
testable attributes and instruments it to record an execution trace at run-time. The outputs
of the ATAC compiler are a .atac file corresponding to each .c file and an executable
program, a.out. All instrumentation is emitted as source code embedded within the
software to be tested, and then the standard compiler is invoked to generate a.out (an
alternative compiler may be invoked if so desired). Each .atac file acts as a list of all
testable attributes that exist within its corresponding .c file.
Each time a.out is executed, trace information is appended to a corresponding trace file,
a.out.trace. This occurs automatically due to the instrumentation generated by the ATAC
compiler. A tester uses the atac or xatac tool to obtain a high-level measure of test
adequacy, or to view actual source code that still needs to be covered. The trace file and a
list of relevant .atac files are inputs to atac and xatac. ATAC reconciles the information
contained in a.out.trace against all the testable attributes to be covered, as recorded in the
.atac files. Once what has and has not been covered is determined, the results are output in
report or display mode, as appropriate.
The atactm tool manipulates the contents of a trace file. Trace files contain coverage
information for each test that has been executed. Using atactm, a tester can list, rename,
3-8
User’s Manual
ATAC: Overview
Figure 3-6 Key inputs and outputs during program instrumentation, test execution and
coverage analysis
extract, delete, or assign cost to individual tests. ATAC permits the coverage achieved by
arbitrary subsets of tests to be compared and computes minimal size and cost subsets of
tests achieving the same coverage as the entire test set. A tester may use these tools to
manage a test set during testing and later compact it without reducing coverage. This
approach reduces the cost of any regression testing to be performed in the future.
Although ATAC provides a large number of options for varying the form and content of
the information reported, defaults have been chosen so that few options are required to use
the basic features. Complete details of the ATAC commands and options appear later in this
guide.
3.5
What Will Using ATAC Cost You?
Programs compiled with ATAC will execute more slowly and use more memory than they
normally do. The effect on execution time varies among programs depending upon the
nature of the computation and the size of the trace file. Compute-bound processes are more
severely effected than I/O-bound processes. Performance degradation can range from less
than one, to several times the normal execution time. Most programs do not experience
3-9
User’s Manual
ATAC: Overview
severe affects, but, in any case, performance degradation is only present during testing with
ATAC. After testing, the program should be recompiled without ATAC to obtain
maximum execution efficiency. The affect of this is insignificant in most testing
environments. However, in some time dependent applications a change in timing behavior
may effect the execution of the program. There are means of reducing performance
degradation, as discussed in Section 5.1.3, Selectively Instrumenting Software (UNIX) or
Section 5.2.3, Selectively Instrumenting Software (Windows).
Using ATAC will also require additional disk space. This need arises from three sources:
the increased size of the instrumented executable to be tested, the creation of .atac files
during compilation, and the creation of a .trace file during test execution. The instrumented
executable is approximately twice the size of a non-optimized, non-instrumented
executable program. Each .atac file is at least as large as its corresponding .c file. The size
of the .trace file generated during testing is a function of the total number of testable
attributes to be covered and the size of the test set. When trace file compression is used, the
.trace file grows very little unless a test actually improves coverage, in which case its
growth is proportional to what is covered. Omitting trace file compression reduces test
execution time but makes the .trace file grow more quickly, thereby costing additional disk
space. Uncompressed .trace files can become rather large over time.
3.6
How Does ATAC Fit into the Development Process?
ATAC is primarily designed as a tool to support unit testing. That is, ATAC is to be used
by developers in testing individual program units, or integrated collections of program
units, within the development environment. The idea is to test each of the ‘‘software parts’’
that make up a software product because constructing a system out of components that are
thoroughly tested results in a high quality software product.
The view that ATAC is a unit testing tool used by individual developers is largely one of
practicality, but this need not always be the case. All the software components of an entire
product can be instrumented and tested at the same time, if the product is of appropriate
size. Also, some projects might designate a team of one or more individuals to coverage
test all or part of the source code produced by its developers. Typically, it is most efficient
for the author of a piece of software to do the coverage testing. This is because developing
test cases that improve coverage is easier if one is very familiar with the source code under
test. However, there is some flexibility in how ATAC is used to best satisfy the testing
requirements and resource limitations of a given project.
ATAC is not generally perceived as a system testing tool because system test focuses on
verifying the behavior of software features, not on exercising constructs within the source
code. Furthermore, it is likely that a system is too large and/or system testers have
insufficient knowledge of a product’s architecture to effectively perform coverage testing.
3-10
User’s Manual
ATAC: Overview
Nevertheless, if the resources are available, it may be beneficial to instrument all or part of
a product’s source code using ATAC, and then run its system test suite. This provides a
means of determining the overall code coverage of the system test suite.
3-11
User’s Manual
ATAC: Setting Up Your Execution Environment
Chapter 4
ATAC:
Setting Up Your Execution Environment
This chapter discusses how to set up your execution environment in order to use, or modify
the behavior of, ATAC. Section 4.1 provides general information and describes the
environment variables which are common to UNIX and Windows platforms. Section 4.2
describes variables specific to the UNIX environment. Section 4.3 documents variables
specific to Windows users.
4-1
User’s Manual
4.1
ATAC: Setting Up Your Execution Environment
Common Environment Variables
ATAC components make use of a number of environment variables. The role played by
each of these variables and the specific ATAC components that make use of their values
are discussed below.
Some of these variables are set to yes or no. For these variables, off, false, f, n, and, 0 are
equivalent to no; on, true, t, y, and non-zero numbers are equivalent to yes; upper and lower
case are not distinguished.
4.1.1 ATAC_BLOCKONLY
When a test is run, ATAC records data for a number of types of coverage (see Section 3.3,
What Does ATAC Do?). For very large programs it may be necessary to restrict run-time
recording to reduce the execution time and disk space (see Section 3.5, What Will Using
ATAC Cost You?). If ATAC_BLOCKONLY is set to yes at run-time, ATAC will only record
data for block coverage and weaker coverage types. Zero is displayed for other coverage
types. Tests run with this option set can be identified in the atactm -L listing by the B flag
(see. Section 7.1, Listing Test Cases).
4.1.2 ATAC_COMPRESS
In order to save disk space, atac instruments the program under test to compress the
trace file after each test execution. The ATAC_COMPRESS variable may be used to
suppress compression completely or to compress periodically. If ATAC_COMPRESS is set
to no when the program is executed, trace file compression is suppressed. If
ATAC_COMPRESS is set to an integer n, the trace file will be compressed after
approximately every n test executions. A trace file can be explicitly compressed using
atactm, regardless of whether or not ATAC_COMPRESS is set.
4.1.3 ATAC_COST
If ATAC_COST has a numeric value it will be assigned as the execution cost of the test case.
Test case costs are used by ATAC to compute a minimal test set (atac -M) or a cost
effective ordering (atac -S). The default value of ATAC_COST is 100.
4-2
User’s Manual
ATAC: Setting Up Your Execution Environment
4.1.4 ATAC_DIR
By default, trace data is written to a file in the current directory. If ATAC_DIR is set it is
the path name of the directory in which trace data is written. However, if ATAC_TRACE
(see Section 4.1.7, ATAC_TRACE) is set to a fully qualified path name, ATAC_DIR is not
used.
4.1.5 ATAC_TEST
Each program execution results in named test information being appended to the trace file.
The default test name is the base name of the trace file. A numeric suffix is appended to
each test name in order to make it unique (e.g., wordcount.1, wordcount.2, wordcount.3).
If ATAC_TEST is set, its value is used as the test name. The test name must be less than
1024 characters long, composed of alpha-numeric characters, comma, period, at-sign, and
underscore, and must not begin with a digit. Other characters in the test name are replaced
by question mark, except that slash is replaced by colon and hyphen is replaced by the
pound sign.
4.1.6 ATAC_TMP
While a test is running, ATAC stores coverage data in a temporary file. The default
directory on UNIX is the /usr/tmp directory. On Windows, the default is
%SystemRoot%\TEMP for Windows 95, and %SystemDrive%\TEMP for Windows NT.
When ATAC_TMP is set, it is the path of the directory in which the temporary files will be
written. The temporary file is written in append mode. On some systems, appending to a
file on a networked file system is very slow. For this reason, it is recommended that
temporary files be written to a directory on a local disk. Normally, temporary files are
removed when test execution completes. (See Section 4.1.2, ATAC_COMPRESS and
Chapter 7, ATAC: Managing Your Test Cases.)
4.1.7 ATAC_TRACE
By default, trace data is written to a file named prog.trace where prog is the name of the
program executable. If ATAC_TRACE is set, it is the name of the file to which the trace data
will be written. If the name does not end with the .trace suffix, the suffix is appended.
4-3
User’s Manual
4.2
ATAC: Setting Up Your Execution Environment
UNIX Only Environment Information
ATAC components make use of the following additional environment variables on UNIX:
ATAC_NOTRACE, ATAC_SIGNAL, ATAC_TEST_FILE, PATH and TERM. Of these,
only the PATH variable must be set.
On UNIX, all of the variables that are significant at run-time may be set at link time or when
atac_env_create is run (see Section 5.1.4, Linking with ld). The values set at link time
become defaults which may be overridden at run-time.
4.2.1 ATAC_NOTRACE
If ATAC_NOTRACE is set, no trace file is created. This option may be useful when it is
necessary to run an instrumented program without creating a trace file.
4.2.2 ATAC_SIGNAL
Normally, a test case consists of a complete execution of a program. In some situations, a
single program execution may represent multiple test cases. The program can indicate the
start of a new test case by calling atac_restart(). This requires that the code be modified to
include this call, and that the call be removed when ATAC is not used. ATAC_SIGNAL
provides an alternate way of indicating the start of a test case. If ATAC_SIGNAL is set to
a UNIX signal name or number, ATAC will start a new test case each time the specified
signal is received by the program under test. The signal name must be a standard UNIX
signal name (e.g. SIGINT). The SIG prefix is not required and upper and lower case are
not distinguished. The signal number may be any valid signal number for your system.
4.2.3 ATAC_TEST_FILE
If ATAC_TEST is not set and ATAC_TEST_FILE is the name of a readable file, the
contents of the first line of that file is used as the test name. This facility is useful when it
is not possible to vary the value of the ATAC_TEST variable at run-time. In this case the
ATAC_TEST_FILE variable may be set at link-time to the name of a file that may be
modified at run-time to contain the test name.
4-4
User’s Manual
ATAC: Setting Up Your Execution Environment
4.2.4 PATH
When running ATAC component tools or programs compiled with atac, the PATH variable
should include the bin directory containing ATAC component tools (refer to your shell’s
manual entry for more details). The component tools require that ataclib be found in the
PATH search. This permits ATAC user-layer components to locate ATAC library
components, and also permits you to execute each component from the command-line
without having to enter its absolute path name. Programs compiled with atac require that
atactm be found in the PATH search at run-time in order to compress the trace file (see
Section 7.8, Concerning Trace File Compression).
4.2.5 TERM
The atac (character-based) component requires the termcap (or terminfo) entry for the
terminal on which it is to display and highlight source code. This means that, when atac
executes, TERM should be set appropriately for the terminal on which its output is to be
displayed.
4.2.6 ATACLIB
ataclib is the location of the directory containing the Toolsuite library file.
4.2.7 ATAC_UMASK
When a trace file is created, it is given the same read/write permissions as the directory in
which it is created. This is important when multiple processes run by different owners will
be writing to the same trace file, so that the write permissions on the trace file are not
restricted to processes with the same owner as the process that first created the trace file. If
it is necessary to further restrict access to the trace file, the ATAC_UMASK variable may be
set.
4-5
User’s Manual
4.3
ATAC: Setting Up Your Execution Environment
Windows Only Environment Information
The following registry variables can be set from xconfig (see Section B.12, xconfig
(Windows only)). Although there are other variables defined in the Toolsuite registry, these
are installation options and should not be changed by the user.
4.3.1 ATAC_CL
ATAC_CL is the root of the Microsoft Visual C++ directory subtree. ATAC_CL is set
automatically by xconfig at installation or through the ‘‘Find Compiler’’ control on the
xconfig dialog.
4.3.2 ATAC_ICC
ATAC_ICC is the root of the IBM VisualAge directory subtree. ATAC_ICC is set
automatically by xconfig at installation or through the ‘‘Find Compiler’’ control on the
xconfig dialog.
4.3.3 ATAC_LIB
ATAC_LIB is the location of the directory containing the Toolsuite library files.
4.3.4 ATAC_BIN
ATAC_BIN is the location of the directory containing the Toolsuite executables.
4.3.5 ROOT
ROOT is the base directory of the Toolsuite installation.
4-6
User’s Manual
ATAC: Setting Up Your Execution Environment
4.3.6 DEFINE
DEFINE specifies extra default definitions not provided by the cl.exe or icc.exe command
processor for C code. The DEFINE variable contains a semicolon-separated list of
preprocessor definitions. For example, DEFINE=-DWIN32=1;-DX86=TRUE;DFPUBUG=FALSE is a legal format. Default empty.
4.3.7 DEFINEPP
DEFINEPP functions the same as DEFINE only for C++. Default empty.
4.3.8 VERSION
VERSION provides information about the current release of the Toolsuite software, in
terms of its underlying χSuds release number.
4-7
ATAC: Instrumenting Your Software
User’s Manual
Chapter 5
ATAC:
Instrumenting Your Software
Instrumentation of the software to be tested is performed by executing the compile and link
commands with ATAC. ATAC analyzes and instruments code and submits it to the C or
C++ compiler. This chapter discusses how to instrument the software under test with
ATAC. UNIX users should read Section 5.1, Instrumenting on UNIX, Windows users
should proceed to Section 5.2, Instrumenting on Windows
5-1
User’s Manual
5.1
ATAC: Instrumenting Your Software
Instrumenting on UNIX
5.1.1 Basic Instrumentation
To compile with ATAC, remove all previously created object files and executable files you
intend to build. Then compile the software as you normally would, but prefix the compile
command with atac. For example, to compile an executable called wordcount from two
source files wc.c and main.c, enter the following:
prompt:> atac cc -o wordcount wc.c main.c
In addition to creating the executable program wordcount and the object files wc.o and
main.o, ATAC has created the files wc.atac and main.atac. ATAC creates a .atac file for
each .c file it compiles. These files contain static coverage information used in test analysis.
It is possible to restrict instrumentation and the collection of coverage information to
selected source files (see Section 5.1.3, Selectively Instrumenting Software).
5.1.2 Integrating with Makefiles
If your existing Makefiles make use of the CC macro, it is easy to integrate the use of
ATAC with make. When invoking make to build a target, simply redefine CC to be
ATAC, as follows:
prompt:> make CC=”atac cc”
In the case of the wordcount program, the output for a typical Makefile might look like this:
atac cc -c wc.c
atac cc -c main.c
atac cc -o wordcount wc.o main.o
5.1.3 Selectively Instrumenting Software
If you only need coverage measures for a portion of your software contained in selected
source files, it is unnecessary to compile the remaining source files with ATAC. Because
compilation with ATAC increases execution time, memory use, and object code size, (see
5-2
ATAC: Instrumenting Your Software
User’s Manual
Section 3.5, What Will Using ATAC Cost You?) it may be advantageous to use ATAC only
on source files for which coverage measures are required.
You can limit coverage analysis of your software by selectively instrumenting specific
source files. Only those source files that have been compiled with ATAC are instrumented,
and only instrumented portions of the software collect trace information during test
execution. This is accomplished through separate compilation, which ATAC supports in
the same manner as cc. Simply compile all source files to be instrumented with atac cc and
all remaining source files with the standard C compiler, then link the object files. Linking
must be performed by atac cc so that the proper run-time library is included in the
executable. For example, we can manually instrument wc.c and leave main.c untouched by
entering:
prompt:>
prompt:>
prompt:>
prompt:>
rm *.o wordcount
atac cc -c wc.c
cc -c main.c
atac cc -o wordcount wc.o main.o
Alternatively, we can accomplish the same thing using the existing Makefile by doing the
following:
prompt:> make clean
prompt:> make main.o
prompt:> make CC=”atac cc”
Note that it is not possible to selectively instrument functions within a given source file,
except as described in Section 6.7, Improving Execution Speed and Saving Disk Space.
At times you may lose track of which object files or executable files were compiled with
ATAC. The atacid command may be used to identify files compiled with ATAC. For
example, do the following for the wordcount program:
prompt:> atacid wc.o main.o wordcount | fgrep ATAC
If none of the files were compiled with ATAC, no lines are printed.
5.1.4 Linking with ld
The atac cc command invokes ld, the standard UNIX linker, to link the object modules
comprising an executable. If desired, you may explicitly invoke atac ld to customize this
linking step. In this way, object files created with atac cc may be linked with object files
and libraries created by other means.
5-3
ATAC: Instrumenting Your Software
User’s Manual
The command line options for atac ld are the same as for ld. A program linked in this way
outputs trace information to the file a.out.trace, where a.out is the name of the executable
file created by atac ld. If the -o prog option is used to explicitly name the resulting
executable, then the trace file generated is named prog.trace. To compile ATAC-specific
object files prior to its link stage, atac ld invokes cc. After this ATAC-specific
preprocessing has been completed, atac ld then invokes ld to link all object files. The use
of another C compiler may be substituted for the cc command, and the use of another linker
may be substituted for ld.
The following commands compile wc.c using atac cc and main.c using cc. The resulting
object files are then linked to build wordcount:
prompt:> atac cc -c wc.c
prompt:> cc -c main.c
prompt:> atac ld -o wordcount /usr/lib/crt0.o wc.o main.o -lc
It is also possible to generate an ATAC instrumented executable without using a compiler
to do the link.
The explanation is most easily understood by an example. Let us use the same wordcount
program as used before for the illustration. To begin, create a directory, cd to it and copy
the contents of the directory in which the tutorial files are installed into the new directory.
There should be two c files: main.c and wc.c, and a Makefile. You can compile the
wordcount program with atac by entering:
prompt:> make CC=”atac cc”
This is the same as:
prompt:> atac cc
prompt:> atac cc
prompt:> atac cc
-g
-g
-g
-c
-c
-o
wc.c
main.c
wordcount wc.o main.o
However, you are not required to use cc to make the link. Instead of running the third
command above, you can use a link editor such as ld to generate the executable. To do so,
you must first run:
prompt:> atac_env_create
to create an atac environment file (atac_env.o) in the same directory where
atac_env_create is invoked. Then you need to provide the standard C library (-lc), or any
customized C libraries which are essential for your programs. Note that the exact order of
these supporting libraries may vary depending on your environment. In addition, you need
5-4
User’s Manual
ATAC: Instrumenting Your Software
to supply the ATAC run time routine (atac_rt.o) in order for the executable to be able to
collect the execution trace. Given all these, the command you should use looks like:
prompt:> ld -o wordcount wc.o main.o `ataclib`/atac_rt.o
atac_env.o /usr/lib/crt0.o -lc
After a test execution, the trace information is saved in a.out.trace instead of
wordcount.trace unless ATAC_TRACE is set otherwise.
5.1.5 Suppressing Instrumentation of Include Files
In C and C++ programs, source files included with the #include directive may contain
executable code. By default, ATAC instruments executable code in include files unless the
include file came from a system header file. The default definition of a system header file,
in this context, is any include file referenced with a complete path name (starting with a /)
or found in the include search list in a directory with a complete path name whose path
name does not start with the user’s home directory.
Include files that have been instrumented with ATAC will appear in the coverage summary
by source file display. Suppressing instrumentation of selected include files may be
desirable either to improve run-time performance or to remove those files from the
coverage summary by source file. To modify the definition of a system file, edit the file
called $HOME/.atac/cc.ini, where cc is the compile command. If this file does not exist,
copy it from `ataclib`/init/cc.ini, where cc is the compile command. (To make an
installation change, modify the file in `ataclib`/init directly.) If this file does not exist
either, copy from `ataclib`/init/comp.ini, where comp is the name of any similar compiler.
There should be a line in this file that begins with ‘‘INCLUDE=” (If not, add one). The
value of the INCLUDE parameter is a space separated list of include path prefixes where
each path prefix is preceded by -I, -J, or -S. Source files beginning with a prefix preceded
by -I, as well as source files not beginning with any prefix on the list, are treated as user
files and are instrumented. Source files beginning with -J or -S are treated as system files
and are not instrumented. Source files beginning with a prefix preceded by -J are treated as
C include files included into C++ (appropriate extern ‘‘C’’ code is inserted before
compilation).
Modify the INCLUDE parameter to specify -S for the path or path prefix for include files
that you do not want instrumented.
5-5
User’s Manual
ATAC: Instrumenting Your Software
For example:
To augment the initial definition of a system include file to exclude files from directories
/usr/nosho and mynosho, and to exclude any file in the current directory starting with Z you
might use:
INCLUDE=”-S/usr/nosho/ -S./mynosho/ -S./Z -I$HOME -J/usr/include -S/”
It is important to put the -S for files under your home directory before the -I$HOME entry;
otherwise the files would match -I$HOME first and would not be considered system files.
5.2
Instrumenting on Windows
5.2.1 Basic Instrumentation
To compile with ATAC, remove all previously created object files and executable files you
intend to build. Then compile the software as you normally would, prefixing the compile
command with ATAC. These commands are:
If you use the IBM C compiler:
prompt:> atacICC /Fewordcount.exe main.c wc.c
If you use the Microsoft C compiler:
prompt:> atacCL /Fewordcount.exe main.c wc.c
In addition to creating the executable program wordcount.exe and the object files wc.obj
and main.obj, ATAC has created the files wc.atac and main.atac. ATAC creates a .atac file
for each .c file it compiles. These files contain static coverage information used in test
analysis. It is possible to restrict instrumentation and the collection of coverage information
to selected source files (see Section 5.2.3, Selectively Instrumenting Software).
5.2.2 Integrating with Makefiles
If your existing makefiles make use of the a macro specifying a C or C++ compiler, it is
easy to integrate the use of ATAC with nmake. Execute the command in Appendix A-10,
Compiling with atac - IBM compiler if you are using the IBM compiler or Appendix A-11,
5-6
ATAC: Instrumenting Your Software
User’s Manual
Compiling with atac - Microsoft compiler if you are using the Microsoft compiler. The
output associated with these commands is included.
5.2.3 Selectively Instrumenting Software
If you only need coverage measures for a portion of your software contained in selected
source files, it is unnecessary to compile the remaining source files with ATAC. Because
compilation with ATAC increases execution time, memory use, and object code size, (see
Section 3.5, What Will Using ATAC Cost You?) it may be advantageous to use ATAC only
on source files for which coverage measures are required.
You can limit coverage analysis of your software by selectively instrumenting specific
source files. Only those source files that have been compiled with ATAC are instrumented,
and only instrumented portions of the software collect trace information during test
execution. This is accomplished through separate compilation with the installed compiler.
Simply compile all source files to be instrumented by prefixing your compiler with atac
and all remaining source files with your installed C compiler, then link the object files.
Linking must be performed by atacICC or atacCL so that the proper run-time library is
included in the executable. For example, we can manually instrument wc.c and leave
main.c untouched by entering:
If you use the IBM C compiler:
prompt:>
prompt:>
prompt:>
prompt:>
del *.obj wordcount.exe
atacICC /c wc.c
icc /c main.c
atacICC /Fewordcount.exe wc.obj main.obj
If you use the Microsoft C compiler:
prompt:>
prompt:>
prompt:>
prompt:>
del *.obj wordcount.exe
atacCL /c wc.c
cl /c main.c
atacCL /Fewordcount.exe wc.obj main.obj
Alternatively, we can accomplish the same thing using the existing makefiles by first
executing the clean command for your compiler, as found in Appendix A, Platform
Specific Information, then executing the following two commands, as appropriate for your
compiler:
5-7
User’s Manual
ATAC: Instrumenting Your Software
If you use the IBM C compiler:
prompt:> nmake -f makefile_ibm main.obj
prompt:> nmake -f makefile_ibm CC=atacICC wordcount.exe
If you use the Microsoft C compiler:
prompt:> nmake -f makefile_msc main.obj
prompt:> nmake -f makefile_msc CC=atacCL wordcount.exe
Note that it is not possible to selectively instrument functions within a given source file,
except as described in Section 6.7, Improving Execution Speed and Saving Disk Space.
5.2.4 Building Executables with Installed Linkers
It is possible to generate an ATAC instrumented executable without using a compiler
command to do the link.
The explanation is most easily understood by an example. Let us use the same wordcount
program as used before for the illustration. To copy these files, create a new directory, cd
into it, and copy the contents of the directory in which the tutorial files are installed into the
new directory. There should be two c files: main.c and wc.c, and a makefile. You can
compile the wordcount program with atac by executing the nmake command for your
setup, as specified in Appendix A, Platform Specific Information.
This is the same as:
If you use the IBM C compiler:
prompt:> atacICC /c wc.c main.c
prompt:> link /Fewordcount.exe wc.obj main.obj <ataclib>\dllatacrt.lib
If you use the Microsoft C compiler:
prompt:> atacCL /c wc.c main.c
prompt:> link /Fewordcount.exe wc.obj main.obj <ataclib>\dllatacrt.lib
where <ataclib> represents the directory printed by the atac_lib command.
5-8
User’s Manual
ATAC: Instrumenting Your Software
5.2.5 Suppressing Instrumentation of Include Files
In C and C++ programs, source files included with the #include directive may contain
executable code. By default atac instruments executable code in include files unless the
include file comes from a list of partial pathnames contained in the registry. The default list
suppresses header files whose pathnames begin with a disk drive identifier that contains the
current compiler. For example if a compiler is installed in C:\BMCPPW, then any header
files beginning with C: in #include statements will not be instrumented.
Include files that have been instrumented with atac will appear in the coverage summary
by source file display.
Suppressing instrumentation of selected include files may be desirable either to improve
run-time performance or to remove those files from the coverage summary by source file.
The xconfig utility contains an entry named NO_INSTRUMENT that may be modified at
any time. The NO_INSTRUMENT list is a series of partial path names separated by
semicolons. Any pathname of a header file that begins with one of the partial pathnames in
the NO_INSTRUMENT list is not instrumented. Pathnames to suppress are selected by
case-sensitive string matching so upper and lower case entries for the same header file
name may be necessary.
5.3
Common Instrumentation Options
5.3.1 Code Inside Macros
When uncovered testable attributes exist inside a preprocessor macro expansion, ATAC
display components highlight the macro name and arguments within the original source
code. Normally, blocks other than the first block inside a macro expansion are not counted
or displayed. It is assumed that the tester does not expect complete coverage of each macro
at each invocation. These blocks may be counted using the atac -J option.
5.3.2 Marking Code for Selective Reporting
In a program there is often code that is not normally intended to be executed because it
handles unexpected error conditions or it implements unsupported features or debugging
options, etc. By default, ATAC includes this code in coverage displays. If the programmer
5-9
User’s Manual
ATAC: Instrumenting Your Software
does not intend to test this code, coverage displays that include this code may be distracting
and, possibly, misleading.
The programmer may identify this code by inserting a NOTTESTED comment in the code
indicating that it is not to be included in coverage computations. The comment should also
indicate the reason the code does not need to be tested. The recommended format of the
comment is:
/* NOTTESTED: reason */
where reason is one of:
•
unsupported -- The code implements a feature that is not supported and therefore
does not need to be tested.
•
debug -- The code implements debugging aids which are not intended to be used
in the field.
•
logic-error -- The purpose of the code is to report a logic error when reached. The
programmer believes that the conditions for executing this code cannot occur and
therefore it cannot be tested.
•
system-error -- The purpose of the code is to report a system error when reached.
The programmer believes that the conditions for executing this code can only
occur if there is an error in the operating system, or a system library. It therefore
cannot be tested.
•
caller-error -- The purpose of this code is to report an error in the usage of this
function, such as incorrect parameters passed. Since there are no intentional misuses of the function, it is not possible to test this code.
•
data-error -- The purpose of this code is to report invalid data passed by another
part of the system. Since the other parts of the system have been designed to pass
valid data, it is difficult to test this code.
Note that code that tests for user errors, input errors, or common system errors (e.g. write
failed due to disk full) should be tested and should not be identified by the NOTTESTED
comment. In general, code should be marked by the NOTTESTED comment only if an
error in that code will not be considered an error in the system either because the code will
never be executed, or the code will only be executed in a situation where failure is
acceptable.
In addition to the NOTTESTED comment, ATAC supports the NOTREACHED comment
used by the lint program. The NOTREACHED comment is intended to be used for code
that cannot be reached in the flow of the program, e.g. code following a return statement.
5-10
ATAC: Instrumenting Your Software
User’s Manual
The NOTTESTED comment may be inserted anywhere in the code that a comment is
allowed. ATAC will not report coverage for the block containing the comment (or the next
block if the comment is outside any block) nor for any following block that can only be
reached by passing through that block. If the NOTTESTED comment appears outside of
any subroutine, ATAC will not report coverage for the subroutine following the comment.
For example in the program dEcho.c:
/* dEcho program */
int dFlag, dCount;
/* NOTTESTED:debug */
dBug()
{
if (dFlag)
printf(“D: %d\n”, dCount);
}
main(int argc, char *argv[])
{
int i;
for (i = 1; i < argc; ++i) {
++dCount;
if (!strcmp(argv[i], “-d”)) {
dFlag = 1;
}
else printf(“%s ”, argv[i]);
}
putchar(‘\n’);
dBug();
return 0;
}
/* NOTTESTED:debug */
Coverage is not reported for the entire dBug function nor for the dFlag = 1 statement.
The -T option of the atac command may be used to include code marked NOTTESTED in
the coverage computation. The -R option may be used for code marked NOTREACHED.
For example the block coverage on the program above before any tests are run is given by:
prompt:> atac -s -mbT dEcho.atac
% blocks
------------0(0/8)
== total ==
5-11
ATAC: Instrumenting Your Software
User’s Manual
When the -T option is given, blocks marked NOTREACHED are included:
prompt:> atac -s -mb dEcho.atac
% NOTTESTED
----------0(0/4)
% blocks
------------0(0/8)
== total ==
The -mT option of the atac command may be used to include a separate column for
coverage on code marked NOTTESTED. The -mR option of the atac command may be
used for code marked NOTREACHED. For example the NOTREACHED, NOTTESTED,
and other block coverage on the program above before any tests are run is given by:
prompt:> atac -s -mRTb dEcho.atac
% NOTREACHED
------------100(0)
% NOTTESTED
-------------0(0/4)
% blocks
------------0(0/8)
== total ==
The same options may be used to view covered or non-covered code marked NOTTESTED
or NOTREACHED.
These commands may be useful for determining how frequently the NOTTESTED and
NOTREACHED comments have been used, and whether code was executed that was not
expected to be tested.
5.4
Compilation and Link Errors
When a program fails to compile or link with ATAC, check that it compiles and links
without errors using your installed compiler (Refer to Appendix A, Platform Specific
Information for the specific commands to execute.) If the same command line arguments
are used, a program that compiles and links without errors using a standard compiler should
compile and link without errors under ATAC, with the following exceptions:
•
ATAC considers const, enum, signed, void, and volatile to be keywords as required
by the ANSI C standard1. ATAC does not support the use of these keywords as
identifier names.
•
ATAC does not support the ANSI C empty struct/union declaration to clear the
definition of a struct/union tag. These declarations are ignored.
•
ATAC does not support anachronistic C constructs that may be present in programs written before 1977. These constructs, such as =+ instead of += and
int x 6; instead of int x=6;, are still supported by some compilers.
1. American National Standard for Information Systems - Programming Language C, Document Number X3J11.
5-12
User’s Manual
ATAC: Instrumenting Your Software
•
Spaces inside assignment operators such as + = instead of += are not supported
by ATAC.
•
ATAC does not support struct/union member names used in association with a
struct/union in which they were not declared.
•
ATAC may not support extensions to the C language such as in-line assembler
code, syntax variations, etc. (It does support Microsoft and IBM language extensions for C and C++.)
•
Some C compilers do not consider identifier names significant beyond the sixth
character position. ATAC considers the whole name significant. As a result,
ATAC may detect misspelled variable names that are not detected by these compilers.
In most of these cases, ATAC will issue a parse failed message and fail to compile the
program.
After preprocessing and data-flow instrumentation of a source program, ATAC passes the
modified program to the standard C compiler. Errors from the standard C compiler may
indicate an error in ATAC (e.g., during instrumentation) or in the standard C compiler.
A program compiled with ATAC must be linked with ATAC. If linked with the standard
compiler, the linker will issue a message indicating an undefined external symbol named
aTaC43 or _aTaC43 because the required run-time library has not been included in the
executable.
5-13
ATAC: Executing Software Tests
User’s Manual
Chapter 6
ATAC:
Executing Software Tests
When a program that has been compiled with ATAC is executed, in addition to its normal
output, it generates coverage information that is appended to a trace file. The information
within this file is later used by χATAC and ATAC to produce coverage displays and
reports. This chapter discusses how to manipulate the trace file and identifies problems that
might occur during test execution.
6-1
User’s Manual
6.1
ATAC: Executing Software Tests
Naming the Trace File
By default, execution of a program compiled with ATAC creates the trace file prog.trace
in the current directory, where prog is the name of the executable program under test. The
name of this executable is specified to the ATAC compiler using the appropriate commandline option (see Section 5.1.1, Basic Instrumentation (UNIX) or Section 5.2.1, Basic
Instrumentation (Windows)). If left unspecified, the executable created is named a.out and
the trace file is named a.out.trace. If the executable file is later renamed, the name of the
trace file to which it appends information at run-time remains unchanged. However, the
name of this file name can be overridden by setting the ATAC_TRACE environment
variable to the desired trace file name before the next test is executed.
An ATAC trace file name ends with the extension .trace. If this extended name is not
specified and the ATAC_TRACE environment variable is set, .trace will automatically be
appended to the name set in the ATAC_TRACE environment variable. The trace file name
may not begin with a hyphen.
The trace file may be written in a directory other than the current directory by setting the
ATAC_DIR environment variable with a path to the desired directory. ATAC_DIR may be
set to either an absolute or relative path.
6.2
Trace File Compression
When a test case is run on a program instrumented with ATAC, trace information is
collected in a temporary trace file. A reference to this temporary trace file is appended to
the ‘‘master’’ trace file. By default, ATAC compresses the trace file after each test
execution.To save execution time at the expense of some disk space, automatic trace
compression can be disabled by setting the environment variable ATAC_COMPRESS to no
prior to program execution. In addition, the frequency of compression can be set to
approximately every n files by setting the value to an integer, n. To restore automatic trace
compression after each test execution, unset the ATAC_COMPRESS environment variable
or set it to yes. (See Section 4.1.2, ATAC_COMPRESS). It should be noted that the
compressed trace file format used by ATAC is not the same as that used by general purpose
file compression tools.
6.2.1 Forcing Trace File Compression
Whenever the ATAC_COMPRESS environment variable is set to no, it is advisable to
periodically force trace file compression between test executions. This will prevent the
trace file from growing too large.
6-2
User’s Manual
ATAC: Executing Software Tests
In addition, if the nature of a program or a set of tests is such that many executions exit
abnormally (e.g., via receipt of a signal), the trace file may not be compressed prior to
program exit. In this case, trace file compression should periodically be forced even if
ATAC_COMPRESS has not been set.
If invoked with a .trace file as it’s argument, the atactm command performs trace file
compression (see Section 7.8, Concerning Trace File Compression). This offers a simple
way to force trace file compression, regardless of whether or not the ATAC_COMPRESS
environment variable is set. For example, invoking atactm as follows:
prompt:> atactm wordcount.trace
forces the compression of wordcount.trace.
6.3
Temporary Trace Files
The temporary trace file is normally created in the /usr/tmp directory. This can be
overridden by setting the ATAC_TMP environment variable before linking or running the
instrumented program. On some systems performance will suffer if the temporary trace file
is written to an NFS mounted file system.
The temporary trace file will not be incorporated into the master trace file if:
•
The ATAC_COMPRESS environment variable is set to 0 or no.
•
The instrumented program terminates abnormally.
•
The master trace file is locked. The master trace file may be locked for the following reasons:
–
The trace file is being compressed by another program.
–
The trace file is being browsed with the graphical interface.
–
The lock file was not deleted due to a previous abnormal termination of the
graphical interface or the atactm compression tool.
•
There is not enough disk space available to incorporate the temporary trace file into
the master trace file.
•
The temporary trace file is not readable (e.g. the file system is not mounted) at the
time the compression tool is run.
The temporary trace file will be automatically incorporated into the master trace file except
under the conditions listed above.
6-3
User’s Manual
6.4
ATAC: Executing Software Tests
Trace File Locking
A trace file must be locked to prevent concurrent attempts to compress or edit the trace file
(e.g. with atactm) and to permit the graphical interface to process concurrent trace file
changes efficiently.
The lock is a file in the same directory as the trace file with the same name as the trace file
except that the .trace suffix is replaced with .AElock.
If the lock file exists or cannot be created (due to directory permissions), tools that did not
create the lock cannot edit or compress the trace file. In addition, if the graphical interface
cannot create the lock and test cases are still running, the whole trace file will have to be
reread every time the ‘‘Update’’ button is selected.
Normally the lock file is automatically deleted by the tool that created the lock. If the tool
terminates abnormally, the lock file may not be deleted. The lock file may be deleted
manually.
Note that locking is not needed to prevent trace file corruption. If it becomes necessary to
‘‘force’’ a lock, due to apparent failure of it’s owner, the resulting trace may become
incomplete but will not become corrupted.
6.5
Trace File Permission
In the Windows environment, permissions are generally not an issue because of the singleuser nature of the setup. If you are working in a multi-user Windows environment, check
with your system administrator regarding file security. It is notable that the ownership of a
trace file changes to the last user who compressed it.
In the UNIX environment, the master trace file is created with the same read/write
permissions for user/group/other as the directory it is created in. Compression will preserve
the read/write permissions on the trace file.
Temporary trace files are created with the same permissions as the trace file that points to it.
For example, if the directory the trace file is created in is readable and writable by user and
group (0770), the trace file and temporary trace files are created readable and writable by
user and group (0660) when a test is run by anyone in the group. The same trace file may
be appended and/or compressed by anyone in the group.
If the ATAC_UMASK environment variable is set before linking or execution, it should be
set to an octal number from 0 to 0666. The value is used to restrict the permissions on the
6-4
User’s Manual
ATAC: Executing Software Tests
trace file, e.g. if the directory to contain the trace file has permissions 0775 and
ATAC_UMASK is 026 then the trace file is created with permission 0640.
Note that the ownership of the trace file changes to the last one who compressed it. This
shouldn’t matter as long as the permissions for group or other permit reading and writing.
Note also, that if a directory has the ‘‘sticky bit’’ set, files can be deleted from the directory
only by the owner (regardless of file and directory permissions). This bit is often set on
/tmp and /usr/tmp so that people can’t delete each others temporary files even though
everybody can write the directory. If this bit is set on the directory where ATAC is putting
the temporary trace files, and there are multiple users writing to the same trace file, during
compression, some of the temporary trace files will not get deleted. When this happens,
atactm truncates the files to size zero to save disk space and as an indication that the file is
no longer needed.
6.6
Parallel Test Execution
ATAC supports parallel test execution. When multiple instances of a program instrumented
with ATAC are executed in parallel, writing to the same trace file, ATAC will maintain
separate trace data for each in the trace file.
6.7
Improving Execution Speed and Saving Disk Space
Programs compiled under ATAC execute more slowly, require more memory, and occupy
more disk space than when compiled with the standard C compiler (see Section 3.5, What
Will Using ATAC Cost You?). The time required for program execution may be reduced, at
a cost of some disk space, by not compressing the trace file between each test execution. If
automatic trace file compression is turned off, it is advisable to periodically force
compression in order to reduce the size of the trace file (see Section 6.2.1, Forcing Trace
File Compression).
The impact of ATAC on execution speed and disk space may also be reduced by limiting
the scope of coverage analysis to a subset of the source files in the program under test (see
Section 5.1.3, Selectively Instrumenting Software (UNIX) or Section 5.2.3, Selectively
Instrumenting Software (Windows)). Using this approach, normal program performance
only degrades while executing code within the source files compiled with ATAC. Coverage
analysis of an entire software system is obtained by combining the results of executing
identical tests on a number of source file subsets, each selectively instrumented in a
complementary manner.
6-5
User’s Manual
ATAC: Executing Software Tests
If testing is being conducted in a network environment where remote file systems are being
accessed from a file server, execution time may also be reduced by directing the trace file
to a file on a local disk (see Section 6.1, Naming the Trace File). This eliminates network
file access time when writing to the trace file. If ATAC_TMP is set, it should also point to
a directory on a local disk (see Section 4.1.6, ATAC_TMP).
Execution time may also be reduced by restricting the amount of detail in the coverage data.
In particular, if only block coverage data is needed, execution time may be reduced by
setting ATAC_BLOCKONLY to yes (see Section 4.1.1, ATAC_BLOCKONLY).
Under certain circumstances, there may be a section of code for which normal execution
speed is critical, even at the cost of missing coverage data. If these sections are identified,
ATAC will omit instrumentation in them. These sections will be counted as code that has
not been covered. To identify code for which normal execution speed is critical, insert the
word TIMECRITICAL in a comment preceding the section of code. After the section of
code, insert the word NOTTIMECRITICAL in a comment. For example the play_audio
function that follows must copy audio data to the output device as fast as possible to avoid
gaps in the sound.
play_audio(file_in, audio_out)
{
int n;
char *buf[8000];
while (1) {
/* TIMECRITICAL */
while (buf_level(audio_out) < HIGH_WATER){
n = read(file_in, buf,8000);
if (n == 0)
return;
write(audio_out, buf, n);
}
/* NOTTIMECRITICAL */
usleep(100000);
}
}
To omit these sections from the ATAC summary counts and coverage displays, use the atac
-Y option. To count or view only these sections use the atac -mY option.
6-6
User’s Manual
6.8
ATAC: Executing Software Tests
Explaining Run-Time Errors
A program compiled with ATAC should exhibit behavior identical to the same program
compiled with the standard C compiler, with the following exceptions:
•
The program compiled with ATAC will create or append to a trace file (see
Section 6.1, Naming the Trace File).
•
The program compiled with ATAC will execute somewhat more slowly than the
original program. If the program is timing sensitive, this may cause other behavioral differences (see Section 3.5, What Will Using ATAC Cost You? and
Section 6.7, Improving Execution Speed and Saving Disk Space).
•
Programs that appear to behave correctly sometimes contain memory violations
which, by chance, do not interfere with program execution (e.g., accessing unallocated memory locations). When ATAC is used, these violations may begin to interfere with program execution and result in program failure. Conversely, memory
violations that would normally result in program failure may be masked when
using ATAC.
6-7
ATAC: Managing Your Test Cases
User’s Manual
Chapter 7
ATAC:
Managing Your Test Cases
When a program is compiled with ATAC, coverage information is appended to a trace file
each time the resulting executable is tested. This information records the time of test case
execution, what is covered, and the occurrence of any abnormal conditions (e.g., trace file
corruption). This chapter discusses how to manage your test cases by manipulating the
contents of the trace file.
7-1
ATAC: Managing Your Test Cases
User’s Manual
The contents of an ATAC trace file are not in human-readable form. However, the ATAC
trace manager, atactm, can be used to manipulate its contents. Atactm can list, rename,
extract, delete, and assign cost to test cases. Each of these operations can be qualified to
apply to a selective subset of test cases within a trace file. Listing test cases is a display
operation. Renaming, deleting, or assigning cost to tests can either be performed in-place,
effecting the existing trace file, or the results can be directed to a new trace file. Extracting
one or more test cases means to select and copy them to a new trace file. For a synopsis of
atactm usage, see its manual page entry in Appendix B.5, atactm. It should be noted that
some, but not all of the functionalities of atactm are available in χATAC.
7.1
Listing Test Cases
A list of all the tests represented in a given trace file is obtained using the -l or -L commandline options. For example, assuming that four test cases have been executed against the
wordcount program, invoking atactm on wordcount.trace with the -l option:
prompt:> atactm -l wordcount.trace
yields an abbreviated list of, in this case, default test names (see Section 7.3, Naming Test
Cases, for more details):
wordcount.1
wordcount.2
wordcount.3
wordcount.4
Alternatively, invoking atactm on wordcount.trace with the -L option:
prompt:> atactm -L wordcount.trace
yields a longer, more informative, list of test case information:
12/25/97-09:53:45
12/25/97-09:53:50
12/25/97-09:53:57
12/25/97-09:54:02
0:00:01
0:00:01
0:00:00
0:00:00
4.0
4.0
4.0
4.0
100
100
100
100
-------------------------------------
wordcount.1
wordcount.2
wordcount.3
wordcount.4
Using -l can be convenient in conjunction with shell scripts to aid in performing actions on
large numbers of test cases. Using -L provides more information. The test list contains six
or seven columns for each test providing the execution date-time and duration of the test,
the version of ATAC used, a user-assigned test cost (the default is 100), test trace attributes
(---------- for none), the test name, and the uncompressed trace file if applicable.The
significance of test cost is discussed in the Section 7.6, Assigning Cost to Test Cases.
7-2
User’s Manual
ATAC: Managing Your Test Cases
The possible trace attribute values are:
•
B, indicating that the test was run for block coverage data only (see Section 4.1.1,
ATAC_BLOCKONLY)
•
c, indicating that test information has been corrupted
•
C, indicating that the test was started or ended by a call to atac_restart()
•
f, indicating that execution count information is missing
•
F, indicating that the process called fork in uninstrumented code
•
i, indicating that some coverage may have been lost in a signal handler routine due
to interruption of user level code
•
m, indicating that an uncompressed trace file is missing
•
M, indicating that the process ran out of memory during the test
•
N, indicating that the test was started by a call to fork
•
O, indicating that the test ended by calling fork, or that one or more object files
were compiled with an obsolete version of atac
•
r, indicating that the test is apparently still running
•
R, indicating that the test started or ended by receipt of a signal (UNIX only, see
Section 4.2.2, ATAC_SIGNAL)
•
S, indicating that the ATAC runtime routine encountered errors during this test
•
T, indicating that the process could not create a trace file for this test
•
u, indicating that the data for this test has not been compressed
•
V, indicating that one or more object files were compiled with an obsolete version
of atac.
Like the other atactm operations, test cases can be selectively listed by using the -n and -x
command-line options along with the -l or -L options.The use of these options in selecting
specific test cases is discussed in Section 7.2, Selecting Test Cases.
7.2
Selecting Test Cases
Atactm operates on the information within a trace file corresponding to one or more test
cases. The supported operations (e.g., list, rename, delete, etc.) can be performed on all
tests, or selectively, on a subset of the existing tests. This is achieved using the -n option to
select the tests on which the operation is to be applied. For example, assume the same four
tests as listed in Section 7.1, Listing Test Cases, have been executed against the wordcount
program. The first two of these tests are listed by entering:
7-3
ATAC: Managing Your Test Cases
User’s Manual
prompt:> atactm -l -n wordcount.1 -n wordcount.2 wordcount.trace
which results in the following output:
wordcount.1
wordcount.2
Notice that multiple -n arguments may be submitted on a single command-line. In such a
case, the union of all the tests named are selected. Tests can also be named using wild card
characters. These wild cards are the same as those used by the UNIX-like command
processor in naming files (*, ?, [...]). So, entering the appropriate command below:
prompt:> atactm -l -n 'word*.[1-2]' wordcount.trace (UNIX)
or
prompt:> atactm -l -n word*.[1-2] wordcount.trace (Windows)
results in the same listing as the previous example. In some cases, quote marks may be
needed to prevent the shell from expanding the test names as file names.
Sometimes it is necessary to select all tests other than those that have been named. The -x
option is used to select the compliment of all tests specified using one or more instances of
the -n option. For example, entering:
prompt:> atactm -l -x -n 'word*.[1-2]' wordcount.trace (UNIX)
or
prompt:> atactm -l -x -n word*.[1-2] wordcount.trace (Windows)
lists the third and fourth test cases, which were excluded from the output of the previous
examples:
wordcount.3 wordcount.4
7.3
Naming Test Cases
By default, tests are named prog.n, where prog is the base name of the trace file and n is a
number starting at 1. Unique numeric values are appended to all test names so that two tests
never have the same name in a given trace file. See Section 7.1, Listing Test Cases, for an
example listing of default test names.
A test can also be named explicitly by setting the ATAC_TEST environment variable to
the test name prior to execution (see Section 4.1.5, ATAC_TEST). Valid test names consist
of letters, digits, and underscores. As with default test names, a numeric suffix is added to
7-4
ATAC: Managing Your Test Cases
User’s Manual
the name automatically to make it unique (a numeric suffix should not be specified in the
value of ATAC_TEST). For example, testing wordcount by entering:
prompt:> ATAC_TEST=empty wordcount empty (UNIX)
or
prompt:> set ATAC_TEST=empty
prompt:> wordcount empty
(Windows)
results in the creation of a new test case named empty.1, as shown by the -l listing:
wordcount.1 wordcount.2 wordcount.3 wordcount.4 empty.1
7.3.1 Renaming Test Cases
An existing test can be renamed using the -r option of atactm. For example, assume the
wordcount tests wordcount.1 through wordcount.4 are respectively designed to test each of
the legal command-line options for wordcount. These options are -w, -c, -l, and -?. A more
meaningful set of test names can be provided in wordcount.trace by entering the following
series of commands:
prompt:>
prompt:>
prompt:>
prompt:>
atactm
atactm
atactm
atactm
-r
-r
-r
-r
w_option
c_option
l_option
q_option
-n
-n
-n
-n
wordcount.1
wordcount.2
wordcount.3
wordcount.4
wordcount.trace
wordcount.trace
wordcount.trace
wordcount.trace
Now listing the test cases represented in wordcount.trace results in:
w_option.1
c_option
l_option.1
q_option.1
empty.1
The -r option specifies the new test name, while the -n option selects the old test to be
renamed. A group of tests may also be renamed using wild cards, multiple instances of the
-n option, or the -x option to name the old tests (see Section 7.2, Selecting Test Cases, for
more details). For example, to rename the tests from the last example so their names are all
related, enter:
prompt:> atactm -r option_test -n '*_option.*' wordcount.trace (UNIX)
or
prompt:> atactm -r option_test -n *_option.* wordcount.trace (Windows)
7-5
ATAC: Managing Your Test Cases
User’s Manual
Listing the test cases represented in wordcount.trace now results in:
option_test.1
option_test.2
option_test.3
option_test.4
empty.1
Note that, to guarantee uniqueness, a different .n suffix has been appended to the new test
name for each test case. Make sure that only the desired test names match when using wild
cards, otherwise multiple test cases can be unintentionally renamed.
7.3.2 What’s in a Name?
ATAC supports the notion of a test case as a collection of trace information associated with
a single program execution. Furthermore, ATAC provides a set of operations that can be
selectively applied to each test case’s trace information. However, ATAC has no concept
of how a specific test case is intended to test a program, nor does ATAC manage test case
setup, inputs, or outputs.
Test names are what link ATAC trace information with the test plan for a program. It is
important to name test cases so that it is possible to identify what they are designed to test,
what setup is required to make them run, where their inputs and outputs are located, and so
on. While executing tests, the tester should keep track of all the required information and
map it to the appropriate ATAC test names. Descriptive test case names may facilitate this
process. Doing so will help to make tests repeatable and facilitate test set minimization (see
Section 11.2, Test set minimization via a character-based user interface), both of which aid
in regression testing.
7.4
Extracting Test Cases and Merging Trace Files
Test cases can be selectively extracted from an existing trace file and copied to a new trace
file using the -e command-line option. Extracting test cases copies data to a new trace file
without deleting those test cases from the original trace file. For example, trace information
for the test case named wordcount.1 is copied from wordcount.trace and placed in
new.trace by entering:
prompt:> atactm -e -n option_test.1 -o new.trace wordcount.trace
The -n and -o options are required in order to select the test case(s) of interest and specify
their destination. In addition, the -x argument may optionally be used (see Section 7.2,
Selecting Test Cases). Note that, if new.trace already exists, it is overwritten and will now
only contain test case wordcount.1.
7-6
User’s Manual
ATAC: Managing Your Test Cases
Atactm may be used to merge trace files. To merge new.trace and wordcount.trace into
merge.trace enter:
prompt:> atactm -o merge.trace wordcount.trace new.trace
In this case, merge.trace now contains two copies of the first test case: the copy from
wordcount.trace, which is named option_test.1 and the copy from new.trace which has
been renamed option_test.5. Note that tests with the same name are renumbered to insure
that two test cases do not have the same name. If the -o option is omitted, the first trace file
is overwritten by the merged trace file.
7.5
Deleting Test Cases
From time-to-time, it may become necessary to delete trace information corresponding to
specific test executions. This may occur if the program under test is modified (see
Section 7.7, Dealing with Source Code Modifications).
Deleting an entire trace file discards the trace information for all tests whose executions are
recorded in that file. Alternatively, trace information can be selectively discarded by
invoking atactm with the -d command-line option. For example, trace information for the
test case named wordcount.1 is deleted from wordcount.trace by entering:
prompt:> atactm -d -n wordcount.1 wordcount.trace
The -n option is required to select the test case(s) to be deleted, and the -x argument may
optionally be used (see Section 7.2, Selecting Test Cases). Alternatively, the result after
deleting test wordcount.1 from wordcount.trace is placed in new.trace by entering:
prompt:> atactm -d -n wordcount.1 -o new.trace wordcount.trace
When the -o option is used, the trace file wordcount.trace remains unchanged. If new.trace
already exists, it is overwritten and will now contain all test cases in wordcount.trace,
except for wordcount.1.
7.6
Assigning Cost to Test Cases
ATAC associates a cost with each test case. By default, all tests are given an initial cost of
100. However, invoking atactm with the -c command-line option allows the cost of each
test to be selectively reassigned any non-negative value. This value is determined by the
user and should reflect the relative difficulty and expense of executing the test case.
7-7
User’s Manual
ATAC: Managing Your Test Cases
Depending on the nature of the program under test, this may be a function of execution
time, tester time, test setup time, or other factors. For example, assume that a large file
called /etc/termcap is submitted to the wordcount program and this test is named termcap.
Furthermore, assume we regard this test to be twice as expensive to run as the default test
case. We can reassign the cost of termcap as 200 by entering:
prompt:> atactm -c 200 -n termcap wordcount.trace
The -n option is required in order to select the test case(s) of interest. In addition, the -x
argument may optionally be used for selection (see Section 7.2, Selecting Test Cases),
while the -o argument may optionally be used to place the results in a new trace file.
The cost assignments of one or more test cases can be selectively displayed by invoking
atactm using the -L command-line option (see Section 7.1, Listing Test Cases). ATAC uses
these cost assignments to minimize the size of a test set based upon the relative cost and
coverage characteristics of individual test cases (see Section 11.2, Test set minimization via
a character-based user interface).
7.7
Dealing with Source Code Modifications
If a source file is modified while testing is underway, ATAC’s list of what needs to be
covered within the file becomes out-of-date (see Section 3.4, How Does ATAC Work?).
This source file must be recompiled and the program under test relinked using the ATAC
compiler. Furthermore, test cases must be rerun because they may be out-of-date in relation
to the new executable program.
It may not be convenient or cost-effective to repeatedly recompile after each source code
modification. If recompilation is deferred pending additional changes, it is suggested that
you make the modifications to source file copies, rather than the actual files originally
compiled with ATAC. If the originals are modified, ATAC may no longer be able to
display highlighted code fragments correctly. Warning messages signaling this are issued
if an attempt is made to display code fragments within a file modified more recently than
any of its trace information. However, the highlighted code fragments are still displayed in
the event that minor code changes will not misalign the display too much. This permits
coverage testing and display activities to continue prior to recompilation and in the face of
minor source code changes, without copying files or rerunning previous test cases.
When you rebuild the program under test you should delete the old trace file or the affected
tests. If you forget to do this and begin to execute tests, you should either delete all test
cases run prior to the rebuild (see Section 7.5, Deleting Test Cases) or extract all test cases
run since the rebuild and overwrite the trace file (see Section 7.4, Extracting Test Cases and
Merging Trace Files). Otherwise, ATAC tools may output error messages identifying
7-8
User’s Manual
ATAC: Managing Your Test Cases
obsolete test cases. For example, after wordcount source file main.c is substantially
modified and wordcount rebuilt, execution of the command:
prompt:> atac -s -n option_test.1 main.atac wordcount.trace
would result in the following message being printed and no output produced:
error: main.c differs substantially in test option_test.1
(12/24/97-15:25:39) from main.atac (12/25/97-13:04:38)
If the change appears to be inconsequential, the error is reduced to a warning and output is
produced. If the change only affects spaces and comments, no error or warning is issued.
7.8
Concerning Trace File Compression
Trace file compression discards all redundant trace information within a trace file. If two
distinct test cases overlap in terms of coverage, all trace information that redundantly
records this coverage for each test case is consolidated and shared between the tests. This
tends to reduce the size of the trace file. Moreover, if trace file compression is performed
after each test execution, other than a small entry recording that a test has been run, the trace
file only grows if a test case actually improves coverage.
Each time atactm is invoked, if any options other than -l and -L are specified, including no
options, the trace file is automatically compressed. For example, if atactm is invoked on
wordcount.trace as follows, compression will occur:
prompt:> atactm wordcount.trace
This feature is useful, under certain conditions, as a means of forcing trace file compression
(see Section 6.2, Trace File Compression).
7-9
ATAC: Generating Summary Reports
User’s Manual
Chapter 8
ATAC:
Generating Summary Reports
When a program is compiled with atac, a .atac file is generated for each instrumented
source file, and coverage information is appended to a trace file each time the compiled
executable is tested. Each .atac file contains a list of what should be covered when testing
its corresponding source file. The trace file records what has actually been covered during
testing. χATAC uses the same facilities as does ATAC in reporting testing results,
therefore the presentation of summary reports for ATAC and χATAC are merged in this
chapter. This chapter discusses how to generate reports using these files that summarize the
current level of code coverage and what each test case has contributed to this coverage.
Such reports provide a high-level view of how a test is progressing and the relative
contribution of each test case to the software testing effort.
8-1
User’s Manual
ATAC: Generating Summary Reports
The character-based interface, atac, accepts various command-line options, one or more
.atac files, and a trace file as input. atac compares what should be covered in a given source
file to what has been covered and outputs its findings in a variety of ways. The -s commandline option is used to generate summary reports. Additional arguments are used along with
-s to further specify the contents and format of a report. For a synopsis of atac usage, see
its command reference pages in Appendix B.2.
In the graphical interface, χATAC, summary report selections are made by clicking on the
‘‘Summary’’ button in the top button bar and selecting the appropriate coverage option. The
.atac and .trace files may be specified either on the command line or added later during a
χATAC session using the ‘‘File’’ menu.
8.1
Generating Coverage Summaries
To invoke atac in summary generation mode, use the -s command-line option. For
example, assume that the wordcount program discussed in Chapter 2, has been executed
only against the following three tests:
prompt:> wordcount -l empty
prompt:> wordcount -w empty
prompt:> wordcount -c empty
Then a summary of the current level of code coverage is obtained by entering:
prompt:> atac -s main.atac wc.atac wordcount.trace
The summary report generated looks like this:
% blocks
% decisions
% C-Uses
% P-Uses
------------- ------------- ------------- ------------67(34/51)
49(17/35)
51(47/92)
42(13/31)
== total ==
This report indicates that, throughout all source files making up the wordcount program,
67% of all blocks (34 of 51), 49% of all decisions (17 of 35), 51% of all c-uses (47 of 92),
and 42% of all p-uses (13 of 31) have been covered.
The corresponding summary in the graphical interface is obtained by clicking on the
‘‘Summary’’ button in the top button bar and selecting the ‘‘by-type’’ coverage option.
Figure 8-1 shows the resulting display. In any discussion involving χATAC through out
this chapter, we will assume that the three test cases mentioned above have been executed
and χATAC has been invoked using the following command:
prompt:> xatac main.atac wc.atac wordcount.trace
8-2
ATAC: Generating Summary Reports
User’s Manual
Figure 8-1 Coverage summary by-type
Note that χATAC displays the percentages as a bar chart. Each bar is actually made up of
two bars, one contained inside the other. The length of the outer bar represents the
maximum possible (100%) coverage for the corresponding measure and that of the inner
bar represents the actual coverage attained so far for that measure. As the actual coverage
increases, the length of the inner bar increases accordingly.
Both ATAC and χATAC use standard rounding in reporting results except that 100%
coverage and 0% coverage are treated as special cases. No result is ever rounded up to
100% or down to 0%. Also, whereas ATAC rounds percentages to whole numbers, χATAC
rounds them to their first decimal places.
8.2
Selecting What to Summarize
As mentioned earlier, ATAC uses various command-line options to specify the summary
format, and χATAC uses various menus for the same purpose. You can break down the
summary information by file, by function, or by test case.
8-3
ATAC: Generating Summary Reports
User’s Manual
8.2.1 By File
In the character-based interface, a coverage summary broken down by source file is printed
using the -g command-line option. Assuming that the test cases of Section 8.1 have been
executed, a per source file coverage summary for the wordcount program is printed by
entering:
prompt:> atac -sg main.atac wc.atac wordcount.trace
The summary report generated looks like this:
% blocks
------------76(29/38)
38(5/13)
67(34/51)
% decisions
------------70(16/23)
8(1/12)
49(17/35)
% C-Uses
------------53(39/74)
44(8/18)
51(47/92)
% P-Uses
------------69(11/16)
13(2/15)
42(13/31)
source file
------------main.c
wc.c
== total ==
This right most column indicates whether the coverage levels presented correspond to
main.c, wc.c, or the union of all the source files presented. Note that the -g command-line
option cannot be used along with the -f command-line option (see Section 8.2.2, By
Function).
In the graphical interface, a per file summary is obtained by selecting the ‘‘by-file’’
coverage option. Figure 8-2 shows the per file summary after the three tests mentioned
above have been executed. Files listed in the ‘‘Summary’’ window can be sorted in
different ways. Clicking on ‘‘Sort_by’’ in the middle button bar and selecting the ‘‘name’’
entry will sort files by name in alpha-numeric order. The ‘‘num_covered,’’
‘‘percentage_covered,’’ ‘‘num_uncovered,’’ and ‘‘percentage_uncovered’’ entries sort
files by the number or percentage of testable attributes covered or uncovered, respectively,
according to the currently selected coverage type. The entry ‘‘num_total_units’’ sorts files
by the total number of testable attributes with respect to the currently selected coverage
type. The ‘‘default_order’’ selection performs the sort according to the order the .atac files
occurred on the command line; and the entry ‘‘dont_sort’’ preserves the current state of the
sort allowing new information to be appended to the end.
Clicking with the right mouse button on a file label that is currently selected deselects it,
and vice versa. Clicking with the left mouse button on ‘‘Disable’’ and selecting the
‘‘Disable all .h files’’ or ‘‘Disable all source files’’ entry will deselect all .h or source files,
respectively, whereas the ‘‘Enable all .h files’’ or ‘‘Enable all source files’’ entry will reselect all .h or source files, respectively.
In the character-based interface the per-file summary includes information about all four
coverage types; however, in the graphical interface, it includes information only about the
currently selected coverage type. When χATAC is first invoked, block coverage is selected
by default. To see the per-file coverage for another coverage type, e.g., decision coverage,
8-4
ATAC: Generating Summary Reports
User’s Manual
Figure 8-2 Block coverage summary by-file
click on the ‘‘Options’’ button in the top button bar and select the corresponding coverage
entry in the options menu that pops up. Figure 8-3 shows the ‘‘Options’’ menu and
Figure 8-4 shows the per-file decision coverage summary after selecting the ‘‘decision
coverage’’ entry of the options menu.
8.2.2 By Function
A code coverage summary broken down by function is printed using the -f command-line
option in the character-based interface. Assuming that the test cases of Section 8.1 have
been executed, a per function coverage summary for the wordcount program is printed by
entering:
prompt:> atac -sf main.atac wc.atac wordcount.trace
8-5
User’s Manual
ATAC: Generating Summary Reports
Figure 8-3 The Options menu
Figure 8-4 Decision coverage summary by-file
8-6
ATAC: Generating Summary Reports
User’s Manual
The summary report generated looks like this:
% blocks
------------70(21/30)
100(8)
38(5/13)
67(34/51)
% decisions
------------59(10/17)
100(6)
8(1/12)
49(17/35)
% C-Uses
------------50(35/70)
100(4)
44(8/18)
51(47/92)
% P-Uses
------------50(5/10)
100(6)
13(2/15)
42(13/31)
function
------------main
print
count
== total ==
This right most column indicates whether the coverage levels presented correspond to
main, print, count, or the union of all functions presented. Note that the -f command-line
option cannot be used along with the -g command-line option (see Section 8.2.1, By File).
In the graphical interface, the per function coverage summary is obtained by clicking on
the ‘‘Summary’’ button in the top button bar and selecting the ‘‘by-function’’ coverage
option. Figure 8-5 shows an example. Functions listed in the ‘‘Summary’’ window can be
Figure 8-5 Decision coverage summary by-function
sorted in different ways. Clicking on ‘‘Sort_by’’ in the middle button bar and selecting the
‘‘name’’ entry will sort functions by name in alpha-numeric order. The ‘‘num_covered,’’
8-7
ATAC: Generating Summary Reports
User’s Manual
‘‘percentage_covered,’’ ‘‘num_uncovered’’ and ‘‘percentage_uncovered’’ entries sort
functions by the number or percentage of testable attributes covered or uncovered,
respectively, according to the currently selected coverage type. The entry
‘‘num_total_units’’ sorts functions by the total number of testable attributes with respect to
the currently selected coverage type. The ‘‘default_order’’ selection performs the sort
according to the order of .atac files on the command line; and the entry ‘‘dont_sort’’
preserves the current state of the sort, allowing new information to be appended to the end.
Clicking with the right mouse button on a function label that is currently selected deselects
it, and vice versa. Clicking with the left mouse button on ‘‘Disable’’ and selecting the
‘‘Disable all functions’’ entry will deselect all functions, whereas the ‘‘Enable all
functions’’ entry will re-select all functions.
Function names in the ‘‘Summary’’ window can be displayed with or without the
corresponding file name. Clicking with the left mouse button on ‘‘file_name’’ and selecting
the ‘‘include file name’’ entry will have the file name included, whereas the ‘‘exclude file
name’’ entry excludes the file name.
Unlike the character-based interface which includes all coverage types and all functions in
all specified files in the per-function summary display, the graphical interface shows the
coverage statistics only for the currently selected coverage type. As in the case of the perfile summary display, a different coverage type may be selected by choosing the
corresponding entry in the ‘‘Options’’ menu.
8.2.3 By Test Case
In the character-based interface, the -p command-line option may be used along with the
-s option to generate reports that summarize coverage on a per test case basis. Assuming
that the test cases of Section 8.1 have been executed, a per test case coverage summary for
the wordcount program is printed by entering:
prompt:> atac -sp main.atac wc.atac wordcount.trace
The summary report generated looks like this:
% blocks
------------59(30/51)
59(30/51)
59(30/51)
67(34/51)
% decisions
------------34(12/35)
34(12/35)
34(12/35)
49(17/35)
% C-Uses
------------42(39/92)
42(39/92)
42(39/92)
51(47/92)
% P-Uses
------------32(10/31)
32(10/31)
32(10/31)
42(13/31)
test
------------wordcount.1
wordcount.2
wordcount.3
== all ==
This right most column indicates whether the coverage levels presented correspond to
wordcount.1, wordcount.2, wordcount.3, or the union of all test cases presented.
8-8
User’s Manual
ATAC: Generating Summary Reports
In the graphical interface, the per test case summary is obtained by clicking on the
‘‘TestCases’’ button on the top button bar. Figure 8-6 shows the per test case summary
Figure 8-6 Decision coverage summary by test case
after executing the three tests mentioned in Section 8.1. As in the case of per file and per
function display, the per test case display also shows coverages only for the currently
selected coverage type. But unlike the per function display, the per test case display shows
the coverage achieved by each test case over all source files, not just the currently selected
file.
Clicking with the right mouse button on a test case label that is currently selected deselects
it, and vice versa. Clicking with the left mouse button on ‘‘Disable’’ and selecting the
‘‘Disable all tests’’ entry will deselect all tests, whereas the ‘‘Enable all tests’’ entry will
re-select all tests. The entry ‘‘Disable zero coverage tests’’ will disable tests which do not
contribute any coverage with respect to the currently selected coverage type.
Clicking on ‘‘Sort_by’’ in the middle button bar and selecting the ‘‘name’’ entry will sort
tests by name in alpha-numeric order. The ‘‘num_covered’’ entry sorts tests by the number
8-9
ATAC: Generating Summary Reports
User’s Manual
of testable attributes covered with respect to the currently selected coverage type. The entry
‘‘default_order’’ sorts tests according to the order in which they were executed, and the
entry ‘‘dont_sort’’ preserves the current state of the sort, allowing new information to be
appended to the end.
8.3
Restricting Summary Information
It is possible to restrict the information included in a summary by the character-based
interface in many ways. Restrictions are made by controlling the .atac files submitted in the
argument list and using various command-line options. The graphical interface does not
offer any additional facilities for restricting the summary display besides those discussed
in Section 8.2, Selecting What to Summarize. The options discussed within this section may
be used together freely.
8.3.1 By File
The coverage summary generated by atac is limited to those .atac files submitted in the
argument list. For example, the per function summary generated in Section 8.2.2 is limited
to those functions in main.c by entering:
prompt:> atac -sf main.atac wordcount.trace
The summary report generated looks like this:
% blocks
------------70(21/30)
100(8)
76(29/38)
% decisions
------------59(10/17)
100(6)
70(16/23)
% C-Uses
------------50(35/70)
100(4)
53(39/74)
% P-Uses
------------50(5/10)
100(6)
69(11/16)
function
------------main
print
== total ==
8.3.2 By Function
An atac summary is limited to a selected set of functions using the -F command-line
option. For example, the per function summary generated in Section 8.2.2 is limited to the
functions main and count by entering:
prompt:> atac -sf -F main -F count main.atac wc.atac wordcount.trace
8-10
ATAC: Generating Summary Reports
User’s Manual
The summary report generated looks like this:
% blocks
------------70(21/30)
38(5/13)
60(26/43)
% decisions
------------59(10/17)
8(1/12)
38(11/29)
% C-Uses
------------50(35/70)
44(8/18)
49(43/88)
% P-Uses
------------50(5/10)
13(2/15)
28(7/25)
function
------------main
count
== total ==
Note that multiple functions may be specified by repeating the -F option, and functions may
be named using wild card characters. These wild cards are the same as those used by the
UNIX-like command processor in naming files (*, ?, [...]). In some cases, quote marks may
be needed to prevent the command processor from expanding the test names as file names.
8.3.3 By Coverage Criteria
An atac summary is limited to a selected set of coverage measures using the -m {bcdepu}
command-line option. The argument to -m selects one or more coverage measures: e selects
function-entry coverage, b block coverage, d decision coverage, c c-use coverage, p p-use
coverage, and u all-uses coverage (see Section 3.3, What Does ATAC Do?, for an
explanation of these measures). For example, the per function summary generated in
Figure 8-5 is limited to block and decision coverage by entering:
prompt:> atac -sf -mbd main.atac wc.atac wordcount.trace
The summary report generated looks like this:
% blocks
------------70(21/30)
100(8)
38(5/13)
67(34/51)
8.4
% decisions
------------59(10/17)
100(6)
8(1/12)
49(17/35)
function
------------main
print
count
== total ==
Additional Test Case Summaries
As mentioned in Section 8.2.3, in the character-based interface, the -p command-line
option may be used along with the -s option to generate reports that summarize coverage
on a per test case basis. The character-based interface also provides various other ways to
display test case coverage summaries. If you are following the examples in the first three
sections of this chapter, clear out the .trace file by removing it. Then execute the wordcount
program against the following three test cases:
prompt:> wordcount -?
prompt:> wordcount empty
prompt:> wordcount < empty
8-11
ATAC: Generating Summary Reports
User’s Manual
Also assume χATAC is not running and that atactm is used to rename (see Section 7.3,
Naming Test Cases):
prompt:> atactm -n wordcount.1 -r help_test wordcount.trace
prompt:> atactm -n wordcount.2 -r empty_file_test wordcount.trace
prompt:> atactm -n wordcount.3 -r stdin_test wordcount.trace
and assign a cost (see Section 7.6, Assigning Cost to Test Cases) to each of these tests:
prompt:> atactm -n help_test.1 -c 10 wordcount.trace
prompt:> atactm -n empty_file_test.1 -c 20 wordcount.trace
prompt:> atactm -n stdin_test.1 -c 20 wordcount.trace
A per test case code coverage summary is obtained by entering:
prompt:> atac -sp main.atac wc.atac wordcount.trace
The summary report generated looks like this:
% blocks
------------14(7/51)
53(27/51)
37(19/51)
69(35/51)
% decisions
------------11(4/35)
26(9/35)
17(6/35)
40(14/35)
% C-Uses
------------7(6/92)
38(35/92)
18(17/92)
46(42/92)
% P-Uses
------------6(2/31)
32(10/31)
23(7/31)
42(13/31)
test
------------help_test.1
empty_file_test.1
stdin_test.1
== all ==
Additional arguments are available to sort or include other test case information in the
summary (see Section B.2, atac). These arguments may be used together freely.
8.4.1 Including Cumulative Coverage
Cumulative test case coverage is included in a summary using the -q command-line option.
For example, the following generates a cumulative summary of the test cases presented
above:
prompt:> atac -sq main.atac wc.atac wordcount.trace
The summary report generated looks like this:
% blocks
(cumulative)
------------14(7/51)
63(32/51)
69(35/51)
% decisions
(cumulative)
------------11(4/35)
34(12/35)
40(14/35)
% C-Uses
(cumulative)
------------7(6/92)
42(39/92)
46(42/92)
% P-Uses
(cumulative)
------------6(2/31)
35(11/31)
42(13/31)
test
------------help_test.1
empty_file_test.1
stdin_test.1
8-12
ATAC: Generating Summary Reports
User’s Manual
With respect to block coverage, help_test.1 achieved 14 percent coverage,
empty_file_test.1 adds an additional 49 percent coverage (total of 63%) and stdin_test.1
adds another 6 percent coverage (total of 69%). However, these results have been presented
as a cumulative running total. The -q option implies a per test case summary, so the -p
option need not be explicitly included.
8.4.2 Including Test Cost
The user-assigned cost of executing each test case is included in a summary using the -K
command-line option. For example, the following generates a summary of the test cases
presented above, including test cost:
prompt:> atac -sK main.atac wc.atac wordcount.trace
The summary report generated looks like this:
cost
-----10
20
20
50
% blocks
------------14(7/51)
53(27/51)
37(19/51)
69(35/51)
% decisions
------------11(4/35)
26(9/35)
17(6/35)
40(14/35)
% C-Uses
------------7(6/92)
38(35/92)
18(17/92)
46(42/92)
% P-Uses
------------6(2/31)
32(10/31)
23(7/31)
42(13/31)
test
------------help_test.1
empty_file_test.1
stdin_test.1
== al
The -K option implies a per test case summary, so the -p option need not be explicitly
included.
8.4.3 Sorting by Coverage
Test cases are sorted in order of decreasing additional coverage using the -S command-line
option. For example, to sort the test cases summarized above enter:
prompt:> atac -sS main.atac wc.atac wordcount.trace
The summary report generated looks like this:
% blocks
------------53(27/51)
14(7/51)
37(19/51)
69(35/51)
% decisions
------------26(9/35)
11(4/35)
17(6/35)
40(14/35)
% C-Uses
------------38(35/92)
7(6/92)
18(17/92)
46(42/92)
% P-Uses
------------32(10/31)
6(2/31)
23(7/31)
42(13/31)
test
------------empty_file_test.1
help_test.1
stdin_test.1
== all ==
8-13
ATAC: Generating Summary Reports
User’s Manual
These test cases have been listed in order of increasing effectiveness across all coverage
measures. The -S option implies a per test case summary, so the -p option need not be
explicitly included.
The same output can also be obtained in the graphical interface by invoking χRegress,
clicking on the ‘‘Minimize_in’’ button in the middle button bar and selecting
‘‘greedy_order’’ (see Section 11.4, Test set minimization and prioritization via a graphical
user interface).
8.4.4 Sorting by Cumulative Cost per Additional Coverage
Test cases are sorted in order of decreasing cost per additional code coverage using the -Q
command-line option. All costs are presented as cumulative values. For example, to
summarize the sorted cumulative cost per additional coverage for the test cases executed
above enter:
prompt:> atac -sQ main.atac wc.atac wordcount.trace
The summary report generated looks like this:
cost
(cum)
-----20
30
50
% blocks
(cumulative)
------------53(27/51)
63(32/51)
69(35/51)
% decisions
(cumulative)
------------26(9/35)
34(12/35)
40(14/35)
% C-Uses
(cumulative)
------------38(35/92)
42(39/92)
46(42/92)
% P-Uses
(cumulative)
------------32(10/31)
35(11/31)
42(13/31)
test
------------empty_file_test.1
help_test.1
stdin_test.1
This output is similar to that obtained using the -S option, however test cost is also
considered. The -Q option implies a per test case summary, so the -p option need not be
explicitly included. Note that using the -Q option is equivalent to using the option sequence
-qKS.
The same output can also be obtained in the graphical interface by invoking χRegress,
clicking on the ‘‘Minimize_in’’ button in the middle button bar and selecting
‘‘optimal_order’’ (see Section 11.4, Test set minimization and prioritization via a
graphical user interface).
8.5
Ignoring What is Out-of-Date
By default, the character-based interface issues an error message if any of a program’s .atac
files have been significantly modified since a test case represented in its trace file was
executed. Modifications which change only comments and white space in a program do not
8-14
User’s Manual
ATAC: Generating Summary Reports
significantly affect the .atac files. Other changes may affect the structure of a program and
these significantly affect the .atac files. ATAC determines that a test is out-of-date by
comparing the check sums of source files in test cases and .atac files, as appropriate (see
Section 7.7, Dealing with Source Code Modifications). The graphical interface also issues
a warning whenever it detects any test cases to be out-of-date with any source files. It also
marks the out-of-date test cases as an ‘o’ in the test case display.
If a .atac file has been modified since the last test case was executed, you can force the
generation of atac summary reports using the -i command-line option. This will cause atac
to ignore out of date information although warnings may be issued. In general, the -i option
should be used with caution. However, it can be used to avoid re-running tests against
source code known to be unmodified prior to the last system build. The graphical interface,
however, currently does not provide a way to force such a display.
8-15
ATAC: Displaying Uncovered Code
User’s Manual
Chapter 9
ATAC:
Displaying Uncovered Code
When a program is compiled with atac, a .atac file is generated for each instrumented
source file, and coverage information is appended to a trace file each time the compiled
executable is tested. Each .atac file contains a list of what should be covered when testing
its corresponding source file. The trace file records what has actually been covered during
testing. This chapter discusses how to display uncovered source code using these files, a
capability that helps the tester in developing test cases to improve code coverage.
9-1
ATAC: Displaying Uncovered Code
User’s Manual
9.1
Displaying Uncovered Code
ATAC offers two user interfaces: a character-based interface referred to as atac (for
historical reasons), and a graphical interface referred to as χATAC. The former is invoked
using the command, atac, and the latter is invoked with the command, xatac.
The character-based interface, atac, accepts various command-line options that specify
various display selection choices besides accepting one or more .atac and .trace files as
input. atac compares what should be covered in a given source file to what has been
covered and outputs its findings in a variety of ways. Unless invoked in summary report
generation mode (with the -s, -C, -H, -T, or -v command-line options; see Chapter 8, ATAC:
Generating Summary Reports), atac outputs the results of its analysis in the display mode.
Source code fragments are paged across the screen and uncovered testable attributes are
highlighted in reverse video. Additional arguments are used to further specify precisely
which testable attributes are displayed. For a synopsis of atac usage, see its command
reference page in Appendix B.2, atac.
If you are following the tutorial example, clear out the .trace file by removing it. Then
execute the wordcount program against the following four tests:
prompt:>
prompt:>
prompt:>
prompt:>
wordcount
wordcount
wordcount
wordcount
-?
-bad_option
no_such_file
empty
Now all uncovered testable attributes can be displayed using the character-based interface
by entering:
prompt:> atac main.atac wc.atac wordcount.trace
The beginning part of the display generated appears in Figure 9-1. The first line of the
display informs the tester that function-entry coverage has been completely satisfied. This
line is followed by a code fragment highlighting the eight remaining uncovered blocks in
the file main.c followed by some of the remaining uncovered blocks in the file wc.c (recall
that a function call ends a block). Additional information follows in the display, but the
output appears one page at-a-time, so the tester can study it while developing test cases.
In the graphical user interface, χATAC, on the other hand, the display selections are made
by clicking appropriate menus and selecting relevant entries with the help of the mouse.The
.atac and .trace files may be specified either on the command line or added later during a
χATAC session. Refer to Chapter 2, ATAC: A Tutorial for more explanation. Figure 9-2
shows the result of invoking χATAC (after moving a few lines down) using the following
command:
9-2
User’s Manual
ATAC: Displaying Uncovered Code
Figure 9-1 A partial display of all uncovered blocks using the character-based interface
prompt:> xatac main.atac wc.atac wordcount.trace
The source window in the middle displays the source file that corresponds to the first .atac
file on the command line. All covered and uncovered blocks in the file are highlighted in
9-3
User’s Manual
ATAC: Displaying Uncovered Code
Figure 9-2 A partial display of all uncovered blocks using the graphical interface
various colors. Each color represents a certain weight. If, for instance, a block has a weight,
10, it means any test that causes that block to be covered is guaranteed to cover a minimum
of 9 other blocks or decisions as well. χATAC determines these weights by doing a detailed
control flow analysis of the program. White represents zero weight and red represents the
highest weight among all blocks in the file. Thus, if a block is highlighted in white, it means
that it has already been covered by a test case and covering it again will not add new
coverage. If, on the other extreme, a block is highlighted in red, it means that it has not been
covered by any test case so far and covering it first is the most efficient way to add new
coverage to the program; it is the best way to add maximum coverage in a single program
execution.
The color spectrum chart above the source window displays the actual weights associated
with each color. The annotated scroll bar to the left of the source window displays a
thumbnail sketch of the entire file. It is very useful in quickly locating where the red blocks,
or the ‘‘hot spots,’’ in the file are. Clicking with the left mouse button at any spot in the
scroll bar brings the corresponding region of the file into the source window. The arrows
at the top and the bottom of the scroll bar may be used to scroll up or down the source file
9-4
User’s Manual
ATAC: Displaying Uncovered Code
a few lines at a time. Alternatively, the mouse may be dragged up or down the scroll bar
with the left mouse button pressed to rapidly scroll through the file.
Test cases may be run in parallel to a χATAC session. Running a test case causes new
coverage information to be logged to a .trace file. χATAC continuously monitors the
specified trace files to see if any new coverage information has been added to any of them.
If so, it highlights the ‘‘Update’’ button in the top button bar to alert the tester to this fact.
The tester may then choose to click on this button to incorporate the new coverage
information in the display, or wait to do so until several other test cases have been run.
9.2
Selecting What to Display
It is possible to select the uncovered testable attributes to be displayed. In the characterbased interface, selections are made by controlling the .atac files submitted on the
argument list and using various command-line options (the options discussed within this
section may be used together freely). In the graphical user interface, χATAC, as mentioned
earlier, selections are made by selecting appropriate menus and the relevant entries with the
help of the mouse.
9.2.1 By File
The character-based interface only displays the uncovered testable attributes for those .atac
files that are submitted on the argument list. For example, the display generated in Figure 91 may be limited to only one file, main.c, by entering:
prompt:> atac main.atac wordcount.trace
The graphical interface, on the other hand, always displays one source file at a time even
when multiple .atac files are specified on the command line. By default it displays the
source file that corresponds to the first .atac file on the command line, as mentioned earlier.
A different source file may be displayed by clicking on the ‘‘Summary’’ button in the top
button bar and then selecting the ‘‘by-file’’ option. For each .atac file specified on the
command line, χATAC lists the corresponding source file in this window. This list can be
sorted in different ways. Clicking on ‘‘Sort_by’’ in the middle button bar and selecting the
‘‘name’’ entry will sort files by name in alpha-numeric order. The ‘‘num_covered,’’
‘‘percentage_covered,’’ ‘‘num_uncovered,’’ and ‘‘percentage_uncovered’’ entries sort
files by the number or percentage of testable attributes covered or uncovered, respectively,
according to the currently selected coverage type. The entry ‘‘num_total_units’’ sorts files
by the total number of testable attributes with respect to the currently selected coverage
type. The ‘‘default_order’’ selection performs the sort according to the order the .atac files
9-5
User’s Manual
ATAC: Displaying Uncovered Code
occurred on the command line; and the entry ‘‘dont_sort’’ preserves the current state of the
sort allowing new information to be appended to the end.
A new file that is not listed may be added to the summary window and displayed by
clicking on the ‘‘open .atac or source file . . .’’ entry in the ‘‘File’’ menu and specifying
the name of the corresponding .atac file in the dialog box that pops up as shown in Figure 93 (the Windows dialog box looks slightly different).
Figure 9-3 The atac file dialog box
Clicking with the right mouse button on a file label that is currently selected deselects it,
and vice versa. Clicking with the left mouse button on ‘‘Disable’’ and selecting the
‘‘Disable all .h files’’ or ‘‘Disable all source files’’ entry will deselect all .h or source files,
respectively, whereas the ‘‘Enable all .h files’’ or ‘‘Enable all source files’’ entry will reselect all .h or source files, respectively.
9.2.2 By Function
In the character-based interface, display may be limited to uncovered testable attributes
within a selected set of functions using the -F command-line option. For example, the
display generated in Figure 9-1 may be limited to the functions main and count by entering:
prompt:> atac -F main -F count main.atac wc.atac wordcount.trace
Note that multiple functions may be specified by repeating the -F option and these
functions must be defined within the .atac files listed on the command-line. Functions may
be named using wild card characters. These wild cards are the same as those used by the
UNIX-like command processor in naming files (*, ?, [...]). In some cases, quote marks may
9-6
User’s Manual
ATAC: Displaying Uncovered Code
be needed to prevent the command processor from expanding the function names
containing wild cards as file names.
The graphical interface, as mentioned earlier, always displays an entire source file in the
source window that the user can browse through using the scroll bar. Therefore there is no
direct way of limiting the source display to certain functions in the graphical interface.
Selecting the ‘‘by-function’’ option in the ‘‘Summary’’ window and then clicking on a
particular function name, say, main.c:main, makes function main in main.c appear in the
source window. However, this does not prevent another function, print in our case, in
main.c (i.e., main.c:print) from being displayed in the source window even though it may
be hidden due to the size of the source window. Nevertheless, you can still view the
function print by browsing through using the scroll bar.
Functions listed in the ‘‘Summary’’ window can be sorted in different ways. Clicking on
‘‘Sort_by’’ in the middle button bar and selecting the ‘‘name’’ entry will sort functions by
name in alpha-numeric order. The ‘‘num_covered,’’ ‘‘percentage_covered,’’
‘‘num_uncovered’’ and ‘‘percentage_uncovered’’ entries sort functions by the number or
percentage of testable attributes covered or uncovered, respectively, according to the
currently selected coverage type. The entry ‘‘num_total_units’’ sorts functions by the total
number of testable attributes with respect to the currently selected coverage type. The
‘‘default_order’’ selection performs the sort according to the order of .atac files on the
command line; and the entry ‘‘dont_sort’’ preserves the current state of the sort, allowing
new information to be appended to the end.
Clicking with the right mouse button on a function label that is currently selected deselects
it, and vice versa. Clicking with the left mouse button on ‘‘Disable’’ and selecting the
‘‘Disable all functions’’ entry will deselect all functions, whereas the ‘‘Enable all
functions’’ entry will re-select all functions.
Function names in the ‘‘Summary’’ window can be displayed with or without the
corresponding file name. Clicking with the left mouse button on ‘‘file_name’’ and selecting
the ‘‘include file name’’ entry will have the file name included, whereas the ‘‘exclude file
name’’ entry excludes the file name.
9.2.3 By Coverage Criteria
In the character-based interface, display may be limited to uncovered attributes for a
selected set of coverage measure(s) using the -m {bcdepu} command-line option. The
argument to -m selects one or more coverage measures: e selects function-entry coverage,
b block coverage, d decision coverage, c c-use coverage, p p-use coverage, and u all-uses
coverage (see Section 3.3, What Does ATAC Do?, for an explanation of these measures).
9-7
User’s Manual
ATAC: Displaying Uncovered Code
For example, the display generated in Figure 9-1 may be limited to decision coverage in
main.c and wc.c by entering:
prompt:> atac -md main.atac wc.atac wordcount.trace
In χATAC, the desired coverage type may be specified by clicking on the ‘‘Options’’
button in the top button bar and selecting the corresponding coverage type in the top half
of the menu that pops up, as shown in Figure 9-4.
Figure 9-4 The Options menu
9.2.4 By Test Case
By default, atac displays uncovered testable attributes after reconciling all test case trace
information recorded in a given trace file against all .atac files submitted on the commandline. You can display what has not been covered with respect to selected test cases in the
character-based interface by using the -n test_name command-line option. For example,
assume the four tests presented at the beginning of this chapter have been executed against
the wordcount program. Any testable attributes not covered by the first two of these tests
are displayed by entering:
prompt:> atac -n wordcount.1 -n wordcount.2 main.atac wc.atac wordcount.trace
Notice that multiple -n arguments may be submitted on a single command-line. In such a
case, the union of all the tests named is selected. Tests can also be named using wild card
characters. These wild cards are the same as those used by the UNIX-like command
processor in naming files (*, ?, [...]). So, entering:
prompt:> atac -n 'wordcount.[1-2]' main.atac wc.atac wordcount.trace
9-8
User’s Manual
ATAC: Displaying Uncovered Code
results in the same listing as the previous example. In some cases, quote marks may be
needed to prevent the command processor from expanding the test names as file names.
Sometimes it is necessary to select all tests other than those that have been named. The -x
option is used to select the complement of all tests specified using one or more instances of
the -n option. For example, entering:
prompt:> atac -x -n 'wordcount.[1-2]' main.atac wc.atac wordcount.trace
displays any testable attributes not covered by the third and fourth test cases, excluded from
the output in the previous examples.
As in the character-based interface, the graphical interface also takes all test cases into
consideration by default while determining any uncovered testable attributes (see Figure 95). Clicking with the right mouse button on a test case label that is currently selected
Figure 9-5 A test case display
deselects it, and vice versa. Clicking with the left mouse button on ‘‘Disable’’ and selecting
the ‘‘Disable all tests’’ entry will deselect all tests, whereas the ‘‘Enable all tests’’ entry
9-9
User’s Manual
ATAC: Displaying Uncovered Code
will re-select all tests. The entry ‘‘Disable zero coverage tests’’ will disable tests which do
not contribute any coverage with respect to the currently selected coverage type.
Tests listed in the ‘‘TestCases’’ window can be sorted into different orders. Clicking on
‘‘Sort_by’’ in the middle button bar and selecting the ‘‘name’’ entry will sort tests by name
in alpha-numeric order. The ‘‘num_covered’’ entry sorts tests by the number of testable
attributes covered with respect to the currently selected coverage type. The entry
‘‘default_order’’ sorts tests according to the order in which they were executed, and the
entry ‘‘dont_sort’’ preserves the current state of the sort, allowing new information to be
appended to the end.
9.2.5 All Uncovered Testable Attributes
By default, after performing the required analysis, the character-based interface only
displays those uncovered testable attributes that are covered by a weaker measure (see
Section 3.3, What Does ATAC Do?, for a discussion concerning the relative strength of
coverage measures). For instance, suppose the wordcount program contains an uncovered
block that is also part of an uncovered decision. Only the uncovered block will be displayed
by atac, and the uncovered decision will be omitted from its output (because it is a stronger
coverage measure). This is to avoid repeatedly displaying multiple uncovered testable
attributes, each involving the same source code constructs.
You can force the display of all uncovered testable attributes, whether they are covered by
a weaker measure or not, using the -a command-line option. For example, assume the four
tests presented at the beginning of this chapter have been executed against the wordcount
program. Enter the following to force the display of all uncovered testable attributes:
prompt:> atac -a main.atac wc.atac wordcount.trace
The graphical interface, on the other hand, always displays all uncovered testable attributes
whether or not the corresponding weaker measures are covered. This is because, unlike the
character-based interface, χATAC displays all covered and uncovered attributes ‘‘in
place’’ in the source file and ignoring uncovered attributes not covered by a weaker
measure will not reduce the size of the output the user has to scroll through.
9.3
Ignoring What is Out-of-Date
By default, the character-based interface issues an error message if any of a program’s .atac
files have been significantly modified since a test case represented in its trace file was
9-10
User’s Manual
ATAC: Displaying Uncovered Code
executed. See Chapter 8.5, Ignoring What is Out-of-Date for more information about how
ATAC handles these situations.
9.4
Using Underscoring Rather Than Highlighting
The source code fragments output by the character-based interface are larger than the
uncovered testable attributes being displayed. This is to provide the tester with sufficient
context to identify and understand what needs to be covered within the program itself.
Within these source code fragments, atac, by default, identifies the testable attributes of
interest by highlighting them. This approach is convenient for display purposes, but the
output may not be easy to print without capturing screen images.
You can cause the character-based interface to use underscoring, rather than highlighting,
using the -u command-line option. For example, a display similar to that in Figure 9-1,
except using underscoring, is generated by entering:
prompt:> atac -u main.atac wc.atac wordcount.trace > myfile
and then viewing the contents of myfile. The output may also be sent directly to a printer,
allowing easy generation of hard copy coverage displays.
9-11
ATAC: Testing Modified Code
User’s Manual
Chapter 10
ATAC:
Testing Modified Code
For a multiple release software product, testers may be more concerned with whether the
code that has been changed, added or deleted from one release to the next has been properly
tested rather than the overall coverage with respect to a module, a subsystem or the entire
software. They need to either create new tests or select existing regression tests to validate
the modified code in order to make sure the new software still behaves the same way as the
previous version, except where changes are expected. This can be done by first running
atacdiff to find the difference between two releases followed by a coverage analysis on the
generated .dif files and other related .atac and .trace files.
10-1
ATAC: Testing Modified Code
User’s Manual
In this chapter we explain how to test the modified code. The same wordcount program as
used in previous chapters is used here. To copy these files, create a new directory, cd to it,
and copy the contents of the directory in which the tutorial files are installed into the new
directory. For illustration, we will use (1) three c files: main_old.c, main.c and wc.c, (2)
three data files: input1, input2 and input3 and (3) the tests_regress script.
The remainder of this chapter is organized as follows: Section 10.1 describes how to view
the coverage of modified code and Section 10.2 explains how to select existing regression
tests to revalidate the modified code.
10.1 Coverage of Modified Code
To view coverage of modified code only, run atacdiff to create a .dif and open it whenever
the corresponding .atac is used.
When main_old.c is updated to main.c, there is one addition, one deletion and one change
as shown in Figure 10-1. A tutorial for the χDiff tool is presented in Section 16.2.
Figure 10-1 Differences between main_old.c and main.c
10-2
User’s Manual
ATAC: Testing Modified Code
Since all the modification is in main.c, we only need to compile this file with ATAC.
Execute the command appropriate for your setup, as follows:
UNIX:
prompt:> atac cc -c main.c
Windows with IBM C compiler:
prompt:> atacICC /w0 /Q /c main.c
Windows with Microsoft C compiler:
prompt:> atacCL /nologo /w /c main.c
Compile wc.c without ATAC according to your setup:
UNIX:
prompt:> cc -c wc.c
Windows with IBM C compiler:
prompt:> icc /w0 /Q /c wc.c
Windows with Microsoft C compiler:
prompt:> cl /nologo /w /c wc.c
Generate the executable as appropriate for your computing environment:
UNIX:
prompt:> atac cc -o wordcount main.o wc.o
Windows with IBM C compiler:
.
prompt:> atacICC /w0 /Q wc.obj main.obj /Fewordcount.exe
Windows with Microsoft C compiler:
prompt:> atacCL /nologo /w wc.obj main.obj /link /out:wordcount.exe
After the compilation, one .atac file (main.atac for main.c) and the executable
wordcount(.exe) are created. Note one .atac file is created for each instrumented .c file, i.e.,
the .c files compiled with ATAC.
Run the following atacdiff command
prompt:> atacdiff main.c main_old.c
to generate main.dif which contains the differences between main.c and main_old.c. See
Appendix B.6, atacdiff for more details.
10-3
User’s Manual
ATAC: Testing Modified Code
Invoke χATAC with respect to the modified code:
prompt:> xsuds main.atac main.dif
Scroll down the χATAC window until you see what is displayed in Figure 10-2. Only three
Figure 10-2 The initial display of the main χATAC window to show the modifications
between main.c and main_old.c
basic blocks are highlighted as compared to every block in Figure 2-1. To cover these
blocks, we need two tests:
prompt:> wordcount -x input1
and
prompt:> wordcount -wlc input1
If you are not familiar with how to generate tests to effectively increase the code coverage,
please refer to Chapter 2, ATAC: A Tutorial for a detailed discussion.
10-4
User’s Manual
ATAC: Testing Modified Code
Figure 10-3 shows these two tests also give 100% coverage with respect to other metrics.
In fact, the modification from main_old.c to main.c does not involve a modification of any
decision, c-use or p-use.
Figure 10-3 The coverage summary by-type after two test executions
The above example shows how testers, with the help of ATAC, can put their emphasis on
generating tests to cover only the modified code rather than the entire software under test.
10.2 Modification-Based Regression Test Selection
As a program evolves the regression test set grows larger, old tests are rarely discarded, and
the expense of regression testing grows. Repeating all previous test cases in regression
testing after each minor software revision or patch is often impossible because of time
pressures and budget constraints. In this section we explain how to select only those
regression tests that execute the modified code. This includes all tests that have to be used
for revalidation. Hereafter, we refer to such selection as modification-based regression test
selection.
The selection of regression tests is made by using the execution trace files of the old
program. This is because if it is done on the new program, then the whole advantage of
modification-based selection vanishes. Selecting regression tests which execute the deleted
or changed code in the old program is easy, but it requires more work to identify tests that
execute the code added to the new program. One way to do so is to select the tests that
execute the line of code which is just before and after the corresponding position of the
added code in the new release. For example, if code at lines 10 to 15 has been added in
release i’, atacdiff will select line 9 (the one just before) and line 16 (the one just after) in
release i for coverage analysis. In general, such a selection guarantees that if a test case
executes lines 9 and 16 in release i, it also executes lines 10 to 15 in release i’ unless the
10-5
User’s Manual
ATAC: Testing Modified Code
execution in release i’ can jump into or out of the added code without going through lines
9 or 16. In practice, this does not happen often.
Once we have regression tests selected based on their execution of the modified code, we
can go a step further, as discussed in Chapter 11, to apply test set minimization and test case
prioritization to determine which tests, among those necessary, should be reexecuted first,
and which ones have lower priority or are to be omitted from reexecution. For the moment,
let us emphasize modification-based regression test selection using main_old.c and main.c
as examples.
Once again, since all the modification is in main, we only need to compile this file with
atac. However, instead of using main.c as in Section 10.1, main_old.c is used here. Note
that before we compile main_old.c, we need to delete object files generated from the
previous compilation. This can be done by executing the clean command appropriate for
the setup you are using. See Appendix A, Platform Specific Information to determine this.
Compile main_old.c with ATAC by using the appropriate command below:
UNIX:
prompt:> atac cc -c main_old.c
Windows with IBM C compiler:
prompt:> atacICC /w0 /Q /c main_old.c
Windows with Microsoft C compiler:
prompt:> atacCL /nologo /w /c main_old.c
Compile wc.c without ATAC, as appropriate for your computing environment:
UNIX:
prompt:> cc -c wc.c
Windows with IBM C compiler:
prompt:> icc /w0 /Q /c wc.c
Windows with Microsoft C compiler:
prompt:> cl /nologo /w /c wc.c
10-6
ATAC: Testing Modified Code
User’s Manual
Generate the executable, per your setup:
UNIX:
prompt:> atac cc -o wordcount main_old.o wc.o
Windows with IBM C compiler:
prompt:> atacICC /w0 /Q wc.obj main_old.obj /Fewordcount.exe
Windows with Microsoft C compiler:
prompt:> atacCL /nologo /w wc.obj main_old.obj /link /out:wordcount.exe
After the compilation, one .atac file (main_old.atac for main_old.c) and the executable
wordcount(.exe) are created.
Run the following atacdiff command
prompt:> atacdiff main_old.c main.c
to generate main_old.dif which contains the differences between main_old.c and main.c.
Suppose before main_old.c was updated to main.c, all the tests in Figure 11-1 had already
been executed. This can be done by executing the script tests_regress. While the script is
running, you will see some ‘error’ messages because the tests are executing lines of code
designed to handle error conditions.
To find all the regression tests that execute the modified code from main_old.c to main.c,
run the following command:
prompt:> atac -t main_old.atac main_old.dif wordcount.trace
Of the 17 tests, only six are selected as shown in Figure 10-4. This implies a 64.7% savings
% blocks
--------100(2)
50(1/2)
50(1/2)
50(1/2)
50(1/2)
50(1/2)
% decisions
-----------100(0)
100(0)
100(0)
100(0)
100(0)
100(0)
% C-Uses
--------100(0)
100(0)
100(0)
100(0)
100(0)
100(0)
% P-Uses
--------100(0)
100(0)
100(0)
100(0)
100(0)
100(0)
test
------------wordcount.5
wordcount.8
wordcount.10
wordcount.12
wordcount.13
wordcount.14
Figure 10-4 Regression tests that executed the modified code from main_old.c to main.c
in terms of the number of regression tests that need to be reexecuted for program
revalidation.
10-7
PART II
User’s Manual
PART II
χRegress, χVue, χSlice, χProf, χFind & χDiff
User’s Manual
χRegress: A Tool for Effective Regression Testing
Chapter 11
χRegress:
A Tool for Effective Regression Testing
• Do you spend excessive resources in regression testing?
• Do you know how to select effective regression tests?
• Is your regression test suite too large to manage?
The purpose of regression testing is to ensure that changes made to software, such as adding
new features or modifying existing features, do not adversely affect features of the software
that should not change. It is not cost-effective to rerun all the tests in a regression suite; a
method is needed to reduce the testing effort. χRegress is just such a tool which supports
test set minimization and test prioritization. It helps testers identify a representative subset
of tests which should be re-executed to revalidate modified software.
11-1
User’s Manual
χRegress: A Tool for Effective Regression Testing
11.1 Background
No matter how well conceived and tested software is, it will eventually have to be modified
in order to fix bugs or respond to changes in user specifications. Regression testing must
be conducted to confirm that recent program changes have not adversely affected existing
features and new tests must be created to test new features. Testers might rerun all test cases
generated at earlier stages to ensure that the program behaves as expected. However, as a
program evolves the regression test set grows larger, old tests are rarely discarded, and the
expense of regression testing grows. Repeating all previous test cases in regression testing
after each minor software revision or patch is often impossible due to time pressure and
budget constraints. On the other hand, for software revalidation, arbitrarily omitting test
cases used in regression testing is risky. Thus, we need to investigate methods to select
small subsets of effective fault-revealing regression test cases to revalidate software. It is
for this purpose that χRegress, a test set minimization and prioritization tool, was
developed.
χRegress supports test set minimization to reduce the number of test cases contained in a
test set without loss of code coverage. In other words, it minimizes a test set to find a
minimal subset in terms of the number of test cases that preserves the code coverage with
respect to a certain criterion (block, decision, c-use, p-use or all-uses as explained in
Section 3.3, What Does ATAC Do?) of the original test set. χRegress also supports test set
prioritization by sorting tests in increasing order of additional coverage per cost.
For test set minimization, χRegress uses an implicit enumeration algorithm with reductions
to find the optimal subset based on all tests examined. In addition, to determine the exact
minimized subset, χRegress also provides options to select a fast but approximate solution
based on greedy heuristics in case the exact solution is not obtained in reasonable time. For
test set prioritization, χRegress first selects a test case which gives the maximal coverage
with respect to a given criterion per unit cost. Subsequent tests are selected based on their
additional coverage per unit cost.
When testers can only afford to re-execute a few regression tests, they can either use every
test case in the minimized subset for software revalidation or select as many tests as
possible on the basis of test case priority, i.e., starting from the top of the prioritized test
list. The rationale behind these two techniques is the following:
1. The correlation between the fault detection capability of a test set and its code coverage on a program is higher than that between the fault detection capability and
test set size. Insufficient testing such as long hours of test case execution that do
not increase code coverage can lead to an incorrect assessment of program reliability.
2. No matter how a test set is generated, its minimized test sets have a size/effectiveness advantage over the original set in terms of fewer test cases with little or no
compromise in the strength of revealing faults.
11-2
User’s Manual
χRegress: A Tool for Effective Regression Testing
3. In general, a reduced set of tests selected by minimization/prioritization can detect
faults not detected by a reduced set of the same size selected in a random or arbitrary way. Null hypothesis testing indicates that such effectiveness advantage of
minimization/prioritization over randomization does not just happen by chance.
In practice, depending on the available resources, a trade-off between what we can do in
regression testing and what we can afford to do is applied to determine which test, among
those necessary, should be re-executed first, and which one has lower priority or is to be
omitted from re-execution. Our experience suggests that although neither test set
minimization nor prioritization can reduce the cost of testing the current release, it may
significantly reduce the cost of testing future releases of a software system. This savings
arises because less time is spent maintaining, documenting, executing, and evaluating the
output of smaller test sets.
The remainder of this chapter is organized as follows: Section 11.2 describes how to
conduct test set minimization via a character-based user interface, Section 11.3 describes
how to perform test set prioritization via a character-based user interface and Section 11.4
explains how these procedures are executed via a graphical user interface.
11.2 Test set minimization via a character-based user
interface
In this section we explain how test set minimization is done via a character-based user
interface. The same wordcount program as used before is used here. To copy these files,
create a new directory, cd to it, and copy the contents of the directory in which the tutorial
files are installed into the new directory. For the illustrations in this chapter, we will use:
(1) two c files: main.c and wc.c, (2) three data files: input1, input2, and input3, (3) the
Makefile and (4) the tests_regress script. Compile the wordcount program with ATAC.
Refer to Appendix A, Platform Specific Information to determine the correct command to
execute for your setup.
After the compilation, two .atac files (main.atac for main.c and wc.atac for wc.c) and the
executable wordcount(.exe) are created. Note, one .atac file is created for each
instrumented .c file, i.e., the .c files compiled with ATAC.
Now let’s repeat all the tests executed in Chapter 2, ATAC: A Tutorial, and assign costs to
each of these tests, as specified in Section 7.6, Assigning Cost to Test Cases.To save typing,
these commands have been collected in a script file called tests_regress(.bat). Figure 111 lists the commands it executes. First, remove all files with a .trace suffix. Then run the
script by typing tests_regress. While the script is running, you will see some ‘error’
messages because the tests are executing lines of code designed to handle error conditions.
11-3
χRegress: A Tool for Effective Regression Testing
User’s Manual
===== These tests are executed =====
wordcount
wordcount
wordcount
wordcount
wordcount
wordcount
wordcount
wordcount
wordcount
wordcount
wordcount
wordcount
wordcount
wordcount
wordcount
wordcount
wordcount
input1
-x input1
< input1
nosuchfile
-wlc input1
input1 input2
”-?”
-l input1
-w input1
-l < input1
-w < input1
-c < input1
-l nosuchfile
-lx input1
input1 nosuchfile
empty
input3
===== These cost assignments are executed ======
atactm
atactm
atactm
atactm
atactm
atactm
atactm
atactm
atactm
atactm
atactm
atactm
atactm
atactm
atactm
atactm
atactm
-n
-n
-n
-n
-n
-n
-n
-n
-n
-n
-n
-n
-n
-n
-n
-n
-n
wordcount.1
wordcount.2
wordcount.3
wordcount.4
wordcount.5
wordcount.6
wordcount.7
wordcount.8
wordcount.9
wordcount.10
wordcount.11
wordcount.12
wordcount.13
wordcount.14
wordcount.15
wordcount.16
wordcount.17
-c
-c
-c
-c
-c
-c
-c
-c
-c
-c
-c
-c
-c
-c
-c
-c
-c
120
50
20
10
40
60
80
20
10
70
50
50
50
40
60
20
150
wordcount.trace
wordcount.trace
wordcount.trace
wordcount.trace
wordcount.trace
wordcount.trace
wordcount.trace
wordcount.trace
wordcount.trace
wordcount.trace
wordcount.trace
wordcount.trace
wordcount.trace
wordcount.trace
wordcount.trace
wordcount.trace
wordcount.trace
Figure 11-1 Commands executed by the tests_regress script
After the script finishes, run atac with the -q option to print out the cumulative coverage
with respect to each test case. The output of:
prompt:> atac -q main.atac wc.atac wordcount.trace
is in Figure 11-2. From this figure, it is obvious that some tests are redundant in terms of
coverage. A minimal cost subset of these tests which has the same block, decision and alluses coverage as the original set can be obtained by executing the command:
prompt:> atac -Mq main.atac wc.atac wordcount.trace
11-4
χRegress: A Tool for Effective Regression Testing
User’s Manual
% blocks
(cumulative)
------------69(35/51)
80(41/51)
86(44/51)
90(46/51)
100(51)
100(51)
100(51)
100(51)
100(51)
100(51)
100(51)
100(51)
100(51)
100(51)
100(51)
100(51)
100(51)
% decisions
(cumulative)
------------57(20/35)
66(23/35)
71(25/35)
74(26/35)
86(30/35)
89(31/35)
91(32/35)
97(34/35)
100(35)
100(35)
100(35)
100(35)
100(35)
100(35)
100(35)
100(35)
100(35)
% C-Uses
(cumulative)
------------45(41/92)
50(46/92)
53(49/92)
55(51/92)
72(66/92)
80(74/92)
80(74/92)
85(78/92)
87(80/92)
90(83/92)
92(85/92)
93(86/92)
95(87/92)
96(88/92)
97(89/92)
100(92)
100(92)
% P-Uses
(cumulative)
------------71(22/31)
74(23/31)
81(25/31)
84(26/31)
84(26/31)
87(27/31)
87(27/31)
94(29/31)
97(30/31)
97(30/31)
97(30/31)
97(30/31)
97(30/31)
97(30/31)
97(30/31)
97(30/31)
100(31)
test
------------wordcount.1
wordcount.2
wordcount.3
wordcount.4
wordcount.5
wordcount.6
wordcount.7
wordcount.8
wordcount.9
wordcount.10
wordcount.11
wordcount.12
wordcount.13
wordcount.14
wordcount.15
wordcount.16
wordcount.17
Figure 11-2 The cumulative coverage per test case
The output so generated is displayed in Figure 11-3 with tests in order of decreasing added
coverage per unit cost. Since ATAC minimization does not modify the .trace file, for those
tests which are not included in the minimal subset such as wordcount.1, their corresponding
trace information remains in the trace file unless it is deleted explicitly by atactm with the
-d option (see Section 7.5, Deleting Test Cases). After this minimization, test set size is
% blocks
(cumulative)
------------75(38/51)
80(41/51)
84(43/51)
90(46/51)
92(47/51)
92(47/51)
98(50/51)
100(51)
100(51)
100(51)
100(51)
100(51)
100(51)
100(51)
100(51)
100(51)
% decisions
(cumulative)
------------66(23/35)
74(26/35)
77(27/35)
83(29/35)
89(31/35)
91(32/35)
94(33/35)
97(34/35)
97(34/35)
97(34/35)
97(34/35)
97(34/35)
97(34/35)
97(34/35)
100(35)
100(35)
% C-Uses
(cumulative)
------------49(45/92)
66(61/92)
68(63/92)
72(66/92)
76(70/92)
85(78/92)
87(80/92)
90(83/92)
93(86/92)
96(88/92)
97(89/92)
98(90/92)
99(91/92)
100(92)
100(92)
100(92)
% P-Uses
(cumulative)
------------71(22/31)
81(25/31)
84(26/31)
90(28/31)
94(29/31)
97(30/31)
97(30/31)
97(30/31)
97(30/31)
97(30/31)
97(30/31)
97(30/31)
97(30/31)
97(30/31)
97(30/31)
100(31)
test
------------wordcount.9
wordcount.16
wordcount.4
wordcount.3
wordcount.8
wordcount.6
wordcount.14
wordcount.5
wordcount.11
wordcount.12
wordcount.2
wordcount.13
wordcount.15
wordcount.10
wordcount.7
wordcount.17
Figure 11-3 The minimal subset with the same block, decision and all-uses coverage as
the original test set
reduced from 17 to 16. A bigger size reduction can be obtained by doing
11-5
χRegress: A Tool for Effective Regression Testing
User’s Manual
minimization with respect to a different coverage criterion (see Section 11.2.3,
Minimizing by Coverage Criteria).
11.2.1 Forcing Tests to be in the Minimal Set
There are some tests that you always want to be included in the minimal set regardless of
whether they provide additional cost-effective code coverage, such as tests that detect
previously fixed programming faults. You can force the inclusion of such tests in the
minimal set by giving them a cost of 0 using atactm.
11.2.2 Choosing a Reduced Subset after Minimization
In some cases, a cost effective test set need not be minimal. Suppose you only have two
hours to execute some subset of your regression test set; then you would like to execute the
most effective subset during that time. You may wish to make the cost versus effectiveness
trade-off decision yourself. In this case you can run ATAC minimization with the -K option
to print out a cumulative summary of the cost. For example, a cumulative summary as
shown in Figure 11-4 for tests in Figure 11-1 is generated by entering:
prompt:> atac -MKq
cost
(cum)
-----10
30
40
60
80
140
180
220
270
320
370
420
480
550
630
780
% blocks
(cumulative)
------------75(38/51)
80(41/51)
84(43/51)
90(46/51)
92(47/51)
92(47/51)
98(50/51)
100(51)
100(51)
100(51)
100(51)
100(51)
100(51)
100(51)
100(51)
100(51)
main.atac wc.atac wordcount.trace
% decisions
(cumulative)
------------66(23/35)
74(26/35)
77(27/35)
83(29/35)
89(31/35)
91(32/35)
94(33/35)
97(34/35)
97(34/35)
97(34/35)
97(34/35)
97(34/35)
97(34/35)
97(34/35)
100(35)
100(35)
% C-Uses
(cumulative)
------------49(45/92)
66(61/92)
68(63/92)
72(66/92)
76(70/92)
85(78/92)
87(80/92)
90(83/92)
93(86/92)
96(88/92)
97(89/92)
98(90/92)
99(91/92)
100(92)
100(92)
100(92)
% P-Uses
(cumulative)
------------71(22/31)
81(25/31)
84(26/31)
90(28/31)
94(29/31)
97(30/31)
97(30/31)
97(30/31)
97(30/31)
97(30/31)
97(30/31)
97(30/31)
97(30/31)
97(30/31)
97(30/31)
100(31)
test
------------wordcount.9
wordcount.16
wordcount.4
wordcount.3
wordcount.8
wordcount.6
wordcount.14
wordcount.5
wordcount.11
wordcount.12
wordcount.2
wordcount.13
wordcount.15
wordcount.10
wordcount.7
wordcount.17
Figure 11-4 The minimal subset with the same block, decision and all-uses coverage as
the original test set (includes cost)
11-6
χRegress: A Tool for Effective Regression Testing
User’s Manual
From this summary it is easy to identify a subset of the tests that achieve a given level of
coverage at reduced cost. For example, all tests together have cost 780. However, the first
four tests in the minimal set achieve at least 90% block coverage at a total cost of 60, a
fraction of the entire cost of the minimal set.
11.2.3 Minimizing by Coverage Criteria
With the -m{bcdepu} option, ATAC minimization can be limited to computing a minimal
subset for a selected set of coverage measure(s). The argument to -m selects one or more
coverage measures: e selects function-entry coverage, b block coverage, d decision
coverage, c c-use coverage, p p-use coverage, and u all-uses coverage (see Section 3.3,
What Does ATAC Do?, for an explanation of these measures). For example, the minimal
subset generated for tests in Figure 11-1, as shown in Figure 11-5, is limited to block and
decision coverage by entering:
prompt:> atac -Mq -mbd main.atac wc.atac wordcount.trace
In this case, test set size is reduced to from 17 to 6, which corresponds to a major size
reduction.
% blocks
(cumulative)
------------75(38/51)
86(44/51)
94(48/51)
98(50/51)
100(51)
100(51)
% decisions
(cumulative)
------------66(23/35)
77(27/35)
83(29/35)
91(32/35)
97(34/35)
100(35)
test
------------wordcount.9
wordcount.3
wordcount.14
wordcount.15
wordcount.12
wordcount.7
Figure 11-5 The minimal subset with respect to the block and decision coverage
11.2.4 Minimizing by File
ATAC minimization can compute a minimal test set for selected testable attributes found
in the .atac files submitted on its argument list. For example, the minimal test set generated
for tests in Figure 11-1 is limited to blocks, decisions and all-uses found in main.c by
entering:
prompt:> atac -M main.atac wordcount.trace
11-7
χRegress: A Tool for Effective Regression Testing
User’s Manual
The output of this appears in Figure 11-6.
% blocks
------------66(25/38)
24(9/38)
37(14/38)
66(25/38)
58(22/38)
26(10/38)
76(29/38)
47(18/38)
47(18/38)
21(8/38)
37(14/38)
58(22/38)
47(18/38)
18(7/38)
100(38)
% decisions
------------48(11/23)
17(4/23)
22(5/23)
48(11/23)
39(9/23)
22(5/23)
57(13/23)
39(9/23)
39(9/23)
17(4/23)
30(7/23)
39(9/23)
39(9/23)
17(4/23)
100(23)
% C-Uses
------------42(31/74)
11(8/74)
12(9/74)
42(31/74)
46(34/74)
14(10/74)
47(35/74)
20(15/74)
20(15/74)
9(7/74)
19(14/74)
34(25/74)
20(15/74)
8(6/74)
100(74)
% P-Uses
------------50(8/16)
25(4/16)
31(5/16)
50(8/16)
56(9/16)
12(2/16)
50(8/16)
38(6/16)
38(6/16)
12(2/16)
25(4/16)
56(9/16)
38(6/16)
12(2/16)
100(16)
test
------------wordcount.9
wordcount.4
wordcount.3
wordcount.8
wordcount.6
wordcount.14
wordcount.5
wordcount.11
wordcount.12
wordcount.2
wordcount.13
wordcount.15
wordcount.10
wordcount.7
== all ==
Figure 11-6 The minimal subset with respect to main.c
11.2.5 Minimizing by Function
With the -F option, ATAC minimization can be limited to computing a minimal test set for
selected testable attributes found in a selected set of functions. For example, the minimal
test set generated for tests in Figure 11-1 is limited to the functions main and count by
entering:
prompt:> atac -M -F main -F count main.atac wc.atac wordcount.trace
11.2.6 Minimizing by Test Case
By default, ATAC minimization computes a minimal test set after reconciling all test case
trace information recorded in a given .trace file against all .atac files submitted on the
command line. You can compute a minimal test set with respect to selected test cases by
using the -n option. A minimal test set is generated with respect to the block coverage of
the first nine test cases of those in Figure 11-1 by entering:
prompt:> atac -MKq -mb -n ”wordcount.?” main.atac wc.atac wordcount.trace
The output generated is in Figure 11-7.
11-8
χRegress: A Tool for Effective Regression Testing
User’s Manual
cost
(cum)
-----20
30
70
120
% blocks
(cumulative)
------------53(27/51)
65(33/51)
94(48/51)
100(51)
test
------------wordcount.3
wordcount.4
wordcount.5
wordcount.2
Figure 11-7 The minimal subset with respect to wordcount.1 to wordcount.9
Notice that tests can be named by using wild card characters. These wild cards are the same
as those used by the UNIX-like command processor in naming files (*, ?, [...]). In some
cases, quotation marks may be needed to prevent the command processor from expanding
the test names as file names. Also, multiple instances of the -n argument may be submitted
on a single command line. Sometimes it is necessary to select all tests other than those that
have been named. The -x option is used to select the complement of all tests specified using
one or more instances of the -n option. For example, entering:
prompt> atac -MKq -mb -x -n ”wordcount.?” main.atac wc.atac wordcount.trace
computes a minimal test set with respect to block coverage for all tests in Figure 11-1
except the first nine. The generated summary report is displayed in Figure 11-8.
cost
(cum)
-----20
70
110
160
210
% blocks
(cumulative)
------------53(27/51)
86(44/51)
94(48/51)
98(50/51)
100(51)
test
------------wordcount.16
wordcount.11
wordcount.14
wordcount.13
wordcount.12
Figure 11-8 The minimal subset with respect to all tests except wordcount.1 to
wordcount.9
11.3 Test set prioritization via a character-based user
interface
In this section we explain how test set prioritization is performed via a character-based user
interface. To begin, we assume the same main.atac, wc.atac and wordcount.trace as those
in Section 11.2 are used. You can then print out the cumulative cost and coverage of each
test in increasing order per additional coverage by entering:
11-9
χRegress: A Tool for Effective Regression Testing
User’s Manual
prompt:> atac -Q main.atac wc.atac wordcount.trace
The corresponding output is in Figure 11-9. Test wordcount.9 is selected as the first test
because it gives the maximum coverage with respect to block, decision, c-use and p-use per
unit cost. Subsequent tests are selected based on their additional coverage with respect to
these four criteria per unit cost. In our case, wordcount.16 is selected after wordcount.9
because it gives the maximal additional block, decision, c-use and p-use coverage per unit
cost.
cost
(cum)
-----10
30
40
60
80
140
180
220
270
320
370
420
480
550
630
780
900
% blocks
(cumulative)
------------75(38/51)
80(41/51)
84(43/51)
90(46/51)
92(47/51)
92(47/51)
98(50/51)
100(51)
100(51)
100(51)
100(51)
100(51)
100(51)
100(51)
100(51)
100(51)
100(51)
% decisions
(cumulative)
------------66(23/35)
74(26/35)
77(27/35)
83(29/35)
89(31/35)
91(32/35)
94(33/35)
97(34/35)
97(34/35)
97(34/35)
97(34/35)
97(34/35)
97(34/35)
97(34/35)
100(35)
100(35)
100(35)
% C-Uses
(cumulative)
------------49(45/92)
66(61/92)
68(63/92)
72(66/92)
76(70/92)
85(78/92)
87(80/92)
90(83/92)
93(86/92)
96(88/92)
97(89/92)
98(90/92)
99(91/92)
100(92)
100(92)
100(92)
100(92)
% P-Uses
(cumulative)
------------71(22/31)
81(25/31)
84(26/31)
90(28/31)
94(29/31)
97(30/31)
97(30/31)
97(30/31)
97(30/31)
97(30/31)
97(30/31)
97(30/31)
97(30/31)
97(30/31)
97(30/31)
100(31)
100(31)
test
------------wordcount.9
wordcount.16
wordcount.4
wordcount.3
wordcount.8
wordcount.6
wordcount.14
wordcount.5
wordcount.11
wordcount.12
wordcount.2
wordcount.13
wordcount.15
wordcount.10
wordcount.7
wordcount.17
wordcount.1
Figure 11-9 Prioritized tests based on block, decision and all-uses
With the prioritized test list available, we can decide where the cut-off should be. For
example, suppose you want to select a subset of all the tests shown in Figure 11-9 with
maximal possible coverage and a total cost less than 220 for your regression testing. Your
subset should contain tests {9, 16, 4, 3, 8, 6, 14, 5}. On the other hand, if your subset has
to achieve the same block coverage as the original set (100% in this case) and its cost
should be the least, then run the following command:
prompt:> atac -MKq -mb main.atac wc.atac wordcount.trace
to get the minimal set with respect to the block coverage1. The output generated is shown
in Figure 11-10.
1. The option -K can be omitted if you don’t want to include cost as part of the output.
11-10
χRegress: A Tool for Effective Regression Testing
User’s Manual
cost
(cum)
-----20
30
70
110
% blocks
(cumulative)
------------53(27/51)
65(33/51)
94(48/51)
100(51)
test
------------wordcount.3
wordcount.4
wordcount.5
wordcount.14
Figure 11-10 A minimized subset with 100% block coverage
11.4 Test set minimization and prioritization via a graphical user interface
We now repeat test set minimization and prioritization via a graphical user interface using
the same main.atac, wc.atac and wordcount.trace files as those in Section 11.2. Since the
current version of the Toolsuite’s graphical interface does not support all the features
discussed in Section 11.2 and Section 11.3, we will only illustrate those that are supported.
Invoke the graphical interface of the Toolsuite by typing:
prompt:> xsuds main.atac wc.atac wordcount.trace
Then, pull down the ‘‘Tool’’ menu and select the ‘‘xregress’’ option. Click on the
‘‘TestCases’’ button in the top button bar to see the cumulative coverage by test case with
respect to the selected coverage criteria. By default, five criteria -- function-entry, block,
decision, c-use and p-use -- are selected. The resulting window appears in Figure 11-11
with tests listed in the order of decreasing added coverage per unit cost.
Click with the left mouse button on ‘‘function_entry’’, ‘‘decision’’, ‘‘c_use’’ and ‘‘p_use’’
in the middle button bar to deselect these criteria. This makes block coverage the only
selected criterion and updates the test case window accordingly, as shown in Figure 11-12.
A shortcut for this is to click on ‘‘block’’ with the right mouse button which will deselect
every criterion except block.
By default, χRegress is in greedy_order which sorts test cases in order of increasing cost
per additional coverage. You can switch to optimal_order to do the test set minimization
by clicking on the ‘‘Minimize_in’’ button in the middle button bar and selecting
‘‘optimal_order’’. The updated test cases window is displayed in Figure 11-13. The Test
cases frame at the lower-right corner shows ‘‘4 of 17’’ indicating that only the first four
tests (wordcount.3, wordcount.4, wordcount.5 and wordcount.14) are included in the
minimized subset with the same block coverage as the original test set. The same output
can be obtained via the character-based interface by entering the following on the command
line:
11-11
User’s Manual
χRegress: A Tool for Effective Regression Testing
All five coverage
criteria are selected.
Test wordcount.1 does not
improve the overall coverage.
Figure 11-11 Test cases window of χRegress in greedy_order with all five coverage
criterion selected
prompt:> atac -M -mb main.atac wc.atac wordcount.trace
The only difference is that the character-based command only returns tests in the
minimized set and ignores others, whereas the test case window in χRegress lists all tests
including those not in the minimized set.
To quit χRegress click on the ‘‘File’’ button in the top button bar and select ‘‘exit’’.
11-12
User’s Manual
χRegress: A Tool for Effective Regression Testing
Figure 11-12 The updated test case window in greedy_order with only the block
coverage criterion selected
11-13
User’s Manual
χRegress: A Tool for Effective Regression Testing
Figure 11-13 The updated test case window in optimal_order with only the block
coverage criterion selected
11-14
User’s Manual
χVue: A Tool for Effective Software Maintenance
Chapter 12
χVue:
A Tool for Effective Software Maintenance
• Do you need to know where features are implemented?
• Do you spend excess time in resolving maintenance requests?
• Can you visualize features in code?
Maintenance and modification of legacy software systems are the most costly activities in
the life cycle of a long-lived system. Central to this activity are techniques for effectively
finding and modifying code which implements features. The tool, χVue, is tailored to this
need and has a state of the art graphical user interface to allow the maintainer or
programmer to quickly locate code that is associated with features of the system.
12-1
User’s Manual
χVue: A Tool for Effective Software Maintenance
12.1 Background
Ideally, in a well-designed software system each program feature would be implemented
in a single identifiable module; in practice, though, this is never the case. In the early
development stage of a system, programmers may follow certain standards to ensure a clear
mapping between each feature and its corresponding code segments. However, as
development continues, it is likely that such traceability will often become the first casualty
of the pressure to keep a system operational. As a result, program features are implemented
over several non-adjacent subroutines which makes the features more difficult to locate and
understand. Such delocalized programs can lead to serious maintenance errors.
In general, the first step towards software maintenance is to locate the code relevant to a
particular feature. There are two methods of achieving this. First, a systematic approach can
be followed which requires a complete understanding of the program behavior before any
code modification. Second, an as-needed approach can be adopted, which requires only a
partial understanding of the program so as to locate, as quickly as possible, certain code
segments that need to be changed for the desired debugging/enhancement. The systematic
approach provides a good understanding of the existing interactions among program
features, but is often impractical in a real work environment due to the pressures of time
and cost when working with large complicated software systems. On the other hand, the asneeded approach, although less expensive, may ignore some non-local interactions among
the features and cause a program modification to result in disastrous side-effects. Thus, a
need arises to identify those parts of the system that are crucial for the maintainer to
understand. A possible solution is to read the documentation; however, in many cases, this
may not be effective. The documentation may not exist; or even if it exists it may be
incomplete, difficult to comprehend or not updated. Also, programmers/maintainers may
be reluctant to read it. Perhaps a faster and a more efficient way of identifying the important
segments of the code is to let the system speak for itself. It is this issue that the tool, χVue,
attempts to address.
The execution slice-based technique is a solution which helps programmers and
maintainers locate the implementation of different features in a software system. To find,
for example, where the call forwarding feature is implemented in a telephone switching
system, one would run a small, carefully selected, set of tests -- some that invoke the call
forwarding feature and others that do not. Such tests are classified as invoking tests and
excluding tests, respectively. Traces of program execution are analyzed to look for code
components that were executed in the invoking tests but not in the excluding tests.
Although this technique may not find all relevant code that makes up the call forwarding
feature, it does identify a small number of program components that are unique to this
feature. The identified code can then be used as a starting point for studying this feature.
This is especially useful for those features that are implemented in many different modules
in a large, complicated and poorly documented system.
12-2
User’s Manual
χVue: A Tool for Effective Software Maintenance
It is important to note that code segments so identified rely heavily on the test cases used.
Different sets of code may be identified by different sets of invoking and excluding tests.
This implies poorly selected tests will lead to inaccurate identification by either including
components that are not unique to the feature or excluding the ones that should not be
excluded.
There are many ways in which execution traces of invoking and excluding tests may be
compared to identify pieces of code that are related to a given feature, say f. One approach
is to identify code that is executed by any invoking test case but not executed by any
excluding test case. Another approach is to identify program components that are executed
by every invoking test case but not executed by any excluding test case. The latter approach
identifies only those program components that are always executed when feature f is
exhibited but not otherwise. Another, simpler, approach is to compare the execution trace
of just one invoking test with that of one excluding test. To minimize the amount of relevant
code identified, the invoking test selected may be the one with the smallest execution trace
and the excluding test selected may be the one with the largest execution trace. Depending
on how features are implemented in the program, programmers/maintainers may have to
try all these approaches, or construct their own approaches, in order to find the best set of
code related to a given feature.
Ideally, the excluding tests used should be as similar as possible to the invoking tests in
order to filter out as much common code as possible. To illustrate how to select the
invoking and excluding tests, consider the example code in Figure 12-1. Suppose we want
to find the code that is uniquely used to identify an equilateral triangle. We first construct
an invoking test t1 that exhibits this feature and two excluding tests t2 and t3 which assign
isosceles and rectangle, respectively, to class. Clearly, t1 is closer to t2 than t3. The
difference between the execution traces of t1 and t2 shows that only statements s10 and s13
are unique to this feature, whereas additional code such as the statements s3- s7 would also
be identified should t3 be used in place of t2 as the excluding test. Furthermore, this
example also indicates we do not even need to use the feature that identifies a rectangle to
find code that is unique to equilateral triangle. The ability to identify program components
unique to a feature without even knowing all the program’s features greatly enhances the
feasibility of using the execution slice technique to quickly highlight a small number of
program components.
12.2 A Tutorial
The use of χVue is most easily understood by an example. In this chapter we use the same
wordcount program as used in the previous chapters to illustrate how the basic features of
χVue can be used in identifying functional features. To copy these files, create a new
directory, cd to it, and copy the contents of the directory in which the tutorial files are
installed into the new directory.
12-3
χVue: A Tool for Effective Software Maintenance
User’s Manual
s1:
s2:
s3:
s4:
s5:
s6:
s7:
s8:
s9:
s10:
s11:
s12:
s13:
s14:
s15:
s16:
s17:
s18:
s19:
s20:
s21:
s22:
s23:
s24:
s25:
scanf (”%c”, &type);
if (type == triangle) {
scanf (”%d %d %d”, &a, &b, &c);
class = scalene;
if ((a == b) || (b == c))
class = isosceles;
if (a*a == (b*b + c*c))
class = right;
if ((a == b) && (b == c))
class = equilateral;
switch (class) {
case right
: area = b * c / 2.0; break;
case equilateral : area = a * a * sqrt(3.0) / 4.0; break;
default
: s = (a + b + c) / 2.0;
area = sqrt (s * (s-a) * (s-b) * (s-c)); break;
}
} else {
scanf (”%d %d”, &w, &h);
if (w == h)
class = square;
else
class = rectangle;
area = w * h;
}
output (class, area);
Figure 12-1 A simple example
For the illustrations in this chapter, we will use (1) two .c files: main.c and wc.c, (2) three
data files: input1, input2, and input3, and (3) the Makefile. Now you are ready to compile
the wordcount program, with atac, by entering the appropriate make command, as specified
in Appendix A, Platform Specific Information.
After the compilation, two .atac files (main.atac for main.c and wc.atac for wc.c) and the
executable wordcount(.exe) are created. Note one .atac file is created for each instrumented
.c file, i.e., the .c files compiled with atac cc.
Invoke the graphical interface of the Toolsuite by:
prompt:> xsuds main.atac wc.atac
Then, pull down the ‘‘Tool’’ menu and select the ‘‘xvue’’ option. Figure 12-2 shows the
initial main window of χVue.
12-4
χVue: A Tool for Effective Software Maintenance
User’s Manual
Figure 12-2 The initial display of the main χVue window
Let us run the following tests:
prompt:>
prompt:>
prompt:>
prompt:>
prompt:>
wordcount
wordcount
wordcount
wordcount
wordcount
-x input1
-wlc input1
-wl input1
-w input1
nosuchfile
(wordcount.1)
(wordcount.2)
(wordcount.3)
(wordcount.4)
(wordcount.5)
The file input1 contains the following line:
test input file 1
After the execution, a trace file wordcount.trace is created containing the execution
information used in feature analysis.
To tell χVue to incorporate the dynamic information from this trace file into its display,
click with the left mouse button on the ‘‘File’’ button in the top button bar. This will cause
12-5
User’s Manual
χVue: A Tool for Effective Software Maintenance
the ‘‘file’’ menu to pop-up. Click on the ‘‘open trace file...’’ entry in the menu. This will
open a dialog box as shown in Figure 12-3. (The Windows dialog box looks slightly
Figure 12-3 The trace file dialog box for UNIX
different.) Select wordcount.trace and click on the ‘‘Open’’ button. This will cause χVue
to read in the trace file.
To verify this, you can click the left mouse button on the ‘‘TestCases’’ button in the top
button bar. A block coverage summary by test case over all files will be displayed as shown
in Figure 12-4.
Figure 12-4 The coverage summary by test case
Run wordcount again using input2 and input3 with option -c and -l, respectively, by
entering:
12-6
User’s Manual
χVue: A Tool for Effective Software Maintenance
prompt:> wordcount -c < input2
prompt:> wordcount -l input3
(wordcount.6)
(wordcount.7)
Running these two additional tests causes their dynamic information to be added to the
trace file. Note that χVue has highlighted the ‘‘Update’’ button in the top button bar, as
shown in Figure 12-5, to alert you to this fact. χVue continuously monitors the specified
Figure 12-5 The Update button
trace files to see if any new information has been added to them. If so, it highlights the
‘‘Update’’ button to indicate this to you. You may choose to click on this button now to
update the display with the information from the test case you have just run, or you may
choose to wait until you have run several test cases.
Click on the ‘‘Update’’ button to tell χVue to incorporate the information from
wordcount.6 and wordcount.7 into its display. Figure 12-6 shows the updated display.
Now it’s time to specify a feature. Click on the ‘‘Features’’ button in the top button bar to
switch back to the main window of χVue. Click on the ‘‘add’’ button in the middle button
bar to have a feature editing window pop up as shown in Figure 12-7. By default, all seven
tests appear in the dont_know category, which means the user has not yet categorized them.
Suppose the feature we have in mind is wordcount’s character counting feature (i.e., the -c
option). Then we enter the name of the feature, character_counting, in the rectangle
next to Feature Name. Enter the corresponding description, the -c option, in the rectangle
next to Description. Since wordcount.2 and wordcount.6 exhibit the feature, they should be
categorized as invoking tests. To achieve this categorization, select wordcount.2 by
clicking on it with the left mouse button, and then click the left arrow button between
invoking_tests and dont_know. Apply the same procedure on wordcount.6. This will move
wordcount.2 and wordcount.6 from the dont_know category to the invoking_tests category.
12-7
User’s Manual
χVue: A Tool for Effective Software Maintenance
Figure 12-6 The updated coverage summary by test case
Figure 12-7 The initial display of the feature editing window
Tests wordcount.3, 4 and 7 do not involve this feature. Thus, they should be categorized as
excluding tests. To achieve this categorization, select wordcount.3 by clicking on it with
the left mouse button and then with the right arrow button between excluding_tests and
dont_know. Apply the same procedure on wordcount.4 and wordcount.7. This will move
wordcount.3, 4 and 7 from the dont_know category to the excluding_tests category. For
tests wordcount.1 and wordcount.5, suppose we don’t care. Hence, they remain in the
dont_know category. Figure 12-8 shows the resulting display. If all the information is
12-8
User’s Manual
χVue: A Tool for Effective Software Maintenance
Figure 12-8 The final display of the feature editing window
correct, click on the ‘‘ok’’ button to close this editing window. This will update the main
χVue window as shown in Figure 12-9.
Figure 12-9 The updated display of the main χVue window
If you make any mistake assigning a feature, you can select the feature to be modified
(character_counting in our case) by first clicking on it and then on the ‘‘edit’’ button in the
middle button bar. An editing window will be displayed (that is the same as Figure 12-8 in
our case) for your editing. You may now move tests from one category to another using the
techniques described earlier. After you are done, click on the ‘‘ok’’ button, thereby closing
the editing window and automatically updating the main χVue window to reflect the latest
modification. Since there is no mistake involved in our case, instead of clicking on ‘‘ok’’,
you can click on the ‘‘cancel’’ button which closes the editing window without changing
the display of the main χVue window.
You can save the present feature description in a file by clicking on the ‘‘save_as’’ button
in the middle button bar. This will cause a dialog box to appear as shown in Figure 12-10.
(The dialog box on Windows looks slightly different.) Enter wc as the name of the file in
12-9
User’s Manual
χVue: A Tool for Effective Software Maintenance
Figure 12-10 The save_as dialog box for UNIX
the rectangle next to the label File name and click on the ‘‘Save’’ button. A file named
wc.features is created in your working directory containing all the feature descriptions you
have entered. (The file extension .features is appended automatically by χVue.) Once you
have saved your feature description in a file, you can update it by simply clicking on the
‘‘save’’ button in the middle button bar. χVue will reuse the last selected file name and
overwrite it with the latest feature descriptions.
To delete a feature, select it by clicking on it, (character_counting in our case) and click
on the ‘‘delete’’ button in the middle button bar. A dialog box as shown in Figure 12-11
will appear. If you wanted to confirm the deletion, you would click on the ‘‘yes’’ button.
This would cause the selected feature to be deleted and the main χVue window to be
updated accordingly. Since we do not want to delete the feature, click on the ‘‘cancel’’
Figure 12-11 The feature deletion dialog box
button to close the dialog box and return to the main window of χVue as displayed in
Figure 12-9.
To use features that were previously saved in another feature file, click on the ‘‘open’’
button in the middle button bar. This will cause a dialog box to pop up as shown in
Figure 12-12. (The dialog box for Windows looks slightly different.) You would select the
file which contains the feature(s) to be imported and then click on the ‘‘Open’’ button to
have them displayed in the main window of χVue. In our case, there is no need to do so
12-10
User’s Manual
χVue: A Tool for Effective Software Maintenance
Figure 12-12 The feature open dialog box for UNIX
because the feature (character_counting) is already displayed. So, click on the ‘‘Cancel’’
button to close the dialog box and return to the main window of χVue as displayed in
Figure 12-9.
The next step is to answer the question: ‘‘Where in wordcount is feature
character_counting (i.e., the -c option) implemented?’’ To look for program components
that are uniquely related to character counting, first select this feature by clicking on
character_counting under the ‘‘Feature Name’’ button and click on the ‘‘heuristics’’
button in the middle button bar. This will cause a heuristics window to appear as shown in
Figure 12-13.
χVue provides three heuristics. By default, heuristic A is selected. With this heuristic (see
Figure 12-13) program components that are executed by any invoking test (wordcount.2
and wordcount.6 in our case), but not executed by any excluding test (wordcount.3,
wordcount.4 and wordcount.7 in our case), are identified. In other words, program
components that are in the union of wordcount.2 and 6, but not in the union of wordcount3,
4 and 7, are identified.
You can switch to heuristic B or heuristic C as shown in Figure 12-14, by clicking on the
corresponding button with the left mouse button. With heuristic B, program components
that are commonly executed by all invoking tests (wordcount.2 and wordcount.6 in our
case), but not any excluding test (wordcount.3, wordcount.4 and wordcount.7 in our case),
are identified. In other words, program components that are in the intersection of
wordcount.2 and 6, but not in the union of wordcount.3, 4 and 7, are identified. With
heuristic C, program components that are executed by the smallest invoking test
(wordcount.6 in our case), but not by the largest excluding test (wordcount.3 in our case),
are identified.
Instead of using the default heuristic, let us use heuristic B for the purposes of this tutorial.
Click on the ‘‘heuristic B’’ button. Click on the ‘‘find_code’’ button towards the bottom of
12-11
User’s Manual
χVue: A Tool for Effective Software Maintenance
Figure 12-13 Heuristics window with heuristic A selected
the heuristics window to close it and have a summary by file displayed in the main χVue
window as shown in Figure 12-15. You can have the summary displayed in other formats
by clicking on the ‘‘by-type’’ or the ‘‘by-function’’ button in the middle button bar. To see
the source display of the corresponding file, click on a file name in this summary window.
In our case, we can only select main.c since wc.c does not have blocks that ‘‘seem to be
unique’’ to the character_counting feature, the feature for which we are looking.
The source code of main.c is displayed in Figure 12-16. The scroll bar is a thumbnail
sketch of the entire file indicating there are two red spots. Clicking with the left mouse
button at any spot in the scroll bar brings the corresponding region of the file into the source
window. You can use the arrows at the top or the bottom of the scroll bar to scroll up or
down the source file a few lines at a time. You can also drag the mouse up or down the scroll
bar with the left mouse button pressed to rapidly scroll up or down the file. In addition,
χVue also provides keyboard shortcuts. Pressing the Up or Down arrow key will move the
file up or down one line at a time. The PageUp and PageDown keys scroll up and down the
file one page at a time, respectively. The Home key scrolls to the beginning of the file,
whereas the End key goes to the end of the file.
The display in Figure 12-16 shows the resulting code after the first red spot is selected.
Analysis of the code reveals that all the highlighted blocks are indeed ‘‘unique’’ to the
character_counting feature (the -c option).
12-12
User’s Manual
χVue: A Tool for Effective Software Maintenance
Figure 12-14 Heuristics window with heuristic B selected
Figure 12-15 A summary by-file over all selected test cases
Similarly, you can view the feature at the decision, c-use or p-use level by selecting the
corresponding criterion from the ‘‘Options’’ menu as shown in Figure 12-17. For example,
the decisions in main.c that are unique to character_counting are shown in Figure 12-18.
For each highlight, χVue can further indicate which branch of it is uniquely related to a
given feature. In our case it is the true but not the false branch of dochar that is unique to
character_counting.
12-13
User’s Manual
χVue: A Tool for Effective Software Maintenance
Blocks in red are unique
to character_counting.
Figure 12-16 Blocks in main.c that are unique to character_counting
Figure 12-17 The Options menu
12-14
User’s Manual
χVue: A Tool for Effective Software Maintenance
The true branch of dochar
is unique to character_counting.
Figure 12-18 Decisions in main.c that are unique to character_counting
You can make your own customized heuristic by moving tests around as shown in
Figure 12-19. In this case, program components that are executed by wordcount.2 but not
wordcount.3 are identified. Recall that test wordcount.2 is:
prompt:> wordcount -wlc input1
(an invoking test)
and test wordcount.3 is
prompt:> wordcount -wl input1
(an excluding test)
This heuristic follows the strategy discussed in Section 12.1, Background by selecting an
invoking test (wordcount.2) and an excluding test (wordcount.3) which have very similar
execution traces. In fact, the only difference between these two tests is that one executes
the -c option and the other does not. Unique code so selected is the same as that selected by
heuristic B.
12-15
User’s Manual
χVue: A Tool for Effective Software Maintenance
Figure 12-19 Heuristics window with a custom heuristic selected
In some situations, the highlighted code may be a super set of the unique code with respect
to a certain feature. Nevertheless, code so selected provides a good starting point for
mapping features to program components at different levels of granularity.
To quit χVue, click on the ‘‘File’’ button in the top button bar, then click on the ‘‘exit’’
entry of the menu that pops up.
Since you have already run several tests and saved the information in wordcount.trace and
wordcount.features, the next time you invoke χVue you can use the command:
prompt:> xsuds main.atac wc.atac wordcount.trace \
wordcount.features
to import them directly as command line arguments instead of loading them interactively
through the graphical interface.
12-16
User’s Manual
χSlice: A Tool for Dynamic Program Debugging
Chapter 13
χSlice:
A Tool for Program Debugging
• Do you know how to locate bugs quickly?
• Do you spend too much time finding faults in your program?
• Can you narrow down bugs to files, then functions, then lines of code?
χSlice is the program debugger in the Toolsuite. It automates many tedious tasks that
developers otherwise must perform manually while debugging their code. χSlice helps
developers to focus on just the relevant code by eliminating the typical conceptual clutter
of debugging. It makes the relevant pieces of the code stand out in no time with its
intelligent analysis and state-of-the-art graphical interface.
13-1
User’s Manual
χSlice: A Tool for Dynamic Program Debugging
13.1 Background
In this section we describe an execution slicing tool, χSlice, and show the usefulness of
slicing in locating program faults.
In general, program slicing can be categorized as static slicing and dynamic slicing. A static
slice is a set of statements of a program which might affect the value of a particular output
or the value of a variable instance; whereas a dynamic slice is the set of statements which
did affect the value of the output upon execution of a particular input. A dynamic slice with
respect to the output variables gives us the statements that are not only executed but also
have an impact on the program output under that test case. Although both static and
dynamic slices can be used as an abstraction to help programmers in locating faults, a static
slice is less effective because it, in general, requires that a larger portion of program code
be examined than does a dynamic slice.
Collecting dynamic slices may consume excessive time and file space. χSlice computes an
execution slice instead. An execution slice is the set of statements executed under a test
case. Since not every statement that is executed under a test case has an effect on the
program output for that test case, some statements in an execution slice may not be in the
corresponding dynamic slice. This makes an execution slice a super set of a dynamic slice.
Based on execution slices, χSlice also computes an execution dice which is the set
difference of two execution slices. In χSlice, an execution slice is the set of a program’s
blocks, decisions, c-uses or p-uses executed by a test input. Similarly, an execution dice is
the set of blocks, decisions, c-uses or p-uses in one execution slice which do not appear in
the other execution slice.
The strategy for fault localization in χSlice is as follows. Suppose a piece of software has
worked successfully for some time, so many error-free test cases are available. Then a
problem is reported from the field with a new test case that exhibits a failure. The fault will
be in the execution slice of the new test that exhibits the failure. It seems likely that the fault
is not in the execution slices of the similar tests that do not exhibit the failure. We refer to
the error-free test cases as successful tests and those that cause a failure as failed tests. A
good starting point for locating the fault is to look at code that is in the failed execution slice
but not in the successful ones, i.e., the execution dice obtained by subtracting the successful
execution slices from the failed execution slice. Code in the resulting dice is highlighted in
red as the most likely location of the fault. Code in the failed execution slice but not in the
dice is highlighted in a different color with its likelihood of containing the fault inversely
proportional to the number of successful tests which also execute it.
Execution dices obtained depend on the test cases used. Different dices may be generated
by different sets of successful and failed tests. In order to have the best results one should
try to identify successful tests that are as similar as possible to the failed tests in order to
filter out as much irrelevant code as possible.
13-2
χSlice: A Tool for Dynamic Program Debugging
User’s Manual
13.2 A Tutorial
The use of χSlice is most easily understood by an example. In this section we use the same
wordcount program as used before to illustrate how the basic features of χSlice can be used
in locating program faults. To copy these files, create a new directory, cd to it, and copy the
contents of the directory in which the tutorial files are installed into the new directory. For
the illustrations in this chapter, we will use (1) three c files: main_err.c, main.c and wc.c,
(2) three data files: input1, input2, and input3 and (3) a Makefile. The file main_err.c is an
erroneous version of main.c with a fault which is to be found. Follow the instructions in
Appendix A, Platform Specific Information to compile wordcount without atac using
main.c; delete the object files; and compile wc_err with atac using main_err.c.
After the compilation, two .atac files (main_err.atac for main_err.c and wc.atac for wc.c)
and two executables wordcount(.exe) and wc_err(.exe) are created. Note, one .atac file is
created for each instrumented .c file, i.e., the .c files compiled with the ATAC compiler.
To find where the fault is, we need some successful tests and some tests that fail. Let us run
wc_err on the first test:
(wc_err.1)
prompt:> wc_err input1
This should produce the following output:
1
1
4
4
19
19
input1
total
Repeat the same test with wordcount. The same output is generated which implies that test
wc_err.1 does not distinguish the behavior of wc_err from that of wordcount. Hence, it is
a successful test.
We now run the second test on wc_err by entering:
prompt:> wc_err -w input1
(wc_err.2)
The output looks like:
4
4
input1
total
This is the same as that obtained from executing:
prompt:> wordcount -w input1
This implies that test wc_err.2 is another successful test.
13-3
χSlice: A Tool for Dynamic Program Debugging
User’s Manual
Let us run another test by:
prompt:> wc_err -w <input1
(wc_err.3)
An output with an empty line is generated. Executed on wordcount, the same test produces
the following output:
4
This output differs from that generated by wc_err indicating test wc_err.3 is a failed test.
So far, we have run three tests. On two of them wc_err and wordcount produce the same
outputs, whereas on the third test different outputs are observed.
Next, we invoke the graphical user interface of the Toolsuite by entering the following
command:
prompt:> xsuds main_err.atac wc.atac wc_err.trace
Then pull down the ‘‘Tool’’ menu and select the ‘‘xslice’’ option. Figure 13-1 shows the
main window of χSlice.
Click on the ‘‘TestCases’’ button in the top button bar to get the test case window of χSlice.
Mark wc_err.1 and wc_err.2 as successful tests by clicking on the leftmost square next to
them. A check sign appears in the square. In addition, wc_err.1 and wc_err.2 are
highlighted in green. Similarly, you can mark wc_err.3 as a failed test by clicking on the
square immediately to the left of wc_err.3. An X sign appears in the square and wc_err.3
is highlighted in red. The resulting test case window appears in Figure 13-2.
Click on ‘‘Summary’’ in the top button bar to have a summary by file displayed in the main
χSlice window as shown in Figure 13-3. To see the source display of the corresponding
file, click on a file name in this summary window. You can have the summary displayed in
other formats by clicking on the ‘‘by-type’’ or the ‘‘by-function’’ button in the middle button
bar. To continue with this tutorial, be sure ‘‘by-file’’ is selected.
As discussed in Section 13.1, code in the execution dice is highlighted in red as the most
likely location of the fault. Code in the failed execution slice but not in the dice is
highlighted in a different color with its likelihood of containing the fault inversely
proportional to the number of successful tests which also execute it. In our case, code in red
with the highest priority 3 is executed by the failed test (wc_err.3) but not the successful
tests (neither wc_err.1 nor wc_err2). Code with a priority 2 is executed by the failed test
(wc_err.3) and one of the successful tests (either wc_err.1 or wc_err.2). Code with a
priority 1 is executed by the failed test (wc_err.3) and both successful tests (wc_err.1 and
13-4
User’s Manual
χSlice: A Tool for Dynamic Program Debugging
Figure 13-1 The initial display of the main χSlice window
Figure 13-2 The updated test case window
wc_err.2). Finally, code in white with a priority 0 is the code that is not executed by any of
the failed tests (wc_err.3, in our case). Note that only those pieces of code that are executed
by all of the failed tests get a nonzero priority (i.e., are highlighted in non-white colors).
13-5
User’s Manual
χSlice: A Tool for Dynamic Program Debugging
Figure 13-3 A block slicing summary by-file over all selected test cases
However, if the program under test has multiple faults with each detected by different tests,
you should try to locate one fault at a time. That is, while computing the execution slice or
dice, do not select failed tests from different faults at the same time. Otherwise, the
highlighted code will miss some of the faults. Those pieces of code that are not executed
by any of the failed tests get a priority of zero (i.e., are highlighted in white) irrespective of
whether or not they are executed by any (or some, or all) successful tests.
The highest priority among all pieces of code in a file gets reflected in the corresponding
entry in the summary window. As in Figure 13-3, main_err.c is in red because some of its
code has a priority 3, but the highest priority wc.c has is 1, so it is displayed in the color of
priority 1. In other words, main_err.c (but not wc.c) has blocks that are executed by the
failed test (wc_err.3) but not the successful tests (neither wc_err.1 nor wc_err.2). Click on
main_err.c, as it contains the most likely location of the fault.
The source code of main_err.c with the red spot selected is displayed in Figure 13-4. The
scroll bar is a thumbnail sketch of the entire file indicating there is one red spot. Clicking
with the left mouse button at the spot in the scroll bar brings the corresponding region of
the file into the source window. You can use the arrows at the top or the bottom of the scroll
bar to scroll up or down the source file a few lines at a time. You can also drag the mouse
up or down the scroll bar with the left mouse button pressed to rapidly scroll up or down
the file. In addition, χSlice also provides keyboard shortcuts. Pressing the Up or Down
arrow key will move the file up or down one line at a time. The PageUp and PageDown
keys scroll up and down the file one page at a time, respectively. The Home key scrolls to
the beginning of the file, whereas the End key goes to the end of the file.
Analysis of the code in Figure 13-4 reveals that the blocks highlighted in red contain the
fault. With the help of χSlice and a careful selection of the successful and failed tests, this
example shows that program maintainers can quickly locate faults by examining a reduced
set of code instead of the entire program.
13-6
User’s Manual
χSlice: A Tool for Dynamic Program Debugging
Code in red is executed by wc_err.3
but not wc_err.1 and wc_err.2.
Bug!
should be doline
Figure 13-4 Possible locations of faults in main_err.c
To quit χSlice, click on the ‘‘File’’ button in the top button bar, then select ‘‘exit’’.
13-7
User’s Manual
χProf: A Tool for Detailed Performance Analysis
Chapter 14
χProf:
A Tool for Detailed Performance Analysis
• Do you need to improve the performance of your program?
• Do you know which part of your program slows down the execution?
• Can you visualize the most frequently executed pieces in code?
χProf is a program performance enhancement tool in the Toolsuite. It helps
developers to improve their code performance. Unlike most other profilers that
provide approximate clock times spent while executing code, χProf provides exact
execution counts for various software items ranging from high level functions and
subroutines down to the lowest level expressions. Such execution count based
profiles provide a precise, repeatable, and easily understood way of measuring and
improving code performance. χProf uses an advanced graphical user interface to
present count ranges of the number of times code has been executed so
programmers can focus on the most executed code for possible reorganization and
rewriting to improve the code’s overall performance.
14-1
User’s Manual
χProf: A Tool for Detailed Performance Analysis
14.1 Background
Programmers are frequently asked to speed up code in response to user requests for
improved performance. It seems to be inevitable that any successful system will be stressed
by larger and larger data sets until performance bounds are encountered. Execution
profiles, showing how much time is spent in each function or subroutine, are the common
way of understanding such performance limitations. Many profiling tools are available for
a wide range of languages and environments. The χProf tool utilizes the coverage data
already collected in ATAC to provide a profiling that counts the number of times each
block, decision, c-use or p-use is executed instead of an approximate clock time spent while
executing code.
In general, execution time profiling is usually done at the function level to keep down the
overhead of processing system times. χProf presents execution count ranges for various
software items ranging from high level functions and subroutines down to the lowest level
expressions. It can point more directly to the exact code that most impacts performance.
As a result, χProf provides a precise, repeatable, and easily understood way of measuring
and improving code performance.
14.2 A Tutorial
The use of χProf is most easily understood by an example. In this section we use the same
wordcount program as used before to illustrate how the basic features of χProf can be used
to find the most frequently executed pieces of code. To copy these files, create a new
directory, cd to it, and copy the contents of the directory in which the tutorial files are
installed into the new directory. For the illustrations in this chapter, we will use (1) two c
files: main.c and wc.c, (2) three data files: input1, input2, and input3, (3) a Makefile and (4)
the tests_regress(.bat) script. Compile the wordcount program with atac as instructed in
Appendix A, Platform Specific Information.
After the compilation, two .atac files (main.atac for main.c and wc.atac for wc.c) and the
executable wordcount(.exe) are created. Note, one .atac file is created for each
instrumented .c file, i.e., the .c files compiled with ATAC.
Let us repeat all the tests executed in Section 11.2 as shown in Figure 11-1. First, remove
all files with a .trace suffix. Then run the script by typing tests_regress. Expect to see a
couple of error messages during this execution. We now invoke the graphical user interface
of the Toolsuite by entering the following command:
prompt:> xsuds main.atac wc.atac wordcount.trace
14-2
User’s Manual
χProf: A Tool for Detailed Performance Analysis
Then pull down the ‘‘Tool’’ menu and select the ‘‘xprof’’ option. Click on the ‘‘Summary’’
button in the top button bar to have a block profiling summary by file over all selected test
cases displayed in the main χProf window as shown in Figure 14-1. In our case, although
Figure 14-1 A block profiling summary by-file over all selected test cases
main.c has 38 blocks and wc.c has 13 blocks, main.c is only responsible for 16.3% of the
total block execution counts whereas wc.c is responsible for the rest. You can have the
profiling summary displayed in other formats by clicking on by-type or by-function in the
middle button bar. Figure 14-2 shows the block profiling summary by functions over all
Figure 14-2 A block profiling summary by-function over all selected test cases
selected test cases. To see the source display of the corresponding function, click on a
function name in this summary window. Since function count in wc.c is responsible for
83.7%, let us examine it first.
The source code of function count in wc.c is displayed in Figure 14-3. The scroll bar is a
thumbnail sketch of the entire file. Clicking with the left mouse button at the spot in the
14-3
User’s Manual
χProf: A Tool for Detailed Performance Analysis
The most frequently executed blocks
with 261 times.
block execution counts
Figure 14-3 Block execution counts in wc.c/count
scroll bar brings the corresponding region of the file into the source window. You can use
the arrows at the top or the bottom of the scroll bar to scroll up or down the source file a
few lines at a time. You can also drag the mouse up or down the scroll bar with the left
mouse button pressed to rapidly scroll up or down the file. In addition, χProf also provides
keyboard shortcuts. Pressing the Up or Down arrow key will move the file up or down one
line at a time. The PageUp and PageDown keys scroll up and down the file one page at a
time, respectively. The Home key scrolls to the beginning of the file, whereas the End key
goes to the end of the file.
The background color in χProf has a different meaning than in χATAC. In this tool it
indicates the execution frequency. For example, the red spot in Figure 14-3 indicates the
while statement is the most frequently executed code with 261 times followed by
statements in orange such as ‘‘++nc’’ or ‘‘if (c == ‘\n’)’’ with an execution count in the
range of 224-260. Execution counts do not include those spent in system calls or other
external subroutines. Colors are assigned relative to code in that file only and the number
in a color is the lowest possible number of times that code was executed.
14-4
User’s Manual
χProf: A Tool for Detailed Performance Analysis
It is your responsibility to determine whether the code in red is implemented in its most
efficient way. If not, revise it so as to improve the program’s performance. Otherwise, you
can examine the next most frequently executed code to see whether it is implemented
efficiently. This process continues until the overall performance of the program is
acceptable.
Similarly, you can view the source code at the decision, c-use or p-use level by clicking on
‘‘Options’’ in the top button bar and selecting the corresponding criterion from the poppedup menu. Figure 14-4 shows the decision counts for function count in wc.c. As you can see
the true branch of ‘‘EOF != (c = getc(file))’’ is the most frequently executed decision with
248 times.
The most frequently executed
decision with 248 times.
decision execution counts
Figure 14-4 Decision execution counts in wc.c/count
To quit χProf, click on the ‘‘File’’ button in the top button bar, then select ‘‘exit’’.
14-5
χFind: A Tool for Transitive Pattern Recognition
User’s Manual
Chapter 15
χFind:
A Tool for Transitive Pattern Recognition
•
Do you need to identify date sensitivities in your applications?
•
Are you faced with analyzing difficult languages like C and C++?
χFind is a static analysis tool in the Toolsuite. χFind supports the identification of datesensitive objects through a simple transitive relation. Date-sensitive patterns are initially
specified which are common across the application. The atoms (groups of characters,
surrounded by white space) in the code that match each pattern are then either accepted or
rejected. Acceptance or rejection can be selected in either local file or global scope. Once
the initial atoms are selected, the transitive relation is invoked, which identifies more
candidates for date-sensitive objects. By selectively pruning objects that are not datesensitive, closure on the date-sensitive objects in the application can be reached. Output
from χFind is then exported to the remaining tools to specify interesting regions for testing.
Because the transitive relation is a simple heuristic, namely objects on the same line, χFind
is language independent, and well-adapted to pointer-based languages like C or C++. Other
languages, like Perl or Tcl are also excellent candidates for analysis through χFind.
15-1
User’s Manual
χFind: A Tool for Transitive Pattern Recognition
15.1 Background
χFind is a tool within the Toolsuite which performs transitive pattern recognition. Its
intended use is to assist in identifying pieces of code that are related to one another in a
thematic way. The user begins with seed files containing standard and/or customized
templates (regular expressions) to identify components with the designated patterns.
Unlike the rest of the Toolsuite which uses dynamic traces to analyze code, χFind performs
a simple static analysis of the code. Because of its simple heuristics, χFind is language
independent. It does simple lexical analysis rather than a full parse to determine
relationships among the elements of a language.
One of χFind’s principle applications is to analyze and delineate date-sensitive code. The
simplest form of a date pattern might be mmddyy (two numbers each for month, day and
year such as 032697). A default seed file is provided for this application, which includes
the most frequent formats for encoding dates.
The tool applies the patterns to atoms (groups of characters, surrounded by white space) in
the code, which are all words except those included in a stop list. The stop list is user
definable and typically includes keywords of the language being analyzed. As the atoms
satisfy the patterns, they are highlighted in red as candidates.
The candidates are inspected for relevance to the feature code being delineated. Based upon
this determination, the atoms matching the patterns in the seed file are accepted or rejected
in either file or global scope. Upon completion of this task, the heuristic that generates
further candidates is applied. As currently implemented, new candidates are those atoms on
the same line but not excluded by the stop list.
Iteration through inspection of candidates, determination of their relevance, and generation
of new candidates is performed until no further relevant new candidates are generated. At
this point the process ceases.
χFind requires close user-interaction with and intuition about the program being analyzed.
Without this judgement, static analysis of the type outlined above does not converge. With
appropriate pruning of the dependencies among atoms in the code, static analysis becomes
a useful tool for isolating feature code in large programs.
15.2 A Tutorial
The use of χFind is most easily understood by an example. In this chapter we use the same
wordcount program as used in previous chapters to illustrate the basic features of χFind.
To copy these files, create a new directory, cd into it, and copy the contents of the directory
in which the tutorial files are installed into the new directory. This tutorial will not require
15-2
χFind: A Tool for Transitive Pattern Recognition
User’s Manual
that any programs be compiled, so if preferred, files from a previous tutorial may be used.
For the illustrations in this chapter, we will use two files: main.c and wc.c.
The wordcount program has the ability to count either characters, words or lines depending
on the command line options. Each of these abilities is deemed a feature. This tutorial will
find and demark all code that implements the word counting feature. In another application
the feature might just as easily be date sensitive. Start the tutorial by typing:
prompt:> xfind main.c wc.c
at the command-line prompt. The resulting display will appear as in Figure 15-1.
Figure 15-1 The initial χFind window
The χFind window is divided into two areas, a program display area in the upper region and
four control boxes in the lower region. The rightmost control box initially has a generic
label ‘‘Derived Seeds’’. This label changes to ‘‘Patterned Seeds’’ after a seed file is
imported and to ‘‘Transitive Seeds’’ after the transitive relation is applied. The control
boxes may be selected and deselected with the ‘‘Edit’’ menu ‘‘Show Controls’’ option.
Deselecting the control boxes causes the program display area to fill the entire window.
15-3
User’s Manual
χFind: A Tool for Transitive Pattern Recognition
Other entries in the ‘‘Edit’’ menu include:
•
‘‘Find’’, which displays a text-entry dialog used to specify text to scroll to in the
program area. Text to find may be entered as a regular expression. The text matching the regular expression will be highlighted.
•
‘‘Delete’’, which deletes entries from either the ‘‘Seed Files’’, ‘‘Seed List’’ or
‘‘Derived Seeds’’ control boxes. The menu entry changes depending on which
control’s entry is selected.
•
‘‘Show Excluded’’, a button that displays in yellow all those atoms that have been
excluded from consideration in either file or global scope. The default value for
this entry is deselected.
•
‘‘Show Candidate’’, a button that displays in red all those atoms that the transitive
relation of residing on a common line has selected. The default value for this entry
is selected. ‘‘Show Candidate’’ may be deselected at the end of the analysis to
reduce display clutter.
•
‘‘Scan Comments’’, a button that causes comments to be included in the feature
analysis. This entry is always selected in this version.
As in Figure 15-1, χFind displays the plain text of main.c, which may be scrolled with
either the scroll bar to the left of the text or by using the PgUp, PgDn or arrow keys.
Selecting wc.c in the ‘‘Modules’’ control box causes χFind to display wc.c in the program
area. The displayed module is denoted by an exclamation mark to its left. If the control
boxes are deselected by using the ‘‘Edit/Show Controls’’ menu entry, then a ‘‘Modules’’
menu appears in the tool bar that enables the user to switch between modules. Before
continuing the tutorial, reselect the control boxes and main.c in the ‘‘Modules’’ box. The
resulting display will be the same as that in Figure 15-1.
The program may be seeded with initial patterns to be matched either from a seed file or
interactively from the program display area. Selecting seeds interactively is accomplished
by sweeping out an atom with the left mouse button and invoking either the ‘‘All’’ or
‘‘File’’ option in the ‘‘Seed’’ menu depending on whether the selected atom is in either
global or file scope. Two seed files are included in the tutorial as shown in Figure 15-2. The
file seeds.sd is used in this tutorial, whereas dates.sd is displayed to provide a more
illustrative example of a seed file. Patterns can be changed or inserted one per line in the
seed files, which must have the extension .sd. Patterns may be excluded beyond the default
list by populating the excludeSeed region of the file. These patterns should be entered
between the curly braces, one pattern per line.
Import the seeds.sd file from the ‘‘File’’ menu by selecting the ‘‘Import’’ entry which
invokes a standard file selection dialog. Other entries in the ‘‘File’’ menu include:
•
‘‘New’’, which clears the state of the current χFind session and makes the tool
available for analyzing a new feature in a different set of modules. The state of an
15-4
User’s Manual
χFind: A Tool for Transitive Pattern Recognition
===== File seeds.sd =====
set includeSeed {{seedList {
word
}}}
set excludeSeed {}
===== File dates.sd =====
set includeSeed {{seedList {
ti?me?
da?te?
epoch
ne?we?r
older
ye?a?r
mo?n?th
da?y
ho?u?r
minute
seco?n?d?
}}}
set excludeSeed {}
Figure 15-2 The word-sensitive (seeds.sd) and date-sensitive (dates.sd) seed files
analysis is savable at any time into a χFind document file, which has the .xfd file
extension. This document allows the state of an analysis to be saved and restored
so large problems may be subdivided into several χFind sessions. The χFind document contains references to all modules, seeds, included and excluded atoms and
any other data necessary to continue working on a particular problem.
•
‘‘Open’’, which opens a previously saved χFind document for continuation or
review of feature code analysis.
•
‘‘Save’’, which saves the current state of the analysis into a χFind document. The
‘‘Save’’ menu entry displays a standard file dialog for saving a file the first time it
is selected. Thereafter the χFind file is saved each time this menu entry is invoked.
•
‘‘Save As’’, which saves a copy of the current χFind document. The ‘‘Save As’’
menu entry also uses a standard file dialog. The ‘‘New’’, ‘‘Open’’, ‘‘Save’’, and
‘‘Save As’’ menu entries interact in a way that has become familiar to most users
of GUI-based applications.
•
‘‘Import’’, which allows the reading of both seed and code modules into χFind.
This tutorial has already demonstrated how the ‘‘Import’’ menu entry is used to
read seed files. Although the example modules were invoked from the command
line in this tutorial, code modules may also be read into χFind using the ‘‘Import’’
file dialog. Filters exist in the standard file dialog for C and C++ language files. Any
other type of text file may also be read into χFind.
15-5
User’s Manual
χFind: A Tool for Transitive Pattern Recognition
•
‘‘Export’’, which allows the saving of items listed in the ‘‘Transitive Seeds’’ control box. This item is of limited usefulness to the general user and may go away in
a future release.
•
‘‘Report’’, which publishes the results of an analysis in printable form. The report
is formatted to facilitate postprocessing that makes it suitable input for other tools.
•
‘‘Adiff’’, which exports the results of a feature-code analysis in a format compatible with atacdiff (see Chapter 10, ATAC: Testing Modified Code). This output is
usable anywhere in the Toolsuite where atacdiff results are used. It is particularly
useful in identifying test sets that exercise the feature code that the user delineates
with χFind.
•
‘‘Exit’’, which exits the program. χFind will query whether to save any unsaved
state changes in the analysis.
Once χFind reads the seed file and code modules, analysis begins. The χFind window
should look like Figure 15-3. χFind highlights all the atoms that satisfy the regular
Figure 15-3 The updated χFind window after seeds.sd is imported
expression represented by ‘‘word’’. Each of these is now a candidate for inclusion or
exclusion into the code-feature set in either file or global scope. The white area covering
15-6
User’s Manual
χFind: A Tool for Transitive Pattern Recognition
each line that includes a candidate enhances its visibility in the scroll bar. Small candidates
in large modules tend to be overlooked without this highlighting.
Before proceeding with the analysis, take a few moments to become familiar with the
operation of the ‘‘Seed Files’’ and ‘‘Seed List’’ controls at the bottom of the screen. The
‘‘Update’’, ‘‘All’’ and ‘‘None’’ buttons in each control box determine whether the seed file
or individual regular-expression seeds are considered when generating candidates. The
‘‘Update’’ button functions as a toggle. Selecting the entry ‘‘word’’ in the ‘‘Seed List’’
control box and clicking the ‘‘Update’’ button removes the highlighting of all atoms that
match the pattern ‘‘word’’. Reselecting ‘‘word’’ and clicking the ‘‘Update’’ button
highlights all atoms that match the pattern ‘‘word’’ again. The ‘‘All’’ and ‘‘None’’ buttons
have the expected effects. The ‘‘Seed Files’’ control box operates similarly. An
exclamation mark to the left of the pattern or file indicates that the item is active.
Classify each of the candidates highlighted in red according to whether it is included or
excluded in file or global scope. Atoms that are defined as static or automatic variables
should be selected at file scope while those defined as global should be selected at global
scope. Click the left mouse button on the red highlighted wordct at the beginning of main.c.
The pop-up menu in Figure 15-4 appears. Move the mouse down to select ‘‘Include File’’.
This will insert wordct into the ‘‘Patterned Seeds’’ control box. Other entries in the popup menu include:
•
‘‘Include All’’, which selects the atom as a global patterned seed in all code modules. Double clicking an atom is a short cut for selecting this entry.
•
‘‘Exclude All’’, which excludes the atom from further consideration in all code
modules.
•
‘‘Exclude File’’, which excludes the atom from further consideration in this file.
•
‘‘Show/Hide’’, which shows candidates in the file that have been selected through
the transitive relation. This menu item is not useful at this point but its purpose will
become clear later.
•
‘‘Next’’, which selects the next instance of the atom specified. This menu is used
in conjunction with ‘‘Show’’.
If a classification needs to be changed, remove entries from the ‘‘Patterned Seeds’’ control
box by clicking the seed and selecting ‘‘Edit/Delete’’.
Click twordct and move the mouse down to select ‘‘Include File’’. Repeat this for doword.
These atoms will appear in the ‘‘Patterned Seeds’’ control box and all other instances of
the atom will change color to either green or yellow depending on whether they were
included or excluded from further consideration. Atoms that the user does not wish to
explicitly exclude may be left alone; they will not appear at the next level in the relation.
For example, the candidates which match the ‘‘word’’ pattern in module wc.c should be
ignored, as should all words within comments.
15-7
User’s Manual
χFind: A Tool for Transitive Pattern Recognition
Figure 15-4 The updated χFind window as the user begins to classify candidates
according to whether they are included or excluded in file or global scope
Now invoke the ‘‘New Level’’ entry in the ‘‘Seed’’ menu, which computes the next set of
candidate atoms and updates the χFind window. Scroll down until you see what is
displayed in Figure 15-5.
Going to a new level causes several changes in the window. The title of the ‘‘Patterned
Seeds’’ control box changes to ‘‘Transitive Seeds’’ indicating that atoms are no longer
being selected through regular expressions but rather through the transitive relation of
residing on the same line in the module. The entry in the ‘‘Seed Files’’ control box changes
from ‘seeds.sd’, the name of the seeds file, to ‘‘seedGen_1’’ indicating the level of the
transitive relation between atoms. Most importantly a new set of candidate seeds is
highlighted in red and the included seeds remain highlighted in green with red text, which
indicates these atoms are included in a previous classification pass.
Other entries in the ‘‘Seed’’ menu include:
•
‘‘All’’, which is used in conjunction with manually selected atoms. An unhigh-
15-8
User’s Manual
χFind: A Tool for Transitive Pattern Recognition
Figure 15-5 The updated χFind window after ‘‘New Level’’ is selected from
the ‘‘Seed’’ menu
lighted atom which is not in the stop list is selected by either double clicking on it
or sweeping it out with the left mouse button. On choosing the ‘‘All’’ menu entry,
the selected text is included as a transitive seed in global scope just as if it were a
candidate selected with the pop-up menu.
•
‘‘File’’, similar to ‘‘All’’ except the atom is included in file scope.
Go through the modules excluding the following atoms at file scope: linect, charct, tlinect,
tcharct, dochar, doline, and file and excluding at global scope stdin, a global variable.
These atoms are excluded to relieve clutter on the display at the next level. If they were not
excluded they would remain as candidates. The atoms count and print should be included
at global scope, thereby selecting them as candidate atoms in wc.c in the next level. Invoke
‘‘Seed/New Level’’ to go to the next level.
Select the wc.c module and observe that, ‘‘count’’ is a candidate atom. It is known from the
previous level that the third argument of ‘‘count’’ is connected with the word counting
feature, therefore ‘‘p_nw’’ should be included in file scope. Everything else on that line
15-9
User’s Manual
χFind: A Tool for Transitive Pattern Recognition
should be excluded at the file level. Select ‘‘Seed/New Level’’ to generate new candidates.
This action leads to one new candidate atom, ‘‘nw’’, which should be included in file scope
and ‘‘Seed/New Level’’ selected. At this point no new relevant candidates emerge. Ignore
the candidates on the integer declaration line as there is no true dependency among these.
This is because the declaration of a variable does not convey how it is going to be used and
hence what it is related to. The analysis is now complete (Figure 15-6). Saving the state in
a .xfd file, generating a report or creating a .dif file may be done at this time if desired.
Figure 15-6 The updated χFind window after completion of the static analysis
Displaying each module shows the atoms included in the word counting feature for that
module in the ‘‘Seed List’’ control box. Global atoms are preceded with an exclamation
point, and seeds in file scope are preceded with a ‘‘+’’ sign.
Examination of Figure 15-6 demonstrates one of the limitations of static analysis. The
integer variable ‘‘state’’ (e.g. in the statement ‘‘state = OUT’’) was not found by χFind but
is in fact an atom that contributes to counting words, as the code shows. To include the
‘‘state’’ variable from this statement (Figure 15-7) in the analysis, double click it with the
left mouse button and select the ‘‘Seed/File’’ menu entry.
15-10
User’s Manual
χFind: A Tool for Transitive Pattern Recognition
include state at the file level
Figure 15-7 Include the variable state in the statement ‘‘state = OUT’’ into analysis
To quit χFind, click on the ‘‘File’’ button in the top button bar, then select ‘‘Exit’’.
15-11
User’s Manual
χDiff: A Tool for Better Displaying Program Differences
Chapter 16
χDiff:
A Tool for Displaying Program Differences
• Do you need to visualize the difference between two files?
• Do you need to compare versions of code? documents?
data? computer outputs?
χDiff is the Toolsuite component for displaying differences between files. It displays
two files side by side with line by line differences highlighted in color. A green
background is used for lines that are changed, a blue background for lines that are
added, and a red background for lines that are deleted. Two customized bit-mapped
scroll bars are used to display a thumbnail sketch of the differences between the two
files. They are useful for quickly locating changes, deletions, and additions. χDiff
also reports the number of changes, additions, and deletions that have to be made to
bring two files into agreement.
16-1
User’s Manual
χDiff: A Tool for Better Displaying Program Differences
16.1 Background
One of the major problems in using the diff (UNIX) command to find the differences
between two files is that the user has to expend a tremendous amount of effort
understanding its output before discovering how these two files differ. χDiff, on the other
hand, has a graphical user interface which displays two files side by side with line by line
differences highlighted in color. A green background is used for lines that are changed, a
blue background for lines that are added, and a red background for lines that are deleted.
Two customized bit-mapped scroll bars are used to display a thumbnail sketch of the
differences between the two files. They are useful for quickly locating changes, deletions,
and additions.
The scrolling can be either synchronized or independent. In the synchronized mode, when
one file is scrolled up or down, the other file scrolls to ensure that changes are displayed
side by side in the two text windows. On the other hand, in the non-synchronized mode,
only the file in the text window under the mouse is scrolled while the other file remains
unmoved.
χDiff is valuable for merging versions of a program produced by two programmers into a
single, reconciled version. It can also quickly identify differences between a new and an
old version of a document.
16.2 A Tutorial
The use of χDiff is most easily understood by an example. In this chapter we use the same
wordcount program as used in the previous chapters to illustrate the basic features of χDiff.
To copy these files, create a new directory, cd to it, and copy the contents of the directory
in which the tutorial files are installed into the new directory. For the illustrations in this
chapter, we will use two files: main.c and main_err.c.
Invoke χDiff by:
prompt:> xdiff main_err.c main.c
Figure 16-1 shows the resulting display. If no file names are specified after the χDiff
command, the text windows will be empty. There are two other ways to specify which two
files to compare. One way is to enter the first file name in the rectangle next to ‘‘File name
1’’ and the second file name in the rectangle next to ‘‘File name 2’’. The other way is to
click on the ‘‘File1’’ or ‘‘File2’’ button to open a file dialog window, then select a file from
the file list and click on the ‘‘Load’’ button with the left mouse button or hit the return key.
16-2
User’s Manual
χDiff: A Tool for Better Displaying Program Differences
Figure 16-1 The display window of χDiff
Clicking with any mouse button (left, middle or right) at any spot in the scroll bars brings
the corresponding region of the file into the text window. You can use the arrows at the top
or the bottom of the scroll bar to scroll up or down the source file a few lines at a time. You
can also drag the mouse up or down the scroll bar with the left mouse button pressed to
rapidly scroll up or down the file. In addition, χDiff provides keyboard shortcuts. It may be
necessary to click with the left mouse button to activate the desired text area. Once focused
properly, the Up or Down arrow key will move the text up or down one line at a time. Any
time the mouse is over the horizontal bar, you may scroll horizontally in that file, either
with the Left and Right arrow keys or using the left mouse button. The PageUp and
PageDown keys scroll up and down the source file one page at a time, respectively. The
Home key scrolls to the beginning of the file, whereas the End key goes to the end of the
file.
The ‘‘Sync’’ button in the top button bar works as a toggle. If it is on, clicking turns it off;
if it is off, clicking turns it on. This button is used to determine whether file1 and file2
16-3
User’s Manual
χDiff: A Tool for Better Displaying Program Differences
should be moved together in a synchronized way. By default, they are synchronized. As
displayed in Figure 16-1, we see that a block of two lines in file1 is replaced by a block of
six lines in file2. Both blocks are highlighted in green. Since the ratio of the number of lines
changed in these two files is 1:3, χDiff ensures that when every line in the block that is
highlighted in green in file1 is scrolled up or down, three such lines in file2 are also scrolled
up or down, or vice versa. We also see that a block of new code has been added to file2.
This block is highlighted in blue. χDiff ensures that file1 stays unmoved, that is, not
scrolled up or down, while the blue highlighted block in file2 is scanned to examine the new
code. The same technique also applies to the deletion code in file1 which is highlighted in
red.
If you want to view these two files independently, i.e., without moving them together, you
can click on the ‘‘Sync’’ button to turn it off. Once it is clicked, the button is dimmed to
indicate χDiff is in the non-synchronized mode. In this mode, the text window under the
mouse has the focus. You can move the file in that window up or down by clicking a mouse
button on the corresponding scroll bar or pressing shortcut keys: UpArrow, DownArrow,
LeftArrow, RightArrow, PageUp, PageDown, Home or End.
You can switch back to the synchronized mode by clicking on the ‘‘Sync’’ button again.
Depending on which text window has the last focus, the file in the other text window will
be automatically scrolled to resume the synchronization. For example, if the left text
window has the last focus, when the Sync mode is turned on, file2 in the right text window
will then be automatically scrolled up or down to make itself in synchronization with file1.
In the same way, if the right text window has the last focus, the left window will be
adjusted.
The number of changes, additions, and deletions that have to be made to bring the two files
into agreement appears in the middle bar in the rectangles next to the ‘‘# of changes’’, ‘‘#
of additions’’, and ‘‘# of deletions’’ labels. In our case as displayed in Figure 16-1, there
are 3 changes, 1 addition, and 1 deletion from main_err.c to main.c.
To see a description of the colors used in highlighting, select the ‘‘changes’’, ‘‘additions’’,
or ‘‘deletions’’ button in the top button bar. A highlighted description window will pop up
as in Figure 16-2.
16-4
User’s Manual
χDiff: A Tool for Better Displaying Program Differences
Figure 16-2 The highlight description window of χDiff
To get on-line help, click on the ‘‘Help’’ button in the top button bar.
To quit χDiff, click on the ‘‘Close’’ button in the top button bar. This will close the χDiff
text window.
16-5
Appendices & Index
User’s Manual
Appendices & Index
Platform Specific Information
User’s Manual
Appendix A:
Platform Specific Information
This appendix documents the platform specific commands to be executed when setting up
and using the examples provided in the tutorial sections of each chapter, especially Chapter
2, ATAC: A Tutorial.
A.1 UNIX
When running on a UNIX system, the following command will copy the contents of the
‘ataclib’/tutorial directory to the current (working) directory:
prompt:> cp ‘ataclib‘/tutorial/* .
To compile the wordcount program from the Makefile:
prompt:> make
The output from make should look approximately like this:
cc -g -c wc.c
cc -g -c main.c
cc -g -o wordcount wc.o main.o
If you wish to compile the program manually, in one step:
prompt:> cc -g -o wordcount main.c wc.c
The complete source listings of the main.c, wc.c, and Makefile files are listed in Figure A1 through Figure A-3.
To remove the previously created object files and the executable file:
prompt:> make clean
To compile the wordcount program with atac by prefixing the standard C compiler, cc:
prompt:> make CC=”atac cc”
A-1
Platform Specific Information
User’s Manual
The output generated by make should look something like this:
atac
atac
atac
cc
cc
cc
-g
-g
-g
-c wc.c
-c main.c
-o wordcount
wc.o
/*
* main.c
*
* Modified from ‘‘The C Programming Language’’
* by Kernighan & Ritchie, 1978.
* page 18.
*
*/
else {
++argv;
doline = 1;
doword = 1;
dochar = 1;
}
do {
if (!*argv) {
count(stdin, &linect, &wordct, &charct);
print(doline, doword, dochar, linect, wordct, charct,
””);
return;
}
else {
file = fopen(*argv, ”r”);
if (file == NULL) {
perror(*argv);
return 1;
}
count(file, &linect, &wordct, &charct);
fclose(file);
print(doline, doword, dochar, linect, wordct, charct,
*argv);
}
tlinect += linect;
twordct += wordct;
tcharct += charct;
} while(*++argv);
#include <stdio.h>
main(argc,argv)
int argc;
char **argv;
{
char*p;
int linect, wordct, charct;
longtlinect = 0;
longtwordct = 0;
longtcharct = 0;
int doline = 0;
int doword = 0;
int dochar = 0;
FILE*file;
if (argc > 1 && argv[1][0] == ‘-’) {
for (p = argv[1] + 1; *p; ++p)
switch(*p) {
case ‘l’:
doline = 1;
break;
case ‘w’:
doword = 1;
break;
case ‘c’:
dochar = 1;
break;
default:
fprintf(stderr, ”invalid option: -%c\n”,
*p);
case ‘?’:
fputs(”usage: wc [-lwc] [files]\n”,stderr);
return 1;
}
argv += 2;
}
main.o
print(doline, doword, dochar, tlinect, twordct, tcharct, ”total”);
return 0;
}
static print(doline, doword, dochar, linect, wordct, charct, file)
int doline,doword, dochar;
int linect, wordct, charct;
char*file;
{
if (doline)
printf(” %7ld”, linect);
if (doword)
printf(” %7ld”, wordct);
if (dochar)
printf(” %7ld”, charct);
printf(” %s\n”, file);
}
Figure A-1 The source listing of the file main.c
A-2
Platform Specific Information
User’s Manual
/*
* wc.c
*
* Modified from ‘‘The C Programming Language’’
* by Kernighan & Ritchie, 1978.
* page 18.
*
*/
int c, nl, nw, nc, state;
state = OUT;
nl = 0;
nw = 0;
nc = 0;
while (EOF != (c = getc(file))) {
++nc;
if (c == ‘\n’)
++nl;
if (c == ‘ ‘ || c == ‘\n’ || c == ‘\t’)
state = OUT;
else if (state == OUT) {
state = IN;
++nw;
}
}
*p_nl = nl;
*p_nw = nw;
*p_nc = nc;
#include <stdio.h>
#define IN1/* inside a word */
#define OUT0/* outside a word */
/* count lines, words and characters in input */
count(file, p_nl, p_nw, p_nc)
FILE*file;
int *p_nl, *p_nw, *p_nc;
{
}
Figure A-2 The source listing of wc.c
CFLAGS=-g
wordcount:wc.o main.o
$(CC) -g -o wordcount wc.o main.o
wc_err:wc.o main_err.o
$(CC) -g -o wc_err wc.o main_err.o
clean:
-@atactm wordcount.trace
-@atactm wc_err.trace
rm -f *.o wordcount wc_err
rm -f *.atac *.trace *.dif *.features tests_log
Figure A-3 The UNIX source listing of Makefile
If you do not wish to use make, you may compile the program under ATAC by entering the
following command yourself:
prompt:> atac cc -g -o wordcount main.c wc.c
In Section 13.2, A Tutorial, you are instructed to compile the wc_err program with atac.
Do this by:
prompt:> make wc_err CC=”atac cc”
A-3
Platform Specific Information
User’s Manual
A.2 Windows NT/ Windows 95
When running on a Windows NT or 95 system, if you installed into the default installation
directory, the following command will copy the contents of the tutorial directory to the
current (working) directory:
prompt:> xcopy /I ”C:\Program Files\Bellcore\xSuds\tutorial\*” .
If you installed into a different directory, use the path you chose for your installation in this
command.
To compile the wordcount program from the Makefile:
If you use the IBM C compiler:
prompt:> nmake -f makefile_ibm
If you use the Microsoft C compiler:
prompt:> nmake -f makefile_msc
If you use the IBM C compiler Figure A-4 shows about how the output from nmake will
appear. If you use the Microsoft C compiler, it will look something like Figure A-5.
prompt:> nmake -f makefile_ibm
IBM(R) Program Maintenance Utility for Windows(R)
Version 3.50.000 Feb 13 1996
Copyright (C) IBM Corporation 1988-1995
Copyright (C) Microsoft Corp. 1988-1991
All rights reserved.
icc /W0 /Q /c wc.c
icc /W0 /Q /c main.c
icc /W0 /Q wc.obj main.obj /Fe wordcount.exe.
Figure A-4 The output of nmake with the IBM compiler
The complete source listings of the main.c and wc.c files are in Figure A-1 and Figure A2. The Makefile file is listed in Figure A-6 for the IBM compiler and Figure A-7 for the
Microsoft compiler.
A-4
Platform Specific Information
User’s Manual
prompt:> nmake -f makefile_msc
Microsoft (R) Program Maintenance Utility Version 1.61.6038
Copyright (C) Microsoft Corp 1988-1996. All rights reserved.
cl /nologo /w /c wc.c
wc.c
cl /nologo /w /c main.c
main.c
cl /nologo /w wc.obj main.obj /link /out:wordcount.exe
Figure A-5 The output of nmake with the Microsoft compiler
CFLAGS=/W0 /Q
wordcount.exe:wc.obj main.obj
$(CC) $(CFLAGS) wc.obj main.obj /Fe wordcount.exe
wc_err.exe:wc.obj main_err.obj
$(CC) $(CFLAGS) wc.obj main_err.obj /Fe wc_err.exe
clean:
del wc.obj main.obj main_err.obj wordcount.exe wc_err.exe
del wc.atac main.atac main_err.atac wordcount.trace wc_err.trace
del main.dif wc.dif wc.features tests_log.txt
Figure A-6 Makefile source listing for IBM compiler
CFLAGS=/nologo /w
wordcount.exe:wc.obj main.obj
$(CC) $(CFLAGS) wc.obj main.obj /link /out:wordcount.exe
wc_err.exe:wc.obj main_err.obj
$(CC) $(CFLAGS) wc.obj main_err.obj /link /out:wc_err.exe
clean:
del wc.obj main.obj main_err.obj wordcount.exe wc_err.exe
del wc.atac main.atac main_err.atac wordcount.trace wc_err.trace
del main.dif wc.dif wc.features tests_log.txt
Figure A-7 Makefile source listing for Microsoft
compiler
To remove the previously created object files and the executable file:
If you use the IBM C compiler:
prompt:> nmake -f makefile_ibm clean
A-5
Platform Specific Information
User’s Manual
If you use the Microsoft C compiler:
prompt:> nmake -f makefile_msc clean
To see the approximate output of these commands, refer to Figure A-8 or Figure A-9,
according to the compiler you are using.
prompt:> nmake -f makefile_ibm clean
IBM(R) Program Maintenance Utility for Windows(R)
Version 3.50.000 Feb 13 1996
Copyright (C) IBM Corporation 1988-1995
Copyright (C) Microsoft Corp. 1988-1991
All rights reserved.
del wc.obj main.obj main_err.obj wordcount.exe wc_err.exe
Could Not Find D:\tutorial\main_err.obj
Could Not Find D:\tutorial\wc_err.exe
del wc.atac main.atac main_err.atac wordcount.trace wc_err.trace
Could Not Find D:\USERS\JLA\tutorial\wc.atac
Could Not Find D:\tutorial\main.atac
Could Not Find D:\tutorial\main_err.atac
Could Not Find D:\tutorial\wordcount.trace
Could Not Find D:\tutorial\wc_err.trace
del main.dif wc.dif wc.features tests_log.txt
Could Not Find D:\tutorial\main.dif
Could Not Find D:\tutorial\wc.dif
Could Not Find D:\tutorial\wc.features
Could Not Find D:\tutorial\tests_log.txt
Figure A-8 The clean command and it’s output with the IBM
compiler
prompt:> nmake -f makefile_msc clean
Microsoft (R) Program Maintenance Utility Version 1.61.6038
Copyright (C) Microsoft Corp 1988-1996. All rights reserved.
del wc.obj main.obj main_err.obj wordcount.exe wc_err.exe
Could Not Find D:\tutorial\main_err.obj
Could Not Find D:\tutorial\wc_err.exe
del wc.atac main.atac main_err.atac wordcount.trace wc_err.trace
Could Not Find D:\tutorial\main_err.atac
Could Not Find D:\tutorial\wordcount.trace
Could Not Find D:\tutorial\wc_err.trace
del main.dif wc.dif wc.features tests_log.txt
Could Not Find D:\tutorial\main.dif
Could Not Find D:\tutorial\wc.dif
Could Not Find D:\tutorial\wc.features
Could Not Find D:\tutorial\tests_log.txt
Figure A-9 The clean command and it’s output with the Microsoft
compiler
A-6
Platform Specific Information
User’s Manual
To compile the wordcount program with ATAC:
If you use the IBM C compiler:
prompt:> nmake -f makefile_ibm CC=atacICC wordcount.exe
If you use the Microsoft C compiler:
prompt:> nmake -f makefile_msc CC=atacCL wordcount.exe
The output generated by nmake should look something like :
Figure A-10 if you use the IBM compiler.
prompt:> nmake -f makefile_ibm CC=atacICC wordcount.exe
IBM(R) Program Maintenance Utility for Windows(R)
Version 3.50.000 Feb 13 1996
Copyright (C) IBM Corporation 1988-1995
Copyright (C) Microsoft Corp. 1988-1991
All rights reserved.
atacICC /W0 /Q /c wc.c
atacICC /W0 /Q /c main.c
atacICC /W0 /Q wc.obj main.obj /Fe wordcount.exe
Figure A-10 Compiling with atac - IBM compiler
Figure A-11 if you use the Microsoft compiler.
prompt:> nmake -f makefile_msc CC=atacCL wordcount.exe
Microsoft (R) Program Maintenance Utility Version 1.61.6038
Copyright (C) Microsoft Corp 1988-1996. All rights reserved.
atacCL /nologo /w /c wc.c
wc.c
wc.c
atacCL /nologo /w /c main.c
main.c
main.c
atacCL /nologo /w wc.obj main.obj /link /out:wordcount.exe
Figure A-11 Compiling with atac - Microsoft compiler
A-7
Platform Specific Information
User’s Manual
In Section 13.2, A Tutorial, you are instructed to compile the wc_err program with ATAC.
Do this by:
If you use the IBM C compiler:
prompt:> nmake -f makefile_ibm wc_err.exe
If you use the Microsoft C compiler:
prompt:> nmake -f makefile_msc wc_err.exe
A-8
Command Reference Pages
Users’ Manual
Appendix B:
Command Reference Pages
B.1 xsuds
NAME
xsuds, xatac, xslice, xprof, xvue, xregress - the graphical interface Toolsuite
SYNOPSIS
xsuds
[ options ] [ atac-files ] [ trace-files ] [ dif-file ] [ feature-files ]
xatac
[ options ] [ atac-files ] [ trace-files ] [ dif-files ]
xslice
[ options ] [ atac-files ] [ trace-files ] [ dif-files ]
xprof
[ options ] [ atac-files ] [ trace-files ] [ dif-files ]
xvue
[ options ] [ atac-files ] [ trace-files ] [ dif-files ] [ feature-files ]
xregress [ options ] [ atac-files ] [ trace-files ] [ dif-files ]
DESCRIPTION
The common, integrated graphical user-interface for all tools in the Toolsuite is xsuds. The
user may switch back and forth between various tools in the Toolsuite by selecting the appropriate entry from the ‘‘Tool’’ menu in the display. Alternatively, if one desires to use an
individual tool and does not wish to move back and forth between various tools, one may
invoke that tool directly. In the latter case, one does not get the ‘‘Tool’’ menu and hence
one does not get the ability to move from tool to tool. For example, if one invokes xslice
directly, the user is taken directly to the χSlice display and the ability to move to other tools
is taken away. The same holds with xatac, xprof, xvue, and xregress.
All of these tools use the data-flow files, called atac files, created by atac cc, atac CC,
atacCL, atacICC etc., and the trace files produced by executions of programs compiled
with atac. They also accept dif files, produced using the atacdiff command, to restrict their
analysis to differences between two versions of the corresponding source files. Additionally, xsuds and xvue also accept feature files, which may have been created previously using
the χVue tool. One may also specify .atac and .trace files using the ‘‘File’’ menu after the
tools have been invoked. Similarly, a new feature file may be opened using the ‘‘open’’
button from the features display under χVue. Dif files, however, can only be specified on
the command line when the tools are first invoked.
OPTIONS (the ‘‘-’’ sign preceding any of the options can be replaced by ‘‘/’’ on Windows)
-columns count
Adjust the width of the source window so count characters per line of source can
be displayed.
B-1
Command Reference Pages
Users’ Manual
-lines count
Adjust the height of the source window so count lines of source can be displayed
at one time.
-nocompress
Do not compress trace files upon exit. By default, all of the tools compress the
trace files specified when one exits them.
-nopoll
Do not automatically check if a trace file has been changed. By default, all of the
tools monitor the specified trace files and automatically highlight the ‘‘Update’’
button when they detect a change in any of them.
-noweights
Do not prioritize and color code uncovered program elements in χATAC. This
may speed up performance of χATAC when using extremely large source files.
FILES
file.atac - data-flow, or atac, file.
file.trace - coverage trace file.
file.dif - atac dif file.
file.features - χVue feature file.
B-2
Command Reference Pages
Users’ Manual
B.2 atac
NAME
atac - the command line browser
SYNOPSIS
atac [ -aiIJrRTuUY ] [ other-options ]... [ trace-file ] atac-files...
atac -s [ -fghiIJKMpqQRSTUY ] [ other-options ]... [ trace-file ] atac-files...
atac -C [ -fghiIJKpqRTUY ] [ other-options ]... [ trace-file ] atac-files...
atac -v
other-options:
-c test-name
-F function
-m { bBcdefIJprRTuUY }...
-m F function
-n test-name [ -x ]
DESCRIPTION
The atac command displays test coverage information in character format by analyzing the
data-flow files created by atac cc and trace files produced by executions of a program compiled with atac cc. (An enhanced view of the data is obtained using the graphical interface.)
The atac command will display source code, highlighting code fragments not covered by
test executions. Various coverage options may be selected with the -m flag to display unexecuted code. By default unentered functions and unexecuted blocks, decisions, c-uses,
and p-uses are displayed. On UNIX, the TERM environment variable must be set to display code fragments. Output is displayed page by page.
The atac -s command will present a coverage summary for file.c corresponding to the specified file.atac. Various coverage options may be selected with the -m flag to count executed
code. By default block, decision, c-use, and p-use coverages are counted.
If no trace file is specified atac assumes that no tests have been run.
OPTIONS (the ‘‘-’’ sign preceding any of the options can be replaced by ‘‘/’’ on Windows)
-a
Display all unexecuted code even if not covered by a weaker measure. All measures are considered equal except that function entry is weaker than all others; all
are weaker than decision except c-use and p-use; and all are weaker than c-use and
p-use. By default, only code whose components are covered by a weaker measure
are displayed. (For example, an unexecuted block is not displayed if the function
containing that block was never entered.)
-c test-name
Present a comparison of coverage with that of named test cases. Code is considered covered only if it is not also covered by the named test cases. Wild cards may
B-3
Command Reference Pages
Users’ Manual
be used in the test case name. On UNIX, wild cards are the same as those used for
file names by sh (*, ?, and [...]). Quote marks may be needed to prevent the shell
from expanding the test name as file names. Multiple test-cases may also be specified by repeating the -c option.
-C
Present execution counts.
-D
Generate debugging output.
-f
Present coverage summary on a per function basis (implies -s).
-F function
Present coverage for C subroutine named function. Wild cards may be used in the
function name (see -c option). Multiple functions may also be specified by repeating the -F option.
-g
Present coverage summary on a per source file basis (implies -s).
-h
Suppress column headings (used with -s, and -C).
-K
Include test cost in coverage summary (implies -s and -p).
-i
Ignore time stamps on source files and .atac files. By default, atac issues an error
if source files have been modified since execution of a test represented in the
.trace file.
-I
Include code ATAC considers unreachable. By default, this code is not counted
nor highlighted in displays.
-J
Include code embedded in a preprocessor macro expansion. By default, this code
is not counted nor highlighted in displays.
-m{bBcdefIJprRTuUY}...
Specifies the coverage measures to be used:
b Block - code fragments not containing control flow branching or function calls.
B Basic Block - code fragments not containing control flow branching.
c C-use - (computational use) pairs of blocks for which the first block contains an
assignment to a variable and the second block contains a use of that variable in a
computation.
d Decision - pairs of blocks for which the first block ends at a control flow branch
and the second block is a target of one of these branches.
e Function entry - covered when the function is entered at least once.
f
Function call - individual function calls.
Ffunction
Named function call - function calls matching function. Wild cards may be used
in the function name (see -c option). Multiple test cases may also be specified by
repeating the -mF option.
I
Infeasible code - code ATAC considers unreachable.
J Macro internals - code embedded in a preprocessor macro expansion.
B-4
Command Reference Pages
Users’ Manual
p P-use - (predicate use) triples of blocks for which the first block contains an assignment to a variable, the second block ends at a control flow branch based on a
predicate containing that variable, and the third block is a target of one of these
branches.
r Return - explicit or implicit function return or call to _exit, _longjmp, abort, exit,
longjmp, siglongjmp, if available.
R Not reached - code marked with /*NOTREACHED*/.
T Not tested - code marked with /*NOTTESTED:reason*/.
u All-uses - sum of p-use and c-use.
U Not instrumented - uninstrumented code (not normally present).
Y Performance critical - code marked with /*TIMECRITICAL*/.
-M Present a minimal cost set of test cases that achieves the same coverage, for the
specified coverage measure, as all cases together (implies -s and -p).
-n test-name
Present coverage for named test cases only. (See also -x option.) Wild cards may
be used in the function name (see -c option). Multiple test cases may also be specified by repeating the -n option.
-p
Present coverage summary on a per test case basis (implies -s).
-q
Present cumulative coverage per test case (implies -s and -p).
-Q
Sort test cases in order of increasing cost per additional coverage. Present cumulative coverage per test case. Include test cost in coverage summary. Same as
-qSK (implies -s and -p).
-r
Reverse the display criteria; display only covered code.
-R
Include code marked with /*NOTREACHED*/. By default, this code is not counted nor highlighted in displays.
-s
Present coverage summary.
-S
Sort test cases in order of decreasing additional coverage per unit cost (implies -s
and -p).
-t
Present coverage summary on a per test case basis - non zero only.
-T
Include code marked with /*NOTTESTED:reason*/. By default, this code is not
counted nor highlighted in displays.
-u
Use underscoring instead of other standout mode for source code highlighting.
-U
Include uninstrumented code. In unusual situations some code may not be instrumented. By default, this code is not counted nor highlighted in displays.
-v
Display Toolsuite release number.
-x
Exclude test cases specified by -c and -n options. Include all unspecified test cases.
B-5
Command Reference Pages
Users’ Manual
-Y
Exclude code marked /*TIMECRITICAL*/. This code is not instrumented so that
instrumentation will not interfere with performance. By default, this code is counted as not covered and highlighted in displays.
EXAMPLE
The following commands display coverage for src1.c and src2.c linked with other.o and
run with data for test input:
compile src1.c and src2.c with atac and
save the executable as testprog
testprog < data
atac -s -f src1.atac src2.atac testprog.trace
atac src1.atac src2.atac testprog.trace
FILES
file.atac - data-flow file.
file.trace - coverage trace.
B-6
Command Reference Pages
Users’ Manual
B.3 atac cc (UNIX only)
NAME
atac cc - compile C and C++ code for the Toolsuite
SYNOPSIS
atac cc [ options ]... files...
DESCRIPTION
The atac cc command is the compiler/source code instrumenter for the Toolsuite. The atac
cc command compiles and links C/C++ programs creating a data-flow file (file.atac for each
file.c) and object files or an executable program. The atac and xsuds commands display information by analyzing the data-flow files with the trace file produced by test executions
of the program.
The arguments to atac cc are exactly the same as arguments to the standard C or C++ compiler (e.g. cc). The appropriate compiler may be substituted for cc on the command line.
Source files are assumed to be C code if they have a .c extension, otherwise, C++. Preprocessing is done with cc -E and compilation and linking are done with cc, where cc is specified on the command line. These options can be modified by setting parameters in a .ini
file as described below.
Object files created with atac cc may be linked with object files and libraries created by
other means, using atac cc or atac ld. When the program compiled by atac cc is tested, a
coverage trace is output to a.out.trace where a.out is the name of the executable file created
by atac cc (i.e. the argument to the -o option, or, by default, literally a.out).
ENVIRONMENT VARIABLES
The following environment variables may be set at link-time or run-time to modify the runtime placement of the trace file, test case names, etc. Run-time settings will override linktime settings.
Some of these variables are set to yes or no. For these variables, off, false, f, n, and, 0 are
equivalent to no; on, true, t, y, and non-zero numbers are equivalent to yes. Upper and lower
case are not distinguished.
ATAC_BLOCKONLY
When a test is run, ATAC records data for a number of types of coverage. For very
large programs it may be necessary to restrict run-time recording to reduce the execution time and disk space. If ATAC_BLOCKONLY is set to yes at run-time,
ATAC will only record data for block coverage and weaker coverage types. Zero
is displayed for other coverage types. Tests run with this option set can be identified in the atactm -L listing by the B flag.
ATAC_COMPRESS
In order to save disk space, atac instruments the program under test to compress
the trace file after each test execution. The ATAC_COMPRESS variable may be
used to suppress compression completely or to compress periodically. If
ATAC_COMPRESS is set to no, when the program is executed, trace file com-
B-7
Command Reference Pages
Users’ Manual
pression is suppressed. If ATAC_COMPRESS is set to an integer n, the trace file
will be compressed after approximately every n test executions. A trace file can
be explicitly compressed using atactm, regardless of whether or not
ATAC_COMPRESS is set.
ATAC_COST
By default, each test case is assigned a cost of 100. If ATAC_COST is set to an
integer n, each test case will be assigned cost n. In any case, the cost may be reassigned after the test is run using the atactm command.
ATAC_DIR
By default, trace data is written to a file in the current directory. If ATAC_DIR is
set it is the path name of the directory in which trace data is written. However, if
ATAC_TRACE is set to a fully qualified path name, ATAC_DIR is not used.
ATAC_NOTRACE
If ATAC_NOTRACE is set, no trace file is created. This option may be useful
when it is necessary to run an instrumented program without creating a trace file.
ATAC_SIGNAL
Normally, a test case consists of a complete execution of a program. In some situations, a single program execution may represent multiple test cases. The program can indicate the start of a new test case by calling atac_restart(). This
requires that the code be modified to include this call, and that the call be removed
when ATAC is not used. ATAC_SIGNAL provides an alternate way of indicating the start of a test case. If ATAC_SIGNAL is set to a UNIX signal name or
number, ATAC will start a new test case each time the specified signal is received
by the program under test. The signal name must be a standard UNIX signal name
(e.g. SIGINT). The SIG prefix is not required and upper and lower case are not
distinguished. The signal number may be any valid signal number for your system.
ATAC_TEST
Each program execution results in named test information being appended to the
trace file. The default test name is the base name of the trace file. A numeric suffix
is appended to each test name in order to make it unique (e.g., wordcount.1, wordcount.2, wordcount.3). If ATAC_TEST is set, its value is used as the test name.
The test name must be less than 1024 characters long, composed of alpha-numeric
characters, comma, period, at-sign, and underscore, and must not begin with a digit. Other characters in the test name are replaced by question mark, except that
slash is replaced by colon and hyphen is replaced by the pound sign.
ATAC_TEST_FILE
If ATAC_TEST is not set and ATAC_TEST_FILE is the name of a readable
file, the contents of the first line of that file are used as the test name. This facility
is useful when it is not possible to vary the value of the ATAC_TEST variable at
run-time. In this case the ATAC_TEST_FILE variable may be set at link-time to
the name of a file that may be modified at run-time to contain the test name.
B-8
Command Reference Pages
Users’ Manual
ATAC_TMP
While a test is running, ATAC stores coverage data in a temporary file in the /usr/
tmp directory. If ATAC_TMP is set, it is the path of a directory in which the temporary files will be written. The temporary file is written in append mode. On
some systems, appending to a file on a networked file system is very slow. For this
reason, it is recommended that temporary files be written to a directory on a local
disk. Normally, temporary files are removed when test execution completes (See
ATAC_COMPRESS above).
ATAC_TRACE
By default, trace data is written to a file named prog.trace where prog is the name
of the program executable. If ATAC_TRACE is set, it is the name of the file to
which the trace data will be written. If the name does not end with the .trace suffix,
the suffix is appended.
ATAC_UMASK
When a trace file is created, it is given the same read/write permissions as the directory in which it is created. This is important when multiple processes of different owners will be writing to the same trace file, so that the write permissions on
the trace file are not restricted to processes with the same owner as the process that
first created the trace file. If it is necessary to further restrict access to the trace
file, the ATAC_UMASK variable may be set. Bits set in the ATAC_UMASK
variable will be cleared from the file creation mask.
COMPILER .INI FILES
If $HOME/atac/cc.ini or ‘ataclib‘/init/cc.ini is a readable file, where cc is the compiler
specified on the command line, it may contain parameters that will modify the compilation
process. (The latter is read only if the former is not readable.)
Parameters are specified one per line with parameter name followed by an equal sign followed by the quoted value with no spaces around the equal sign.
The following parameters may be present:
LANGUAGE=’C/C++/ld’
By default, source files are assumed to be C code if they have a .c extension, otherwise, C++. If LANGUAGE is ‘‘C’’, all source files are treated as C. If LANGUAGE is ‘‘C++’’, all source files are treated as C++. If LANGUAGE is ‘ld’, only
linking is performed.
FULLPATH=’compile-command’
By default, the compiler given by cc is used for all compilation, linking, and preprocessing (except when LANGUAGE=’ld’, in which case cc is used for compiling the environment file). If FULLPATH is set and cc does not begin with /, all
compilation, linking and preprocessing is done with the value assigned.
LOCAL_CPP=’preprocess-command’
By default preprocessing is done with cc -E where cc is given on the command
line or by the FULLPATH parameter. When LOCAL_CPP is specified, its value
is the command to use for preprocessing.
B-9
Command Reference Pages
Users’ Manual
C_COMPILE=’compile-command’
By default the environment file is compiled with cc given on the command line or
by the FULLPATH parameter. If C_COMPILE is set, its value is used as the
compile command for the environment file.
C_LIB=’libraries’
The value of the CLIB parameter is appended to the link line.
INCLUDE=’system-include-list’
The value of the INCLUDE parameter is a space separated list of include path prefixes where each path prefix is preceded by -S or -J. Source files beginning with
any prefix on the list are assumed to be system files and are not instrumented.
Source files beginning with a prefix preceded by -J on the list are assumed to be
C include files included into C++. The appropriate extern ‘‘C’’ code is inserted before compilation. For example:
INCLUDE=’-J/usr/include -S/’
means that any source file starting with / is treated as a system file and any source
file starting with /usr/include is treated as a C include file.
EXAMPLE
The following commands display coverage for src1.c and src2.c linked with other.o and
run with data for test input:
atac cc -o testprog src1.c src2.c other.o
testprog < data
atac -s -f src1.atac src2.atac testprog.trace
atac src1.atac src2.atac testprog.trace
FILES
file.atac - data-flow file.
file.trace - coverage trace.
B-10
Users’ Manual
Command Reference Pages
B.4 ataclib
NAME
ataclib - locate installation of Toolsuite library
SYNOPSIS
ataclib
DESCRIPTION
The ataclib command prints the name of the directory where the runtime library is installed.
B-11
Command Reference Pages
Users’ Manual
B.5 atactm
NAME
atactm - Toolsuite trace manager
SYNOPSIS
atactm [ -o new.trace ] trace-file
atactm -c cost -n test-name [ -x ] [ -o new.trace ] trace-file
atactm -d -n test-name [ -x ] [ -o new.trace ] trace-file
atactm -e -n test-name [ -x ] -o new.trace [ trace-file ]
atactm -{lL} [ -n test-name [ -x ] ] trace-file
atactm -r new-test-name [ -n test-name [ -x ] ] [ -o new.trace ] trace-file
DESCRIPTION
The atactm command manages trace files created by execution of a program compiled with
atac cc. A trace file contains coverage information for each test case executed by a program. The atactm command can list, rename, extract, or assign cost to selected test cases.
The options -c, -d, -e, -l, -L, and -r select the operation to be performed and are mutually
exclusive. If any of these options except -l and -L are specified the trace file is compressed.
If no option is specified, the only effect is to compress the trace file. The original trace file
is over-written unless the -o option is specified.
OPTIONS (the ‘‘-’’ sign preceding any of the options can be replaced by ‘‘/’’ on Windows)
-c cost Assign cost to test cases specified with -n test-name. Test case cost is used by atac
-M.
-d
Delete test cases specified with -n test-name.
-D
Generate debugging output.
-e
Extract test cases specified with -n test-name.
-l
List test case names. If output is to a terminal, names are formatted into columns.
If -n test- name is specified, only selected test cases are listed.
-L
List test cases with time stamp, duration, ATAC release, cost, attributes, and test
name. Attributes are described below. If a test has not been compressed, the name
of the temporary trace file is also listed. If -n test-name is specified, only selected
test cases are listed.
-n test-name
Select test cases matching test-name (See also -x.) Wild cards may be used in testname. On UNIX, wild cards are the same as those used for file names by sh (*, ?,
and [...]). Quote marks may be needed to prevent the shell from expanding the test
name as file names. Multiple test cases may also be specified by repeating the -n
option.
-r new-test-name
Rename test cases specified with -n test-name. If omitted, all test cases are renamed. Test case names are composed of alphanumeric characters and underscore. A numeric suffix is appended to distinguish test cases with the same name.
B-12
Command Reference Pages
Users’ Manual
-x
Include only test cases not selected by -n options.
The attributes displayed with the -L option are each a single positional character with the
following fields. The default value in each field is a dash.
count forked blockonly busy missing corrupt uncompressed error end start
The possible values are:
count f
Execution counts are not available due to abnormal termination.
forked F (UNIX only)
Process called fork in uninstrumented code. Test contains data for parent and child
processes.
blockonly B
Only block coverage data is available for this test.
busy i
Some coverage may have been lost in a signal handler routine due to interruption
of user level code.
missing m
Uncompressed data for this test is missing. (Named temporary .trace file has been
deleted or is not accessible.)
corrupt c
Temporary trace file for this test has been corrupted. Coverage data may be missing.
corrupt v
This test was created by a program compiled with an obsolete version of ATAC.
Coverage from this test is ignored.
uncompressed u
This test has not been compressed.
uncompressed r
This test has not been compressed and is apparently still running.
error M
Process ran out of memory during this test.
error O/V
Process has linked one or more object files compiled with an obsolete version of
ATAC. Coverage in those files is ignored.
error S
ATAC runtime routine encountered errors during this test.
error T
Process could not open temporary trace file during this test.
end/start C
Test ended/started by calling atac_restart().
B-13
Command Reference Pages
Users’ Manual
end/start O/N (UNIX only)
Test ended/started by calling fork in instrumented code.
end/start R (UNIX only)
Test ended/started by receiving the signal indicated in the ATAC_SIGNAL environment variable in instrumented code.
EXAMPLE
The following command lists test cases in prog.trace
atactm -l prog.trace
The output looks like this:
prog.1 prog.2 prog.3
FILES
file.trace - trace file.
B-14
Command Reference Pages
Users’ Manual
B.6 atacdiff
NAME
atacdiff - Create .dif file for Toolsuite browsers
SYNOPSIS
atacdiff source-file alternate-version-of-source-file
DESCRIPTION
The atacdiff command creates a file with the .dif extension that encodes the differences between two versions of a source file. This file may be supplied to the atac or xsuds browser
along with the corresponding .atac files to restrict the browser to source code that has been
modified or to identify test cases that may be affected by the source code modification. The
order of the two source files on the command line does not matter except that the .dif file
shares the base file name of the first of the source files.
To browse coverage on source code that has been modified, test cases must be run on the
modified code after it is instrumented with atac. To identify test cases that may be affected
by a source code modification, test cases must be run on the original code after it is instrumented with atac.
EXAMPLE
The following commands display coverage for code in src.c that has been modified from
src.c.old:
compile src.c with atac and save the executable as testprog
testprog < data
atacdiff src.c src.c.old
atac -s -f src.atac src.dif testprog.trace
The following commands run three test cases on code in src.c and then list the test cases
that execute code that has been modified in src.c.new. These test cases should be re-run to
verify the results after the modification.
compile src.c with atac and save the executable as testprog
testprog < data1
testprog < data2
testprog < data3
atacdiff src.c src.c.new
atac -t src.atac src.dif testprog.trace
FILES
file.dif - difference file.
file.trace - coverage trace.
B-15
Command Reference Pages
Users’ Manual
B.7 atacid (UNIX only)
NAME
atacid - identify atac instrumented object files and executables
SYNOPSIS
atacid file ... | grep ATAC
DESCRIPTION
The atacid command searches files of any type for a compiled-in string and prints the contents of the string. When piped into grep ATAC, the output indicates whether a file was
compiled or linked with atac and what default runtime values were used.
If file is -, the standard input is used.
EXAMPLE
The following commands compile the wordcount tutorial program with atac and use atacid
to identify the instrumented files.
atac cc -c wc.c
atac cc -c main.c
atac cc -g wc.o main.o
atacid wc.c main.c wordcount.trace
The output is:
wc.o:wc.c instrumented by ATAC release 1.0
main.o:main.c instrumented by ATAC release 1.0
wordcount:ATAC var ATACUMASK=
wordcount:ATAC var ATACTRACE=wordcount
wordcount:ATAC var ATACTMP=
wordcount:ATAC var ATACTESTFILE=
wordcount:ATAC var ATACTEST=
wordcount:ATAC var ATACSIGNAL=
wordcount:ATAC var ATACNOTRACE=
wordcount:ATAC var ATACDIR=
wordcount:ATAC var ATACCOST=
wordcount:ATAC var ATACCOMPRESS=yes
wordcount:ATAC var ATACBLOCKONLY=
wordcount:ATAC linked env vars:
wordcount:wc.c instrumented by ATAC release 1.0
wordcount:main.c instrumented by ATAC release 1.0
wordcount:ATAC runtime (release 1.0)
wordcount:ATAC runtime unbuffered IO
B-16
Command Reference Pages
Users’ Manual
B.8 atac_env_create (UNIX only)
NAME
atac_env_create - create atac_env.o for linking ATAC instrumented object files
SYNOPSIS
atac_env_create env-var=value ...
DESCRIPTION
The atac_env_create command creates a file named atac_env.o containing default environment values for the ATAC run-time. This file is linked with object files compiled with atac
and the ATAC runtime routine, ‘ataclib‘/atac_rt.o
Normally, files compiled with atac may be linked with atac cc or atac ld. In this case,
atac_env.o is not needed. However, if files compiled with atac are to be linked by calling
the linker explicitly, atac_env.o is needed.
The atacid command may be used to determine which default values have been compiled
into the atac_env.o or executable file.
EXAMPLE
The following commands may be used to create the instrumented wordcount as in the tutorial, using atac cc for the compiles but not for the link. The default trace name is set to
wc.trace. By default, the trace file will not be compressed.
atac cc -c wc.w
atac cc -c main.c
atac_env_create ATAC_TRACE=wc.trace ATAC_COMPRESS=no
ld -o wordcount wc.o main.o atac_env.o
‘ataclib‘/atac_rt.o /lib/crt0.o -lc
B-17
Users’ Manual
Command Reference Pages
B.9 atacCL (Windows only)
NAME
atacCL - automatic test analysis for C programs - compiler for Microsoft Windows using
Microsoft Visual C++
SYNOPSIS
atacCL [ options ] ... files ...
DESCRIPTION
The compiler/source code instrumenter for ATAC, when used with the Microsoft compiler
is atacCL. It compiles and links C and C++ programs creating a data-flow file (file.atac for
each file.c or file.cpp) and object files or an executable program. ATAC and the graphical
user interface of the Toolsuite display test coverage information by analyzing the data-flow
files with the trace file produced by test executions of the program. The arguments to
atacCL are exactly the same as arguments to the Microsoft Visual C++ compiler with two
exceptions. The arguments specifying optimization and precompiled header files are ignored. atacCL supports 32-bit applications using the WIN32 interface only; 16-bit applications will not work. Source files are assumed to be C code if they have a .c extension and
C++ code if they have a .cpp extension.
Preprocessing is done with cl -E and compilation and linking are done with cl, where cl is
specified on the command line. These steps can be modified by parameters in the registry
or environment as described below. Object files created with atacCL may be linked with
object files and libraries created without this instrumenter by using atacCL. Object files
created with atacCL may be successfully linked with cl or link by appending dllatac_rt.lib
to the command line. The dllatac_rt.lib file resides in the directory path name printed by
the ataclib command.
RUN-TIME PARAMETERS
When the program compiled by atacCL is tested, a coverage trace is output to atac.trace
by default. The user may modify certain parameters at run-time either from the environment or the registry. Registry values should not be modified directly but rather by using the
xconfig interactive configuration tool. If environment variable or registry key
ATAC_TRACE has a value at run-time, it is used as the trace file name. If environment
variable or registry key ATAC_DIR has a value at run-time, it is used as the directory for
the trace file; otherwise the current directory is used. If the trace file already exists it is appended to.
Normally the trace is compressed at the end of execution to save file space. If environment
variable ATAC__COMPRESS has a value of 0 at run-time, trace compression is suppressed. Otherwise, if ATAC_COMPRESS has a value of n, other than 0, trace compression occurs approximately once every n executions. A trace may be explicitly compressed
using atactm. If environment variable ATAC_TMP has a value at run-time, it is used as
the directory for temporary trace files. By default temporary trace files are placed in /usr/
tmp.
B-18
Command Reference Pages
Users’ Manual
If environment variable ATAC_TEST has a value it is used as the test case name. The default test case name is derived from the name of the trace file. A numeric suffix is appended
to each test case name to make it unique.
atacCL parses C and C++ code as extended by Microsoft.
If environment variable ATAC_BLOCKONLY has a value at run-time of yes, only block
coverage data is written to the trace file. This will result in faster execution and smaller
trace files, however, decision, c-use, and p-use data will not be available.
If environment variable ATAC_COST has a numeric value at run-time it will be assigned
as the execution cost of the test case. By default, each test case has a cost of 100. Test case
costs are used by atac to compute a minimal test set (atac -M) or a cost effective ordering
(atac -S).
COMPILE-TIME
The registry entry in HKEY_LOCAL_MACHINE\SOFTWARE\Bellcore\xSuds\1.0 supports
two parameters that may be used to tune the action of atacCL.
DEFINE=list of preprocessor definitions for C code
The DEFINE parameter contains a semicolon-separated list of preprocessor definitions. For example, DEFINE=-DWIN32=1;-DX86=TRUE;-DFPUBUG=FALSE is
a legal parameter format.
DEFINEPP=list of preprocessor definitions for C++ code
The DEFINEPP parameter contains a semicolon separated list of preprocessor
definitions as in the previous example.
EXAMPLE
The following commands display coverage for src1.c and src2.c linked with other.o and
run with data for test input:
atacCL src1.c src2.c other.obj /link /out:testprog.exe
set ATAC_TRACE=testprog
testprog < data
atac /s /f src1.atac src2.atac testprog.trace
atac src1.atac src2.atac testprog.trace
FILES
file.atac - data-flow file.
file.trace - coverage trace.
dllatac_rt.lib - the atac run-time library, which resides in the directory pathname printed
by the ataclib command.
B-19
Users’ Manual
Command Reference Pages
B.10 atacICC (Windows only)
NAME
atacICC - automatic test analysis for C programs - compiler for Microsoft Windows using
IBM VisualAge
SYNOPSIS
atacICC [ options ]... files...
DESCRIPTION
The compiler/source code instrumenter for ATAC, when used with the IBM compiler is atacICC. It compiles and links C and C++ programs creating a data-flow file (file.atac for
each file.c or file.cpp) and object files or an executable program. ATAC and the graphical
user interface of the Toolsuite display test coverage information by analyzing the data-flow
files with the trace file produced by test executions of the program. The arguments to atacICC are exactly the same as arguments to the IBM VisualAge development system with
two exceptions. The arguments specifying optimization and precompiled header files are
ignored. atacICC supports 32-bit applications using the WIN32 interface only; 16-bit applications will not work. Source files are assumed to be C code if they have a .c extension
and C++ code if they have a .cpp extension.
Preprocessing is done with icc -EP and compilation and linking are done with icc, where
icc is specified on the command line. These steps can be modified by parameters in the registry or environment as described below. Object files created with atacICC may be linked
with object files and libraries created without this instrumenter by using atacICC. Object
files created with atacICC may be successfully linked with icc or link by appending
dllatac_rt.lib to the command line. The dllatac_rt.lib files resides in the directory path
name printed by the ataclib command.
RUN-TIME PARAMETERS
When the program compiled by atacICC is tested, a coverage trace is output to atac.trace
by default. The user may modify certain parameters at run-time either from the environment or the registry. Registry values should not be modified directly but rather by using the
xconfig interactive configuration tool. If environment variable or registry key
ATAC_TRACE has a value at run-time, it is used as the trace file name. If environment
variable or registry key ATAC_DIR has a value at run-time, it is used as the directory for
the trace file; otherwise the current directory is used. If the trace file already exists it is appended to.
Normally the trace is compressed at the end of execution to save file space. If environment
variable ATAC_COMPRESS has a value of 0 at run-time, trace compression is suppressed. Otherwise if ATAC_COMPRESS has a value of n, other than 0, trace compression occurs approximately once every n executions. A trace may be explicitly compressed
using atactm. If environment variable ATAC_TMP has a value at run-time, it is used as
the directory for temporary trace files. By default temporary trace files are placed in /usr/
tmp.
B-20
Command Reference Pages
Users’ Manual
If environment variable ATAC_TEST has a value it is used as the test case name. The default test case name is derived from the name of the trace file. A numeric suffix is appended
to each test case name to make it unique.
atacICC parses C and C++ code as extended by Microsoft and IBM.
If environment variable ATAC_BLOCKONLY has a value at run-time of yes, only block
coverage data is written to the trace file. This will result in faster execution and smaller
trace files, however, decision, c-use, and p-use data will not be available.
If environment variable ATAC_COST has a numeric value at run-time it will be assigned
as the execution cost of the test case. By default, each test case has a cost of 100. Test case
costs are used by atac to compute a minimal test set (atac -M) or a cost effective ordering
(atac -S).
COMPILE-TIME PARAMETERS
The registry entry in HKEYLOCALMACHINE\SOFTWARE\Bellcore\xSuds\1.0 supports
two parameters that may be used to tune the action of atacICC.
DEFINE=list of preprocessor definitions for C code
The DEFINE parameter contains a semicolon-separated list of preprocessor definitions. For example, DEFINE=-DWIN32=1;-DX86=TRUE;-DFPUBUG=FALSE is
a legal parameter format.
DEFINEPP=list of preprocessor definitions for C++ code
The DEFINEPP parameter contains a semicolon separated list of preprocessor
definitions as in the previous example.
EXAMPLE
The following commands display coverage for src1.c and src2.c linked with other.o and
run with data for test input:
atacICC src1.c src2.c other.obj /link/out:testprog.exe
set ATAC_TRACE=testprog
testprog < data
atac /s /f src1.atac src2.atac testprog.trace
atac src1.atac src2.atac testprog.trace
FILES
file.atac - data-flow file.
file.trace - coverage trace.
dllatac_rt.lib - the atac run-time library, which resides in the directory pathname printed by
the ataclib command.
B-21
Command Reference Pages
Users’ Manual
B.11 prformat (Windows only)
NAME
prformat - convert underline notation from atac -u to rtf format
SYNOPSIS
prformat
DESCRIPTION
The prformat command converts underline output from the atac -u to rich text format suitable for printing from Wordpad or Word.
EXAMPLE
The output of:
atac -u -v is:
xSuds release 1.2 Copyright (c) 1989, 1998 Bellcore. All rights reserved.
LICENSED MATERIAL PROPERTY OF BELLCORE
On filtering through the prformat command it becomes
{\rtf1\ansi\deff0\deftab720{\fonttbl{\f0\fswiss MS Sans Serif;}
{\f1\froman\fchar set2 Symbol;}{\f2\fmodern\fprq1 Courier New;}
{\f3\froman Times New Roman;}{\f4oman Times New Roman;}}
{\colortbl\red0\green0\blue0;}
\deflang1033\pardxSud\plain\f2\fs20 s release 1.2 Copyright (c) 1989, 1998
Bellcore. All rights reserved.
\par \plain\f2\fs20
\par \plain\f2\fs20 LICENSED MATERIAL PROPERTY OF BELLCORE
\par \plain\f2\fs20 \par}
B-22
Command Reference Pages
Users’ Manual
B.12 xconfig (Windows only)
NAME
xconfig - Toolsuite configuration utility for Windows
SYNOPSIS
xconfig
DESCRIPTION
The xconfig command is a graphical user interface application that lets the user manage
registry variables in the registry key. xconfig uses four controls, Apply, Cancel, Close, and
Find Compiler to manage the settings.
Apply
Updates any variables the user has changed in the dialog.
Cancel
Exits xconfig without applying any changes to the registry.
Close
Exits xconfig and prompts the user to save changes, if any, in the registry.
Find Compiler
Searches in well-known places for either the Microsoft Visual C++ or the IBM VisualAge compilers. If either of these is installed in an unusual directory, xconfig
might not locate it. The user must then manually enter the root directory by completing a dialog that allow the user to browse for the compiler. For example, if the
path to the IBM icc command is C:\IBMCPPW\BIN\icc.exe then the root directory is C:IBMCPPW. The first time the user executes it after Toolsuite installation, xconfig will automatically search for each supported compiler.
REGISTRY VARIABLES
The following variables are settable from xconfig. Although there are other variables defined in the registry, these are installation options and should not be changed by the user.
DEFINE
Extra default definitions not provided by the cl.exe or icc.exe command processor
for C code. The DEFINE variable contains a semicolon-separated list of preprocessor definitions. For example, DEFINE=-DWIN32=1;-DX86=TRUE;-DFPUBUG=FALSE is a legal format. Default empty.
DEFINEPP
Same as DEFINE only for C++. Default empty.
NO_INSTRUMENT
Semicolon separated list of pathname prefixes for turning off instrumentation of
header files. All header files containing any of the listed prefixes in their pathnames are not instrumented. The matches are by string and are case sensitive. For
B-23
Command Reference Pages
Users’ Manual
example, NO_INSTRUMENT=C:;D: is a legal format. Default: drive containing compilers.
ATAC_TMP
Directory for the temporary files used by the Toolsuite. May be overridden in the
environment. This variable should always be set. Default %SystemRoot%\TEMP for Windows 95 and %SystemDrive%\TEMP for Windows NT.
ATAC_COMPRESS
Controls compression of the trace file. If ATAC_COMPRESS has a value of 0,
trace compression is suppressed. If ATAC_COMPRESS has a value of n, other
than 0, trace compression occurs approximately once every n tests executed. A
trace may be explicitly compressed using atactm. Default 1.
ATAC_COST
Default test cost for minimization. If ATAC_COST has a numeric value it will be
assigned as the execution cost of the test case. Test case costs are used by atac to
compute a minimal test set (atac -M) or a cost effective ordering (atac -S). Default
100.
ATAC_DIR
Directory for the trace file. If ATAC_DIR has a value, it is used as the directory
for the trace file; otherwise the current directory is used. Default empty.
ATAC_SIGNAL
Not supported in this release. Default empty.
ATAC_TEST
Current test name. If ATAC_TEST has a value it is used as the test case name.
The default test case name is derived from the name of the trace file. A numeric
suffix is appended to each test case name to make it unique. Default empty.
ATAC_TRACE
Trace file name. When the program compiled by atacCL or atacICC is tested, a
coverage trace is output to atac.trace. If ATAC_TRACE has a value, it is used as
the trace file name. If the trace file already exists it is appended to. Default empty.
ATAC_CL
Root of the Microsoft Visual C++ directory subtree. ATAC_CL is set automatically by xconfig at installation or through the Find Compiler control on the xconfig
dialog.
ATAC_ICC
Root of the IBM VisualAge directory subtree. ATAC_ICC is set automatically by
xconfig at installation or through the Find Compiler control on the xconfig dialog.
BUGS
ATAC_SIGNAL should be implemented using Windows-style notification.
B-24
Command Reference Pages
Users’ Manual
B.13 xfind
NAME
xfind - Toolsuite static analysis tool
SYNOPSIS
xfind [ options ] [ seed-file ] [code-files ...]
DESCRIPTION
χFind is a language independent static analysis tool that performs transitive pattern recognition. It uses simple lexical analysis rather than a full parse to determine relationships
among the elements of a language. Its intended use is to assist in identifying pieces of code
that are related to one another in a thematic way.
χFind uses seed files containing standard and/or customized templates to identify components with the designated patterns. It has been described as a (UNIX-like) super grep.
The principle application of χFind is to analyze and delineate date-sensitive code. A default
seed file is provided which includes the most frequent formats for encoding dates such as
mmddyy. The tool applies the patterns in the seed file(s) to match all possible words except
those included in a stop list. The stop list is user definable and typically includes keywords
of the language being analyzed.
OPTIONS (the ‘‘-’’ sign preceding any of the options can be replaced by ‘‘/’’ on Windows)
-columns count
Adjust the width of the source window so count characters per line of source can
be displayed.
-lines count
Adjust the height of the source window so count lines of source can be displayed
at one time.
FILES
file.sd - χFind seed or pattern file.
file.xfd - χFind state file.
file.dif - atac dif file.
B-25
Users’ Manual
Command Reference Pages
B.14 xdiff
NAME
xdiff - Toolsuite diff command
SYNOPSIS
xdiff [ filename1 ] [ filename2 ]
DESCRIPTION
The xdiff command displays two files side by side with line by line differences highlighted
in color. A green background is used for lines that are changed, a blue background for lines
that are added, and a red background for lines that are deleted. Customized bit-mapped
scroll bars summarize the differences between the two files. The scrolling can be either synchronized or independent. In the synchronized mode, when one file is scrolled up or down,
the other file scrolls to ensure that changes are displayed side by side in the two text windows. In the non-synchronized mode, only the file in the text window under the mouse is
scrolled while the other file remains unmoved. xdiff also reports the number of changes, additions, and deletions that have to be made to bring two files into agreement.
B-26
Index
User’s Manual
INDEX
Symbols
.AElock file 6-4
.atac file 2-3
.dif file 10-2, 15-10
.features file 12-10
.sd file 15-4
.trace file 2-5
.xfd file 15-5, 15-10
_aTaC43 5-13
A
all-uses. See coverage criteria
ANSI Standard 5-12
ATAC 3-2
compiler 3-8
cost of using 3-9
in development process 3-10
tutorial 2-1
atac 3-8, 8-2, 9-2, B-3
atac cc 5-2, A-1, B-8
atac ld 5-3
ATAC_BIN 4-6
ATAC_BLOCKONLY. See environment variables
ATAC_COMPRESS. See environment variables
ATAC_COST. See environment variables
ATAC_DIR. See environment variables
atac_env.o 5-4
atac_env_create (UNIX) 4-4, 5-4, B-18
ATAC_ICC. See environment variables
atac_lib, ATAC_LIB 3-8, 4-6
ATAC_NOTRACE. See environment variables
atac_restart 7-3, B-9, B-15
atac_rt.o 5-5
ATAC_SIGNAL. See environment variables
ATAC_TEST. See environment variables
ATAC_TEST_FILE. See environment variables
I-i
User’s Manual
Index
ATAC_TMP. See environment variables
ATAC_TRACE. See environment variables
ATAC_UMASK. See environment variables
aTaC43 5-13
atacCL 5-7, B-19
atacdiff 10-2, B-16
atacICC 5-7, B-21
atacid 5-3, B-17
ataclib 3-8, 4-5, B-12, B-19, B-21
atactm 3-8, 7-2, 7-9, B-13
atom 15-1, 15-2
compute candidate 15-8
B
block 2-5, 3-4
buttons
Disable 8-4, 9-6
edit 12-9
Enable 8-4, 9-6
Features 12-7
File 12-5
file_name 8-8, 9-7
heuristics 12-11
minimize_in 8-14, 11-11
Options 8-5
save_as 12-9
Sort_by 8-4, 9-5
Summary 2-8, 8-4, 9-5, 13-4
TestCases 12-6, 13-4
Tool 12-4
Update 2-7, 9-5, 12-7
C
code preprocessors 5-9
compilation errors. See instrumenting code
complement 9-9, 11-9
compute-bound processes 3-9
correlation 11-2
I-ii
User’s Manual
Index
cost
cumulative 11-9
coverage analysis 3-2
adequate coverage 3-2
cumulative 11-9
data flow 3-6
modified code 10-2
testable attributes 3-2
coverage bar 2-9
coverage criteria 3-2, 3-3
all-uses 3-6
block 2-3, 3-4
c-use 2-19, 3-6
decision 2-15, 3-5
def-use pair 3-6
function-entry 3-4
p-use 2-25, 3-6
infeasible 2-27
coverage measures 3-3, 9-7
coverage overlap 3-2
c-use. See coverage criteria
D
date-sensitive code 15-2
DEFINE 4-6
DEFINEPP 4-7
detailed performance analysis 14-1
diff command (UNIX) 16-2
displaying program differences 16-1
displaying uncovered code
by coverage criteria 9-7
by file 9-5
by function 9-6
by test case 9-8
out-of-date 9-10
underscoring 9-11
dllatac_rt.lib B-19, B-21
I-iii
User’s Manual
Index
E
environment variables
ATAC__COMPRESS B-19
ATAC_BLOCKONLY 4-2, B-8, B-20, B-22
ATAC_COMPRESS 4-2, 6-2, B-8, B-21
ATAC_COST 4-2, B-9, B-20, B-22
ATAC_DIR 4-3, 6-2, B-9, B-19, B-21
ATAC_ICC 4-6
ATAC_NOCOMPRESS 6-2
ATAC_NOTRACE 4-4, B-9
ATAC_SIGNAL 4-4, B-9, B-15
ATAC_TEST 4-3, 7-4, B-9, B-19, B-21
ATAC_TEST_FILE 4-5, B-9
ATAC_TMP 4-3, 6-3, B-9, B-19, B-21
ATAC_TRACE 4-3, 6-2, B-10, B-21
ATAC_UMASK 4-4, 6-4, B-10
PATH 4-5
TERM 4-5
excluding tests 12-2
executing software tests
improving execution speed 6-5
run-time errors 6-7
saving disk space 6-5
execution count 14-2, 14-4
execution dice 13-2
execution environment. See environment variables
execution slice 12-2, 13-2
F
feature
character counting 12-7
name 12-7
function-entry. See coverage criteria
G
greedy_order 11-11
I-iv
User’s Manual
Index
H
heuristic 12-11, 12-15, 15-1
I
I/O-bound processes 3-9
instrumenting code 3-8
compilation errors 5-12
integrating with makefiles 5-2, 5-6
link errors 5-12
replacing the default C compiler 5-3, 5-8
selective 5-2, 5-7
include files 5-5, 5-8
NOTREACHED 5-10
NOTTESTED 5-9
TIMECRITICAL 6-6
invoking tests 12-2
L
ld 5-3
link errors. See instrumenting code
linking 5-3, 5-8
M
make (UNIX) 5-2, A-1
clean A-1
Makefile
IBM compiler A-4, A-5
Microsoft compiler A-4, A-5
UNIX A-1, A-3
minimization 11-2
reduced subset 11-6
I-v
User’s Manual
Index
N
nmake (Windows) 5-6, A-4
clean
IBM compiler A-5
Microsoft compiler A-6
with ATAC A-7
O
optimal_order 11-11
P
PATH. See environment variables
prformat B-23
prioritization 11-2
profiling 14-2
program debugging 13-1
p-use. See coverage criteria
R
registry variables B-24
ATAC_CL B-25
ATAC_COMPRESS B-25
ATAC_COST B-25
ATAC_DIR B-25
ATAC_ICC B-25
ATAC_SIGNAL B-25
ATAC_TEST B-25
ATAC_TMP B-25
ATAC_TRACE B-25
DEFINE B-24
DEFINEPP B-24
NO_INSTRUMENT B-24
regression testing 3-2, 11-1
modification-based 10-5
tests_regress script 10-7
ROOT 4-6
I-vi
User’s Manual
Index
S
scrolling
horizontal 16-3
independent 16-2, 16-4, B-28
synchronized 16-2, 16-3, B-28
seed file 15-2
import 15-4
templates 15-2
seed list control 15-7
slicing
dynamic 13-2
execution 12-2, 13-2
static 13-2
software maintenance 12-1
software testing
black-box 3-2
white-box 3-2
source code modifications 7-8
static analysis 15-2
summary reporting 8-2
by file 8-4
by function 2-9, 8-5
by test case 8-8
by type 2-9
cumulative coverage 8-12
out-of-date 8-14
per test case 8-12
restricting 8-10
by coverage criteria 8-11
by file 8-10
by function 8-10
selective 8-3, 8-10
sort by coverage 8-13
test cost 8-13
T
TERM. See environment variables
I-vii
User’s Manual
Index
test cases
assigning cost 7-7
deleting 7-7
extracting 7-6
listing 7-2
naming 7-4, 7-6
renaming 7-5
selecting 7-3
sorting by coverage 8-13
sorting by cumulative cost per additional coverage 8-14
summarizing by cumulative coverage 8-12
summarizing test cost 8-13
trace attributes 7-2
user-defined cost 7-2
tests
failed 13-2
successful 13-2
tests_regress script 11-3, 14-2
trace file 3-10
compression 7-9
disabling 6-2
enabling 6-2
forcing 6-2
corruption 6-5
locking 6-4
naming 6-2
opening 2-6, 12-6
permission 6-4
transitive pattern recognition 15-1
transitive relation 15-1
tutorial directory
UNIX A-1
Windows A-4
type conventions 1-4
U
uncovered code. See displaying uncovered code
UNIX 4-4, A-1
compiler
cc.ini file B-10
I-viii
User’s Manual
Index
V
VERSION 4-7, B-7
W
wordcount 1-4, 5-2
X
xatac 3-8
weights 2-3, 9-4
xconfig 4-5, B-24
xDiff 16-1, 16-2
additions 16-4
changes 16-4
deletions 16-4
xdiff B-28
xFind 15-1, 15-3
xfind B-27
xProf 14-1
xRegress 11-1
xSlice 13-1
xsuds 11-11, 12-4, 13-4, 14-2, B-1
xVue 12-1
I-ix