1
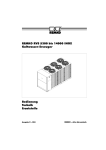
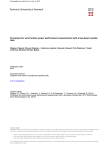
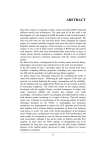
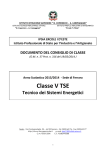
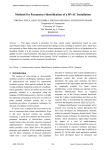
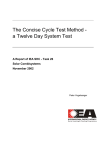
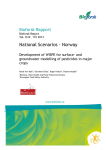
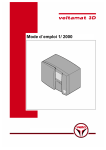
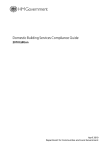
Radiant heating and cooling by embedded
water-based systems
BJARNE W. OLESEN, PH.D.
Technical University of Denmark, International Centre for Indoor Environment and Energy,
Nils Koppels Alle, DTU – Building 402, 2800 Lyngby, Denmark, e mail: [email protected],
http//www;ie.dtu.dk
ABSTRACT
Because of high initial costs, high energy consumption and often unacceptable indoor climate
(SBS, noise, draught) some European countries do not recommend full air-conditioning and
sometimes even prohibit it.
Alternatively, heating and cooling may be done by water-based radiant heating and cooling
systems, where pipes are embedded in the building structure (floors, ceilings, walls) or in the
centre of the concrete slabs in multi-storey buildings. The present paper will discuss the
possibilities and limitations of radiant surface heating and cooling systems. Differences in
performance and application of surface systems compared to embedded systems are
presented. Results from both dynamic computer simulations and field measurements are
presented.
The paper shows that for well designed buildings these types of system are capable of
providing a comfortable indoor climate both in summer and in winter in different climatic
zones. Various control concepts and corresponding energy performance are presented.
To remove latent heat, these systems may be combined with an air system. This air system
can, however, be scaled down with the benefit of improved comfort (noise, draught)
compared to full air-conditioning. An added benefit can be reduced building height due to the
elimination of suspended ceilings. Finally, surface heating and cooling systems use water at a
temperature close to room temperature. This increases the possibility of using renewable
energy sources and increasing the efficiency of boilers, heat pumps and refrigeration
machines
1. INTRODUCTION
In Europe it is mainly water-based heating systems that are used. These systems use radiators
or floor heating as heat emitters. One advantage compared with air systems is the more
efficient means of transporting energy. The demand for comfort, better insulation of
buildings, and greater internal loads from people and equipment have increased interest in
installing also a cooling system to keep indoor temperatures within the comfort range. This
resulted first of all in the introduction of suspended ceiling panels for cooling and in recent
years also in the use of floor systems for cooling (Holst and Simmonds, 1999; Olesen, 1997;
Simmonds, 1994; Børresen, 1994). Typical positioning of pipes for wall, floor and ceiling
systems is shown in Figure 1.
A new trend, which started in the early nineties in Switzerland (Meierhans, 1993, 1996), is to
use the thermal storage capacity of the concrete slabs between each storey in multi-storey
buildings. Pipes carrying water for heating and cooling are embedded in the centre of the
concrete slab (Figure 1).
1
By activating the building mass, you will not only get a direct heating-cooling effect, but you
will also, due to the thermal mass, reduce the peak load and transfer some of the load
Figure 1. Examples of the positioning of pipes in floor, wall, ceiling and slab
constructions.
outside the period of occupancy. Because these systems for cooling operate at a water
temperature close to room temperature, they increase the efficiency of heat pumps, ground
heat exchangers and other systems using renewable energy sources. The present paper will
discuss the possibilities and limitations of radiant heating and cooling systems. Especially
results from studies on systems where pipes are embedded in the concrete slab between each
storey of a building are presented. These results are based on dynamic computer simulation
and measurements in buildings during normal operation.
2. THERMAL COMFORT
The requirements for thermal comfort may limit the capacity and use of radiant surface
heating and cooling systems. Based on international standards and guidelines (ISO, 1993;
CEN, 1998), the thermal comfort requirements for people with mainly sedentary activity (1.2
met) is in winter (heating season, 1.0 clo) an operative temperature range of 20-24oC and in
summer (cooling season, 0.5 clo) 23-26oC. In CR 1752, different classes of thermal
environment may be specified. A higher class has an operative temperature range of 23.525.5°C and a lower class a range of 22-27°C. In the German Standard DIN 1946 (DIN 1944,
1994) the operative temperature may increase up to 27°C and for higher outdoor temperatures
up to 32°C. Especially for high thermal mass systems it is important that comfort is specified
as a range because with these systems the room temperature cannot be controlled at a fixed
level.
As the heat transfer between the heated or cooled surfaces, the space and people in the space
is mainly by radiation, it is important to use the operative temperature for specifying comfort
conditions and for load calculations. With concrete slab systems, where the dynamic effects
2
and thermal storage capacity of the slabs are used, the operative temperature during the day
should be within the comfort range. Studies by Knudsen et al. (1989) show that as long as the
temperature change is less than 5 K per hour, the temperature range based on steady-state
conditions (ISO 7730) is still valid.
Compared to air systems, there will be fewer problems with draught and noise using waterbased, slab heating and cooling systems.
Further comfort requirements are related to vertical air temperature differences, radiant
temperature asymmetry, and too high or low surface temperatures. Measurements with floor
cooling (Olesen, 1997) show that even at a floor temperature of 10 K lower than the room
temperature, the vertical air temperature difference between head and feet is less than the
required 3 K. The comfort requirements for radiant temperature asymmetry due to a heated
ceiling is 5 K and for a cooled ceiling 14 K. This will limit the acceptable ceiling temperature
for heating to approximately 27-28 oC. For a cooled ceiling, the dew point in the space and
not the radiant asymmetry will limit the lower surface temperature. The acceptable range for
the floor temperature for people wearing shoes is 19-29oC. However, in spaces where people
are mainly involved in sedentary activity, it is recommended that the floor temperature be no
less than 20oC.
3. HEATING AND COOLING CAPACITY
The important factors for the heating and cooling capacity of surface systems are the heat
exchange coefficient between the surface and the room, the acceptable minimum and
maximum surface temperatures based on comfort and consideration of the dew point in the
space and heat transfer between the pipes and the surface (Table 1 )
Table 1. Heat exchange coefficient, minimum and maximum recommended surface
temperature and cooling and heating capacity (Olesen, 1997, Olesen, 2000).
Floor
Wall
Ceiling
Perimeter
Occupied zone
Total heat exchange
coefficient
W/m2K
Heating
Cooling
11
7
11
7
8
8
6
11
Surface temperature
o
C
Maximum
35
29
~40
~27
Minimum
20
20
17
17
Capacity
W/m2
Heating
165
99
160
42
Cooling
42
42
72
99
The heat exchange coefficient depends on the position of the surface and the surface
temperature in relation to the room temperature (heating or cooling). While the radiant heat
exchange coefficient is for all cases approximately 5.5 W/m2K, the convective heat exchange
coefficient will change. The listed maximum surface temperature for the floor is based on the
European standard for floor heating ( EN 1264, ), where it is permitted in the perimeter zone1
m from outside walls, to increase the maximum floor temperature to 35 oC. The maximum
temperature for the wall is based on the pain limit for skin temperature, approximately 42 oC,
and the risk of being in contact with the wall over a longer period of time. The maximum
temperature of the ceiling is based on the requirement to avoid temperature asymmetry. The
minimum surface temperatures for wall and ceiling are based on consideration of the dew
point and risk of condensation.
A special case for floor cooling is when there is direct sun radiation on the floor. In this case
the cooling capacity of the floor may exceed 100 W/m2 (Børresen, 1994). This is also why
3
floor cooling is increasingly used in spaces with large glass surfaces like airports (Simmonds
et. al. 2000), atriums and entrance halls.
The heat transfer between the embedded pipes and the surface of wall, ceiling or floor will, as
long as there is no airspace in the construction, follow the same physics. It is then possible
for all three type of surface to use the standard for floor heating (CEN, 1998) as the basis for
design and calculation of the direct heating and cooling capacity, depending on the distance
between pipes, the thickness above (below) pipes, the surface material and the water
temperature. The heat exchange coefficient depends, however, on the position of surfaces
(wall, ceiling, floor) and whether heating or cooling is used (Olesen, 1997, Olesen et. al.,
2000).
The heating and cooling capacities mentioned above are for systems where the pipes are
positioned near the surface of ceiling or floor. This will require water temperatures within the
range 15-45°C, depending on the construction of ceilings and floors.
If the humidity is not controlled, the cooling capacity may be further reduced. To obtain the
same capacities with the pipes embedded in the centre of the concrete slabs, an even wider
water temperature range would be needed. This would, however, make it almost impossible to
control the system. Therefore much lower capacities are possible with concrete slab systems.
It is therefore recommended to use these systems only if the loads are less than 50 W/m².
In office buildings it is very common to use a raised floor for running cables. In the case of
concrete slab cooling, most of the heat transfer will then be over the ceiling side, which means
suspended ceilings should not be used. As the air systems only have to be sized for the
ventilation rate needed for acceptable indoor air quality, which means an air change rate of 1
to 2 h –1 instead of 4 to 6 h – 1, the ducts will be much smaller and a suspended ceiling is not
needed. The air ducts and the main supply and return water pipes are then installed in the
hallway between the offices. The avoidance of suspended ceilings has the big advantage of
reducing the total building height, resulting in significant savings on construction costs and
materials used. Without the suspended ceiling the acoustical requirements must be solved in
other ways.
4. OPERATION AND CONTROL
Even if surface heating and cooling systems often have a higher thermal mass than other
heating/cooling systems, they have a high control performance. This is partly due to the small
temperature difference between the room and the system (water, surface) and the resulting
high degree of self-control. Studies on controllability of floor heating/cooling (Olesen, 2001)
show that floor heating control the room temperature as well as radiators. To avoid
condensation on a cooled surface, there is a need to include a limitation on water temperature,
based on the space dew-point temperature.
If, however, the pipes are embedded in the building structure, it is often questioned how these
systems should be controlled or operated. Some studies deal with this issue (Brunello et.al.,
2000, Carli de et. al., 2001; Olesen, 2002). In the following, further results are presented.
A study was performed with the aid of the dynamic simulation program (TRNSYS, 1998).
The multidimensional heat transfer processes in the slab were modelled via a special module
developed by Fort (1996). The following describes the test space and other boundary
conditions, which were very similar to the conditions reported by Olesen et. al. (2000) and
Hauser et. al. (2000).
4.1 Description of system and test space
4
The system considered is shown in Figures 2 and 3. The ceiling/floor consists of an 18 cm
thick concrete slab with 20 mm plastic pipes embedded in the middle with 150 mm spacing.
The slab is finished with 20 mm of acoustical insulation and 45 mm screed. Heat is supplied
or removed by the heated or cooled water flowing in the embedded pipes. The mass flow rate
of the system is constant at 350 kg/h.
The effect of heating and cooling the ceiling is described using a central room module in an
office building with offices on either side (west and east) of the corridor. This characterizes
the thermal behaviour of all rooms that are at least two rooms away from the roof, corner and
ground floor rooms. The geometrical dimensions of the room module are shown in Figure 2.
Detail
Office
Corridor
Office
Roomwidth = 3.6 m
Figure 2. Central room module used for the computer simulation of a building with concrete
slab cooling. All dimensions are in metres.
Figure 3. Position of the plastic pipes in the concrete slab between two storeys.
The floor (Figure 2) consists of 45 mm screed ( λ = 1.4 W/m²K, c = 1 kJ/kgK,
ρ = 2000 kg/m³), 20 mm insulation ( λ = 0.04 W/m²K, c = 1.5 kJ/kgK, ρ = 50 kg/m³) and
5
180 mm concrete ( λ = 2.1 W/m²K, c = 1 kJ/kgK, ρ = 2400 kg/m³). The outside pipe
diameter is 20 mm and the spacing is 150 mm. The window has a U-value = 1.4 W/m²K.
The room volume is 55.44 m³ with a thermal capacity of 700 kJ/K.
4.2 Boundary conditions
The meteorological ambient boundary conditions correspond to those of Würzburg/Germany
and Venice/Italy. The external temperature data for winter and summer design days are shown
in Table 2. Summer was the period from 1 May to 30 September, and winter was the period
from 1 October to 30 April.
Table 2: Design day outdoor temperatures for Würzburg, Germany and Venice, Italy.
Heating Dry Bulb
Elev.
[°C]
[m]
99,6% 99%
45.30 N 12.20 E 6
-4,9
-3,1
Cooling Dry Bulb
[°C]
0,4%
2%
30,8
28,2
50.05 N 8.60 E 113
30,3
Lat.
[°]
City
Venice
WürzburgFrankfurt
Long.
[°]
-11
-8,2
26,7
The time of occupancy was Monday to Friday from 8.00 to 17.00, with a lunch break from
12.00 to 13.00. The system was in operation only outside the period of occupancy, from 18:00
to 06:00.
Internal heat sources: during occupied periods 550 W corresponding to 27.8 W/m2.
This corresponds to two occupants, two computers, a printer and light. During the lunch break
350 W corresponding to 17.7 W/m2, 50% convective, 50% radiant.
Moisture production: during occupation, 100 g/h.
Ventilation (ach): outside time of occupation 0.3 h-1 (infiltration); during occupation 1.5 h-1
(~ 11 l/s per person).
Sun protection: during occupation, by direct exposure of sunlight and operative temperature
above 23°C, reduction factor z = 0.5.
4.3 Control parameters studied
Three control parameters were studied:
•
•
•
Control of water temperature
Dead-band for room temperature
Use of weather forecast
4.3.1 Control of water temperature
The goal for the system used in the present study was to operate water temperatures as close
to the room temperature as possible. If very high or very low water temperatures are
introduced into the system it may result in over-heating or under-cooling.
In the present study, the supply water temperature was controlled so that it was not lower than
the dew point in the space. For this purpose, a humidity balance (latent loads from people,
outside humidity gain from ventilation) was also included in the simulation. It was then
possible to calculate the dew point in the room for each time step in the simulation.
Instead of controlling the supply water temperature it may be better to control the average
water temperature. The return water temperatures are influenced by the room conditions. By
6
maintaining a constant supply water temperature, an increase in internal loads from sun or
internal heat sources will increase the return temperature. The average water temperature will
then increase and the cooling potential will decrease. If, instead, the average water
temperature (½(treturn – tsupply)) is controlled, an increase in return temperature will
automatically be compensated for by a decrease in supply water temperature.
In well designed buildings with low heating and cooling loads it may be possible to operate
the system at a constant water temperature. The following concepts for water temperature
control were studied:
Supply water temperature is a function of outside temperature according to the equation:
(case 801)
t sup ply = 0,52 * (20 − t external ) + 20 − 1,6 * (t operative − 22) °C
Average water temperature is a function of outside temperature according to:
t average = 0,52 * (20 − t external ) + 20 − 1,6 * (t operative − 22)
°C
(case 901)
Average water temperature is constant and equal to: 22°C in summer and 25°C in winter.
(case 1201)
Supply water temperature is a function of outside temperature according to the equation:
t sup ply = 0,35 * (18 − t external ) + 18
°C
summer
(case 1401)
t sup ply = 0,45 * (18 − t external ) + 18
°C
winter
(case 1401)
4.3.2 Dead-band of room temperature
To avoid a too frequent change between cooling and heating, it is recommended that the
circulation pump be stopped during a certain room temperature range, i.e., dead-band. In the
study by Olesen et. al. (2000) a dead-band of 22°C to 23°C was used. This means that when
the room operative temperature increases above 23°C, the system will start in the cooling
mode. If the room operative temperature is less than 22°C, the system will start in the heating
mode. In between the circulation pump is stopped.
In the present study the following dead-bands were tested:
22 – 23°C
21 – 23°C
21 – 24°C
(case 0901-1)
(case 0901-8)
(case 0901-9)
4.3.3 Use of weather forecast
As the reaction time of the building and the activated slab is very long, it may be an
advantage to control the water temperature according to the weather forecast of external
temperature. By using a test reference year (Würzburg or Venice) the forecast can be made
100% correctly. Table 3 shows the cases tested. The supply water temperature (tsup ) was
controlled according to the outside temperature following the same algorithm, but a different
time average of external temperature ( tex ) was used as input. The dead-band was the same for
all cases. The simulation was made for the whole year.
7
Table 3 - Boundary conditions
case Water temperature
18 Tsup = 0.5*(18-tex)+18
19 Tsup = 0.5*(18-tex)+18
External temperature
mean value next 24 hours
dead band
21.5-23.5
mean value next 72 hours
21.5-23.5
20 Tsup = 0.5*(18-tex)+18
21 Tsup = 0.5*(18-tex)+18
mean value 12 hours around actual time
21.5-23.5
mean value 24 hours around actual time
21.5-23.5
24 Tsup = 0.5*(18-tex)+18
instant value
21.5-23.5
5. RESULTS AND DISCUSSION
The simulations were made for both an east- and a west-facing room. Only results for a westfacing room are presented in this paper. In a pre-test it was found that the highest exposures
occurred in the room facing west.
Results from the summer period 1 May to 30 September and the winter period 1 October to
30 April are presented.
The total number of hours in each period is ∼3690, number of working days ∼109 and number
of working hours ∼981. The results will be evaluated based on comfort (operative
temperature ranges, daily operative temperature drift during occupancy) and energy (running
hours for circulation pump, energy removed or supplied by the circulated water).
The calculated operative temperatures may be compared to the comfort range 23-26°C
recommended for summer (cooling period) and 20-24°C recommended for winter (heating
period) (ASHRAE, 1992; CEN, 1998; ISO, 1993). This is based on a fixed level of clothing
insulation for summer (0.5 clo) and winter (1.0 clo), which may not be relevant for the whole
period.
5.1 Study of water temperature control
The results of the simulation are shown in Table 4 for summer conditions and in Table 5 for
winter conditions.
The operative temperature of the cases 0801, 0901 and 1401 (Table 4) is for most of the time
(>85%) in a comfort range (22-26°C). In Würzburg, 27°C is never exceeded and 26°C is
exceeded less than 5% of the time. In Venice, only 5% of the temperatures are above 27°C.
The difference between controlling the supply water temperature (case 0801) or the average
water temperature (case 0901) is very small. In the case of 1401, the control does not take into
account the internal operative temperature, but the results are almost identical to cases 0801
and 0901. With a constant average water temperature (22°C), the cooling effect is too low and
the operative temperature is often too high (60% of the time above 27°C in Venice and 27%
in Würzburg).
The energy use is the same for the cases 0801, 0901 and 1401 in Venice. For Würzburg, case
1401 is the energy use, but it is about 10% lower than case 801 and 901. Energy use in case
1201 with a constant water temperature is relatively high.
The pump running time for case 1401 is equal to or lower than for the other cases.
In the summer, case 1401 is overall better than the others. Due to the warmer climate in
Venice (Table 3) the room temperatures are higher, and energy use and pump running time
are also higher compared to Würzburg.
8
Table 4: Operative temperatures, temperature drift, pump running time and energy transfer for
different water temperature control strategies. Summer conditions. Dead-band 22–23°C.
Ventilation rate: 0.3 ach from 17:00 to 8:00, 1.5 ach from 8:00 to 17:00.
May to September
Time of operation 18:00-06:00
Venice
Supply = Average
Average
Water
Average
F
=
F
=F
temperature
= 22°C
(outside) (outside)
(outside)
control
1201
0801
0901
1401
°C
%
%
%
%
<20
0
0
0
0
20-22 0
0
0
0
Operative
temperature 22-25 56
58
8
56
interval
25-26 26
25
13
25
26-27 13
12
19
14
>27
5
5
60
5
Würzburg
Supply= Average
F
=F
(outside) (outside)
0801
0901
%
%
0
0
3
3
75
78
18
16
5
4
0
0
Average
Average
=F
= 22°C
(outside)
1201
1401
%
%
0
0
1
5
30
77
21
14
22
4
27
0
<1
1-2
2-3
Temperature
3-4
drift [days]
4-5
5-6
>6
Pump
running
Energy
KWh
0
9
56
35
0
0
0
0
9
54
37
0
0
0
0
14
65
21
0
0
0
0
10
49
41
0
0
0
3
26
33
38
1
0
0
2
27
33
38
1
0
0
6
26
46
22
0
0
0
4
24
35
37
1
0
0
hours 1254
%
of
time
34
1190
1417
1214
1091
971
1327
953
32
39
33
30
26
36
26
Cooling 1104
Heating 1
1109
2
1297
0
1106
0
763
29
785
41
978
2
749
2
9
Table 5: Operative temperatures, temperature drift, pump running time and energy transfer for
different water temperature control strategies. Winter conditions. Dead-band 22–23°C.
Ventilation rate: 0.3 ach from 17:00 to 8:00, 1.5 ach from 8:00 to 17:00.
October to April
Time of operation 18:00-06:00
Venice
Würzburg
Supply= Average=
Supply= Average=
Average=
Water
Average= Average=
Average=
F
F
F
F
F
temperature
25°C
(outside)
25°C
(outside) (outside)
(outside) (outside)
(outside)
control
1201
1401
1201
0801
0901
0801
0901
1401
°C
%
%
%
%
%
%
%
%
<20
0
0
0
1
0
0
4
4
20-21 1
1
6
14
9
7
19
24
Operative
temperature 21-23 72
75
50
63
77
80
50
63
interval
23-24 14
15
5
14
8
7
7
7
24-26 12
10
23
8
6
5
15
2
>26
0
0
16
0
0
0
5
0
<1
1-2
2-3
Temperature
3-4
drift [days]
4-5
5-6
>6
33
44
21
2
0
0
0
Pump
running
Hours 837
% of
time 16
Energy
KWh
Cooling 144
Heating 551
34
43
21
2
0
0
0
30
49
20
0
0
0
0
32
41
23
4
0
0
0
57
29
12
2
0
0
0
57
29
12
2
0
0
0
58
28
13
1
0
0
0
57
29
13
2
0
0
0
642
1487
1166
813
664
1533
1322
13
29
23
16
13
30
26
143
407
143
421
57
816
64
834
63
684
45
717
144
554
Also for the winter period (Table 6) the cases 801, 901 and 1401 result in the most
comfortable conditions. In Venice, the room temperatures exceed the interval 20-24°C less
than 12% of the time. In case 1401 the room temperature is, however, below 20°C for 4% of
the time.
On the energy side, case 1401 is again about 10% better than cases 801 and 901, but the pump
running time is significantly higher.
In winter the energy use in Würzburg is, as expected, higher than in Venice.
It is clear that with proper control, the activated slab system is not only capable of reducing
the indoor temperatures to a comfortable range, but also, as the only heating system, of
heating up the space to the comfort range.
10
Table 6: Operative temperatures, temperature drift, pump running time and energy transfer
by different room temperature dead-bands. Control of water supply temperature according to
outside and internal temperature (case 0901). Summer conditions. Ventilation rate 0.8 ach
Room
temperature
dead-band
May to September
Time of operation 18:00-06:00
Venice
Würzburg
22-23 °C 21-23 °C 21-24 °C 22-23 °C 21-23 °C 21-24 °C
0901-1
0901-8
0901-9
0901-1
0901-8
0901-9
Operative
temperature
interval
°C
<20
20-22
22-25
25-26
26-27
>27
%
0
0
58
25
12
5
%
0
0
58
25
12
5
%
0
0
38
33
22
7
%
0
2
81
14
2
0
%
0
6
78
14
2
0
%
0
5
69
20
6
0
Temperature
drift [days]
<1
1-2
2-3
3-4
4-5
5-6
>6
0
5
44
51
0
0
0
0
5
44
51
0
0
0
0
5
44
51
0
0
0
0
19
31
49
1
0
0
0
19
31
49
1
0
0
0
19
32
48
1
0
0
Pump running
hours
1094
% of time 30
1094
30
878
24
709
19
657
18
378
10
Energy
KWh
Cooling 1035
Heating 0
1035
0
983
0
669
50
657
25
606
15
5.2 Study on room temperature dead-band
To minimize the risk for both heating and cooling within the same day and also to decrease
pump running time, it is recommended to let the building float within a certain room
temperature interval, i.e. dead-band. In the study by Olesen et. al. (2000) it was always 2223°C. In the present study, two additional dead-bands, 21-23°C and 21-24°C were tested. The
results for the summer period are shown in Table 7 and for the winter period in Table 8. In all
cases the supply water temperature was controlled according to case 901, with a constant
ventilation rate of 0.8 ach for the whole day.
For the summer period, dead-bands of 22-23°C and 21-23°C gave the same results as regards
operative temperature distribution, energy use and pump running time. The dead-band 2124°C resulted in a somewhat higher room temperature, especially in Venice. The pump
running time decreased significantly, but the energy use was about the same as for the two
other dead-bands.
In winter, the greatest effect is achieved by lowering the dead-band from 22 to 21°C. This
reduces the energy for heating by 20% and extends the time in which the operative
temperatures are within the range 20-21°C, although always higher than 20°
11
Table 7: Operative temperatures, temperature drift, pump running time and energy transfer
by different room temperature dead-bands. Control of water supply temperature according to
outside and internal temperature (case 0901). Summer conditions. Ventilation rate 0.8 ach
May to September
Time of operation 18:00-06:00
Venice
Würzburg
22-23 °C 21-23 °C 21-24 °C 22-23 °C 21-23 °C 21-24 °C
Room
temperature
dead-band
0901-1
0901-8
0901-9
0901-1
0901-8
0901-9
Operative
temperature
interval
°C
<20
20-22
22-25
25-26
26-27
>27
%
0
0
58
25
12
5
%
0
0
58
25
12
5
%
0
0
38
33
22
7
%
0
2
81
14
2
0
%
0
6
78
14
2
0
%
0
5
69
20
6
0
Temperature
drift [days]
<1
1-2
2-3
3-4
4-5
5-6
>6
0
5
44
51
0
0
0
0
5
44
51
0
0
0
0
5
44
51
0
0
0
0
19
31
49
1
0
0
0
19
31
49
1
0
0
0
19
32
48
1
0
0
hours
% of time
1094
30
1094
30
878
24
709
19
657
18
378
10
Cooling
Heating
1035
0
1035
0
983
0
669
50
657
25
606
15
Pump running
Energy
kWh
Conclusions of the dead-band analysis. By optimizing the dead-band, the energy use for
heating-cooling and running the pump can be reduced without sacrificing comfort. The deadband should not be greater than 2 K.
5.3 Study on use of weather forecast
The results in Figure 4 show the distribution of operative temperature during working time.
There is no significant difference between the cases. So no benefits are obtained by trying to
use a predicted future temperature. In real life, an additional factor will be how to correct the
weather prediction. So it may even be worse to use the predicted weather data as input for the
control. It should be mentioned that for the 24- or 72-hour average of the future outdoor
temperature, the water supply temperature is constant during the time of operation 18:00 to
06:00.
Also, when looking in detail at one week (Figure 5) the same results are obtained independent
of the way in which the outdoor temperature is used.
12
Table 8: Operative temperatures, temperature drift, pump running time and energy transfer by
different room temperature dead-bands. Control of water supply temperature according to
outside and internal temperature (case 0901). Winter conditions. Ventilation rate 0.8 ach.
October to April
Time of operation 18:00-06:00
Venice
Würzburg
22-23 °C 21-23 °C 21-24 °C 22-23 °C 21-23 °C 21-24 °C
Room
temperature
dead-band
0901-1
0901-8
0901-9
0901-1
0901-8
0901-9
Operative
temperature
interval
°C
<20
20-21
21-23
23-24
24-26
>26
%
0
1
62
27
10
0
%
0
8
71
13
7
0
%
0
8
68
12
11
0
%
0
2
78
16
4
0
%
0
13
77
7
2
0
%
0
13
77
7
2
0
Temperature
drift [days]
<1
1-2
2-3
3-4
4-5
5-6
>6
0
49
43
8
0
0
0
0
47
44
9
0
0
0
0
47
44
9
0
0
0
5
64
22
9
0
0
0
1
69
22
9
0
0
0
1
69
22
9
0
0
0
Pump running
hours
761
% of time 15
526
10
443
9
841
17
634
12
594
12
Energy
KWh
Cooling 101
Heating 842
83
713
61
695
35
1194
19
1138
11
1113
Distibution of the operative temperatures in the worktime
700
case
case
case
case
case
600
500
18
19
20
21
24
400
300
200
100
0
<20
<21
<22
<23
<24
<25
<26
<27
<28
<29
<30
Figure 4. Distribution of operative temperature during working time.
13
One week in october
30
25
T [°C]
20
15
case 18
case 18
case 19
case 20
case 21
case 24
Toutdoor
10
5
06.10 00:00 07.10 00:00 08.10 00:00 09.10 00:00 10.10 00:00 11.10 00:00 12.10 00:00 13.10 00:00
Figure 5. Operative temperature during a week in October.
6. FIELD MEASUREMENTS
Hundreds of buildings exist with embedded heating/cooling systems. To study the
performance in real buildings, some field measurements of thermal comfort conditions were
made in several buildings with radiant surface systems: floor, wall and systems with pipes
embedded in the concrete slabs between each floor in a multi-storey building (de Carli and
Olesen, 2001). Long-term measurements of operative, air, surface, system and external
temperatures have been carried out. The results from one of the buildings are given below.
In this building, an active thermal slab system of 6500 m2 was installed for heating and
cooling. The building had raised floors for the installation of cables, but only a limited area
with suspended ceiling and openable windows. Mechanical ventilation was provided by a
displacement system, the supply air being pre-cooled or heated to a temperature 1-3 degrees
below room temperature.
Measurements have been made in two open-space offices on the 4th and 5th floors during
August 1999, from mid June to mid October 2000, and from December 2000 to January 2001.
The outside temperature was also measured. The water supply temperatures were controlled
in the range 19-23°C from summer to winter according to the outside temperature.
The system was in operation only from 18:00 until 10:00.
Cooling period. A sample of operative temperature can be seen in Figure 6 for a typical
warm working week. From Table 9 it appears that for 95% of the total working time operative
temperatures are between 21°C and 26°C . From the tables it can be seen that temperatures on
the 5th floor are higher than those on the on 4th floor. This is because the two floors are
connected by an open stairway in the middle of the landscape offices. Therefore, some of the
convective part of the internal loads on the 4th floor (people, equipment, sun) will rise to the
5th floor and increase the internal load there.
It can be seen that on some days the temperature in the morning is on the cool side. As no
subjective evaluations were made, it is impossible to determine whether this caused a real
14
comfort problem or not. The low temperatures could probably be avoided by decreasing the
number of hours of cooling operation during the night.
Heating period. A example of the operative temperature can be seen in Figure 7 for a typical
working week under heating conditions. From Table 10 it can be seen that the operative
temperatures are, for most of the time, within the comfort range suggested by the existing
standards. Except for the 4th floor south, the measured operative temperatures are within the
recommended comfort range; in this position 11% of the time the temperature dropped below
20°C. The building had an additional heating system installed which, however, has not been
in operation. The basic heating is made by the activated concrete slab system. During the
winter, however, the supply air temperature increased above the room temperature during the
morning hours. After 1-2 hours’ occupancy, the supply temperature again decreased below
room temperature.
Table 9. Percentage of operative temperature distribution during working time (cooling
period)
Temperature
range [°C]
<20
20-22
22-25
25-26
26-27
>27
4th floor
window
east
0.0
11.2
88.6
0.1
0.0
0.0
4th floor
window
south
1.2
34.5
64.4
0.0
0.0
0.0
5th floor
window
west
0.0
2.5
75.0
18.4
3.7
0.4
5th floor
window
east
0.0
1.4
71.7
21.7
5.2
0.0
5th floor
middle
meeting
room
0.0
20.4
72.6
7.0
0.0
0.0
0.0
35.7
63.8
0.5
0.0
0.0
all offices
except
middle
0.2
17.1
72.7
8.1
1.8
0.1
Table 10. Percentage of operative temperature distribution during working time (heating
period).
Temperature
change
during a day
[°C]
<20
20-22
22-25
>25
4th floor 4th floor 5th floor 5th floor meeting
window window window window room
east
south
west
east
all offices
0
55.3
44.7
0
2.2
42.5
55.3
0
11
75.1
13.9
0
0.1
34
65.9
0
0
18.1
81.9
0
0
29.9
70.1
0
15
Building 3 - Cooling period
Operative 4th floor window east
Operative 5th floor window west
Operative 4th floor window south
outside
Operative 5th floor window east
40
Temperature [°C]
35
30
25
20
15
29/7/00 0.00
28/7/00 12.00
28/7/00 0.00
27/7/00 12.00
27/7/00 0.00
26/7/00 12.00
26/7/00 0.00
25/7/00 12.00
25/7/00 0.00
24/7/00 12.00
24/7/00 0.00
10
time
Figure 6 – Sample of temperature trend in a working week for cooling conditions in Building
3
Building 3 - Heating period
4th floor east side
4th floor south side
5th flooreast side
5th floor west side
24
23.5
temperature [°C]
23
22.5
22
21.5
21
20.5
20
19.5
13/01/01 0.00
12/01/01 18.00
12/01/01 12.00
12/01/01 6.00
12/01/01 0.00
11/01/01 18.00
11/01/01 12.00
11/01/01 6.00
11/01/01 0.00
10/01/01 18.00
10/01/01 12.00
10/01/01 6.00
10/01/01 0.00
09/01/01 18.00
09/01/01 12.00
09/01/01 6.00
09/01/01 0.00
08/01/01 18.00
08/01/01 12.00
08/01/01 6.00
08/01/01 0.00
19
time
Figure 7. Sample of temperature trend in a working week for heating conditions in Building 3
16
6. CONCLUSIONS
The use of surface heating and cooling using water based systems is becoming very popular.
Procedures for calculating the steady-state heating/cooling capacity are available.
By a proper control the risk for condensation on the cooled surfaces can be limited.
The results of a dynamic computer simulation of different control concepts for a water-based
radiant cooling and heating system with pipes embedded in the concrete slabs have been
presented. The system was studied for both the summer period May to September and the
winter period October to April in two geographical locations, Venice, Italy and Würzburg,
Germany.
The best performance regarding comfort and energy is obtained by controlling the water
temperature (supply or average) as a function of outdoor temperature. There is no need to take
into account the room temperature.
The actual outside temperature can be used as input to the control. No benefits are obtained
by using an average outdoor temperature or a future predicted outdoor temperature based on
the weather forecast.
The energy performance (energy use for heating and cooling, pump running time) can be
reduced further by introducing a 2 K room temperature interval (dead-band), where the
circulation pump is stopped.
The system was able to keep the room temperatures within a comfortable range, in both
summer (cooling) and winter (heating), and in both climatic zones.
Due to the use of water temperatures close to room temperatures water based surface heating
and cooling systems will increase the possibility to use renewable energy sources like ground
source heat pumps, ground heat exchangers, geothermal energy, solar energy, evaporative
cooling etc.
The level of water temperatures used also increase the efficiency of boilers, chillers and heat
pumps.
7.
REFERENCES
.
ASHRAE 55. 1992. Thermal Environmental Conditions for Human Occupancy, Atlanta,
American Society of Heating, Refrigerating and Air-Conditioning Engineers, Inc
Brunello, P., Di Gennaro, G., De Carli, M., Zecchin, R. 2001. Mathematical modeling of
radiant heating and cooling with massive thermal slab. Proceedings of Clima 2000, Naples.
Børresen, B. (1994). Fußbodenheizung und -Kühlung von Atrien, 16. Internationaler VeltaKongreß, St. Christoph/Tirol.
Carli, M. de, Peron, F., Romagnoni, P., Zecchin, R. (2000). Computer simulation of ceiling
radiant heating and cooling panels and comfort evaluation. Proceedings of Healthy Buildings,
Helsinki.
Carli, M. de, Olesen, B.W. (2001). Field measurements of thermal comfort conditions in
buildings with radiant surface cooling systems. Proceedings of Clima 2000, Naples.
CEN (199) Ventilation for Buildings: Design Criteria for the Indoor Environment, Brussels,
European Committee for Standardization (CR 1752).
DIN. 1994. DIN 1946-1994, Raumlufttechnik Teil 2. Berlin: Deutsches Institut für Normung.
17
EN1264 (1998), Floor heating, Systems and components.
Fort, K. 1996. Type 160: Floor Heating and Hypocaust.
Hauser,G., Kempkes, Ch., Olesen, B. W. (2000), Computer Simulation of the Performance of
a Hydronic Heating and Cooling System with Pipes Embedded into the Concrete Slab
between Each Floor. ASHRAE Winter meeting, Dallas, 5-9 February 2000.
Holst, S. and Simmonds, P., (1999), Kühlkonzeption am Beispiel Flughafen Bangkok, 21.
Internationaler Velta-Kongreß, St. Christoph/Tirol
International Organization for Standardization (1993) Moderate Thermal Environments –
Determination of the PMV and PPD Indices and Specification of the Conditions for Thermal
Comfort (EN ISO Standard 7730).
Knudsen, H. N. et. al. (1989), Thermal Comfort in Passive Solar Buildings. Technical
University of Denmark.
Koschenz M. and Dorer V. (1996), Design of air systems with concrete slab cooling. 5th
International Conference on Air Distribution in Rooms, Roomvent ’96.
Koschenz M. (1998), Thermoaktive Bauteilsysteme. Potentialabschätzung und Erfahrungen.
Beitrag am 10. CH-Status-Seminar ETHZ, 10-09-98, Zürich.
Meierhans, R.A. and Olesen, B. W. (1999), Betonkernaktivierung, Book, 67 pg.
ISBN 3-00-004092-7
Meierhans, RA. (1993) Slab cooling and earth coupling, ASHRAE Transactions, V. 99, Pt 2.
Meierhans, R.A. (1996) Room air conditioning by means of overnight cooling of
the concrete ceiling. ASHRAE Transactions,. V. 102, Pt. 2.
Olesen, B.W. (1997, Possibilities and limitations of radiant floor cooling,
ASHRAE Transactions. V.103, Pt.1.
Olesen, B.W., Michel, E., Bonnefoi, F., De Carli, M. (2000) Heat exchange coefficient
between floor surface and space by floor cooling: theory or a question of definition, ASHRAE
Transactions, Part I.
Olesen, B.W.(2001) Control of floor heating and cooling systems“ . Clima 2000/Napoli 2001
World Congress – Napoli, September 2001.
Olesen, B.W. (2002) Control of slab heating and cooling systems studied by dynamic
computer simulations, AICARR conference, Milan, 2002.
Simmonds, P., Gaw, W., Holst, S., Reuss, S. (2000) Using radiant cooled floors to condition
large spaces and maintain comfort conditions, ASHRAE Transactions, Part I.
Simmonds, P. (1994) Control strategies for combined radiant heating and cooling systems,
ASHRAE Tranactions,. v. 100, Pt. 1.
18
Steimle (1999) Entwicklung der Wärmepumpentechnik – der Fußboden als Heiz- und
Kühlfläche -. 21. Internationaler Velta-Kongreß, St. Christoph/Tirol.
TRNSYS (1998)TRNSYS 14.2 - User’s Manual.
19