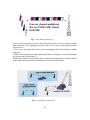
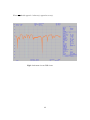
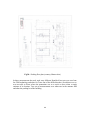
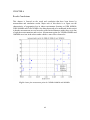
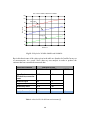
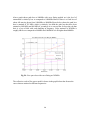
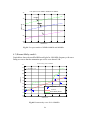
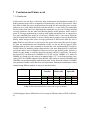
1
Outdoor to Indoor Radio Wave
Propagation For Wireless in Buildings
Solutions
SYED MUHAMMAD NAVEED -UL-HAQ
Master of Science Thesis
Stockholm, Sweden 2011
TRITA-ICT-EX-2011:2
OUTDOOR TO INDOOR RADIO WAVE PROPAGATION FOR
WIRELESS IN BUILDINGS SOLUTIONS
SYED MUHAMMAD NAVEED –UL- HAQ
Master Of ScienceThesis
Radio Communication System Group,KTH
Stockholm,Sweden 2010
Internal Advisor: Mats Nilson (Wireless@KTH)
External Advisor: Tord Sjölund (MicNordic)
Examiner: Prof. Ben Slimane
2
Abstract
A need for high data rates and reliable communication is required as we are moving from
2nd to 3rd and 4th generation of mobile communications. Therefore we see a tremendous
rise in data rates. We know that most part of mobile users are indoor as compared to
outdoor users, a new challenge for radio planners is to ensure proper coverage to indoor
users so the prime focus is to ensure proper coverage and capacity requirements. There
are various factors that account for poor coverage hence various techniques have been
introduced to create a breakthrough in this process. This thesis basically focuses on
indoor coverage for technologies like GSM 900MHz and 1800MHz as well as
Tetra380MHz- 385MHz.I have tried different indoor models that could produce a
feasible result.
There is a lot of work that have been done in past that focus on outdoor models.
Analysis of this thesis reveals that for the typical office environment with moderate
amount of obstacle, 380MHz gives the best result as compared to 900MHz and
1800MHz. Observations reveals that 900MHz generates better results as compared to
1800MHz. All PLS coefficients used for 900MHz, 380MHz and 1800MHz are modified
ones they are not taken from the standard table. focusing on PLS, Keenan Motley and
Free Space models, a general summarization can be drawn that free space model
generates least path loss but providing a poor coverage prediction, on the other hand path
loss model generate higher loss as compared to free space model but provides good
coverage while Keenan Motley model provides good coverage but shows the highest
attenuation loss among all the selected models.
3
ACKNOWLEGEMENT
I would like to take this opportunity to thank my supervisor Mats for providing his
tremendous support, guidance from his experience throughout this tenure. I will also like
to thank Tord Sjölund for his support that he provided in providing broad band indoor
antenna and correspondence with Solna Tax office. Not forgetting to thank my Examiner
Ben Slimane for his support technically and morally and flexibility that he showed due to
some delay in schedules partly due to the loss that were created during my thesis. Not
forgetting to thank Mr Zeeshan Zubair for the measurement support he provided in Tax
office building in Solna. And finally I would like to appreciate the patience displayed by
all the staff in Wireless@KTH department during my measurements which might have
created some interruptions in their daily routine of work.
I cannot forget to thank my mother, father and my sisters who kept on praying for me all
the entire duration of my master’s studies in Sweden. And I would like to appreciate my
friends for their concerns guidance and moral support which they provided to me.
4
Contents
ACKNOWLEGEMENT ............................................................................................. 4
CHAPTER 1 ............................................................................................................... 9
INTRODUCTION ...................................................................................................... 9
1.2) Previous work ............................................................................................... 10
1.3) Thesis problem .............................................................................................. 10
1.4) Report Outline: .............................................................................................. 11
CHAPTER 2 ............................................................................................................. 12
Introduction to Technologies .................................................................................... 12
2.1) Introduction to Tetra ...................................................................................... 12
2.2) Tetra Interfaces .............................................................................................. 13
2.3) Tetra Connectivity ......................................................................................... 13
2.4) Efficient Channel Usage ................................................................................ 14
2.5) TETRA and GSM different dimensions ........................................................ 16
2.6) Tetra limitation .............................................................................................. 16
2.7) GSM Overview:- ........................................................................................... 17
2.8) GSM 900MHz Channels ............................................................................... 17
2.9) Digital Communication System 1800 ........................................................... 18
CHAPTER 3 ............................................................................................................. 19
THEORY .................................................................................................................. 19
3.1) Propagation Models ....................................................................................... 19
3.1.1) Free Space Model ....................................................................................... 20
3.1.2) Keenan-motley model................................................................................. 20
3.1.3) Path Loss Slope Model ............................................................................... 21
3.2) Curve Fitting .................................................................................................. 21
3.3) Local Mean .................................................................................................... 24
A) Mean Approach ............................................................................................... 24
CHAPTER 4 ............................................................................................................. 26
Introduction to Indoor Coverage ............................................................................... 26
4.1) why in building coverage is important .......................................................... 28
4.2) Indoor coverage business point of view ........................................................ 28
4.3) Basic’s of indoor planning ............................................................................. 28
4.3.1) Isolation ...................................................................................................... 28
4.3.2) Tinted windows:- ........................................................................................ 29
4.4) Brief overview of Active and Passive DAS ..................................................... 29
4.4.1) Difference between Active and Passive Das .............................................. 30
CHAPTER 5 ............................................................................................................. 32
Measurements ........................................................................................................... 32
5.2) MEASUREMENTS FOR 900MHz /1800MHz ............................................ 38
Practical Measurement strategedy:- ...................................................................... 40
5
5.3) MEASUREMENTS VERIFICATIONS ....................................................... 40
5.3.1) Verification for 385MHz ............................................................................ 41
5.3.2) Verification for 900MHz ............................................................................ 41
5.3.3) Verification for 1800MHz .......................................................................... 42
5.3.4) CONCLUSION .......................................................................................... 42
5.4) Measurement results from skatteverket ......................................................... 43
CHAPTER 6 ......................................................................................................... 45
Results Conclusions .............................................................................................. 45
6.1) Path Loss Model for GSM 900MHz and GSM 1800MHz ........................... 46
Table 1: values for PLS for different environments .................................... 48
6.2) Free Space Propagation Model ...................................................................... 49
6.3) Keenan Motley model:- ................................................................................. 51
6.4) Comparison between different models .......................................................... 54
6.5) Comparison of Path Loss slope with Keenan Motley and Free Space Model............................................................................................................................... 54
6.6) Slope Equations ............................................................................................. 55
CHAPTER 7............................................................................................................58
Conclusion and Future work ................................................................................. 58
7.1) Conclusion ..................................................................................................... 58
7.2) Future Work ................................................................................................... 61
References ................................................................................................................. 62
APPENDIX A .......................................................................................................... 64
APPENDIX B .......................................................................................................... 67
APPENDIX C .......................................................................................................... 68
APPENDIX D... .......................................................................................................70
6
List of Figures
Fig 1: Tetra used by police fire department and Special Forces. .................. 12
Fig 2: Tetra standard interface. ..................................................................... 13
Fig 3. Modes of connectivity . ..................................................................... 14
Fig 4. Tetra channel efficiency. ................................................................... 15
Fig 5. Tetra modes of operation ................................................................... 15
Fig 6: GSM and Tetra handsets .................................................................. 16
Fig7: GSM 900MHz frequency plan ............................................................ 18
Fig 8: Path Loss illustration between transmitter and receiver ..................... 19
Fig 9: Vertical Residuals. .............................................................................. 22
Fig 10: Sample points curve fitting on straight line ...................................... 22
Fig11: local mean view on FSH viewer ........................................................ 25
Fig 12: - Basic concept indoor coverage in the home .................................. 26
Fig 13: - Femto cells and repeater used with DAS ....................................... 27
Fig 14: - Indoor coverage is using Distributed Antenna System. ................. 29
Fig 15: Passive DAS system ....................................................................... 31
Fig 16: Active distributed antenna system .................................................... 31
Fig17: Electrum picture and location map. ................................................... 32
Fig18: Satellite image of Electrum building Kista courtesy Google Map .... 33
Fig 19: Measurements floor plan Wireless@KTH (ELECTRUM). ............. 34
Fig20: Wireless@KTH/COS department fourth floor (Electrum) ............... 35
Fig 21: Hp 8640B (Signal generator) and MARS MA-CQ26-1X ................36
Fig 22: Rhode and Schwarz Fsh3 and HP 8590 spectrum analyzer. ............ 37
Fig 23: Sample setup for 385MHz measurements ........................................ 37
Fig 24: TEMS tool kit interfaced with PC acts as a receiver unit................. 38
Fig 25: HP 8922 signal generator for 900MHz and 1800MHz ................... 38
Fig 26: scanning procedure in TEMS investigation software ....................... 39
Fig 27: recording received signals by moving antenna randomly................ 40
Fig 28: Basic setup diagram to calculate the path loss ................................. 41
Fig29: - Entrance floor plan Solna tax office (courtesy Skatteverket) ......... 43
Fig 31: cluster plot points for 385MHz 900MHz and 1800MHz..................45
Fig 32: PLS model with curve fitting for 1800MHz at r =36 ...................... 46
Fig 33:- PLS plot for 900MHz at r=30 ......................................................... 47
Fig 34: PLS plot for 385MHz at r=22.5 with curve fitting .......................... 47
Fig 35: PLS plot for 385MHz 900MHz and 1800MHz ............................... 48
Fig 36: Free space model with curve fitting for 1800MHz. ......................... 49
Fig 37: Free space model with curve fitting on 900MHz ............................. 49
Fig 39: Free space model at 385MHz 900MHz and 1800MHz. .................. 51
Fig 40: Keenan motley curve fit for 1800MHz ............................................ 51
Fig 41: Keenan Motley model curve fit for 900MHz ................................... 52
7
Fig 42: Keenan Motley model for 385 MHz ................................................ 53
Fig 43: Keenan Motley plots for 385MHz 900MHz and 1800MHz ............ 53
Fig 44: Comparison between Keenan Motley and Free Space Plots ............ 54
Fig 45: PLS plots for different coverage scenarios for different PLS...........60
Fig A1: Exporting log file ............................................................................. 64
Fig A2: selecting the text file parameters (arguments) ................................. 65
Fig A3: compilation of text file .................................................................... 65
Fig A4: importing data in excel sheet ........................................................... 66
Fig A5:Sample view of data imported from TEMS toMS excel................................66
List of Tables
Table 1: values for PLS for different environments .................................... 48
Table 2: Slope Equations .............................................................................. 55
Table 3: Signal attenuation levels at different floor plan of solna tax office 56
Table 4: Maximum and Minimum values with respect to Models ............... 58
Table 5: coverage range at different PLS coefficient for 385MHz 900MHz
and 1800MHz................................................................................................ 61
8
CHAPTER 1
INTRODUCTION
Mobile communication has a rich and versatile history. Digital era came in to existence in
early 1990. At the beginning phase DECT was adopted as a standard digital cordless
telephony, after GSM was standardized in 1991. As time went on need for high data rates
was felt. It’s quite amazing that there were no question of high data rates twenty years
ago. At the beginning of 2000, GPRS came in to existence, in order to fulfill the
requirement of high data rates. As time went on EDGE, WCDMA, UMTS etc were
introduced. In contrast to all these advancement need for better coverage was also felt,
indoor coverage has not always been a hot topic as compared to outdoor coverage,
because a lot of new technical issues are to be kept in to consideration.
Indoor coverage is gaining its importance as time is going on because most of the users
use cell phone indoor as compared to outdoor users according to a rough estimates more
or less 80% of the people use cell phone indoor. Major priority in today’s world is thus to
improve the indoor coverage. But this seems not to be easy as coverage and capacity
would target both types of user’s i.e. voice and data users. One of the most prominent
factor that should be considered when dealing with indoor signaling is the wall
penetration loss, that degrades the signal quality, even under some scenarios the
attenuation may result in poor received signal quality that might be not tolerateble. Hence
all these factors should be considered in order to provide better indoor coverage. Hence it
has been studied that in-building solutions help in providing better coverage and capacity
quality, which could decrease the output power from mobile phones up to 80% [13]. Lot
of work has been done in this regard that focuses on different frequency ranges and
various models have been used to approximate the in building penetration loss. Like
study in [1] that shows that the penetration loss could be approximated by log normal
distribution for 600MHz band.
MIC Nordic group (Sweden) is working to provide better indoor future to the users. Its
various ranges of products are purely targeted to the indoor solutions. This thesis is
developed in collaboration with MIC Nordic group and includes testing various
frequency bands like GSM 900&1800 MHz, including Tetra 380 MHz to be investigated
for the indoor coverage.
9
1.2) Previous work
Some of the work done is not directly related to this thesis as most of the work target different
frequency ranges not specially 380 MHz and secondly a majority of the work done on Tetra is
related to outdoor. Well some relevant work done in this regard and its conclusion is stated as
under:1) Evaluation of Building Penetration Loss for 100 Buildings in Belgium by DAVID
PLETS [11], this work measures DVB-H SIGNALS in 602 MHz band in different
buildings of Belgium. Here an appropriate model has been developed to investigate
signal penetration loss inside various buildings (house, apartment, malls, villas, stations)
etc.
2)
Radio Propagation into Buildings at 912, 1920, and 5990 MHz Using Microcells by
SergioAguirre[12]. This thesis investigates the signal penetration in different ranges of
frequencies by using microcells base stations antennas.
3) Comparative Study of 900 MHz and 450 MHz radio signal propagation in an indoor
environment Dr Ashok Chandra [6] in this research paper transmitter and receiver have
maximum separation of 15m and they are kept in line of sight of each other.
1.3) Thesis problem
Studies done so far deals with cellular frequency ranges 900MHz, 1800MHz and
2100MHz. Only some of the work deals with 380MHz band. A majority of them are
related to outdoor signal attenuation because TETRA and other 380MHz services are
used in outdoor environment. No work have been done so far in 380MHz range
considering indoor penetration loss in to account in which distance varies beyond 15m or
more, considering various obstacle taken in to account like multiple concrete, wooden,
glass walls and windows etc.
As mentioned above that much of the work done in indoor signal propagation is in higher
frequency ranges. This thesis will focus on following prospects:1) Major focus is on service like (Tetra 380MHz, GSM 900MHz and 1800MHz) band.
Different indoor scenarios based on number of obstacle between the transmitter and
receiver. Measurements would be not limited to less than 15m separation.
2) And finally these measurements would be analyzed by the help of different propagation
models, applying curve fitting to the obtained measured points.
Hence the scope of the thesis is to find out answers to the following questions:1) Which model and parameters settings are suitable to approximate the indoor signal
characteristics especially 380 MHz (Tetra)?
2) Are there some amendments needed in the standard propagation models. If yes then
what are they?
3) Comparison of indoor properties between 385MHz,900MHz and 1800MHz
10
1.4) Report Outline:Chapter # 2:
This chapter provides an insight in to Tetra and GSM technology its interfaces,
efficiency, channel numbers etc. and it also discusses some of the basic features of
these two systems
Chapter #3:
This chapter includes some of the basics of indoor propagation models, found in the
literature its types. It also provides a comprehensive knowledge on stuff like curve
fitting and local mean and provides an insight to the theory behind.
Chapter#4:
It includes introduction to indoor coverage and its importance. How it could be made
more efficient and effective etc some basic tips and techniques to make indoor
coverage prominent. One of the key to the indoor coverage is the DAS systems it also
provides basic insight in to its advantages and disadvantages.
Chapter#5:
This chapter discusses the measurement methods and results that is obtained by using
different models, First some of the individual results are discussed based on different
test frequencies and then finally the comparative results are discussed.
Chapter#6:
The measured or observed results are analyzed through different models when curve
fitting is applied on it. This chapter gives an account on the calculated results and
comparing different models on the bases of the calculation results.
Chapter#7:
Conclusion and future work
11
Chapter 2
Introduction to Technologies
2.1) Introduction to Tetra
Mobile communication has made rapid advancement in past decades. Among these
advancements Tetra is also note worthy. It is basically standardized by ETSI. This body
also has standardized the first phase of GSM. Tetra is the only ETSI digital trucking
standard in Europe [1][2]. Hence Tetra MOU (Memorandum Of Understanding) have
been made in order to promote and support implementation of Tetra in member nations.
Main difference between Tetra and GSM is that tetra handsets have higher range as
compared to GSM [4]. It is basically a two way transceiver. Like other mobile
communication Tetra terminals and base station use low power radio waves in order to
transfer voice or data service. Lot of research have been conducted through the world,
researches have investigated various signals belonging to different frequency ranges as
well the research canvas includes Tetra too. Various bodies like national radiological
health organization, world health organization and government agencies have gathered
around a conclusion that there are no harmful effects by getting exposed to radio waves
specifically belonging to Tetra [7]. Tetra handsets typically transmits low power which is
1 watt on the other hand the handsets have adaptive power control mechanism to keep the
power level as low as possible to maintain reliable communication with base stations.
Tetra have been used specially by government agencies for emergency services like
(police forces, fire departments, ambulances, military, rail transport)etc. Tetra is already
active in many parts of the world like in Europe, Asia, and Latin America. One of the
most prominent properties of Tetra system is that it has fast setup time typically 300msec
as compared to GSM handsets. One really prominent feature of tetra is that its mobile
station can adjust power with respect to the needed field strength as mentioned above [1].
Fig 1: Tetra used by police fire department and Special Forces [1][2].
12
2.2) Tetra Interfaces
Tetra usually supports some variable interfaces like AI (air interface) that supports the
compatibility of different terminals made by different vendors. PEI (Peripheral
Equipment Interface) supports connectivity of terminals with the computer so it helps the
terminal to develop independent data application. For Tetra network from different
manufactures could be connected by inter-system-interface (ISI). Whereas direct mode
operation (DMO) allows the connection of different terminals when there is no network
coverage [8][1].
Fig 2: Tetra standard interface [9].
2.3) Tetra Connectivity
Tetra can easily be connected to different networks and can support private calls
(individual call). Apart from this phone call (PSTN or PABX), it also posses group
calling option that can be used to call a conference comprising all these ability it have one
more prominent feature and that is the emergency call option it is considered as the most
higher priory call.
13
Fig 3. Modes of connectivity [1].
Tetra mobile station can communicate by the help of direct mode or by using trunked
infrastructure made of tetra base station. Tetra also supports several types of data
communication such as short data services. While on the other hand packet or circuit
switched data is specially assigned to the traffic channels. Like GSM Tetra also posse’s
protection against eavesdropping it also provides air and end to end encryption. To
transmit information Tetra usually uses ∏/4 DPQSK this is a form of phase shift keying
[1][5]. Hence the symbol rate is 18000 symbols per second and each symbol maps to two
bits so resulting in 36,000 bits/s.
2.4) Efficient Channel Usage
Tetra have good voice quality and it also posses low bit error rate for data. Tetra usually
have packet as well as circuit switched data transmission and also offer less error rates.
Tetra use TDMA with four user channels interleaved in to one carrier with 25 KHz
carrier spacing. In this way only one radio unit is needed to transmit four user channels.
14
.
Fig 4. Tetra channel efficiency [1].
Tetra is used by emergency services and also by Special Forces so as a result it provides
quite good data, voice signaling protection. There are two types of encryption provided
by this service:1) First is air encryption that protect from eavesdropping from base station to mobile
station [4].
2) End to end encryption for critical applications where encryption is essential throughout
the system to the end terminal [7].
Beside these qualities Tetra provides direct mode operation between two mobile stations
without the need of any network architecture. As shown in the fig below
Fig 5. Tetra modes of operation [1]
15
2.5) TETRA and GSM different dimensions
There is confusion among people that Tetra and GSM have been alternative to
one another but it’s not true both have different precised aims and they do not
overlap each other. GSM is designed to be used for public usage while on other
hand Tetra focus on emergency services. Some people think that if Tetra features
could be integrated in GSM it could be cheaper because GSM handsets are quite
much cheaper then tetra handsets. But most functionality of Tetra couldn’t be
implemented in GSM because it would require some deep amendments in core of
GSM network which could be obviously expensive.
Fig 6: GSM and Tetra handsets [5]
2.6) Tetra limitation
Beside all these features that have been discussed above tetra have some disadvantages:1) Handsets are very expensive compared to cellular system [1].
2) Data transfer rate is better and its long range but may be regarded as slow as compared to
modern standard
3) It can generate interference with old designed handsets or with some electronic devices
because it have higher power than cellular handset [5
16
2.7) GSM Overview:GSM stands for “Global System for Mobile communications” [13]. GSM is a second
generation standard, the reason for its creation was to solve the fragmentation issues of
first cellular system in Europe [12].GSM is known for its first kind of telecommunication
systems that have a well defined network architecture and services. It is the most
prosperous 2G technology. Before the arrival of GSM, people in Europe used different
cellular standards, there was a lack of common subscriber unit. GSM was focused to
serve as a pan European system. Through GSM worldwide network coverage was made a
reality by the help of ISDN structures. GSM gained popularity soon it was lounged
according to an estimate there were about 350 million subscribers worldwide. In 1980 a
major step was taken by gathering group of special mobile system which was a common
working body of CEPT and it was to specify a common mobile communication platform
for Europe in 900MHz band [12]. But in 1992 GSM changed to global system for mobile
communication under the agencies of European technical standards institute due to some
marketing reasons [23]. GSM was first lounged in Europe in 1990 but after 1992 it was
introduced to Asia Australia America and South America.
2.8) GSM 900MHz Channels:GSM 900MHz have two frequency bands. Uplink and downlink
1) Uplink (890.2-915 MHz).
2) Downlink (935.2-960 MHz).
Both bands lie at a distance of 20MHz from each other. With a duplex distance of
45MHz Frequencies are expressed as channel number from 1 to 124 (absolute radio
frequency channel number)
If the ARFCN = n is known the absolute frequency can be calculated by
For the downlink: F(DL) = (935.2 + 0.2*(n-1) MHz,
For the uplink: F(UL) = (890.2 + 0.2*(n-1) MHz, [14 ]
Need for more frequency was felt after starting GSM so as a result an extended band called EGSM came in to existence hence the uplink and the downlink ranges are shown as under.
Uplink (880.2-890.0 MHz)
Downlink (925.2- 935.0 MHz)
17
Fig7: GSM 900MHz frequency plan [14]
In this version GSM ARFCN (Absolute Radio Frequency Channel Number) channel
number n=ARFCN =975-1023 so as result the absolute frequency could be calculated by
the formula that is given as under
Downlink: F (DL) = (935.2 + 0.2*(n-1024)) MHz,
Uplink:
F (UL) = (890.2 + 0.2*(n-1024)) MHz
[14]
Higher values are selected in order to avoid from collapse between ARFCN and DCS
1800 system.
2.9) Digital Communication System 1800 :In DCS 1800 uplink and downlink allocations are as under
Uplink (1710.2-1785 MHz) and
Downlink (1805.2-1880 MHz).
In DCS 1800 the frequencies n=ARFCN=512-885 absolute frequency can be calculated
by using the following formula shown as under
For the downlink: F (DL) = (1805.2 + 0.2*(n-512)) MHz
For the uplink:
F (UL) = (1710.2 + 0.2*(n-512)) MHz [14]
18
Chapter 3
THEORY
Wireless radio channels are hard to predict because mobile radio channels have a random
behavior unlike the stationary line of sight channels. When we are considering wireless radio
channels we have to consider all the factors in to account that transmission path could be in line
of sight or could be obstructed with objects like buildings, mountain etc. In contrast to wireless
channel Wired channels are reliable and they are easy to predict. When we are considering the
case of wave propagation in urban environment then we have multiple reflection from high rise
buildings and many such types of objects under these circumstances electromagnetic waves travel
through different paths having varying lengths when these waves interact at a point when
received it generates multipath fading, Due to these factors the received waves have varying
strengths and also depends on the distance between transmitter and receiver.
Fig 8: Path Loss illustration between transmitter and receiver
3.1) Propagation Models:There are different models to calculate the path loss especially for outdoor environments.
Some of them have been modified to be used for monitoring indoor propagation also. But
none of them have been accepted as standard, It depends on what scenario we are
calculating and also depends upon the reading that we get from the calculation. Many of
the papers have adopted the hit and trial rule to figure out the best model that meets their
requirements.
19
3.1.1) Free Space Model
Path loss between transmitter and receiver plays a vital role when we are doing link
budget calculation. This formula is valid up to a distance of 55m [13] it does not take in
to account any clutter loss or reflections [13]. Free space loss formula is given as under:Free space loss=32.5+20(log(f))+20(log(d)) [12]
f=Frequency (MHz).
d=Distance (km).
3.1.2) Keenan-Motley model:In contrast to the losses that we account between the medium of transmitter and the
receiver there are other losses too that play a vital role when we focusing indoor
environment like floor separation penetration losses due to walls hence the complete loss
could look like this
Path loss=free space loss+ wall loss [13]
Hence the Keenan Motley model is given as under
L(db)=32.5+20(log (f))+20(log(d))+K+ P*W(k)+k*F(k) [13]
L=path loss (db).
F=frequency (MHz)
d=transmitter to receiver separation (km)
K=number of floors transverse by direct wave.
F=floor attenuation factor (db)
P=number of walls transverse by the direct wave.
W=wall attenuation factor (db)
But the simplified form of the model is known as IB model using walls only which is
given by
900MHz: L(db) =91.5+20*log((d))+P* w(K) [13]
1800MHz: L(db)=97.6+20*log((d))+P* w(K) [13]
20
IB model has been designed for two different frequencies. IB is more convenient to use.
They are rather much simple to implement. Some efforts have been done in this thesis
that lead to modification of IB model which provided a successful integration to 380MHz
in this model. simply by amending the constants of the formula by substituting the
frequency and adding it with the constant 32.44 we can use the same formula for Tetra
frequency and it generates results that meets our expectations. The modified form of the
Keenan Motley for 385MHz is given as under:385MHz: L(db)=84.1+20*log((d))+P*W(k).
3.1.3) Path Loss Slope Model:Another model used to calculate path loss in indoor environment is the PLS model.PLS
are attenuation slopes that are obtained from different indoor environments by
performing large amount of measurements [12]. PLS model obeys the distance power law
model as described in log distance model
PL(db)= PL(do)+10*n*log((d)) [13]
Where the PL(do) is the path loss that is measured at 1m distance which is given by
(32.5+20log(f)+20log(d)) where n is the PLS coefficient n is different for different indoor
environments.
3.2) Curve Fitting:Curve fitting is the process of formulating a mathematical function that can generate best
fit to the measured data points [18]. In this process we could use two types of procedure
one is the interpolation, in this process the exact fit to the data points is required and the
other process is called the smoothing procedure. In smoothing the main target is to
construct a smooth function that can fit to the data points smoothly. One of the close
topics in this regard is the regression analysis which focuses more on the statistical
interference the main aim is to analyze how much deviation is present in between the
curve that is required to fit with the measured data having Radom errors. Curve fitting
works by finding sum of squares of vertical errors as shown in the figure below.
21
Fig 9: Vertical Residuals. [18]
Now we are going to consider an example
Fig 10: Sample points curve fitting on straight line [24]
We denote values as (x,y) and consider the points on the fitted lines as (x,f(x))
Summing error at four data points results the following equations.
[24]
In this case we are considering straight line so we can substitute f(x)=ax+b
As in this technique we already know that the best fit line has minimum points between
the curve line and the actual data points.
22
[24]
To minimize squares of errors following methoud could be adopted
[ 24]
In order to find the minimum value of function we can take derivative of the slope and
setting it to zero. So derivate of the error with respect to a and b are taken and letting it to
zero.
[24]
[24]
Rewriting both the equations
[24]
[24]
To find value of a and b we use use Gaussian elimination
[24]
[24]
X=A-1 *B
23
3.3) Local Mean:In order to figure out the propagation path loss it is important that proper distance interval should
be known that can enable long term or local mean values that could be attained from the received
signal strength of the data. There are two main methods through which the local mean could be
founded out
1) Median approach
2) Mean approach
We have focused on the mean approach so we will give a brief account of that method
A) Mean Approach:In the mean approach the local mean value could be estimated by the help of Rayleigh fading
effects r(y)=m(y)r(y)
X+L
X+L
m(x)=1/2L
∫
∫
r(y) dy =1/2L m(y)r(y)dy
X-L
X-L
Under this assumption that m(y) is the true local mean and r(y) is a stationary Rayleigh process
with unit mean
m(y)= constant
x-L<y<x+L
the estimator then becomes
X+L
m(x)=1/2L
∫ m(x) r(y) dy = m(x)r(y)
X-L
24
Where r(y) should approach 1 when m(x) approaches to m(x).
Fig11: local mean view on FSH viewer
25
CHAPTER 4
Introduction to Indoor Coverage
As we are moving from second generation to third generation voice and data demand is
increasing and due to this fact demand for wireless infrastructure have become prominent
.Indoor coverage is gaining importance in today’s world, as most of the voice traffic is
generated by the indoor users according to a research that 80% of the traffic is generated
by the indoor users [13]. There are a tremendous amount of challenges from business and
technical perspectives that are considered when one is planning and implementing indoor
coverage that should focus future proof solutions. For indoor radio planners it is essential
that they should not only focus on the technical challenges ahead but they should try to
fill in the room of any need that is going to come in their way in future.
Fig 12: - Basic concept indoor coverage in the home [29]
Indoor coverage is normally provided by outdoor macro cell. In contrast to macro cells
Femto/Pico cells solutions are also available which could be used. A femtocell is a small
cellular base station, typically designed for use in a home or small business[27] where as
A picocell is a wireless communication system typically covering a small area, such as
in-building (offices, shopping malls, train stations, etc.), or more recently in-aircraft. A
Pico cell is analogous to a Wi-Fi access point [28]. Femto cells are preferred to be used in
those places which have a limited setup like in small offices environment which have
limited number of users in this way power consumption by the base station could be
26
scaled down [6]. Pico cells are used as an alternative where Femto cells fails to provide
full coverage and capacity requirements. One of the options may be to use repeaters.
Repeaters are commonly used in underground tunnels and roads. Prime task of repeaters
is to amplify the received signal and transmit it to the covered area. Under this stragedy
mobile receives a better signal. Repeaters could also be used with DAS (Distributed
antenna system) setup to amplify the received signal focusing the indoor users. It is seen
that when repeaters are used with DAS setup there is an improvement in coverage,
capacity, and gain in SIR and in uplink and downlink power.
Fig 13: - Femto cells and repeater used with DAS [6]
Some of the difficulties which a network designer may face which are briefly stated as
under:1) In contrast to the free space loses signal might face penetration losses too as it passes
to and from the building.
2) HSDPA and HSUPA offers higher data rates but to support this it requires good RF
link conditions
27
3) Buildings having multiple coverage from different base stations have better coverage.
But a problem arises when we have UMTS users that are being served by more than one
macro BS when they enter in soft handover then it creates a lot of interference issues
which might also create load on the network [13].
4.1) why in building coverage is important:There are many factors that are dependent both on technical and commercial bases that
makes indoor coverage really important some of the reasons that make indoor coverage
really important are, to increase the coverage capacity so reduce the network load on
existing macro outdoor network. To offer higher data rates to the users. In fact that above
mentioned facts are important but before you deploy any sort of indoor network it is
really important that you should evaluate building thoroughly, that which type of
deployments is feasible, and what should be the cost per user etc. These factors are
considered in business evaluation. This sort of evaluation is normally carried out by using
standard tools, templates and metrics in order to secure valid comparable business case.
4.2) Indoor coverage business point of view:When considering the case for UMTS, power load per user is an important factor. The
higher the power drain from the base station the higher the capacity drain from the base
station per mobile user will be [13]. As a result there will be high production cost for
indoor traffic for UMTS trying to accommodate users inside the building by using the
macro base station from outside [13]. On the other hand there is one more factor that
should be considered. By deploying the indoor network the strain on outdoor network
would be reduced and one more factor that should be considered is that the outdoor
network must overcome high penetration loss about (20-50db). By the help of in building
coverage you can reduce the production cost per call minutes or MB and can also reduce
the noise increase in the network. According to the estimate by using the In Building
coverage there would be a reduction of about 50-70% on production cost per call per
minutes [13].
4.3) Basic’s of indoor planning:4.3.1) Isolation:Isolation plays a key role in indoor signal analysis. Isolation is basically defined as the
difference between two signal levels i.e. signals level outside to the signal level inside.
One of the alternative ways to consider the isolation phenomena is that the dominance of
the indoor network should be high as compared to the outdoor macro network when an
indoor user is at the boundary of the building. If isolation is good then unwanted
interference may not rise that causes deteriorate of the wanted signal level
28
4.3.2) Tinted windows:Now a day’s indoor signal are secured by interfering to the outdoor signal by the help of
metallic coated film that typically attenuates the signal by about 20-40db [13] depending
on the radio frequency. WIFI proof glasses and walls are also available which usually
help to reduce the WIFI signal from been leaked outside the building so that risk of
hackers outside the building using laptops and camping on the indoor networks could be
reduced [13]. By using isolation glasses the signal level could be reduced by 40-70db,
this sort of isolation the nearby macro site could be shielded and as a result the Omni
directional antenna could be used. In this way the handover zone is easy to design so
there is no leakage between outdoor to indoor networks. Hand over zone could be
designed really close to the building. So as a result the indoor network could not service
the outdoor network or leaky interference outside the building.
4.4) Brief overview of Active and Passive DAS:Indoor coverage setup consists of hubs repeaters and multiband antennas. Main focus of
all the components is to ensure that coverage is perfect. Distributed antenna system of
any category shows better performance as the power requirement for both the mobile and
the base station is reduced.
Fig 14: - Indoor coverage is using Distributed Antenna System [6].
29
This sort of infrastructure includes a distributed antenna system (DAS). Two types of
distribution strategy that is available in indoor coverage solutions.
1) Active DAS.
2) Passive DAS.
There is a major difference between the active and passive distributed antenna system.
Active systems use power to transport the RF signal, passive systems do not use power to
amplify or convert the RF signal and require only cables and antenna to operate.
4.4.1) Difference between Active and Passive Das:This thesis doesn’t focus on performance analysis of different antenna technologies and
its distribution criteria but we will briefly introduce an overview on active and passive
distributed antenna system. There are different ways through which one can provide
indoor coverage focusing that the coverage is uniformly distributed. Some of the ways
that are famous is the active and passive distributions or by using the hybrid solutions.
One should focus that different solutions have different impacts on the coverage this
means that some solution might prove to be better for one strategy and might prove to be
less efficient for the other. Thus this all is dependent what sort of building you have and
how large budget is allocated to provide the sufficient coverage.
Distributed antenna system comprises multiple antenna that are capable to cover
1858.060sqm and they are distributed in the desired building in a way that they could
uniformly cover desired area practically low powered equipment is connected to long
cables. As I have mentioned above that there are two branches in distributed antenna
system namely active and passive DAS. Main disadvantage of the passive das system is
that the losses accounts in the transmission are higher as compared to the active DAS
system. It also increases loss power near the distribution antenna, increases noise figure
in base station at higher frequencies when used for HSPA/UMTS. . Normally for the
passive systems the loss is higher .Passive system is mostly feasible in harsh environment
i.e. (dust, moist) etc
30
Fig 15: Passive DAS system [6]
Active system uses power to transport RF signal from the equipment to the end points.
Active system is easily installed as it comprises of cabling, optical fiber and IT types of
cables. As a result the installation work is easily done, as compared to the passive das
system, it does use rigid cabling. In active system uplink and downlink amplifier are
located close to the installed antenna. The main reason for this type of installation is to
avoid excessive transmit power and permit easy cabling from the base station. As a result
the system is configured for low to medium power from the RU unit. Figure below shows
active DAS setup.
Fig 16: Active distributed antenna system [6]
31
CHAPTER 5
Measurements
In order to perform measurements we have chosen different equipments to meet
measurement requirements. We have taken Wireless@KTH fourth floor as our
measurement area this department is located in Electrum. Electrum was inaugrated on
1987. Address of Electrum is Kistagången 16, 16440 Kista.
Fig17: Electrum picture and location map [25].
32
Fig18: Satellite image of Electrum building Kista courtesy Google Map
some measurements is also done in Skatteverket Tax office building in Solna, but major
focus of the thesis is at Wireless@KTH department I placed transmitter in adjacent
building .The cross sectional distance between the transmitters and received was roughly
25 metres with LOS. Distance varies depending on the spots that have been considered to
be observed for the measurements. Measurements have been focused up to 55 metres,
The environment that have been chosen corresponds to the typical office environment
.Selected environment have moderate amount of obstacles that come in between the
transmitter and the receiver. The nature of obstacles that have normally been encountered
is glass, semi glass and light wooden or plaster walls. In front face of the corridor we
have windows. In each of the room window have a tinted coating that produces
33
attenuation in the received signal level as observed through the measurement results. The
floor plan is being illustrated in the figure below:-
Fig 19: Measurements floor plan Wireless@KTH (ELECTRUM).
Some generalize comments which make the selected building common to other office
buildings are:1: More and more offices are open space and part of the office consist of cubicles, This
object should be considered as open to moderate dense are with regards to PLS
coefficient.
2: Windows in such new buildings effectively attenuate the signal and limit influence from macro
base stations, inside the building there are more often plaster walls together with an open
architecture.
“I would say that this building architecture is very common nowadays” (Tod Sjölund)
(MIC Nordic AB).
Some snaps of the corridor are shown in the figure where we have been taken
measurements.
34
Fig20: Wireless@KTH/COS department fourth floor (Electrum)
The stragedy has been to characterize the outer wall and also to measure where people usually are
in the building distances between the transmitters and receiver is varied on random basis. I have
taken one measurement point by opening the front window and then the second point by closing
the window to measure the attenuation level, this procedure is only repeated for the front
windows not for all chosen measurement points. At least 10 to 12 readings were taken. Due to
some practical reasons it has been difficult to do more measurements it is believed to be sufficient
to configure the characteristics of received signal at different frequencies In order to visualize the
results and to do model tuning.
As in the Fig :19 the placement of the transmitter is shown in adjacent building the window of
that block faces the roof top that is roughly 25m from the corridor where we actually took
35
required measurements. The receiver is moved in the adjacent corridor there are no specific
measurements points that we have chosen. The spots are chosen more or less are random. One
more fact that the these measurements are not focused to limited distance, the max distance that
we have measured is up to 55m and there is no specific focus on line of sight readings.
Following locations are considered for measurements:1) Swedish tax department facilities in Solna.
2) Electrum (Building in Kista)
In summary there are three phases in which measurements were carried out.
A) Measurements for 385MHz at Electrum
B) Measurements for 900/1800MHz at Electrum
C) Measurements in Tax office building Solna
5.1) 385 MHz Measurement Strategy:In this phase, measurements for 385MHz frequency range was carried out to
investigate Tetra Technology. As a result we used a classical signal generator (HP
8640B) which was used to generate the CW signal.
Fig 21: Hp 8640B (Signal generator) and MARS MA-CQ26-1X (Antenna)[19][20]
A broad band indoor antenna by MARS was used at the transmitter and receiver ends. HP
series spectrum analyzer 8590 was used to analyze the signal at the receiver end. The
procedure to tune the spectrum analyzer is like other spectrum analyzer that we used
earlier HP-FSH3 but the most important thing that needs to be mentioned here is the
variation in the received signal level. Due to fading and scattering of the received signal,
it has varying amplitude. As a result this sort of signal level is not feasible. Local mean
of the received samples were taken in order to jot down the correct data that were attained
at the correct location.
36
Fig 22: Rhode and Schwarz Fsh3 and HP 8590 spectrum analyzer [19][21].
Fig 23: Sample setup for 385MHz measurements
37
Fig 24: TEMS tool kit interfaced with PC acts as a receiver unit.
In Rhode and Schwarz spectrum analyzer local mean method is built-in so we need to
save the data and reload it in Fsh3 viewer in order to recover the data point the exporting
procedure of the data points have been mentioned in appendix A
5.2) MEASUREMENTS FOR 900MHz /1800MHz:In the second phase measurements for GSM 900MHz and 1800MHz have been
conducted. In this series of measurements HP 8922 GSM test instrument that can
generate 900MHz and 1800 MHz signals have been used. in the second phase different
approach is utilized to receive the desired signal. TEMS investigation 10.1 professional
tool kit is used to investigate the received signal level.
Fig 25: HP 8922 signal generator for 900MHz and 1800MHz [21]
Different channels numbers have been selected to check the received signal level. For
GSM 900MHz we used channel number 979 and for GSM 1800MHz used channel
number is 787.Specific channels on the downlink band have been chosen so that focus
on the selected stuff is paid more attention rather whole band needs to be scanned .
38
TEMS software on the PC records the data in log files these log files are saved in
different format. In this project the log files generated by TEMS is converted to text
format and then we have imported the data in to excel sheet in order to attain the mean of
the received samples. Same procedure is repeated for both 900MHz and 1800MHz
frequency measurements.
We have to calculate mean of the received signal due to the reason because TEMS
investigation tool kit does not generate the local mean as we could attain in our first
phase of measurement in the spectrum analyzer. Some of the procedure is presented for
convenience. First of all we have to set up the scanning procedure in TEMS investigation
software. Once we have stared recording the scanning of the RSSI signals, figure below
shows how it look like the channel that we have focused for illustration is GSM
1800MHz.
Fig 26: scanning procedure in TEMS investigation software
Once the scanning is over, depending on how long you want to scan you can press stop
scan and save the log file. After that you can disconnect the device which will enable the
open log file menus option. Select the log file on which you have done the recording.
You can then choose the export log file option present in the log file menu see appendix
A for detailed procedure.
39
Practical Measurement Method:Different measurement procedure was adopted in order to observe the fast fading process.
We have generally moved the antenna clockwise and anticlockwise in random directions
in order to jot down accurate readings. If we would have kept Antenna static then we may
come across too few samples of received signals. Antenna was moved in random
directions and the received signal samples were recorded. We applied local mean
procedure in order to calculate the accurate measured signal level.
Fig 27: recording received signals by moving antenna randomly
5.3) MEASUREMENTS VERIFICATIONS:Measurement verification are important because they give us an estimate, to how much
extent we are close to the value that we have obtained through the measurement. And one
more important factor is that we get an idea that which component generates much loss as
a result we can also calculate the resultant received signal by the help of link budget
equations.
Link budget equation is used in order to calculate the loss that is attained between the
transmitter and receiver at a separation of 2 meters. We have free space formula given as
under:Free space (db) =32.44+20*(logF) +20(log (d)) [13]
d=distance (km).
f=frequency (MHz).
40
Fig 28: Basic setup diagram to calculate the path loss
Loss obtained at 2m distance for 385MHz .
5.3.1) Verification for 385MHz:By substituting the values in the free space formula we got following answer:By our observation we have -11dbm measured received level
So we will verify it
Tx power=20dbm
Antenna gain per antenna =1dBi
Transmit cable loss=-0.6db
Receive cable loss=-0.1db
So we can simply do the mathematics to figure out the final result:Rx Level=20+2-0.6-0.1-30.16= -8.9db approx -9dbm (through formula)
Measured value= -11dBm
5.3.2) Verification for 900MHz:Now we will consider the case for 900MHz
41
We have following parameters
Transmitter power=-20dbm
Antenna gain at the transmitter=1dbi
Transmit cable loss=-2.4db
Receive cable loss=-2.34db (TEMS cell planner antenna)
So by using the free space loss formula
Rx Level=-20+1+0-37-2.34= -60.74dbm
And the value that we have measured through TEMS Investigation is -61dB.
5.3.3) Verification for 1800MHz:same procedure is repeated for 1800MHz
We have following parameters
Transmitter power=-20dbm
Antenna gain =1dbi
Transmit cable loss at transmitter=-2.4db
Receive cable loss=-3.46db (TEMS cell planner antenna)
So by using the free space loss formula
Rex Level=-20+1-43.52-3.46-2.4=-68.38dbm
And the value that we have observed through Tems Investigation is -71dbm.
5.3.4) CONCLUSION:Hence we can see from the results stated above that the equipment behaves well.
Measured levels are within 2-3 db.
42
5.4) Measurement results from skatteverket:As mentioned in previous section that some of the measurements were done in
Skatteverket building which is located in Solna. For measurement underground parking
lot and the entrance floor were selected. Figure below shows the two floor plans.
Fig29: - Entrance floor plan Solna tax office (courtesy Skatteverket)
43
Fig30: - Parking floor plan (courtesy Skatteverket)
In these measurements the tools used were different. Hand held test sets were used one
for GSM technology and other for Tetra. One of the difficulties that i faced there was we
were not able to locate where the transmitter was as a result we have taken a rough
estimate of its location. Two sets of measurements were taken one in the entrance hall
and other the parking lot of the building.
44
CHAPTER 6
Results Conclusions
This chapter is focused on the result and conclusion that have been drawn by
measurement and simulation results. Major task of this thesis is to figure out the
characteristics of propagation loss in indoor environment focusing on GSM 900MHz,
GSM 1800MHz and Tetra 385MHz. One thing that needs to be mentioned in this section
is that the measurements are not focused to some limited distances neither they are in line
of sight between transmitter and receiver. Measurement points for 385MHz 900MHz and
1800MHz are given in the plot as under which we may call as cluster plot.
Fig 31: cluster plot measurement points for 385MHz 900MHz and 1800MHz
45
6.1) Path Loss Model for GSM 900MHz and GSM 1800MHz:First some conclusions are drawn on PLS model [13]. This conclusion is based on
1800MHz, 900MHz and 385MHz .Figure below shows the plot for PLS model. PLS
curve is drawn for coefficient value r=36 if we choose some value that is lower than this
then we get some of the points that are in outage in order to avoid this scenario selected
value of of r is 36.
PLS model for 1800MHz with Curve Fitting
105
100
y = 0.8*x + 53
Path loss db
95
90
PLS r @ 36
85
80
measured data
curve fit
PLS r @ 36
75
70
25
30
35
40
Distance m
45
50
55
Fig 32: PLS model with curve fitting for 1800MHz at r =36
In the figure below PLS graph for 900MHz is shown the value that give a better result is
found to be at r=33.7. Attenuation loss is bit less than 1800MHz hence at this value the
coverage is guaranteed and the probability of outage is less.
46
PLS model for 900MHz with Curve Fitting
95
90
y = 0.66*x + 50
PLS r @3.37
Path loss db
85
80
75
70
measured points
Curve Fit
PLS r @3.37
65
60
25
30
35
40
Distance m
45
50
55
Fig 33:- PLS plot for 900MHz at r=30
It is evident from both of the figure that loss at 1800MHz is higher as compared to
900MHz. figure below shows the PLS plot for 385MHz.
PLS model for 385MHz with Curve Fitting
80
PLS r @ 3.1
y = 0.44*x + 50
Path loss db
75
70
65
measured points
Curve Fit
PLS r @ 3.1
60
55
25
30
35
40
Distance m
45
50
55
Fig 34: PLS plot for 385MHz at r=22.5 with curve fitting
Figure below shows the combined plot of three different frequencies with diffrenet PLS
coefficients
47
PLS model for 900MHz,1800MHz and 385MHz
105
100
PLS r @3.6
95
Path loss db
90
PLS r @ 33.7
85
80
PLS r@ 31
75
70
65
25
30
35
40
Distance m
45
50
55
Fig 35: PLS plot for 385MHz 900MHz and 1800MHz
But in this thesis none of the values given in the table are found to be feasible for my set
of measurements. As a result I have done my own analysis in order to produce the
estimate that best resemble the measured data.
Indoor Environment
Open Environment few
RF obsticles,convention
centre
Moderate open
Slight dense
Moderately dense
Dense Environment
Newly discovered value
FREQUENCIES
900MHz
1800MHz
3.37
3.01
3.5
3.61
3.76
3.94
NIL
3.2
3.31
3.48
3.81
3.6
Table 1: values for PLS for different environments [6]
48
385MHz
3.1
6.2) Free Space Propagation Model:Free space model is valid for all the frequency ranges that I need to analyze in my project
the graph below shows final result of the free space model. Figure below shows the plot
for free space model for 1800MHz.
Free Space Plot with curve fitting for 1800MHz
100
y = 8e+002*x + 53
95
pathloss db
90
85
80
measured data
Curve Fit
Free Space
75
70
65
0.025
0.03
0.035
0.04
distance km
0.045
0.05
0.055
Fig 36: Free space model with curve fitting for 1800MHz.
Free Space Plot with curve fitting for 900MHz
90
85
y = 6.6e+002*x + 50
pathloss db
80
75
measured points
Curve fitting
Free Space model
70
65
60
55
0.025
0.03
0.035
0.04
distance km
0.045
0.05
Fig 37: Free space model with curve fitting on 900MHz
49
0.055
Above graph shows path loss at 900MHz with curve fitting applied on it the level of
attenuation is relatively less as compared to 1800MHz.However there is a fixed loss of
about 6db moving down from 1800MHz to 900MHz.Figure below shows the path loss
that is attained at 385 MHz which is relatively less than the path loss that have been
attained at 1800 MHz and 900 MHz if we analyze it we can see that It obeys the rule that
their is a loss of 6db with each doubling in frequency. Value attained at 385MHz is
roughly 6db less as compared to 900MHz and 1800MHz is 6 db higher than 900MHz.
Fig 38: Free space loss with curve fitting on 385MHz
The collective result of free space model is shown in the graph below that focuses the
curves that are attained at different frequencies.
50
Free Space Plot for 385MHz 1800MHz and 900MHz
75
1800MHz
70
pathloss db
900MHz
65
60
380MHz
55
50
0.025
0.03
0.035
0.04
distance km
0.045
0.05
0.055
Fig 39: Free space model at 385MHz 900MHz and 1800MHz.
6.3) Keenan Motley model:Graph below shows the modified KM model plot for 1800 MHz frequency with curve
fitting we can see that the attenuation per wall is set to about 9.5db.
kenen motely plot for 1800MHz
115
110
y = 8e+002*x + 53
105
100
pathloss db
95
90
85
80
data points
curve fit
75
Kenan Motely Model
70
65
0.025
0.03
0.035
0.04
distance km
0.045
0.05
Fig 40: Keenan motley curve fit for 1800MHz
51
0.055
In the figure below we can see the path loss for 900MHz have gone 6db down as
compared to 1800MHz. In this observation four walls have been taken in to account in
order to produce the ideal fit and to ensure the proper coverage we have chosen the value
of attenuation per wall to be 8db for 900MHz.
Fig 41: Keenan Motley model curve fit for 900MHz
The modified Keenan Motley model for 385 MHz shows the best result. It shows the
least loss for the four walls that we have taken in the observation. Slight modification is
made to this model in order to make it compatible for 385MHz. The model adjustment is
done so that proper coverage is ensured and there might be no uncovered areas. In
385MHz attenuation taken per wall is 6.5db and path loss is 6db less then
900MHz.modification done is mentioned in chapter 3.
52
Fig 42: Keenan Motley model for 385 MHz
The plot below shows the cascaded version of the Keenan motley plots that focuses all
the three frequencies. we can conclude from the figure below that under the scenario that
have been considered or the place where we have conducted our measurements for such
types of layout Keenan motley model for 385MHz produce much better result. We can
observe from the figure below that there is an increase of 6db in each doubling of the
frequency.
Fig 43: Keenan Motley plots for 385MHz 900MHz and 1800MHz
53
According to the expectations the attenuation level of 385MHz is the lowest and
1800MHz is the highest
6.4) Comparison between different models:In this section Comparision of different models are going to be done and then we can
figure out which model is most appropriate or could be used in moderate office
environment. The figure below shows the graph between two different models namely
Keenan motley and free space model. First we are going to compare two models that are
compatible in distances because we can’t compare PLS model with it because it takes
distance in meters. In the figure below we have compared Keenan Motley model with
free space model the figure shows clearly that free space model is more feasible as
compared to the Keenan Motley its evident from the figure that the typical loss between
different frequency range increases by 6db per doubling of the frequency. If i focus free
space model at different frequencies it’s clear that increase of attenuation loss is
symmetric and it is more or less 6db.
kenen motely and free space plots for 385MHz 1800MHz and 900MHz
120
110
100
pathloss db
1800MHz
90
900MHz
80
1800MHz
385MHz
900MHz
70
385MHz
60
50
0.025
0.03
0.035
0.04
distance km
0.045
0.05
0.055
Fig 44: Comparison between Keenan Motley and Free Space Plots
6.5) Comparison of Path Loss slope with Keenan Motley and Free Space
Model:If we analyze all the three results produced by all the three models we can see that free
space model generates least loss and following it comes the path loss model and in the
end comes the Keenan motley model but with free space model there is an issue that it
cannot provide good coverage inspite of least loss. So it is clear that PLS model with
54
tuned coefficient gives the best result then afterwards in terms of coverage comes Keenan
motley model and in the end comes the free space model.
6.6) Slope Equations:Equation of the slop based on different frequencies and different models that we have
tested for our measurements.
S.NO
1
2
3
Frequencies
1800MHz
900MHz
385 MHz
Equation
8e+02*x+53
6.6e+02*x+50
4.4e+02*x+50
Table 2: Slope Equations
By analyzing the curve fit equations I can draw some general conclusions. We for simple
illustration consider PLS model for 900MHz at 40 meters distance in Fig: 33 we have a
path loss value of 86db .At same distance we have 76.4db on the curve fit line that is
produces by matlab so there is a gross difference of 9.6db between both of them .Chosen
value of PLS coefficient result in a better coverage scenario without any outage
problems. While the curve fit remain low for all the measurement points but it has most
of the points that are in outage so good service is not guaranteed. In free space for
1800MHz at distance of 40 meters in Fig 36 Path loss through the curve fit is 85db. And
if we focus at same distance Free space model gives 68db so there is a difference of 17db
if we analyze that free space model generates less path loss as compared to the curve
fitted model. But there is a trade off that we can see , free space model lacks all the
measurements points above it as a result if we adopt it for the coverage scenario then we
get bad coverage we can see similar situation if we focus 900MHz case with little bit less
loss. In the same way we can use the slope equations and can calculate the values for
different models at different frequency and can evaluate the results by comparing it to the
selected models.
55
Table below shows the measurements results that are attained at Skatteverket building.
Received signal levels in Solna Tax Office Building Entrance Floor
Receive
level
S.NO
Technology
(dbm)
Attenuation
2
GSM 900MHz
3
GSM 900MHz
4
GSM 900MHz
5
GSM 900MHz
6
GSM 900MHz
7
GSM 900MHz
Average Attenuation(db)
S.NO
Technology
2
Tetra 380MHz
3
Tetra 380MHz
4
Tetra 380MHz
5
Tetra 380MHz
6
Tetra 380MHz
7
Tetra 380MHz
Average Attenuation(db)
-86
-79
-85
-86
-91
-84
-19
-6
-10
-16
-25
-9
-12.14
Receive
(dbm)
-81
-78
-82
-79
-89
-74
level
Attenuation
-17
-2
-8
-8
-26
-11
-10.28
Received signal levels in Solna Tax Office Building (Parking Lot).
Receive level
S.NO
Technology
(dbm)
Attenuation
2
Tetra 380MHz
-127
-27
4
Tetra 380MHz
-102
-25
5
Tetra 380MHz
-93
-30
Average attenuation (db)
-27.33
S.NO
Technology
Receive level
(dbm)
1
GSM 900MHz
-95
-30
3
GSM 900MHz
-101
-28
4
GSM 900MHz
-104
-34
Average attenuation (db)
Attenuation
-30.66
Table 3: Signal attenuation levels at different floor plan of solna tax office
56
After analyzing the received signal level it’s clear that the average attenuation level for
380MHz and 900MHz for entrance floor is found to be -10.28db and -12.14db. We can
also see attenuation loss at parking lot for 380MHz and 900MHz it is found to be –
30.66db and -27.33db respectively, so its clear that 900MHz produces more loss as
compared to380MHz. On the other hand floor separation loss is found to be -16.5db for
900MHz and -15.3db for 380MHz
57
7 Conclusion and Future work
7.1) Conclusion
In this section we can draw conclusions from measurement and simulation results. PLS
model generates best result as compared to Keenan motley and Free Space model. It has
been observed that free space model produces less path loss but it provides poor coverage
prediction as a result major drawback with this model is, we get really less attenuation
loss but at the same time if we implement this model then we get a lot of outage and bad
coverage problems. On the other hand Keenan Motley model produces better result in
terms of coverage prediction but it ends up with higher attenuation loss as compared to
Free space and Path Loss model so it’s also not a feasible choice. if we narrow down the
canvas towards Path Loss model it can be visualize that it produces less loss then Keenan
Motley model and provides same coverage prediction as KM model while the loss is
higher than free space but it’s no use because free space doesn’t provides good coverage.
So from our measurements and calculations results we can say that for typical office
buildings that are now a days common in Sweden this work recommends PLS model as
feasible choice for modeling indoor characteristics. One more thing that PLS coefficient
used in this thesis were bit modified, which were used to get desired results. So there is
flexibly in this model it could be altered by playing with PLS coefficient. The newly
discovered PLS coefficient for 1800MHz is r=36 for and for 380MHz r=31 while for
900MHz it is found to be the same as in standard table r=33.7.so its first time that a new
value of PLS for 380MHz range has been defined while earlier it existed for 900MHz and
1800MHz. on the other hand the modification made on the IB model related to 380MHz
also generates feasible results that meet our requirement. Maximum and minimum values
attained using different models are shown in the table below.
S.NO
1
2
3
Frequency
1800MHz
900MHz
385MHz
Path
Loss(db)
Min Max
88.33 100.4
80
90
69.45
77
Keenan
Motley (db)
Min
67
60.46
53.06
Max
110.2
98.15
84.75
Free
Space(db)
Min
73
66.58
60.46
Max
96.2
85.64
73.76
Table 4: Maximum and Minimum values with respect to Models
Following figure shows different level of coverage at different values of PLS coefficient
(r)
58
PLS model with 50% coverage for 385MHz
PLS model with 25% coverage for 385MHz
80
75
PLS@ r=2.83 50% coverage
70
Path loss db
Path loss db
75
80
65
60
55
25
70
PLS r @ 26.3 for 385MHz
65
60
30
35
40
Distance m
45
50
55
25
55
30
40
Distance m
45
50
55
PLS model with 50% coverage for 1800MHz
PLS model with 0% coverage for 385MHz
80
100
75
95
70
90
Path loss db
Path loss db
35
65
PLS r@ 19.8 for 385MHz
PLS r @ 28.7 for 1800MHz
85
80
60
75
55
50
25
70
25
30
35
40
Distance m
45
50
30
95
95
90
90
PLS r@ 25.7 for 1800MHz
45
50
55
85
80
80
PLS r@ 23.7 for 1800MHz
75
75
70
25
40
Distance m
PLS model with 0% coverage for 1800MHz
100
Path loss db
Path loss db
PLS model with 25% coverage for 1800MHz
100
85
35
55
30
35
40
Distance m
45
50
55
59
70
25
30
35
40
Distance m
45
50
55
PLS model with 50% coverage for 900MHz
PLS model with 25% coverage for 900MHz
90
90
85
85
PLS r @ 28.1 for 900MHz
Path loss db
80
75
PLS r @ 26.4 for 900MHz
75
70
70
65
65
60
25
30
35
40
Distance m
45
50
60
25
55
30
35
40
Distance m
PLS model with 0% coverage for 900MHz
90
85
80
Path loss db
Path loss db
80
75
PLS r @ 21 for 900MHz
70
65
60
25
30
35
40
Distance m
45
50
55
Fig 45: PLS plots for different coverage scenarios for different PLS coefficient
60
45
50
55
Table below summarizes the value of PLS coefficients that are varied in order to show
coverage range at different frequencies.
S.NO
1
2
3
Frequency
385MHz
900MHz
1800MHz
100%
22.5
30
36
50%
18.4
24
28.7
25%
16.9
22.2
25.7
0%
11
16.5
23.7
Table 5: coverage range at different PLS coefficient for 385MHz 900MHz and 1800MHz
7.2) Future Work:Some of the suggested future work that would be in great interest and in extension of this
thesis might be:
1) Some more analysis of lower level frequencies should be tried like Tetra
frequency range used in this thesis as less work is done on Tetra frequencies range
especially focusing on indoor coverage.
2) Some more indoor models should be used like the modified IB model that have
been used in this thesis.
3) Different indoor scenarios could be tried to study the behavior of indoor models
and characteristics of frequency.
4) Some more work could be done to study the materials like some offices have
lower height cubical as we saw in tax office buildings, some have more glass
interior i.e. glass walls instead of solid walls some have mixture of both so all
these types of environments must be tested to draw a generalized result. These
results could be used as a reference for case study for such types of indoor
environments and more measurements could be avoided.
5) Some more measurement data needed to secure statistics (due to some unexpected
problems with the equipment the number of points turned out to be lower than
originally planned)
61
References
[1] Introduction to Tetra Technology ET industries http://www.etiworld.com/tetra.pdf
[2] Risto Toikkanen “Tetra radios for harmonized disasters communications Nokia & TETRA
MoU Association” 2nd Tampere conference on disaster communications
Inc 2001
www.reliefweb.int/telecoms/conference/cdc2001/RT.ppt.
[3] Comparative study of path loss propagation measurements at 450MHz,900MHz,1.35MHz and
1.89GHz in the corridor of a multifloor laboratory office building IEEE,1999
[4] Wikipedia contribution “terrestrial trunked radio” the free encyclopedia
http://www.en.wikipedia.org/wiki/Terrestrial_Trunked_Radio
[5] Dr Ashok Chandra Comparative study of 900 MHz and 450 MHz radio signals propagation in
an indoor environment IEEE.
[6] Asher Ali Bajwa. “Investigation on radiation conditions using active DAS compared to
passive DAS” , Cos /Ict/Kth Master thesis 2008.
[7] Tetra group industries. “Tetra healthy and safety information” www.tetramou.com
[8]Jose Manuel Martin “An introduction to tetra
www.tetramou.com/uploadedFiles/Files/.../Vegas2009Martin.pdf
and
its
functionality”,
[9] David Pelts,Wouth Joseph, Leen verloock,Emmeric Tanghe Luc Martens Evaluation of
building penetration loss for 100 buildings in belgium 2008 .
[10] Sergio Aguirre & Lynette H. Lowe, and Yeh Lo “Radio Propagation into Buildings at 912,
1920, and 5990 MHz Using Microcells”
[11] Constantine Perez Vega, Jose Luis Garcia G and Jose Miguel Lopez Higuera “A simple and
efficient model for indoor path loss prediction”, IOP publishing 1997 .
[12] Wireless communication principles and practise theodore s rappaport second edition 2000.
[13] Indoor radio planning a practicle guide for GSM DCS UMTS and HSPA Morten Tolstrop
2008.
[14] http:// www.informatik.hu-berlin.de/~goeller/isdn/GSMDmChannels.pdf
[15] Tems investigation 10.1 data collection user manual.
[16] Tems investigation 10.1 MRU User’s Manual .
[17] Mobile communication engineering William C.Y.Lee 1982.
[18] Wikipedia contribution “curve fitting” http:// en.wikipedia.org/wiki/Curve fitting.
62
[19]R&S FSH3 website http://www.teknetelectronics.com/Search.asp?p_ID=20288
2005)
(06-12-
[20] HP 8590 Agilent Technologies http://www.esat.kuleuven.be/telemic/public/measdevices7.pdf
[21]HP8922Websitehttp://www.home.agilent.com/upload/cmc_upload/All/08922_90213.pdf
(Jan 1998)
[22]
Mars
matrix.lt.pdf.
Catalog
http://www.matrix.lt/download/mars-antennas-catalogue-2008-V1.3-
[23] Global system for mobile communications http://burnsidetelecom.com/whitepapers/gsm.pdf.
[24] Numerical methods curve fittings http:// kobus.ca/seminars/ugrad/NM5_curve_s02.pdf.
[25] Google search electrum pictures
[26] Indoor pictures website http://site.accessorygeeks.com/images/amplifiers/wirelessdiagram.jpg (13-11-2010)
[27] http://en.wikipedia.org/wiki/Femtocell
[28] http://en.wikipedia.org/wiki/Picocell
[29] Indoor solution picture http://site.accessorygeeks.com/images/amplifiers/wirelessdiagram.jpg
63
APPENDIX A
Continuation of file exporting procedure from TEMS 10.1 tool kit
Fig A1: Exporting log file
It looks like the figure shown above. Choose the text file option and then select the setup
option following window opens
64
Fig A2: selecting the text file parameters (arguments)
Select following parameters and add it in the selected IE as shown in above figure. The
parameters are “Scanned received level on ARFCN (dbm)” and “scanned received
level (dBm)” it lies beneath the GSM drop down box add it in the menu space that is
adjacent to it .Afterwards select the edit button and choose the external equipment that is
connected to TEMS investigation software and in the argument drop list select the
channels number that you have set in the transmitter. And then press ok.
Fig A3: compilation of text file
After doing these steps the windows looks like this then press the start scanning button
then run the scan on the selected file which you have given. Once the scanning is
complete then calls the file in the Microsoft excel.
65
Fig A4: importing data in excel sheet
Press the data menu and then press the option import external data you have to select
some of the options in that menu and then the entire text file would be transferred on the
excel sheet. Afterwards you can select the obtained data range and then take an average
of the data that you attained at the selected measurement point that corresponds to the
measured value at that particular place.
Fig A5: Sample view of data imported from TEMS Investigation to Microsoft Excel sheet
66
APPENDIX B
67
APPENDIX C
68
69
Appendix D
Opposition Report:
Question and Answers
Q 1. You have mention in chapter 5 that you have taken 9 to 10 points of
measurements, is there any specific reason for this?
Ans Measurement points are focused to some number of readings, there are various
reason for it. Major Reason behind this is that we faced some problems in model tuning
that we fixed later on as we made some close analysis so we made this fix for other
technologies too , in this way we ended up in less measurement point. Secondly due to
disorder of the equipment it created a long delay to proceed with the measurement so we
finalized to take less points so that we can end in due date according to the schedule.
Q 2. Modification that has been mentioned for 385MHz Keenan motley plots can
these types of modification be done to other frequencies ranges?
Ans Well if I focus my case then I may say yes because in literature IB model is focused
on 900MHz and 1800MHz only, it doesn’t focus on any other frequency. I just amended
first part adding constant in the frequency and the rest remains same as I said in chapter
3. And it helped to generate satisfactory result as I expected.
Q3. Tuned model proved to produce a good estimate then curve fitting in two cases
but it doesn’t seem to produce good result for free space case what can you say?
Ans If you are referring to two cases then its Keenan motley and PLS one. I think that’s
because here we had some controlling factors like in PLS we had PLS coefficient while
in Keenan Motley we had number of obstacle between transmitter and receiver and wall
attenuation factor which could be varied to fit the measured data point while in free space
we had all the fixed value that could not be altered so it proved to be un tuned and less
prone to be tuned. If it would have been tuned then it might also produced better result
like other two models.
Q4 You have mentioned some local mean procedure what for you used it?
Ans Fading could not be recorded in static conditions either there are peoples moving in.
if its not that case then one have to record fading by moving antenna in some random
directions. As we know that at different points we get different reading due to fading
effects so we calculated the local mean so that accurate value of reading at specific point
could be found rather having uncertainty in the obtained measured points.
70