1
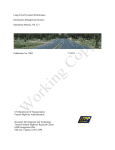
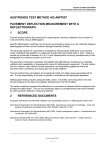
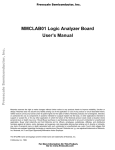
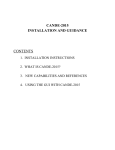
Rohan W. Perera, Gary E. Elkins, and Larry J. Wiser
1
A FRAMEWORK FOR DEVELOPING SPECIFICATIONS AND ACCEPTANCE TESTING
OF AN INERTIAL PROFILER
Rohan W. Perera, PhD, PE (Corresponding Author)
Soil and Materials Engineers, Inc.
43980 Plymouth Oaks Blvd.
Plymouth, MI 48170
Gary E. Elkins, PE
AMEC Environment and Infrastructure
861 Mately Lane, Suite 110
Reno, NV 89502
Larry J. Wiser
Federal Highway Administration
6300 Georgetown Pike, HRDI-30
McLean, VA 22101
Rohan W. Perera, Gary E. Elkins, and Larry J. Wiser
2
ABSTRACT
State highway agencies (SHAs) collect profile data on their highway network using an
inertial profiler, and use this data to compute the International Roughness Index (IRI) of highway
segments, which are stored in a pavement management system. SHAs also use inertial profilers
to obtain the smoothness of new construction to determine if the specified smoothness level has
been achieved.
When purchasing a new inertial profiler, a SHA has to first develop a set of specifications for
the profiler. These specifications should cover all components associated with the profiling
system such as the height sensors, accelerometers, distance measurement instrument, computer
system, etc. The specifications should also address additional equipment that can be installed in
the profiler, such as a GPS receiver, sensors to record macrotexture data etc., and requirements
of the host vehicle on which the profiling system is installed, including safety equipment. The
specifications have to address software requirements, and contain an acceptance testing plan,
which will describe a test protocol to ensure that the constructed profiler is capable of collecting
repeatable and accurate data.
The Long-Term Pavement Performance (LTPP) program has been collecting profile data at
test sections located in the United States and Canada for 25 years. During this time, the program
has used four different types of profilers for data collection. The procedures followed in the
LTPP program to specify and perform acceptance testing of profilers and the American
Association of State Highway and Transportation Officials (AASHTO) standards that address
inertial profilers are used in this paper to describe a framework for developing specifications for
an inertial profiler and perform acceptance testing of the profiler.
INTRODUCTION
State highway agencies (SHAs) collect profile data on their highway network using inertial
profilers. This data is used to compute pavement roughness statistics such as the International
Roughness Index (IRI). This data can be used to assess the overall roughness of the highway
network, track progression of roughness over time, and identify pavement segments for
rehabilitation.
Recognizing that the ride quality of highways is important to the travelling public, SHAs use
pavement smoothness construction specifications to specify the smoothness of new construction.
Studies have shown that pavements that are built smoother stay smoother longer and provide a
longer service life (1,2).
Some SHAs collect network level roughness data using their own equipment, while others
contract this service to a vendor. However, the SHAs that contract out data collection to a vendor
usually have their own equipment for profile data collection and use it for checking the data
collected by the vendor, other project level data collection activities, and collecting data on new
construction for smoothness acceptance.
When a SHA performs a public procurement for profiling equipment, a bid package is
prepared that includes detailed specifications. The specifications should include considerations
for the host vehicle, profiling system, software requirements, acceptance testing, and other
features.
The Long-Term Pavement Performance (LTPP) program has been collecting profile data at
test sections located in the United States and Canada for 25 years. During this time, the program
Rohan W. Perera, Gary E. Elkins, and Larry J. Wiser
3
has used four different types of high-speed profilers for data collection. The LTPP Manual for
Profile Measurement and Processing(3) provides a description of the profiling equipment
currently used in the LTPP program to collect profile data. The procedures followed in the LTPP
program to specify and perform acceptance testing of profilers and the American Association of
State Highway and Transportation Officials (AASHTO) standards that address inertial profilers
are used in this paper to describe a framework for developing specifications for a high-speed
inertial profiler and perform acceptance testing of the profiler. This framework can be used by
anyone planning to procure high-speed profiling equipment.
HOST VEHICLE FOR INERTIAL PROFILER
The equipment for collecting profile data is housed in a host vehicle. The make and model of
the host vehicle can be specified or the functional features of the vehicle ccould be stated.
Alternatively, the purchaser can opt to provide the host vehicle for installation of the profiling
equipment by the vendor.
It is recommended that the host vehicle be equipped with safety lighting to warn motorists, as
the profiler may collect data at speeds less than the posted speed limit, stop on the shoulder,
make U-turns , etc. Safety lighting can consist of a light bar, a directional warning light, and
strobe lights. Figure 1 shows a photograph of a profiler equipped with a light bar in the front and
a directional warning light at the back.
Figure 1. Inertial profiler equipped with a light bar and a directional warning light.
Light Bar: The light bar can be mounted on the front of the vehicle or at the center of the
vehicle, if a directional warning light is not installed on the vehicle. If mounted at the center of
the vehicle, the light bar must be visible at a distance from the front and the back of the vehicle.
The light bar typically consists of light emitting diode (LED) modules and emits an amber
colored signal.
Directional Warning Light: The directional warning light is mounted on the rear of the vehicle.
The directional warning light can typically have eight lamps, and can typically be operated at
four positions: (1) left: the lights flash from right to left, (2) right: the lights flash from left to
right, (3) split: the lights starts from center and go towards both left and right side, and (4) flash:
the lights flash on continuously.
Rohan W. Perera, Gary E. Elkins, and Larry J. Wiser
4
Strobe Lights: LED strobe lights can be mounted inside the headlights and the taillights of the
vehicle. The strobe lights typically emit two to three flashes per second. The strobe lighting
system should contain a turn signal interrupt module that disables the strobe lights when a turn
signal is activated
Security System: The sensors that collect profile data are mounted inside a sensor bar. The
sensor bar is typically attached to the front of the vehicle. To ensure the security of the sensors, a
security system that is connected to the senor bar that will alert if anyone tries to access the
sensors can be specified.
PROFILING SYSTEM
The main hardware components of the profiling system are:
•
•
•
•
•
Height sensors.
Accelerometers.
Distance Measuring Instrument (DMI).
Autotrigger.
Computer.
The height sensor records the height to the pavement surface from the sensor. The
accelerometer is located on top of the height sensor, and records the vertical acceleration of the
vehicle. Data from the height sensor and the accelerometer are combined to determine the
distance to pavement surface relative to an inertial reference frame. The DMI keeps track of the
distance with respect to a reference starting point. A computer program is used to compute the
profile at each data recording interval using the data recorded by the height sensor,
accelerometer, and the DMI. The computed profile is then recorded in the computer.
Height Sensors
Laser height sensors are used in all profilers today to collect profile data. The most common
height sensor currently used to collect profile data is the single-spot laser that projects a small dot
that is typically 0.7 to 3 mm in diameter onto the pavement surface. Research studies have shown
single-spot laser sensors cannot collect accurate profile data on Portland cement concrete (PCC)
pavements that have longitudinal texture, such as longitudinal tining, longitudinal grooving, or
diamond grinding (4, 5, 6). A single-spot laser sensor can obtain measurements on the area on
top of the pavement between the longitudinal tines (or grooves) as well as on the trough of the
tine (or groove) due to lateral wander as the profiler moves along a pavement. These
measurements are misinterpreted as roughness and can cause a significant upward bias in the
roughness of the pavement.
Line lasers that typically project a 4-inch wide beam perpendicular to the travel direction on
the pavement can overcome the problem that single-spot laser sensors face on such surfaces. A
typical line laser obtains about 200 data points within this 4-inch line, and then sorts the data
points, and a certain percentage of readings at the top and bottom of the sorted readings are
discarded. The remaining readings are used to obtain an average height. This strategy, referred to
as a bridging strategy, and eliminates the error caused by single-spot laser sensors on
Rohan W. Perera, Gary E. Elkins, and Larry J. Wiser
5
longitudinally texture surfaces. Therefore, when collecting smoothness data for construction
acceptance on pavements that have such longitudinal texture, a profiler that is equipped with a
line laser can be used to obtain repeatable and accurate smoothness data.
A single-spot laser can also cause a slight overestimation of roughness on coarse textured
asphalt concrete (AC) surfaces (e.g. stone matrix asphalt), open graded AC surfaces, and chip
seals. Data collected by a line laser on such surfaces can result in IRI values that are slightly
lower than the IRI computed from data collected with a single-spot laser on the same surface(7,
8).
Figure 2 shows a schematic sketch of a laser sensor. The stand-off distance is the distance
from the ground to the face of the sensor. The sensor must be mounted on the vehicle at the
stand-off height in order for the ground surface to coincide with the center of the measuring
range of the height sensor. The measurement range of the sensor indicates the range over which
the sensor will obtain measurements. As the vehicle travels along the pavement, the sensor bar
on which the sensor is mounted will move up and down due to the roughness of the roadway. A
sensor with a measurement range of 8 inches can obtain valid measurements with a sensor bar
movement of 4 inches up or down from the stationary position.
Figure 2. Schematic sketch of a laser sensor(9).
The specifications will have to indicate what type of height sensors are needed in the profiler
(i.e., whether single-spot or line), as well as the measurement range of the sensor. A
measurement range of 8 inches is sufficient for a network level profiler, which is expected to
profile some very rough roads (10). A minimum stand-off height of 11 inches is usually
specified, which will result in the face of the sensor being 11 inches from the ground. This
amount of clearance is needed to prevent the sensor from striking the ground when the vehicle
enters or exits a steep driveway.
Typically, two sensors are installed in a profiler, equidistant from center of the vehicle, such
that they collect data along the two wheelpaths. The distance between the sensors, which is
called the sensor spacing, must be specified. In many profilers the sensor are fixed and the sensor
Rohan W. Perera, Gary E. Elkins, and Larry J. Wiser
6
spacing cannot be changed. If it is desired that the sensor spacing be capable of being adjusted, it
must be specified. AASHTO Standard R43(11) that addresses network level roughness data
collection indicates that the two sensors must be spaced at a distance between 65 and 71 inches.
The sensor spacing to be used for collecting smoothness data for construction acceptance is
usually specified in the SHA’s test procedure for collecting data for construction acceptance.
Accelerometers
An accelerometer is mounted on top of each height sensor to measure vertical accelerations.
The accelerometer is mounted such that its axis is perpendicular to the traveled direction. The
accelerometer must have a sufficient range such that it will be capable of measuring
accelerations on the roughest roads that will be profiled. A National Cooperative Highway
Research Program (NCHRP) research project has shown an accelerometer with a measuring
range of ±5g is needed for a profiler that has sensors mounted at the front or back of the vehicle
in order to measure accelerations on rough roads(10).
Distance Measuring Instrument (DMI)
The profiler is equipped with a DMI that keeps track of distance, and the specifications
should indicate the accuracy requirement of the DMI. An encoder attached to the wheel of the
vehicle is a common procedure to measure distance. AASHTO standard M328(12) indicates the
distance measuring system in a profiler should be capable of measuring the distance accurately
with an error less than 0.15 percent.
Autotrigger
Profilers that collect data for smoothness acceptance must be equipped with an autotrigger
that can be used to automatically initiate data collection at a pre-determined location on the
pavement. This is because the start location of data collection must be known accurately in order
to find localized roughness locations. In addition, an autotrigger is needed to ensure the data
collection is started at a pre-defined location, such as when collecting data for profiler
certification or for profiler comparison studies. A photocell is the current device that is used in
profilers as the autotrigger. The profiler must be equipped with autotriggers that can initiate data
collection from a reflective tape that is placed on the pavement surface or from a cone with
reflective markings that is placed on the side of the road. Two separate autotriggers, one pointing
in the vertical direction (vertical autotrigger) and other mounted on the passenger side of the
vehicle pointing in a direction perpendicular to the travel direction (horizontal autotrigger) can
be provided in the profiler. Instead of two autotriggers, it is acceptable to have one autotrigger
that can be rotated about a horizontal axis that can serve as either the vertical or the horizontal
autotrigger. A range must be specified for the horizontal autotrigger, which will indicate the
maximum distance at which a reflective mark can be detected by the autotrigger.
Computer and Peripherals
The profiler is operated using the software installed in a computer. Today, a laptop computer
is often used to operate an inertial profiler. The data collected by the various sensors in the
Rohan W. Perera, Gary E. Elkins, and Larry J. Wiser
7
profiler is recorded in the computer, and this data is used to compute the profile. A ruggedized or
industrial hardened computer is recommended to be specified for the profiler. The computer
must have sufficient storage capacity to store the collected data. The amount of data to be stored
can be specified in terms of mileage (i.e., capable of storing 5,000 miles of data). If data other
than profile data are also collected (e.g., images), the storage capacity of the computer must be
increased to account for that. If desired, a printer can be specified.
ADDITIONAL EQUIPMENT
The following additional equipment can be specified in the profiler if desired:
Global Positioning System: A Global Positioning System (GPS) receiver that can record GPS
data can be specified in the profiler. The accuracy required of the GPS must be specified. If the
vehicle is equipped with a light bar, the GPS receiver can be placed inside the light bar. The GPS
data can be tied to profile data to indicate the locations at which profile data were collected.
Texture Sensors: Sensors capable of recording macrotexture data can be installed in the profiler,
if desired. The sensors can be installed to collect data along both wheelpaths or along one
wheelpath (e.g., right wheelpath). The collected data can be used to compute the mean profile
depth (MPD) of the pavement surface. Laser sensors that are rated at least at 62 kHz are needed
to collect macrotexture data, as macrotexture data have to be recorded at a minimum spacing of
0.04 inch intervals in order to compute the MPD.
Camera: A camera that can be mounted inside the vehicle off the rear view mirror can be
specified if it is desired to obtain photographs or record video during profile data collection. The
camera can be configured with the DMI to obtain photographs at specified distance intervals.
Air and Temperature Probe: An air temperature probe as well as a pavement temperature
probe can be specified if it is desired to record air and pavement temperature during data
collection. Typically, an infra-red temperature probe is used to record the pavement temperature.
The pavement temperature may be useful to assess curling effects on PCC pavements.
OTHER REQUIREMENTS OF THE PROFILER
Some of the other requirements of the profiler that must be specified include data recording
interval and operating speed.
Data Recording Interval: AASHTO M R43 (11) as well as AASHTO M 328 (12) indicate a
profiler must be capable of storing data at a recording interval of 2 inches or less. Profilers today
are capable of storing data at 1 inch intervals. Therefore, it is recommended a profile data storage
interval of 1 inches or less be specified, with the user having the ability to select the data storage
interval over a range of values.
Operating Speed: A review of profiler manufacturers’ literature indicate high-speed profilers
can collect data at speeds between 15 and 70 mph. AASHTO M 328(12) specifies an operational
speed range of between 20 and 70 mph for a profiler.
Rohan W. Perera, Gary E. Elkins, and Larry J. Wiser
8
SOFTWARE REQUIREMENTS
The following software requirements must be addressed in the specification:
Performing Calibration/Calibration Checks:The laser height sensors are calibrated at the
factory and the calibration factors cannot be changed by the user. However, a calibration check
can be performed on the sensor to check if the sensor is functioning properly. This check is
performed by placing blocks of known dimensions below the sensor and seeing if the sensor can
accurately measure the block height within a specified tolerance, which is typically ±0.01 inches.
The bounce test is a check on the overall integrity of the profiling system, to see if the
accelerometers are cancelling out the vehicle motion, and AASHTO Standard R57(13) describes
the procedure to perform this test. The DMI in the profiler must be calibrated at regular intervals
to ensure that the profiler is recording distance properly. The profiler software must have the
capability to perform a block check and a bounce test, and the ability to calibrate the DMI when
the profiler is operated at its normal operating speed. A software function to check if the
accelerometers are functioning properly should also be available.
Header Information: Header information is entered into a software screen before starting
profile data collection. Header information can include items such as route name, direction, lane,
start milepost, vehicle identifier, name of profiler operator and driver, etc. The items to be
included in the header can vary from agency to agency, and must be specified based on agency
requirements.
Auto Incrementing File Names for Repeat Runs:Repeat profile runs are desired at pavement
sections in some instances. The profiler software must have the capability to auto increment the
run number in the file. This means adding the number 1 at the end of the file name for the first
run and then incrementing this number by 1 for subsequent runs.
Comments/Event Marks During Profiling:The ability to enter comments during profiling
must be specified if desired. It is recommended that this function be used when a two person
crew is used, one driving the vehicle and other operating the computer. The software must have
the capability of accepting event keys, which will put in an event in the data file when the key is
pressed. The letters in the last row of the keyboard can be assigned as event marks, and the
operator can press one of these keys during profiling to identify specific locations during
profiling. For example, the letter Z can be assigned to mark a beginning of a bridge and letter X
can be assigned to mark the end of a bridge.
Initiating and Termination Profile Data Collection:The profiler must be capable of initiating
data collection using the auto-trigger or by pressing a key in the keyboard, with the similar
capability being available to terminate data collection.
Real Time Quality Control Checks:The profiler software must be capable of performing real
time quality control checks on various data elements that are collected. The height sensor and
accelerometer data must be checked in real time to ensure signals are being received from these
components and the received signals are valid.
Rohan W. Perera, Gary E. Elkins, and Larry J. Wiser
9
Data Filtering: AASHTO R43 (11), as well as AASHTO M 328 (12,) indicate an upper
wavelength cut-off filter of 300 ft must be applied on the data. It is desirable to have an option
where the user can specify the upper wavelength filter that is applied to the data.
Marking Invalid Data: A high-speed profiler will not usually collect accurate data when its
speed drops below about 15 mph. Also, once a profiler comes to a stop, the profiler must travel
about 300 ft before it starts collecting valid data. The profiler software must have the capability
to mark locations where invalid data were collected, and ignore the invalid data when computing
roughness indices.
Data Analysis and Reporting Capabilities:The profile data is used to compute a roughness
index, with IRI typically being the most common roughness index that is computed. The format
of the report that is produced when IRI is computed must be specified.
Graphical Capabilities: If it is desired to plot and view the collected data, the requirements for
plotting the data must be specified.
Data Exporting Capabilities: The profiler software must have the capability to generate an
ERD file, as well as a ppf file, containing the profile data. The data format required for an ERD
file is specified by the University of Michigan Transportation Institute. ProVAL is software
developed by the Federal Highway Administration (FHWA) for viewing and analyzing profile
data. This software is available free at http://www.roadprofile.com. This software can import an
ERD file as well as a ppf file. It is also desirable if the vendor’s raw data files can be directly
imported into ProVAL.
ACCEPTANCE TESTING OF PROFILERS
After the profiler has been manufactured, acceptance testing must be conducted on the
equipment to ensure it can collect accurate and repeatable data. The acceptance testing plan must
be included in the bid documents. The following are tests that should be conducted on the
profiler for acceptance testing:
1.
2.
3.
4.
5.
6.
7.
8.
9.
Static sensor check on laser sensors.
Bounce test.
Test of profile initiation equipment.
Test on DMI.
Repeatability of IRI values.
Cross correlation analysis: IRI repeatability of profile data.
Comparison of IRI values with reference device IRI.
Cross correlation analysis: IRI accuracy of profile data.
Ability of profiler to collect accurate data within operating range.
It is recommended that at least four test sections be used to evaluate the data collected by the
profiler, with two sections being surfaced AC and other two surfaced with PCC. One AC and one
PCC section must be smooth (mean IRI less than about 90 in/mi), and the other AC and PCC
Rohan W. Perera, Gary E. Elkins, and Larry J. Wiser
10
section must be rough (mean IRI between 120 and 160 in/mi). An additional test section having a
mean IRI between 160 and 200 in/mi is recommended to check the ability of the profiler’s data
collection abilities on very rough pavements. It is recommended the profiler take nine runs at
each test site, with the vendor operating the profiler, and the vendor be asked to choose six runs
at each site that will be used for analysis. Data collected at these test sections are used for the
tests 5 through 8 indicated above.
The cross-correlation method is a procedure that can be used to compare the IRI values for two
profiles (14). The cross-correlation method is applied to the two IRI-filtered profiles to obtain a
rating agreement between 0 and 1. When evaluating agreement of IRI for two profiles, the cross
correlation is superior to direct comparison of overall IRI values, because in the cross correlation
method the spatial distribution of roughness is considered.
For the tests indicated in items 7 and 8, reference data has to be obtained along each wheelpath at
all test sections using a reference device. The current procedure used by SHAs to collect
reference data is to use a rolling type reference device that is pushed along the pavement surface
and collect data at 1 inch intervals.
1. Static Sensor Check on Laser Sensors:The accuracy of the laser sensors are checked during
this test while the vehicle is stationary. In this check, blocks of known dimensions are used to
check if the laser sensor can measure the height of the block accurately. Typically blocks having
heights of 1, 2, and 3 inches are used. The laser sensor should be able to measure the height of
the blocks within ±0.01 inches of the actual height of the block to pass this test, which is the
criterion specified in AASHTO standard R 57.
.
2. Bounce test: This test is an overall integrity test of the profiling system, and checks if the
noise level of the laser sensors is acceptable and also checks if the vehicle movement is
compensated by the accelerometers. The procedure for performing the bounce test as well as the
criteria for passing the test are described in AASHTO standard R57-10(13). When performing
this test, the profiling system is turned on, and data are collected with the vehicle being
stationary with no motion imparted on the vehicle. The data recorded during this period is noise
of the laser sensors, and is referred to as the static portion of the bounce test. Thereafter, a
pitching motion is imparted on the vehicle by a person getting onto the rear bumper and
bouncing it. This portion of the bounce test is referred to as the dynamic bounce test. After the
bounce test is completed, IRI values for a simulated distance of 0.1 miles for the portion where
static test was performed as well as the portion where dynamic bounce test was performed is
computed. AASHTO R 57 (13) indicates for each sensor the IRI of the static potion and dynamic
potion should be less than 3 and 8 in/mi, respectively, for bounce test to pass.
3. Test of Profile Initiation Equipment:The capability of the autotrigger to automatically
initiate data collection is checked during this test. Photocells are typically used as autotriggers,
and they have a delay time of less than 1 ms. This means after detecting the reflective mark, the
profiler will travel some distance before starting data collection. At a speed of 70 mph, a delay
time of 1 ms will mean the profiler will travel 1.2 inches before taking the first measurement.
The ability of the profiler to initiate data collection automatically and take the first reading
within a specified distance from the reflection mark must be checked.
Rohan W. Perera, Gary E. Elkins, and Larry J. Wiser
11
4. Test on DMI: This test checks if the DMI in the profiler can attain the accuracy that was
specified. A 1000 ft long section must be laid out to perform this test, with reflective marks
placed on the pavement at the start and the end of the test section. The profiler should first
calibrate the DMI at this test section. Thereafter, it is recommended that the profiler obtain six
runs at the typical operating speed of the profiler at this section, with the distance recorded
between the two reflective marks being displayed for each run. Then the absolute difference
between recorded and actual distance of the section must be computed for each run, and the
absolute differences must be averaged. The average of the absolute differences must be within
the specified accuracy requirement.
5. Repeatability of IRI values: The standard deviation of IRI computed from the six runs for
each wheelpath at each test section must be less than or equal to 2.5 in/mi for the profiler to pass
this test based on the requirement that has been used in the LTPP program.
6. Cross Correlation Analysis: IRI Repeatability of Profile Data:In this analysis, the IRIfiltered cross-correlation for all possible run combinations is computed for each wheelpath at a
test site. Then these values are used to compute the average cross-correlation value. This analysis
can be performed using the ProVAL software. The average IRI filtered repeatability cross
correlation should be at least 0.92 for each wheelpath at all test sections, which is the
repeatability criterion specified in AASHTO Standard R 56(15).
7. Comparison of IRI Values with Reference Device IRI:The average IRI value obtained
from the six profiler runs along a wheelpath at each test section is compared to the IRI value
obtained from the reference device. The average IRI from the profiler must agree with the IRI
from the reference device within a specified tolerance in order for the profiler to pass this test.
LTPP has used 6.3 in/mi as the tolerance for a wheelpath having an IRI less than 90 in/mi and
9.5 in/mi for a wheelpath having an IRI greater than 132 in/mi as thresholds for acceptance
testing.
8. Cross Correlation Analysis: IRI Accuracy of Profile Data:In this analysis, the IRIfiltered cross-correlation between the reference data and each repeat run of the profiler is
computed for each wheelpath. Thereafter, these values are averaged for each wheelpath at each
test section. This analysis can be performed using the ProVAL software. The average IRI-filtered
cross-correlation must be at least 0.90 for each wheelpath at each test section, which is the
accuracy criterion specified in AASHTO R 56(15), in order for the profiler to pass this test.
9. Ability of Profiler to Collect Accurate Data within Operating Speed Range:The ability of
the profiler to collect data within the specified speed range must be checked by collecting data at
one or more sites starting with the lowest specified operating speed and then collecting data with
speed incremented by 10 mph. The data collected at various speeds can be analyzed for
repeatability using the cross-correlation method, as well as by comparing IRI values.
The use of the cross-correlation method alone is sufficient to check the repeatability and
accuracy of the profiler. However, profile users are familiar with the IRI values, and by
Rohan W. Perera, Gary E. Elkins, and Larry J. Wiser
12
performing the tests indicated in items 5 and 6 above, information about the repeatability and
accuracy of the profiler in terms of the IRI values can be obtained.
SUMMARY
The procedures followed in the LTPP program to specify and perform acceptance testing of
profilers and the AASHTO standards that address inertial profilers are used in this paper to
describe a framework for developing specifications for a high-speed inertial profiler and perform
acceptance testing of the profiler. It is important to specify all requirements of the profiler when
bids are solicited, as making changes once a bid has been awarded can be costly. It is important
to perform acceptance testing of the profiler once it is manufactured to ensure that the equipment
is capable of collecting accurate and repeatable data.
REFERENCES
1. Smith, K.L., Smith, K.D., Evans, L.D., Hoerner, T.E., Darter, M.I., and Woodstrom, J.H.
(1997), Smoothness Specifications for Pavements, National Cooperative Highway Research
Program, Transportation Research Board, Washington, DC.
2. Perera, R.W. and Kohn, S.D. (2001), LTPP Data Analysis: Factors Affecting Pavement
Smoothness, National Cooperative Highway Research Program, NCHRP Web Document 40,
http://onlinepubs.trb.org/onlinepubs/nchrp/nchrp_w40-a.pdf
3. Perera, R.W. and Elkins, G.E. (2013), LTPP Manual for Profile Measurement and
Processing, Federal Highway Administration, MvLean, Virginia.
4. Karamihas, S.M. and Gillespie, T.D. (2003). Assessment of Profiler Performance for
Construction Quality Control: Phase I, Report No. UMTRI-2003-1, University of Michigan
Transportation Research Institute, Ann Arbor, Michigan.
5. Perera R.W, Kohn, S.D., and Byrum, C.R. (2009), Smoothness Criteria for Concrete
Pavements, Federal Highway Administration, Washington, DC.
6. Fernando, E. and Harrison, G. (2013), Construction of New Profiler Certification Tracks,
Report No. FHWA/TX-1315-9047-1-1, Texas A&M Transportation Research Institute,
College Station, Texas.
7. Perera R.W. and Karamihas, S.M., (2010), Smoothness Criteria for Asphalt Concrete
Pavements, Federal Highway Administration, Washington, DC.
8. Fernando, E.G. and Walker, R.S. (2013), Impact of Changes in Profile Measurement
Technology on QA Testing of Pavement Smoothness, Report No. FHWA/TX-13/0-6610-1,
Texas A & M Transportation Institute, College Station, Texas.
9. SLS 5000 User’s Manual, LMI Selcom.
Rohan W. Perera, Gary E. Elkins, and Larry J. Wiser
13
10. Karamihas, S.M., Gillespie, T.D., Perera, R.W., and Kohn, S.D. (1999) Guidelines for
Longitudinal Pavement Profile Measurement, Report 434, National Cooperative Highway
Research Program, Washington, DC.
11. AASHTO (2014), Standard Practice for Quantifying Roughness of Pavements, AASHTO
Designation: R43-12, American Association of State Highway and Transportation Officials,
Washington, DC.
12. AASHTO (2014), Standard Specification for Inertial Profiler, AASHTO Designation: M32810, American Association of State Highway and Transportation Officials, Washington, DC.
13. AASHTO (2014), Standard Practice for Operating Inertial Profiling Systems, AASHTO
Designation: R57-10, American Association of State Highway and Transportation Officials,
Washington, DC.
14. Karamihas, S. M. (2004), Development of Cross Correlation for Objective Comparison of
Profiles, International Journal of Vehicle Design, Vol. 36, Nos. 2/3.
15. AASHTO (2014), Standard Practice for Certification of Inertial Profiling Systems, AASHTO
Designation: R56-10, American Association of State Highway and Transportation Officials,
Washington, DC.