1
Assisting the automation
industry since 1986
Quick Guide
PC SOFTWARE
DAQ Manager
•
•
Version: 1.7.5 or higher
Designed for MultiCon data recorders
Read the user manual carefully before starting to use the software.
Producer reserves the right to implement changes without prior notice.
2015.05.05
DAQ Manager_QGUSXEN_v.1.09.001
User manual - PC SOFTWARE DAQ Manager
CONTENTS
1. GENERAL CHARACTERISTICS..........................................................................................................4
2. FIRST LAUNCH OF THE APPLICATION.............................................................................................4
3. DATA IMPORTING FROM A FLASH DRIVE.......................................................................................5
3.1. Selection of data directory...........................................................................................................5
3.2. Data importing..............................................................................................................................5
4. DATA DOWNLOADING FROM A NETWORK.....................................................................................6
4.1. Configuring network settings........................................................................................................6
4.2. Manual data downloading............................................................................................................7
4.3. Automatic data downloading........................................................................................................9
5. DEVICE SETTINGS..............................................................................................................................9
5.1. Devices.......................................................................................................................................10
5.2. Groups........................................................................................................................................10
5.3. Logs............................................................................................................................................11
5.3.1.Graph settings....................................................................................................................12
5.4. Channels....................................................................................................................................13
6. PROGRAM SETTINGS.......................................................................................................................13
6.1. “Application” tab.........................................................................................................................13
6.2. “Display” tab...............................................................................................................................14
6.3. “Ethernet” tab.............................................................................................................................19
6.4. “Current Measurements” tab......................................................................................................19
6.5. “Printout” tab...............................................................................................................................19
7. BROWSING LOGS..............................................................................................................................20
7.1. Selection of time range..............................................................................................................20
7.2. Automatic report refresh.............................................................................................................22
7.3. The table.....................................................................................................................................23
7.3.1.General information...........................................................................................................23
7.3.2.Synchronization with the graph.........................................................................................24
7.4. The graph...................................................................................................................................24
7.4.1.The legend.........................................................................................................................25
7.4.2.Scaling and moving...........................................................................................................26
7.4.3.Synchronization with the table...........................................................................................27
7.4.4.Transfer to other programs................................................................................................27
8. CREATING REPORTS........................................................................................................................28
8.1. Printing the table........................................................................................................................28
8.2. Printing the graph.......................................................................................................................28
9. ANNOTATING GRAPHS.....................................................................................................................29
9.1. Creating notes............................................................................................................................30
9.2. Creating types of notes..............................................................................................................31
9.3. Edit and delete notes.................................................................................................................31
10. REFERENCES..................................................................................................................................32
10.1. General Information..................................................................................................................32
10.2. Creating references..................................................................................................................32
10.3. List of references......................................................................................................................34
10.4. Comparing Graphs...................................................................................................................34
11. CURRENT MEASUREMENTS.........................................................................................................36
11.1. The table...................................................................................................................................36
11.2. Java applets.............................................................................................................................37
11.2.1.Introduction......................................................................................................................38
11.2.2.Parameters of the applets...............................................................................................38
11.2.3.Creating HTML pages with applets ................................................................................40
Using a visual editor ............................................................................................................40
Using a text editor ................................................................................................................48
11.2.4.Access to the applets from the software.........................................................................49
11.2.5.Running the selected HTML page...................................................................................50
2
User manual - PC SOFTWARE DAQ Manager
11.2.6.Window with a HTML page..............................................................................................51
11.2.7.Automatic arrangement of windows................................................................................52
Explanation of symbols used in the manual:
!
This symbol denotes especially important characteristics of the software operation.
Read any information regarding this symbol carefully.
i
This symbol indicates additional information that may help operate the program.
3
User manual - PC SOFTWARE DAQ Manager
1. GENERAL CHARACTERISTICS
DAQ Manager software allows you to download data recorded by the MultiCon devices
(e.g. temperature, humidity, pressure) and visualize them as tables and graphs. Data transfer
is performed using a portable USB Flash Drive or via an Ethernet network.
2. FIRST LAUNCH OF THE APPLICATION
After completing the installation process, start the application from the system Start Menu
in the folder “DAQ Manager”. From this folder you can safely uninstall the program and the
measurement data archived up to the time of uninstalling will remain on your hard disk for later
use.
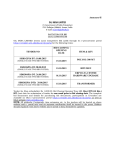
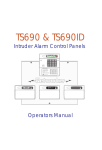
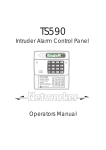
After first launching of the program, the window shown will look like Figure 2.1.
1
5
2
3
6
4
Figure 2.1. The appearance of the interface on the first run
Explanation of elements in the figure above:
1 - Main Menu - provides access to less frequently used functions of the program;
2 - Side Menu - allows access to the main functions of the program;
3 - Devices List - contains a list of devices for which the program has archived
data or virtual devices created for communication via Ethernet;
4 - Event Messages Area – list events occurring in the program;
Information that appears here is also saved to a file ”EventLog.txt”,
which is located in the program directory.
4
User manual - PC SOFTWARE DAQ Manager
5 - Time Area – select the time period to create a table or graph;
6 - Report Area – view selected data in table and graph form;
Displayed measurement data can be printed or exported to *.csv file.
When you run the program for the first time, the Devices List is empty because the
program doesn't have any information about devices and their data yet. The creation of a new
device on the list is done automatically by importing logged data saved on portable flash
memory. To add a new device you only need to import its logged data. It is possible to add a
new device manually, which will give the possibility to import data directly from the Ethernet
network (see section 4. ).
3. DATA IMPORTING FROM A FLASH DRIVE
The user can import measurement data, saved by the data logger on a portable flash
drive, to the software database using menu [File] > [Import measurements...]. If a flash drive
is inserted into USB port while running the program, DAQ Manager will check its contents and
if any measurement data is find, a window is displayed to select the directory to get the new
data.
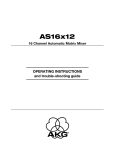
3.1. SELECTION OF DATA DIRECTORY
The “Browse for Folder” window allows you to choose the folder of one device (with the
name of the specific data logger serial number). Selecting the proper directory will activate the
[Import] button (Figure 3.1). Clicking on this button will start the process of importing data to
the program database.
Figure 3.1. “Browse for Folder” window
3.2. DATA IMPORTING
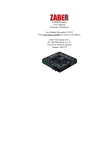
At the beginning of the process of importing data the program analyses the measurement
data for changes. After that, software performs importing if it's needed. The user is informed
about progress of operation via a dialogue box, and should wait until the end of the process
(when the [Close] button becomes active) as shown in Figure 3.2.
5
User manual - PC SOFTWARE DAQ Manager
Figure 3.2. The process of data importing was completed
When the importing process was successfully completed a new device called “Device
SERIAL_NO” (where SERIAL_NO is the serial number of the device from which data were
collected) appears in the Devices List.
4. DATA DOWNLOADING FROM A NETWORK
In addition to importing data from a flash drive, you can also download logged files via an
Ethernet network. This possibility exists only if the data logger is equipped with
a communication module with an RJ-45 socket (ACM or ETU module).
4.1. CONFIGURING NETWORK SETTINGS
To download the measurement data and settings from a device, connected to the
Ethernet network, you must add a new undefined one to the list, by going to the [Devices]
button (see section 5. ). Then click [Add] button. A device added to the list in this way is a
virtual device; its serial number is undetermined yet (Figure 4.1).
Figure 4.1. Adding the new virtual device to the Devices List
6
User manual - PC SOFTWARE DAQ Manager
This virtual device will be equivalent to the actual real device in Ethernet network when
the user specifies its network settings. Please check the Ethernet capabilities option, specify
the IP address of the real device in the Ethernet network and the correct port if the device is in
a subnet and is using port forwarding. Direct communication works on port 80 (http). If the
network is managed by a DNS server that specifies assigned IP address to a domain name (or
host), then you can choose to access the device by this name, as an alternative to an IP
address. This functionality is especially useful if you want to use dynamic allocation of IP
addresses with the DHCP option enabled in the device. After setting the network settings, you
can immediately test it to see whether the device responds. Please click on the [Test] button
and read the message at the right side of it (Figure 4.2).
Figure 4.2. Example of network settings for a device that does not exist
in the network (on the left) and correctly configured (on the right)
If the device responds correctly, you should save these settings by clicking on the [Save]
button.
4.2. MANUAL DATA DOWNLOADING
To download data from the preconfigured virtual device, go to the Reports section, right
click on the appropriate device and select the [Download data] command (Figure 4.3).
Figure 4.3. Starting download data
The program will download the list of all logs then show a dialog to make the user choose
which ones should be imported (Figure 4.4).
7
User manual - PC SOFTWARE DAQ Manager
Figure 4.4. Choice of logs to download
Logs tagged "new" don't exist in the program or may require an update. The
[Suggest choice] button selects logs marked with this tag. After making your selection, click
[OK] button. This will start the process of downloading the data in the form of logs and
configuration of the device, logged groups and channels. The progress of this operation is
located next to the device on the list. By clicking on the progress bar, you can view details of
this process (Figure 4.5). If DAQ Manager has previously downloaded data for the selected
device, then the update will be made without re-downloading all logs. If during the
downloading, the program detects any errors, the user will be informed by an appropriate entry
in the Event Messages Area (see Chapter 2. ).
Figure 4.5. Downloading data from an Ethernet network
During the first download the serial number of the virtual device will be updated and will
change from virtual to real. After that, any attempt of downloading data from another device,
e.g. after changing the IP address, will bring up the warning “Incompatible device!”.
After completion of the download process, you can choose imported logs, and then
analyse the data and create reports (Figure 4.6).
Figure 4.6. Updated logs ready for analysis
8
User manual - PC SOFTWARE DAQ Manager
4.3. AUTOMATIC DATA DOWNLOADING
The program has a built-in automatic data downloading function according to a set
schedule. When user uses this option, he hasn't a choice which logs will be imported, and the
program automatically download all data that haven't been imported or require an update.
Automatic data downloading function can be activated for each device. To do this, go to
settings by the [Devices] button (see section 5. ), select preferred device in the list and check
the "Download logs automatically" option. For user's convenience the program has a several
templates of shedules of automatic data downloading. Each template defines the plan for start
a mechanism of logs downloading (Figure 4.7).
Figure 4.7. Settings of automatic data downloading
If there isn't predefined template that match user's requirements, the plan can be defined
individually. To do this, select the "(custom plan)" template and set own schedule using the
Plan field. Notation of the plan is similar to the nnCron format, with the main difference that
has extra space for seconds. Details about how to write the schedule in this format can be
found at http://www.nncron.ru/help/EN/working/cron-format.htm. Any change in the plan
updates the information about the next time of download, which allows user to verify the
correctness of the schedule.
After define the plan and save settings, user can do other things or minimize the program
and when the time set in the schedule will occur, the program will start downloading data
process.
!
Is not recommended to set the time of downloading data too often, because that will
unnecessarily load the device. Continuous downloading, converting and importing
of the data also cause a much load of the program, which slows down other
operations. Memory of the device is enough to register measurements for at least
several days with configuration of device which generates the largest filling data.
5. DEVICE SETTINGS
Access to the settings of devices from which data was collected, their groups, logs and
channels can be obtained by clicking on the [Devices] button in the Side Menu. Certain
settings that relate to the displaying and visualization of data, previously set in the device, can
be changed here, to allow for more intuitive reports. After making changes, the user must
confirm it by clicking the [Save] button. The button [Undo] is used to restore the last saved
settings when an unexpected change happens.
9
User manual - PC SOFTWARE DAQ Manager
5.1. DEVICES
The number of devices on the list is unlimited. After selecting one device, the program
displays its properties (serial number, date and time when it was added to the database and
disk space occupied by all its data). The user can change the default name of the device and
define the Ethernet Network settings (Figure 5.1).
Figure 5.1. Device settings
For convenience (e.g. to make the list more readable) each device can be hidden from
the list of devices in the Reports and Current measurements sections by unchecking it on
this list.
The user can also permanently remove the device from the database by selecting a
device and clicking the [Delete] button. This operation can also permanently delete all the
data related to the selected device, so It is strongly recommended to be very careful while
performing this operation because there is no possibility to recover deleted data. To prevent
against accidental data deleting, the software asks the user if all data related to device being
removed should also be deleted from the hard drive.
!
The folder with databases that contain imported data is in the installation directory
of the program (see section 6.1. ). You should take care to backup its contents
regularly.
5.2. GROUPS
Each device can have up to 10 groups (depending on the settings of data logger). For
each group the user can specify the name and description (Figure 5.2). It is recommended to
use groups names similar to names of corresponding groups in MultiCon devices.
10
User manual - PC SOFTWARE DAQ Manager
Figure 5.2. Group settings
The Common scale for all channels setting is used to force the method of displaying
the scale on the graph for creating reports as shown in the table below.
Setting
Description
Individually: Displaying a common scale setting will correspond
individually for each log setting (see section 5.3).
(default)
Turned Off: The common scale for logged channels will be disabled.
Each channel will have an independent scale in the graph. Individual
settings for each log will not be accepted.
Turned On: The common scale for logged channels will be displayed for
each log that belongs to this group. Individual settings for each log will
not be accepted.
5.3. LOGS
After expanding one of the groups, a list of logs appears (Figure 5.3). Their number is
unlimited and depends on how often you change parameters in the data logger device, which
causes the creation of a new log, and also on maximum size of single log allowed by the
MultiCon device. The name of the log contains the date of its creation and completion.
Parameters of each log are for information purposes only. Settings of the graph and a
description of the log can be customized.
Figure 5.3. Log settings
11
User manual - PC SOFTWARE DAQ Manager
5.3.1.Graph settings
Detect break when difference after expected time exceeds field allows to define a
minimal difference in logged samples and when this difference will be exceeded, the program
will classified it as a break in logging (Figure 5.4). There is no possibility to set this parameter
on value which is smaller than logging period.
T = 0,1 s
T = 0,1 s
T = 0,1 s
T = 0,1 s
dt = 0,1 s
D > 0,1 s
where:
T – logging period,
D – detected delay in sample logging, which depends on value defined by user,
dt – logging break which will be visible on graph,
Figure 5.4. Break calculation in sample logging
Causes of logging breaks can be as follows:
– switching off the device (regardless of the cause),
– stopping logging when it was triggered form logical channel,
– filling the memory of the device,
– overloading the device (e.g. when user is trying to register to much samples per
second),
– starting logging in few Groups at the same time,
– others,
Figure 5.5. Example of logging sample break
12
User manual - PC SOFTWARE DAQ Manager
The Common scale for all channels setting is used to set the method of displaying the
scale on the graph for creating reports as shown in the table below.
Setting
Description
Turned Off: The common scale for logged channels will be disabled.
Each channel will have an independent scale in the graph.
(default)
Turned On: Logged channel values will be rescaled to a common scale
of all displayed channels. Activating this option is useful when values of
several channels are similar.
5.4. CHANNELS
After expanding any log, a list of logged channels is shown (Figure 5.6). The user can
specify multiple settings that affect the format of the data which is displayed in reports.
Figure 5.6. Channel settings
6. PROGRAM SETTINGS
Access to the program settings can be reached by clicking on the [Settings] button in the
Side Menu.
6.1. “APPLICATION” TAB
Here are the general settings of the program. The user can check the location of the data
stored on his hard drive under Bases directory. The program allows the user to change the
default location of the databases. If in the new location the databases don't exist, the program
creates empty prepared to add the new data.
!
Although it is possible to choose a network location, this solution is not
recommended due a slow startup of the program and slower operations.
Additionally, the user should make sure that the shared folder doesn't use by
multiple users at the same time
In the above tab, you can also set the interface language (Figure 6.1).
13
User manual - PC SOFTWARE DAQ Manager
Figure 6.1. Program settings – Application tab
6.2. “DISPLAY” TAB
Settings located on this tab are responsible for how data are retrieved from the archive
and for its presentation (Figure 6.2). Due to the large amount of data, user can set some
limitations, which will shorten the waiting time to generate the report and reduce RAM usage.
Figure 6.2. Program settings – Display tab
Enabling Omit samples mode option will cause that if during the process of creating a
report the user selects the time range which contains larger amount of measurements than
specified in Maximum number of measurements to show parameter, the program skips
appropriate number of samples in a way that the total number of displayed samples will not
exceed the limit. Omitted samples are distributed evenly in entire of the time interval that user
selected. Each displayed point can take real measured value corresponding to the time when
it was registered or its value can be calculated including preceding omitted points. The method
of display points can be chosen by selecting an option from the Data display style list.
Because in some situations there is need for frequent changing of this option, for
example between creation of reports based on data coming from different groups or devices,
quick access to it may be done from the Time Area (Figure 6.3) and may be change just
before use the [Generate] button.
Figure 6.3.Omit samples mode options available from the Time Area
14
User manual - PC SOFTWARE DAQ Manager
The following table describes all options of above parameter.
Setting
Description
Without omitting measurements: When the Omit samples mode is
inactive the Maximum number of measurements to show parameter
applies limit on the amount of generated data. This mode displays the
first n samples that don't exceed this limit (Figure 6.4). If the selected
period of time includes greater number of samples than this limit allows,
after using the [Generate] button on the time line should appear red
arrow indicating the location of the last generated point.
Averaged: Activating this mode of omitting samples cause that the
value of each displayed point will be calculated based on the arithmetic
mean of preceded it omitted points (Figure 6.4.B).
Real logged: Activating this mode of omitting samples cause that each
displayed point will have really measured value at the moment when it
was recorded. Values of omitted points aren't included (Figure 6.4.C).
Maximas: Activating this mode of omitting samples cause that value of
each displayed point will be equal to the maximum value of preceding
omitted points (Figure 6.4.D).
Minimas: Activating this mode of omitting samples cause that value of
each displayed point will be equal to the minimum value of preceding
omitted points (Figure 6.4.E).
[Max - Min]: Activating this mode of omitting samples cause that value
of each displayed point will be equal to the difference of maximum and
minimum value of preceding omitted points (Figure 6.4.F).
[Max or Min]: Activating this mode of omitting samples cause that value
of each displayed point will be equal to the maximum or minimum value
of preceding omitted points. About this which one will be choosen,
determines the greater distance from the arithmetic mean value of
omitted points (Figure 6.4.G).
15
User manual - PC SOFTWARE DAQ Manager
Figure 6.4. Effect of reducing the number of displayed measurements on graphs
when Omit samples mode is inactive:
A - all samples (1400 samples), B - limit without omitting (first 700 samples)
Data browsing when omit measurements mode is inactive allows viewing all recorded
samples continuously, but displaying large amount of them is problematic. Operating by user
on graphs which displays all 6 channels, where each contains 200.000 measurements
(1.200.000 points on the graph) is uncomfortable, even using a fast PC. To ensure that the
program will functioning smooth, the largest value of the Maximum number of
measurements to show parameter can not be greater than 100.000. It is easy to calculate,
that if the maximum sampling frequency is 0.1 second, there is no possibility to display periods
longer than 2 hours, 46 minutes and 40 seconds on a single graph. Often such high recording
frequency is used for fast changing waveforms that are of short duration, so this limitation is
not a problem. For slow changing waveforms, for example when the recording period is set to
1 minute, this limitation allows to display data from a period of almost 10 weeks, which should
be also sufficient. However, if the user would like to view the data of 1 week when sampling
time is set to 0.1 second, he should use Omit samples mode. This mode allows to display
required period of time, but some samples across the width will be ignored. Number of omited
samples depends on the Maximum number of measurements to show setting. The program
automatically calculate locations of samples that should be displayed spaced from each other
at equal distances. Values of omitted samples can be used to calculate displayed values.
In the Figure 6.5 are shown various options to generate graphs depending on the Data
display style when the Omit samples mode is active. Plots in green are as background for
reference and can't be obtained directly from the DAQ Manager.
16
User manual - PC SOFTWARE DAQ Manager
Figure 6.5. Display options of the graphs when Omit samples mode is active:
A - all samples (1400 samples), B - Averaged (140 samples), C - Real logged (140 samples),
D - Maximas (140 samples), E - Minimas (140 samples), F - [Max - Min] (140 samples),
G - [Max or Min] (140 samples)
The Figure 6.5.A shows a graph where are shown all recorded samples over some
period of time. The black frames marked waveform anomalies as two temorary increases and
one temporary decrease of measure values that should be observed. To display this graph it is
required to generate 1400 samples. If the limit set in the Maximum number of
measurements to show doesn't allow this, then in the Omit samples mode some samples
may be omitted, which may hide presented anomalies. Limiting the Maximum number of
measurements to show to 140 will cause, that for each one sample, 9 will be omitted. If a
temporary increase or decrease in value occurs at place of these 9 samples, this anomaly may
be unnoticed. To neutralize this effect it is worth a closer look of each option of the Omit
samples mode.
17
User manual - PC SOFTWARE DAQ Manager
Choosing an Averaged option (Figure 6.5.B) will cause the existing anomalies are
observed in the graph in the form of characteristic two increases and one decrease in value.
Real maximum and minimum values of these anomalies are not shown here. In addition, there
is a minimal probability of occurrence some oppositely directed anomalies which the average
value is close to the rest of the samples, so this cause hide these changes.
Choosing a Real logged option (Figure 6.5.C) can be useful for slowly changing values.
It allows to draw a graph based on real measured and recorded values. It is also an alternative
for [Max or Min] option, as in a random way allows to observe the direction of change the real
value of the measured quantity, rather than jumps on the level of local extremes. Because this
option doesn't consider omitted values, there is a risk unnoticed information about temporary
value decreases and increases, as is the case in the above graph, where from 3 extremes in a
significant way has been noticed only one.
Choosing a Maximas option will cause that out of occurring anomalies will be noticed
both temporary increases in value (Figure 6.5.D). The value of displayed point is the largest of
every 10 points. This option is useful for displaying measurement data of the process, for
which a sudden increase could be harmful and should be observed.
Choosing a Minimas option will cause that out of occurring anomalies will be noticed one
temporary decrease in value (Figure 6.5.E). The value of displayed point is the smallest of
every 10 points. This option is useful for displaying measurement data of the process, for
which a sudden decrease could be harmful and should be observed.
Choosing a [Max - Min] option will display span changes of recorded values for each 10
omitted points. This option allows to observe the rank of stability of the measurement for each
group of omitted points. If recording was made with a sampling 0.1 second and set the
maximum number of displayed measurements allows to display 1 for every 10 recorded
samples, the value of each point of the graph allows evaluate how much has changed real
values of measuremens at every second. This option also allows to capture moments where
out of each 10 measurements there are two opposed temporary changes in recorded values
(two sudden increases in the graph [Max - Min]) (Figure 6.5.F).
Choosing a [Max or Min] option will display only the "most important" local extremes that
occurred in the omitted samples. In this mode, the program will decide what value of largest or
smallest is more distant from the average of omitted measurements. This option allows to find
a situation where the option Averaged could not show the fact of occurrence local extremes by
mutual elimination the values used to calculate the arithmetic mean. Here one of the local
extreme is always displayed. This option provides a combination of options Maximas and
Minimas, as it allows to show partially one or the second value (Figure 6.5.G).
18
User manual - PC SOFTWARE DAQ Manager
6.3. “ETHERNET” TAB
Here we can find the default settings for the Ethernet devices (Figure 6.6), which are
used for creating new virtual devices (see section 4.1).
Figure 6.6. Program settings – Ethernet tab
6.4. “CURRENT MEASUREMENTS” TAB
These settings concern reading current measurements in real time (Figure 6.7). The
period of polling devices can be freely adjusted in the range from 3 seconds to 24 hours.
Setting 0 in this box will stop the automatic polling and then the current values are only
available on request.
Additional description of the current measurement settings can be found in section 11.1.
Figure 6.7. Program settings – Current measurements tab
6.5. “PRINTOUT” TAB
Under this tab we can find settings that affect how to create reports as printouts. Setting
"First Page Banner" responsible for placing the user's graphic on the first page of each printout
(Figure 6.8). This allows user to attach logotype, company data and other constants for each
printouts. In creating a graphic bear in mind that it is not too small, because at the printing time
it is scaled proportionally to the width of the page.
Figure 6.8. Program settings – Printout tab
19
User manual - PC SOFTWARE DAQ Manager
Banner has fixed place on the printouts and its positions are shown in figure 6.9.
Figure 6.9. Sample printouts with attached user's banner
7. BROWSING LOGS
Based on measurement data collected from devices, DAQ Manager can generate a
report as a table with all channels in the current log or in the form of graph to facilitate data
analysis.
7.1. SELECTION OF TIME RANGE
By selecting desired log in the device list, the program sets internal time intervals,
computing data volume and automatically selects the last 3000 samples for displaying.
Automatic selection of the last 3000 samples may be blocked. This is useful if the user
change the log, for example, select one from a different group. It doesn't have to re-select the
time range that it was interested in the previous log. To lock the selected time range, the user
must check the "Don't change selected time range, if you choose another log" which is located
in the center of the time line (Figure 7.2). In the center of time area there is also the [Omit
samples mode] button, which is described in the section 6.2.
The time range can be also defined manually by typing selected dates, or less accurate
but faster, using the time line.
Blue on the time line means there is no measurement data.
Gray indicates that during this period there is some measurement data, but is not
selected to be included in the report. The measurement data are grouped into files which are
parts of the log. Each of these parts has its own number and contains information about the
time range of the recorded data (Figure 7.1)
20
User manual - PC SOFTWARE DAQ Manager
Figure 7.1. The division of registered data to parts
If any part is missing, then in its place will be the blue color.
Orange means that the report will be generated just from this time range. The orange
range can be freely modified by using the mouse (Figure 7.2).
Figure 7.2. Choice of time range
On the left and right side of the time line there are buttons that allows you to move the
specific time period forward or backward. Changing the viewable region of the time line
(Figure 7.3.a) and automatic selection of the time range of the last measurements (Figure
7.3.b) are available from the context menu of the time line or down-arrow icon.
a)
b)
Figure 7.3. Contents of the context menu of the time line:
a) choice one of the predefined views
b) choice one of the predefined time ranges
With the rapid change of the visibility range of the time line, the user can easily switch
between different views and find the last selected time range.
In for easier choice of the time range in which the data were recorded the timeline
displays markers indicating the timestamps of startup (green) and shutdown (red) of the device
(Figure 7.4).
21
User manual - PC SOFTWARE DAQ Manager
Figure 7.4. Information about startups and shutdowns the device
This information provides the device with firmware version starting from 4.03.1.
i
If there are two green markers one by one, it could mean that between each startup
the device was not properly closed, and it may be the reason of errors occurring in
the recorded data.
After select a time range, user can generate the report as a table or a graph by clicking
on the [Generate] button or double-click on any log on the devices list.
DAQ Manager allows the user to show in the graph area a special mark (red line) that
indicates the time difference of the first (last) generated sample relative to the begin (end) of a
user-selected time range (Figure 7.5).
Figure 7.5. The difference of the start and end of data relative to selected time range
7.2. AUTOMATIC REPORT REFRESH
Generation of the report can be done in an automatic way each time, when the program
receive new data for the unclosed log.
To use this feature, select on the device list one in progress log (unclosed). Then select
the period of the time for this log that will be moved at the end of data download process, then
expand Advanced options, which are located under the [Generate] button and check
Automatically option (Figure 7.2).
22
User manual - PC SOFTWARE DAQ Manager
For example, if the user specifies the time range on the time line from 2012-01-02
10:15:17 to 2012-01-02 11:15:17, this means that the period of time is 1 hour. This one hour
period is used for the calculation of the new beginning and the end of time selection, if there is
new data.
Automatic report generation is triggered each time when the process of downloading data
from the device via the network interface will be complete. Downloading data from the device
can be initiated by the user or by shedule of automatic data downloading (see section 4.3).
Automatic report refresh function combined with automatic data downloading is
especially useful in applications where it is necessary to periodic monitoring the recorded data.
7.3. THE TABLE
7.3.1.General information
The created table consists of columns with measure number counted from the time of
activation of the log, sample time (time stamp) and the data values of particular channels
(Figure 7.6).
Figure 7.6. Create a report as a table
If the value in the channel exceeds Low Value or High Value specified in the settings of
the selected channel (Figure 5.6), then in the table displays “[LO]” or “[HI]” beside the value.
However, if the channel has the setting Display Format as Binary, then instead of real value,
a label is displayed (defined by Label ON / OFF settings), where Label ON is accepted for
values greater than 0.
i
By pressing the [Export to file …] button you can save the table as a CSV file
which can then be opened with any spreadsheet program. After each export DAQ
Manager suggests to open the file in the default program.
23
User manual - PC SOFTWARE DAQ Manager
7.3.2.Synchronization with the graph
Together with a table with measurements is generated the corresponding graph.
Changing the highlight of the active row in the table will automatically highlight the
corresponding data points on the graph (Figure 7.7).
Figure 7.7. Highlighting the graph points using the table
Active row in the table can be changed by mouse clicks, mouse whell rotation, scroll bars
and the keyboard using arrow keys, PageUp/PageDown and Home/End.
Checking the option "Center graph on select" results, that the change of the active row in
the table move the graph so that the measuring points remain in the center of the plot area.
Checking this option is useful when the highlighted points would go outside of the viewing area
due to zoom in a portion of the graph.
7.4. THE GRAPH
Along with the table, you can create a graph with all logged channels (Figure 7.8).
Figure 7.8. Create a report as a graph
24
User manual - PC SOFTWARE DAQ Manager
7.4.1.The legend
The legend of the graph is interactive and allows you to select channels to show and
adjust their settings.
Each channel contains two checkboxes labeled Y and Yc, which relate to two axes of the
graph, the left and right respectively (Figure 7.6). Checkbox labeled Y can be in one of three
display states according to the following table.
Setting
Action Description
The channel is active. The graph and the Y-axis are displayed.
The channel is active. The graph is displayed, but not the Y-axis
Channel is inactive. The graph, Y-axis and notes of the data points are
not displayed. Channel won't be included on printout, at copying and
saving the graph as a graphic file and to create a reference.
Change displaying state of the channel can be done by clicking on it or using the context
menu.
Moving the cursor over one of the channels on the legend causes set automatically the
grid and Y-axis for this channel. To display more than one Y-axis, uncheck the option Auto
choose right Y-axis, which is located in the legend Settings.
To feature visually one of the channels on the background of the others, it may be helpful
to activate the Highlight selected channel option. Use this option carefully, because too
much data can drastically slow down plotting the graphs.
Checkboxes labeled Yc assigned to each channel are bistate. Checking this box will
cause that selected channel will be added to the common Yc axis on the right side of the
graph. Adding each next channel to this axis, will automatically scale all graphs which are
already there to proper display each of them (Figure 7.9).
Figure 7.9. Adding selected channels to the common Yc axis
25
User manual - PC SOFTWARE DAQ Manager
Clicking on labels Y or Yc located in the top of legend will automatically switch states of
all checkboxes in the selected column. This allows to quick change displaying state of all
channels on the selected axis.
Clicking Settings label causes opening menu with additional graph settings (Figure
7.10). There is possibility to choose following options:
1)
Show background grid – turns on and off grind on the graph,
2)
Auto choose right Y-axis – allows to automatically switch Y-axis depending on
selected in the legend logical channel,
3)
Highlight selected channel – allows to highlight on graph selected in the legend
logical channel,
4)
Quick selected channel – when this option is on, the program will remove from its
internal memory all logical channels which are not selected in the legend which
allows to free memory for other programs. When this option is selected, logical
channels are only hidden and can be displayed much quicker, but still they will be in
memory,
5)
Show breaks – allows to display breaks in logging as a vertical lines on graph,
Figure 7.10. View of Settings menu
7.4.2.Scaling and moving
The scale of the graph can be changed by clicking on the time axis or the value axis and
dragging it horizontally or vertically.
In addition, the scale of the time axis can also be changed by pressing the [Zoom In] or
[Zoom Out] buttons. A similar effect can be obtained by pointing your mouse any location in
the graph and while holding down CTRL key, rotate the mouse wheel.
The last method, which allows you to zoom in a portion of the graph is scaling using a
window selection. To do this, click the right mouse button in the upper left portion of the graph,
that you want to zoom in, then drag the selection in the direction of bottom right corner of the
chosen portion.
The default scale of both axes can be obtained using the [Reset view] button.
The graph can be moved by clicking on the graph and dragging it by mouse horizontally
or vertically.
In addition, the graph can be moved horizontally by pressing [Move Left] or
[Move Right] buttons or by mouse wheel.
26
User manual - PC SOFTWARE DAQ Manager
7.4.3.Synchronization with the table
To find in the table the location of pointed samples in the graph, click the left mouse
button at the desired graph location. This action will change the active row in the table to the
proper for the pointed measurement (Figure 7.11).
Figure 7.11. Changing the active row of the table by the graph
If the graph window is docked, the effect may not be visible. To immediately display the
table with the active row, please hold the CTRL key during click.
i
Synchronization doesn't applicable to reference graphs.
7.4.4.Transfer to other programs
For easier transfer different views of graphs to the outer programs, DAQ Manager comes
with two useful functions for this purpose.
The first one is a feature to copy to the clipboard the current graph view as a bitmap. It is
accessed from the context menu of the graph.
The second feature of the program allows you to save the current graph view as a raster
file in one of three formats: PNG, BMP and JPG. This function is also located in the context
menu of the graph.
Dimensions of the image created by these functions correspond to the dimensions of
currently displayed graph.
27
User manual - PC SOFTWARE DAQ Manager
8. CREATING REPORTS
8.1. PRINTING THE TABLE
After generating data from selected time range, the user can print the table by clicking on
the [Print...] button at the bottom of the Table tab (Figure 8.1). This command will display a
printer selection window, if there is more than one installed on the system.
Figure 8.1. Print the table
i
If the printer driver can't preview pages before printing, it is worth thinking of
installing a virtual PDF printer in order to be able to view the printed copy and
prevent printing too many incorrect pages. With a large number of measurements
printout may consume more than 1300 pages (100,000 measurements, A4, 76
measurements per page).
8.2. PRINTING THE GRAPH
The graph view specified by the user can be printed using the [Print Graph...] button
(Figure 8.2).
Figure 8.2. Print the graph – individual scales for visible channels
On the printout, there will be visible only scales of the Y-axis selected by the user and
this is consistent with the current view.
If the data of several channels have similar values, then before you print, it may be
helpful to change the method of the Y-axis scaling in such a way that the scale will be common
to all channels. This can be done by selecting the Common scale for all channels in the
selected log, accessible from the [Devices] side menu (Figure 8.3)
28
User manual - PC SOFTWARE DAQ Manager
Figure 8.3. Enabling a common scale for all channels in selected log
When you select this option, the scale of the Y-axis will be common for the checked
channels (Figure 8.4).
Figure 8.4. Print the graph – common scale for visible channels
If the legend on the printout covers an important part of the graph, its position can be
changed before printing by moving the active legend on the screen. Upper left corner of active
legend indicates a position of anchoring the legend visible on the printout.
9. ANNOTATING GRAPHS
DAQ Manager allows to add annotations on the graph to the selected points.
Annotations in the form of notes can be helpful to mark significant events of the recorded
process. In the case of reference graphs annotations can be useful for marking reference
points or placing other information. Notes can be in the many form of user-defined styles,
which often helps the visual interpretation of information (Figure 9.1).
29
User manual - PC SOFTWARE DAQ Manager
Figure 9.1. Notes in many styles define various types of information
9.1. CREATING NOTES
User can add a note to the graph using the [Add note...] command from the context
menu. This will show the Add note window (Figure 9.2).
Figure 9.2. The window of adding a note
If the place of call the context menu were outside the points area belonging to one of the
channels, the window will automatically set to add note as an anchor for all channels. If in the
moment of call the context menu the mouse pointer was in area of the points of the selected
channel, this channel is automatically set as the anchor for note. The place of anchor the note
in the Add note window can be changed between the nearest channel and all channels.
Enter any text in the Text field and click on the [Add] button to create a note for the
selected point of the graph.
Leaving the Appearance field in the default setting will cause the appearance of the note
will be adjusted for maximum readability with automatic background color of channel.
30
User manual - PC SOFTWARE DAQ Manager
9.2. CREATING TYPES OF NOTES
During creating or editing a note, the program allows to choose the appearance of the
note. A list of appearances can be customized to individual needs and that way specify
different types of information placed on the graph. To edit this list of appearances, click on the
[Edit...] button in the window of adding a note (Figure 9.2) or edit a note (Figure 9.4). You will
see the Notes Appearance Editor shown in Figure 9.3.
Figure 9.3. Notes Appearance Editor
The user have here the possibility to define any number of different-looking types of
notes. Each type has its own identifier in the form of a number and a name. The number is
chosen automatically and is connected with notes. The names of the notes can be duplicated.
Appearances types of notes are global for the entire program. This means that, once
defined, may be used in different graphs, both which relate to logs and references.
!
If the user have already added to his graphs some notes with pre-defined
appearance and next removed this appearance, these notes will be displayed on
the graph in default way.
9.3. EDIT AND DELETE NOTES
9.4).
To change the parameters of the previously created note, run the edit window (Figure
Figure 9.4. The window of editing the note
31
User manual - PC SOFTWARE DAQ Manager
This can be done by clicking left mouse button on the note. The user can also point by
cursor the location of graph point to which the note is anchored, and then choose [Edit note...]
from the context menu. If the mouse pointer will be near the points of plots and at this point is
defined a note for all channels, then this note can be edited from the context menu.
To remove a note defined for one channel, point this note or plot point where it occurs
and click [Delete note] command from the context menu.
To remove a note defined for all channels, point this note or area where it occurs and
click [Delete note] command from the context menu.
10. REFERENCES
The program allows to create independent sets of data from selected parts of the logs.
These new data sets, called references can then be viewed in the form of graphs. Way to
navigate through the reference graph and most operations are similar to graph known from the
data generated from log (see section 7.4).
10.1. GENERAL INFORMATION
The user can create references to save part of the log, which will provide a record of the
process under ideal or extreme conditions. The graph of this part can be used many times for
visual comparison of the same process at different times using the graph generated directly
from log or other reference.
Because for each reference user can define an individual name and a detailed
description and the time range is constant, it can be created to extract especially interesting
fragments of the log for quick access. If we need to display data directly from the source log,
that based on the information window of reference we can check where it came from. Notes
created for the reference don't affect the source log. Such references can be used to quick
reporting or exchange the data between DAQ Manager programs.
i
Each reference is a comprehensive data set in a single file that contains, apart from
measurement data, also all information and settings required for the proper display
it in the program. Reference files are located in the "refs" subdirectory which is
located in the installation directory. Inside it there are files with names like
"ref_*.db". DAQ Manager during startup scans this directory to update list of
references. It makes easy to distribute these files between programs.
10.2. CREATING REFERENCES
Creating a new reference is as follows. First, user should generate a table and a graph of
data based on any log with an interesting range of time. Then zoom in part of the graph, from
which the reference will be created and disable unnecessary channels. After these operations,
the source graph is ready to create a reference. Reference can be create by clicking the
[Create reference] button (Figure 10.1).
32
User manual - PC SOFTWARE DAQ Manager
Figure 10.1. Creation of a reference
After that, it displays the Create reference window (Figure 10.2).
Figure 10.2. The Create reference window
In this window, the user can give the name and description of reference and specify
manner of retrieve the source data. Checking the Show after creation option will
automatically display the graph after copying the data.
Each reference graph appears as a new tab to the right of the Graph tab (Figure 10.3).
Figure 10.3. Example of opened reference graph
The reference graph contains only selected channels and defined data range. Were also
copied all notes for selected channels that were in the source log.
The tab of reference graph is identified by a special icon and can be closed at any time.
Closing the tab means freeing memory with the resources used by reference. Re-opening any
reference is possible from the list of references (see section 10.3).
33
User manual - PC SOFTWARE DAQ Manager
10.3. LIST OF REFERENCES
Access to the list of references is possible from the side menu under the References
position (Figure 10.4).
Figure 10.4. List of references
This list is automatically updated with each new reference the user will create using the
program or manually upload it to the "refs" directory (see section 10.1).
The name and description for each reference in the list can be changed at any time from
the context menu of the list. From the same menu the selected reference can be deleted.
To identify the source of reference or obtain information about the selected data set, click
the [Information] command from the context menu.
To show the graph of selected reference, double-click or invoke the [Show] command
from the context menu of the list. Amount of simultaneously opened reference graphs is
arbitrary and limited only by free RAM memory of the PC.
10.4. COMPARING GRAPHS
The primary function of the reference graphs is able to refer to these the recorded graph
shapes of the similar or the same process and in a different period of time. Such comparison
allows to capture especially important changes affecting the entire process.
Opening several reference graphs at the same time allows to quickly switch between
tabs.
Each tab with the the graph can be undocked and displayed as independent window.
Arragement these windows next to each other can view a few graphs from many different
sources on a single screen (Figure 10.5).
34
User manual - PC SOFTWARE DAQ Manager
Figure 10.5. Comparing charts from many different sources
To capture more subtle differences between the graphs, the Graph window can be
overlapped of the selected window with reference and by changing the level of top window
transparency, expose differences in the plots. To control the level of transparency of the
window use a slider, which is located in the lower right corner of the graph (Figure 10.6).
Figure 10.6. Change the transparency level of the graph window
Closing the window with the graph will dock it as a tab. If this is a reference window, then
holding down the CTRL key while it is closed, it will close and release the resources of this
reference.
35
User manual - PC SOFTWARE DAQ Manager
11. CURRENT MEASUREMENTS
DAQ Manager allows you to view current measurements using an Ethernet network
connection. Users have two options for previewing data. Current measurements can be
displayed in the form of a channels oriented table on the device or in graphical form as a preprepared HTML page with embedded Java applets oriented on single channels of the device.
!
The device, which will be a source for current measurements must be equipped with
ACM module, which enables connection to Ethernet network.
11.1. THE TABLE
Access to the table with current measurements is possible by clicking on the Table item
in Current measurements section. There are tabs for each device that has properly
configured settings for network connections and the ability to view current measurements is
set to active (Figure 11.1).
Figure 11.1. Table with current measurements
If there is no a tab for the device, which measurements we want to track, then you should
go into your device settings, check the Current measurements option (Figure 11.2) and save
settings.
36
User manual - PC SOFTWARE DAQ Manager
Figure 11.2. Activation of current measurements
The polling interval of devices for new measurements is adjustable in the program
settings on the Current measurements tab (section 6.4).
Current measurements mode allows you to preview the basic parameters of channels
such as channel name, type and the current measured value with set unit. It also calculates
the average of the measurements which occurred after the last buffer reset. For minimum and
maximum values is also stored with the time of their occurrence, which can be displayed by
moving the mouse cursor over the desired value.
All values displayed in the table may be marked according to the following table:
Colour
Event Description
blue
A value in the table is below the graph low value, which was set in the
device.
red
A value in the table is above the graph high value, which was set in the
device.
Access to the settings of the graph thresholds for selected channel is possible from the
MultiCon device as follows:
MENU > Device configuration > Input channels > Displaying
> Graph low
> Graph high
If the display format is set to “binary”, then in the table the user will see the label
corresponding to the value of the channel.
The [Measure] button is used to take recent data from the device without waiting for
automatic read.
11.2. JAVA APPLETS
Java applets have been designed to read the current measurements from the each
channel of the selected device. They allow to visualize of the current measurements as various
types of graphical presentation. Support for Java applets was introduced in version 2.30 of the
device firmware. Before using the Java applets functionality it is recommended that the
firmware of the MultiCon device be updated.
!
Java applets use a Modbus TCP protocol to communicate with the device. Make
sure that the last Modbus port in the device, which works on above protocol, is set
to SLAVE mode.
37
User manual - PC SOFTWARE DAQ Manager
11.2.1.Introduction
A Java applet is a special file with the *.jar extension, which requires the Java Virtual
Machine (JVM) to be installed on the system. Applets are designed and tested using Oracle
JVM. To ensure, that the applets are functioning properly, an user should update the runtime
environment of the JVM to the latest version from http://www.java.com website.
Applets can be embedded on a page of any Web server. This allows a preview of the
current measurements from anywhere using any web browser with the Java plug-in. You can
also design an HTML page, which will be placed locally on your hard disk. For this purpose,
you can create a subdirectory in the installation directory of the program and put the designed
pages there.
The HTML page should be designed in a way, that *.jar files were taken directly from the
MultiCon devices. All devices with the ACM module contains a web server that provides the
device information. There is a link “Logical channels graphical view” where you can find a
complete functional example of using Java applets embedded on HTML page.The applets
parameters
11.2.2.Parameters of the applets
When an applet is embedding in a HTML document it is necessary to let it some
parameters. These parameters configure the applet to work with the selected channel of one
device. Some of the parameters are required, which means that without giving any of them,
the applet will not run. All parameters possible to set are shown in the table below. Their use is
presented in section 11.2.3..
Tab. 11.1: The applets parameters
Name
Default
value
device.address
required
channel
required
channel.type
required
port
502
channel.name
empty
channel.unit
empty
color
38
BBBBFF
Possible values
Description
Address of the device. This is the IP address, e.g.
“192.168.1.97” or the correct domain name, e.g.
“your.device.com”.
Modbus register address of logical channel
512, 516, ...748 specified in decimal format. For ease the list of all
1024, 1028, ...1260 measurement registers of MultiCon devices is
shown in Table 11.2.
Specifies that the value returned by the selected
logchan_float register is in the floating-point format. By default
for registers 512÷748.
Specifies that the value returned by the selected
logchan_int
register is in the integer format. By default for
registers 1024÷1260.
Port
of service running on the MultiCon device
0÷65535
used to handle Modbus TCP protocol.
Any name used by the applet to represent the
any text
channel.
Any unit displayed on the indicator next to the
any text
current numerical value.
The indicator color as RGB sequence given in
000000÷FFFFFF hexadecimal format. Selecting the color helps
http://html-color-codes.info/ page.
IP address or
domain name
User manual - PC SOFTWARE DAQ Manager
Default
value
Name
Possible values
Description
text
Type of indicator that displays the value as a text.
needle
gauge.type
text
hbar
vbar
chart
range.min
0
The number in
IEEE-754 format
range.max
20
The number in
IEEE-754 format
Type of indicator that displays the value as a
needle.
Type of indicator that displays the value as a
horizontal bar.
Type of indicator that displays the value as a
vertical bar.
Type of indicator that displays the value as a
graph.
Defines the minimum value is displayed. It is used
to determine the level of 0% and lower limit on the
Y-axis of the graph.
Defines the maximum value is displayed. It is
used to determine the level of 100% and higher
limit on the Y-axis of the graph.
The size of the letters in the names of parameters and its values does not matter, so the
assignment "Gauge.Type"="HBar" is equivalent assignment "gauge.type"="hbar".
Tab. 11.2: Addresses of measurement registers of the MultiCon devices
Name
Channel 1
Channel 2
Channel 3
Channel 4
Channel 5
Channel 6
Channel 7
Channel 8
Channel 9
Channel 10
Channel 11
Channel 12
Channel 13
Channel 14
Channel 15
Channel 16
Channel 17
Channel 18
Channel 19
Channel 20
Register Address
float
512
516
520
524
528
532
536
540
544
548
552
556
560
564
568
572
576
580
584
588
int
1024
1028
1032
1036
1040
1044
1048
1052
1056
1060
1064
1068
1072
1076
1080
1084
1088
1092
1096
1100
Register Address
Name
Channel
Channel
Channel
Channel
Channel
Channel
Channel
Channel
Channel
Channel
Channel
Channel
Channel
Channel
Channel
Channel
Channel
Channel
Channel
Channel
21
22
23
24
25
26
27
28
29
30
31
32
33
34
35
36
37
38
39
40
float
592
596
600
604
608
612
616
620
624
628
632
636
640
644
648
652
656
660
664
668
int
1104
1108
1112
1116
1120
1124
1128
1132
1136
1140
1144
1148
1152
1156
1160
1164
1168
1172
1176
1180
Register Address
Name
Channel
Channel
Channel
Channel
Channel
Channel
Channel
Channel
Channel
Channel
Channel
Channel
Channel
Channel
Channel
Channel
Channel
Channel
Channel
Channel
41
42
43
44
45
46
47
48
49
50
51
52
53
54
55
56
57
58
59
60
float
672
676
680
684
688
692
696
700
704
708
712
716
720
724
728
732
736
740
744
748
int
1184
1188
1192
1196
1200
1204
1208
1212
1216
1220
1224
1228
1232
1236
1240
1244
1248
1252
1256
1260
39
User manual - PC SOFTWARE DAQ Manager
11.2.3.Creating HTML pages with applets
Designing entire web sites is so wide topic, that cannot be described in a few words.
However, in order to create a simple HTML document you don't have to be an experienced
web master. You can use one of free visual editors which generate right HTML code. May be
required some minor changes only. More complex pages may require help from the web
master. Nevertheless, even the most complex HTML pages, a web master can made in a few
hours.
There are a lot of visual editors that allow to build more or less complex HTML pages.
One of the best free solution is the Microsoft product named Office SharePoint Designer 2007,
which can also be used for commercial purposes. Creating a simple HTML page with this
program using the WYSIWYG method is very intuitive and the generated code is quite optimal.
To create a simple web page generally you should follow three steps:
I.
II.
III.
Prepare a drawing (a layout) or take a photo of the monitored room (object or
system)
Create a web page using the image file created in step I.
Embedding an applet in the selected location of the page and set its parameters
USING A VISUAL EDITOR
Below is shown an example of these steps with SharePoint Designer 2007 using
WYSIWYG technique.
40
1)
Prepare of the image file
Creating a background image is not necessary, but improves orientation in the
monitored system. To create a room plan, you can use any raster graphics editor and
saving the file in one of the formats: *.png, *.jpg, *.gif. Instead of creating a plan, a
good solution is to take a photo of the real object on which indicators will be placed.
2)
Create a HTML document
Main window of the SharePoint Designer 2007, just after start looks like in Figure
11.3.
User manual - PC SOFTWARE DAQ Manager
Figure 11.3. Main window of the SharePoint Designer 2007
Main window contains already an empty HTML document, which must be given a
name and must be saved. To do this, select command [File] > [Save As...] from the
menu. In the dialogue box should be given a title of the document by clicking on the
[Change title...] button, then select the location and enter file name (Figure 11.4). If
the page will be stored locally on your PC, it is recommended to create a subdirectory
with the name of the monitored system in the subdirectory of DAQ Manager
installation folder named “AppletSites”, which is intended for HTML pages. For the
current example the location is C:\Program Files\DAQManager\AppletSites\
ChemLab\chemlab_en.htm.
41
User manual - PC SOFTWARE DAQ Manager
Figure 11.4. Giving a title and saving the page to the disk
3)
Division of the document to the header and the indicators area
The document in the example will be composed of two parts: a header and area of
indicators. This division obtains using the table. To do this, select the [Table] >
[Insert Table...]. In the window that appears, set the following parameters:
Rows: 2
Columns: 1
Alignment: Center
and uncheck Specify width
4)
Prepare of the header
In the first row of the table, enter a name of the system which will be monitored, such
as “Chemical Laboratory”. Then click on the icon of the text alignment [Center] and it
will create a new style named “.style1”. Change its name to “header”. To do this,
switch to the [Manage Styles] tab and select [Rename class “style1”...] from the
context menu of the new created style (Figure 11.5).
Figure 11.5. Changing the style name
42
User manual - PC SOFTWARE DAQ Manager
To improve the appearance of the header you should perform a few modifications to
its style. Click the command [Modify Style...] on its context menu. Window “Modify
Style” appears (Figure 11.6).
Figure 11.6. “Modify Style” window
In the window you can see that the style has already set a property: Block > textalign: center. You need to modify the following properties:
Font > font-family: Arial, Helvetica, sans-serif
Font > font-size: 30 pt
Font > font-weight: bold
Box > padding: bottom: 15 px
and click OK.
5)
Prepare of the indicators area
Take a <div> tag from the toolbox and drag to the second row of the table ( Figure
11.7).
Figure 11.7. Dragging the tag from the toolbox.
Then click on the arrow next to the <div> tag on the nesting bar and select the
command [Positioning] > [position: relative] (Figure 11.8).
43
User manual - PC SOFTWARE DAQ Manager
Figure 11.8. Creating a new layer from the <div> tag
After this operation the <div> tag will be converted to a layer, which you can name. To
do this, switch to the [Layers] tab. If this tab is not visible, you must first enable it by
using the [Format] > [Layers...] command. Right click on the layer <No ID> and go
to [Modify ID...], and then enter the name “background”. Created layer will be a
container for background image and for applets that will be positioned relative to it.
6)
Inserting a background image
Click in the area of the second row of the table, so the label “div#background” should
appear. Insert the prepared background image by using the menu [Insert] > [Picture]
> [From File...]. At the prompt to enter alternative text you can uncheck the box next
to it (Figure 11.9).
Figure 11.9. Confirmation of inserting a picture
7)
Embedding an applet
To add a Java applet into the prepared site, click somewhere on the previously
inserted image and press the right arrow key to move the cursor next to the picture.
Then choose a command from the menu [Insert] > [Web Component...] >
[Advanced Controls] > [Applet Java] and click [Finish]. You will see a “Java Applet
Properties” window. In the Source applet field please enter:
jmulticon.gauge.McGaugeApplet.class
44
User manual - PC SOFTWARE DAQ Manager
Then add required parameters of the applet (see section 11.2.2.):
Name
Value
device.address IP address or domain name
channel
516
channel.type
logchan_float
You can also specify additional parameters that are not required, but allow you for
adjust of the indicator properties. Parameters that are omitted have default values:
Name
port
Value
Default value
502
502
channel.name
Temp.
empty
channel.unit
°C
empty
color
FF6600
BBBBFF
gauge.type
needle
text
range.min
0
0
range.max
30
20
Window of the applet properties is shown in Figure 11.10.
Figure 11.10. Defining a new parameter of the applet
45
User manual - PC SOFTWARE DAQ Manager
When you finish, set the parameters and click OK. You must still specify the source
location from where the applet will be downloaded to the web browser. Each device
that is equipped with the ACM module contains applets, which can be accessed using
the http protocol. To specify the source location of the applet, select the applet in the
design window and in the [Tag Properties] tab, in the archive attribute write value
http://ADDRESS/channels/jmulticon.jar, where ADDRESS is the IP number or domain
assigned by the DNS server (Figure 11.11).
Figure 11.11. Specifying the source location of the applet
The applet is ready to run, but still needs to be positioned on the page.
8)
Changing the position of the applet
To change the position of the applet relative to the background image, click on the
arrow next to the <applet> tag on the nesting bar and select the command
[Positioning] > [position: absolute] (Figure 11.12). This operation allows you to
move the applet freely around the page area and its position will always relative to the
previously created “background” layer.
Figure 11.12. Activation the possibility to move freely the applet
46
User manual - PC SOFTWARE DAQ Manager
By grabbing the “applet” label, you can move it anywhere in the background. With the
special holders you can also adjust the size of the applet (Figure 11.13).
Figure 11.13. Changing the position and size of the applet
9)
Duplicate the applets
The easiest way to create another applet on the page, which will represent another
logical channel of the specified device is to copy an already existing applet and adjust
its parameters. To do this, right-click on an existing applet and select [Copy], then
right-click on the background image and select [Paste]. This will create a new applet
on the top of existing one. The new created applet can be moved to a new position by
its label. Adjust its parameters can be done by double-clicking on its surface.
If the above steps have been completed and the page was saved, the project is ready to
run using a web browser. This can be done directly from the SharePoint Designer from the
menu [File] > [View in Browser] > [Windows Internet Explorer] or use the keyboard
shortcut F12.
If the IP address identifies the device, which is turned on and is currently in the network,
that on the page in a web browser should show a fully working applet (Figure 11.14).
Figure 11.14. Ready web page with the working applet
47
User manual - PC SOFTWARE DAQ Manager
As you can see, create a simple web page with a single applet is not so difficult, even for
a person who had no contact with the HTML language, before. However, basic knowledge of
this language is useful for creating more complex pages.
USING A TEXT EDITOR
Steps to create an HTML document in a visual way caused to generate some HTML
code. User more familiar with creation of the web sites probably wants to use the possibility to
directly intervene to the HTML code, as this gives greater control of its appearance. To display
HTML code in the SharePoint Designer, click the [Split] or [Code] button in the lower left
corner of the project. Created code should be similar to the following.
<!DOCTYPE html PUBLIC "-//W3C//DTD XHTML 1.0 Transitional//EN"
"http://www.w3.org/TR/xhtml1/DTD/xhtml1-transitional.dtd">
<html xmlns="http://www.w3.org/1999/xhtml">
<head>
<meta http-equiv="Content-Language" content="en" />
<meta http-equiv="Content-Type" content="text/html; charset=utf-8" />
<title>Chemical Laboratory</title>
<style type="text/css">
.header {
text-align: center;
font-family: Arial, Helvetica, sans-serif;
font-size: 30px;
font-weight: bold;
padding-bottom: 15px;
}
</style>
</head>
<body>
<table align="center">
<tr>
<td class="header">Chemical Laboratory</td>
</tr>
<tr>
<td>
<div style="position: relative" id="background">
<img src="res/lab_scheme.png" width="530" height="464" />
<applet code="jmulticon.gauge.McGaugeApplet.class"
archive="http://192.168.1.97/channels/jmulticon.jar"
style="z-index: 1; position: absolute;
top: 338px; left: 132px; width: 166px; height: 101px">
<param name="device.address" value="192.168.1.97" />
<param name="channel" value="516" />
<param name="channel.type" value="logchan_float" />
<param name="port" value="502" />
<param name="gauge.type" value="needle" />
<param name="channel.name" value="Temp." />
<param name="channel.unit" value="°C" />
<param name="color" value="FF6600" />
<param name="range.min" value="0" />
<param name="range.max" value="30" />
</applet>
</div>
</td>
</tr>
</table>
</body>
</html>
48
User manual - PC SOFTWARE DAQ Manager
The page that looks like this could be a template for further development for other
monitoring systems. It may also be the base for duplicate indicators by copying the code one
of them, change its parameters and set it to the correct position. Part of the code, which is
responsible for the appearance and behaviour of the indicator was marked in purple.
11.2.4.Access to the applets from the software
Clicking on the [Applets] button in the Current measurements section will display the
interface for managing Java applets (Figure 11.15). At the beginning, the list of pages contains
only the item “[Demo Site for Device 1]”. After designing a page you can add it to the program
by entering the correct URL address or a path to a local file. Paths to files can be defined as
relative to the installation directory of the program. This allows for easy transfer all pages, in
the future, to a new installation directory.
Figure 11.15. The interface for managing pages with Java applets
For more advanced users in creating web pages there is a possibility to transfer several
parameters directly from the program to the page that could interpret them. If the page is on a
server with PHP, ASP or other scripting language, that can process received parameters using
GET method and on this basis generate an HTML document, you can design your site more
universal. Read the current measurements by indicators placed on the page can be done from
devices with different IP addresses. When the IP address will change in one of the device on
the DAQ Manager list, web master no longer needs to modify sources of the web site,
because information about the current IP address may always be passed as a parameter of
the URL. The script allows the interpretation of transmitted parameters even doesn't need to
be placed on the server side. This interpretation can be done on the client side in a static
HTML document using JavaScript. As example realization of such concept is an entry “[Demo
Site for Device 1]”, which is a reference to the demonstration site built-in to the DAQ Manager
since version 1.3.1. List of all variables that can be used in the URL are in the table 11.3.
49
User manual - PC SOFTWARE DAQ Manager
Tab. 11.3: List of variables for use in URLs
Variable
{LANG}
Description
Language of the program interface according to ISO 639-1.
Example: The entry {LANG} will be replaced by “en” if the
interface is in English.
{DEVn_par}
The parameter of the n-th device on the list.
Part par may have the following values:
NAME – the name of the device
•
SERIAL – the serial number of the device
•
IP – the IP address or domain name of the device
•
PORT – the HTTP server port on the device
•
Example: The entry {DEV2_IP} will be replaced by the IP address
of the second device on the list, for example by “192.168.1.98”.
{SERs_par}
The parameter of the device from the list, which serial number is
equal to s.
Part par may have the following values:
NAME – the name of the device
•
IP – the IP address or domain name of the device
•
PORT – the HTTP server port on the device
•
Example: The entry {SER1010P0909_IP} will be replaced by the
IP address of the device from the list, which serial number is equal
to 1010P0909, for example by “192.168.1.97”.
The size of the letters in the names of the variables does not matter, so the
{Dev4_Name} entry is equivalent to {DEV4_NAME}.
11.2.5.Running the selected HTML page
To view the selected page from the list, double-click on its name. This action opens a
dialogue with the designed web page. When you run a page with applets for the first time, the
program prompts you for confirmation to run the applets. Please check Always trust content
from this publisher option and click the [Run] button (Figure 11.16).
Figure 11.16. Confirmation to run Java applets
50
User manual - PC SOFTWARE DAQ Manager
11.2.6.Window with a HTML page
When the page with the applets is fully loaded and the applets connected to the devices,
the user will have the ability to view measurements in real time. The right side of the window
contains the most commonly used operations to help manage the preview window (Figure
11.17). You can scale the page, automatically adjust the size of the window and bring to front
the main window. Additional commands can be found in the context menu of the page.
Figure 11.17. A window with a sample HTML page
The default appearance of the indicators is defined on the design level of the HTML
page. The context menu for each indicator allows temporary changes of its appearance and
provides additional commands for its handling.
If the user does not have a web page designed to his needs, he may use the universal
view of all channels taking a page directly from the MultiCon device, which is mentioned in the
section 11.2.1. Examples of URLs for this case could be found on Figure 11.15 under the
name “MultiCon Direct”. A web page with indicators taken directly from the device makes it
possible to view all of its channels and allows easy change of the display mode (Figure 11.18).
51
User manual - PC SOFTWARE DAQ Manager
Figure 11.18. Web page with indicators from the device
11.2.7.Automatic arrangement of windows
If user opens too many applet windows and they overlap, it will be helpful to use the
[Windows arrangement] button, which is located in the upper part of the applets
management interface. For example, if you open seven windows that overlap, they can quickly
spread out in a 4x2 grid (Figure 11.19).
Figure 11.19. Automatic arrangement of windows in a 4x2 grid
52
User manual - PC SOFTWARE DAQ Manager
System requirements:
- Operating system: Windows XP (32-bit) or later
- processor Pentium/AMD 600 MHz or faster
- 128 MB of RAM or more
- 2 GB or more free disk space
- monitor with min. resolution SVGA (800x600)
- CD-ROM or DVD-ROM
- network card
- keyboard and pointing device (e.g. mouse)
- tested on: Windows XP, Windows Vista, Windows 7, Windows 8
53
User manual - PC SOFTWARE DAQ Manager
54
User manual - PC SOFTWARE DAQ Manager
55
SIMEX Sp. z o.o.
ul. Wielopole 11
80-556 Gdańsk
Poland
tel.: (+48 58) 762-07-77
fax: (+48 58) 762-07-70
http://www.simex.pl
e-mail: [email protected]