1
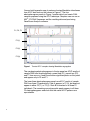
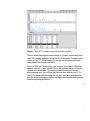
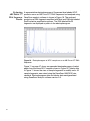
Figure 7 Electropherogram of GeneScan-500 run under denaturing
conditions
Using the Standard Sizing Curve
The Standard Sizing Curve is a measure of how well the standard
definition matches the GeneScan size standard, and whether or not it is
linear.
To align the data by size, GeneScan calculates a best-fit least squares
curve for all samples. This is a third-order curve when you use the Third
Order Least Squares size calling method. For all other size calling
methods it is a second-order curve.
32