1
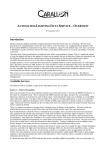
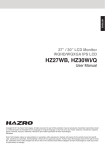
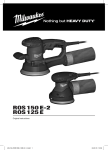
4/5/2012
NDEC
VIEWIT USER GUIDELINES
ViewIt User Manual | NDEC - UoM
Copyright © 2012 NDEC - University of Manchester
Using and distributing this document, or the information in it, is allowed according to the
terms of the FDL GNU Free Documentation License.
Document Version 1.1 of the 5 April 2012.
Contents
Introduction............................................................................................................................ 3
Accessing ViewIt ..................................................................................................................... 3
ViewIt Profiles ............................................................................................................................ 3
Navigating ViewIt: The Filters ................................................................................................ 3
Headline Information (the executive summary) .................................................................... 6
Other Profiles ......................................................................................................................... 9
Visualising Breakdowns: ....................................................................................................... 10
DAT Families............................................................................................................................. 11
Accessing DAT Families ........................................................................................................ 11
Using DAT Families ............................................................................................................... 11
The Results ........................................................................................................................... 13
Further Details ......................................................................................................................... 14
2
Introduction
ViewIt™ is a web based tool which provides a simple way of visualising officially released National
Drug Treatment Monitoring System (NDTMS) data at both a national and local level. It comprises
two main areas, ‘Profiles’ and ‘DAT Families’.
ViewIt Profiles are a means of visualising the substance misuse treatment data from NDTMS. You
can view charts and maps of different treatment indicators and drill deeper into the data at both a
national and local level.
ViewIt DAT Families provides a way of grouping partnerships based on a variety of treatment,
prevalence and socio-economic indicators. These groupings allow partnerships to compare their own
performance data with other similar partnerships, as well comparing against local/national targets.
This area currently has restricted access.
Accessing ViewIt
Access to ViewIt is available from the NDTMS.net home page. Hover over the text ViewIt in the
navigation bar towards the top of the page and select ‘Profiles’ or ‘DAT Families’. N.B. if selecting
ViewIT by clicking on the brown “ViewIT” square this will take you directly to the ViewIT Profiles.
ViewIt Profiles
On selecting ‘Profiles’ from the menu, you will be directed to the Headline Information page which
summarises some of the information available through ViewIt. These summaries automatically
show the data at a national level.
Navigating ViewIt: The Filters
Across the top of each ViewIt page there is a set of filters, which show the currently selected
options. By changing these filters you can change the data (plus associated charts and maps) that is
shown.
From the Headline Information page you have the option to use the filters to either select a different
Geographical level or a different Profile (data item). To change the filters, click on the green bar
above the current selection, and a drop down list will open showing you the current options in that
filter. N.B. the Year filter is not available from the Headline Information page as the data is shown for
all years.
3
Profiles selection:
The profiles filter allows you to select a data item to explore and
visualise. When you select a new profile, the tables, charts and maps
will automatically update to display the requested data.
Geography selection:
The geography filter allows you to take a look at the
data from a local perspective, with all indicators
available at DAT (Drug and Alcohol Action Team)
level. When you click the Geography filter you will
first need to select a general locality (or select
England to view the national data).
Once you have selected a general locality, the panel
will then be populated with a list of DATs within that
general locality, and you can select the specific DAT
you are interested in.
4
Breakdown selection:
Depending on the profile selected, it may be possible to break down the data by a second
demographic or treatment indicator (for instance to crosstab nationality by age). For profiles without
a breakdown, the selected breakdown filter will show as “None Available”, if a breakdown is
available it will show as “None Selected” N.B. when viewing the Headline Information the breakdown
filter is hidden.
Profile without breakdown:
Profile with breakdown:
The exact options available under the breakdown filter will vary according
to which profile you have chosen. Selecting a breakdown option will
update the tables and charts. N.B. mapping is disabled whilst you are
viewing a breakdown.
Year selection:
By default, ViewIt shows a table containing data for all available years, to allow you to examine
trends in the data. However, when a further item has been selected via the breakdown filter it is not
possible to show all years’ data on one table. Therefore, the year filter is provided to allow you to
view the data for different years. When no item has been selected via the breakdown filter (or no
breakdown is available) the Year filter defaults to “All Years” and cannot be changed. Once an item
has been selected via the breakdown filter, the Year filter defaults to the latest year, and you can
then select any available year to compare each year’s data and view trends.
5
Headline Information (the executive summary)
When you first access ViewIt, the default page is the Headline Information, a suite of key indicators
from officially released National Drug Treatment Monitoring System (NDTMS) data selected to give a
broad overview of drug treatment. Each indicator has been calculated for the last 6 financial years.
The first time that this page is accessed, data is automatically displayed at a national level. Below
shows the information that is available in this section:
The table and chart:
The single table that is displayed presents the data indicators in rows down the left of the table and
the 6 years in columns across the top of the table. On the far right of each row is a “visualise”
button:
Clicking this button changes the chart to the right of the table and the maps displayed below the
table to show the selected indicator. The chart is shown as a line graph which plots the trends for
the chosen indicator across the 6 years. If you hover the cursor over the line of the graph an
information box will pop up at each data point providing further details.
6
The Maps:
A map showing the local distribution of the selected indicator is found at the bottom of the page.
Tabs across the top of the map allow you to view a map for each of the six years, so you can see how
the distribution changes with time.
If you select a different Geography whilst viewing the Headline Information, a national distribution
chart is added to the maps section (see next page) which allows you to pinpoint where that local
Geography is placed on a national scale.
The national distribution chart is a line graph containing a data point for every DAT in the country.
The selected DAT is marked on the distribution chart with a map-pin icon (the approximate location
of the DAT is also shown on the map).
Hovering over the line will show data points and give further information about each DAT in the
sequence. Additionally, by clicking and dragging either vertically or horizontally on the line graph,
you can zoom in on the line to make it easier to identify where individual DATs lie relative to each
other. To return to the full distribution, simply double click the chart.
7
8
Other Profiles
There are some minor differences between the tables and charts for the Headline Information and
the other profiles available on ViewIt.
For the other profiles, two visualisation buttons are available allowing you to visualise data by either
column or row, depending on the view you are interested in.
Visualise by Row:
Visualising a profile by row allows you to examine the trend over time in a given value. The chart is
presented as a bar chart (hovering your mouse over each bar will give further information).
As with the headline information, maps are available beneath the chart and table with tabs for each
year, allowing you to view changes in distribution over time. However, the maps for other profiles
generated at DAT level do not have a national distribution: this is only available for the Headline
Information.
9
Visualise by Column:
Visualising a profile by column allows you to view the relative proportion of each value within a
given year. The bar chart is replaced by a pie chart (again, hovering your mouse over each “slice” of
the pie gives more information).
By selecting each column in turn, you can visualise the change in proportion over the course of time.
N.B. maps are not available whilst visualising by column.
Visualising Breakdowns:
When selecting a profile and a second item via the “breakdown by” filter, the table shown contains
the same two visualisation buttons. However, as the columns of the table are no longer showing
year on year data, the graphs shown when visualising by row and by column will present a
breakdown of the categories of the profile selected, rather than of each year. Again, please note that
maps are not available when visualising a breakdown.
10
DAT Families
ViewIt DAT Families provides a way of grouping partnerships based on a variety of treatment,
prevalence and socio-economic indicators. These groupings allow partnerships to compare their own
data with other similar partnerships, as well comparing against local/national targets.
Accessing DAT Families
Access to DAT Families is available from the NDTMS.net home page. Hover over the text ViewIt in
the navigation bar towards the top of the page and select ‘DAT Families’.
Using DAT Families
On selecting ‘DAT Families’ from the menu, you will be directed to a page showing a ‘Profile’ filter
which categorises the indicators you can select to build a family into three groups.
Profiles:
Clicking on the double arrows to the right
of the text expands the filter box to show
all the indicators available within that
category.
These indicators can be used to profile
DATs against each other. By using several
profiles simultaneously, you can identify
DATs that are similar to each other. We call
these, “DAT Families”.
You can choose up to three selections of
these indicators from any category to help
build your DAT family; to select an indicator
click on the green plus to the right of the
indicator you want to select, to deselect
click on the orange tick.
11
Geography:
Once you have selected at least one indicator, the Geography filter will appear. To generate a DAT
Family you must select a Target DAT against which all other DATs will be compared. As with the
ViewIt Profiles, to select a DAT you will need to select a general locality first, then you can pick a
specific DAT from the list in that locality.
Family Group:
Once you have selected a DAT, the Family Group filter will appear which asks you to choose a
method to generate your DAT Family.
“20 Nearest” will compare the DATs which lie closest in value to the Target DAT for each indicator,
regardless of whether the value is greater or less than the Target DATs value.
“10 Above and Below” will select the ten DATs for each indicator which are immediately above and
below the Target DAT (when ordered by indicator value), regardless of the actual value of each
indicator. The two methods may produce slightly different results, depending on the distribution of
the chosen indicators.
After completing selections for all filters a large button labelled “Go” will appear; clicking this will
generate the DAT Family. Once you have generated a Family, you can change your filter settings by
clicking the green title bar above each selection: this will open the drop down so you can make other
selections.
12
The Results
The output from DAT Families is a set of tables showing the Target DAT (identified in the tables by
the map-pin icon) and those closest to it on each indicator. A table for each indicator is shown,
listing the name of each DAT, the actual value for that indicator, and their difference to the Target
DAT.
If only one indicator has been selected just one table will appear. If more than one indicator has
been selected, these tables will appear side-by-side and any DATs that appear in the tables for all the
selected indicators are highlighted.
These highlighted DATs make up the “DAT Family” for the Target DAT and the selected indicators.
Depending on the indicators chosen, there may not be any additional DATs highlighted. In this case,
either change the indicators selected or try the other Family Group filter option.
Comparison Tables:
In the example below, Manchester is the Target DAT (identified in the tables by the map-pin icon).
Doncaster is highlighted, indicating that Doncaster is present in all three tables and therefore forms
a DAT Family with Manchester for this combination of indicators.
13
Comparison Charts:
Underneath each table is a chart showing the national context of the tables. The line chart plots a
data point for each DAT showing the distribution of each indicator across the country, with the
Target DAT marked with a map-pin icon. Hovering over the line will show data points and give
further information about each DAT in the sequence. Additionally, by clicking and dragging either
vertically or horizontally on the line graph, you can zoom in on the line to make it easier to identify
where individual DATs lie relative to each other. To return to the full distribution, simply double click
the chart.
Further Details
For technical enquiries please contact NDEC by navigating to the “Ask a Question” section of
NDTMS.net and completing the feedback form.
For data enquiries please contact the NTA at the following email address: [email protected]
14