1
OpenEx User's Guide
OpenEx User's Guide
Copyright
© 2000-2008 Tucker-Davis Technologies, Inc. (TDT). All rights reserved.
No part of this manual may be reproduced or transmitted in any form or by any means, electronic
or mechanical, including photocopying and recording, for any purpose without the express written
permission of TDT.
Licenses and Trademarks
Windows 2000, Windows XP and Windows Vista are registered trademarks of Microsoft
Corporation.
Updated: 1/14/2010 11:28 AM
Table of Contents
Before You Begin......................................................................................................................... 1
OpenEx Overview......................................................................................................................................... 3
About OpenEx.............................................................................................................................. 5
Real-Time Control........................................................................................................................ 7
Bridging the Gap .......................................................................................................................... 7
The Client/Server Environment.................................................................................................... 8
OpenEx Tutorials ......................................................................................................................................... 9
Tutorial 1: Getting Started with OpenEx .................................................................................... 11
Tutorial 2: Store Pooling ............................................................................................................ 33
Additional Standard Project and Example Files......................................................................... 43
OpenProject Reference .............................................................................................................................. 47
About OpenProject..................................................................................................................... 49
About the OpenProject Window................................................................................................. 50
Creating a Project ...................................................................................................................... 51
About the OpenProject Configuration Window .......................................................................... 52
Adding Applications to an Existing Project ................................................................................ 54
Changing Launch Settings......................................................................................................... 54
Stop Making Local Copies of RPvdsEx Files............................................................................. 55
Working with Data Tanks in OpenProject .................................................................................. 55
Importing Application Files......................................................................................................... 56
Menus and Dialog Boxes ........................................................................................................... 57
Circuit Design Reference ........................................................................................................................... 61
Circuit Design Overview............................................................................................................. 63
OpenWorkbench Reference....................................................................................................................... 77
About OpenWorkbench.............................................................................................................. 79
Understanding OpenEx Data Stores ......................................................................................... 80
About Epoch Events .................................................................................................................. 82
About Tanks ............................................................................................................................... 83
Workspace Basics ..................................................................................................................... 84
Configuring an Experiment ........................................................................................................ 94
OpenController Reference....................................................................................................................... 113
iii
OpenEx User's Guide
About OpenController .............................................................................................................. 115
About Visualization Tools......................................................................................................... 115
About Modifiers ........................................................................................................................ 116
Understanding Targets ............................................................................................................ 116
Controlling the Experimental Protocol ..................................................................................... 118
Workspace Basics ................................................................................................................... 119
Control Types........................................................................................................................... 127
Linking Controls ....................................................................................................................... 182
Control Settings Reference...................................................................................................... 187
OpenScope Reference............................................................................................................................... 219
About OpenScope.................................................................................................................... 221
About Adding Plots .................................................................................................................. 221
About Plot Settings .................................................................................................................. 222
Using Epochs with OpenScope ............................................................................................... 224
Workspace Basics ................................................................................................................... 226
Plot Types ................................................................................................................................ 235
Plot Settings Reference ........................................................................................................... 256
OpenBrowser Reference .......................................................................................................................... 265
About OpenBrowser................................................................................................................. 267
Workspace Basics ................................................................................................................... 267
Data Selection.......................................................................................................................... 270
Data Browsing.......................................................................................................................... 275
Data Export .............................................................................................................................. 278
TTank Reference ...................................................................................................................................... 291
The Tank Monitor Workspace.................................................................................................. 293
Accessing a Tank on Another PC ............................................................................................ 295
Appendix A – Non Macro Circuit Construct Reference ....................................................................... 299
Overview .................................................................................................................................. 301
Control Constructs ................................................................................................................... 304
Data Storage ............................................................................................................................ 316
Instantaneous Rate Construct ................................................................................................. 332
OpenController Constructs ...................................................................................................... 334
Appendix B – Tips, Tricks, and Technical Information........................................................................ 335
Connecting the Hardware ........................................................................................................ 337
iv
Table of Contents
Tips for Working in OpenEx ..................................................................................................... 339
OpenEx Cheat Sheet ............................................................................................................... 340
Clean Running Applications..................................................................................................... 341
Optimizing Performance for High Data Transfer Rate Operation ............................................ 343
Working with Long Blocks........................................................................................................ 344
FAQs ........................................................................................................................................ 345
Known Anomalies..................................................................................................................................... 347
Resolved Anomalies ................................................................................................................ 349
Troubleshooting........................................................................................................................................ 351
Glossary..................................................................................................................................................... 353
Index .......................................................................................................................................................... 359
v
OpenEx User's Guide
~
vi
OpenEx User's Guide
Before You Begin
Installation
The OpenEx Suite can be installed from the TDT Installation CD or downloaded from the TDT
website. Always uninstall old versions before installing a new version of OpenEx. TDT Drivers
should be installed before installing OpenEx.
The recommended operating system for all TDT systems is 32-bit Windows XP®. TDT System 3
does NOT support 64-bit operating systems, such as Windows Vista® or 64-bit Windows XP®, at
this time.
Hardware Requirements
The OpenEx suite supports all System 3 processors, however RX or RZ High Performance
Processors and Optibit PC Interface are recommended for most applications.
See the System 3 Installation Guide for hardware installation and set-up instructions.
Organization of the Manual
This manual will help you get started using OpenEx software and serve as a long-term source of
reference information
In the OpenEx User’s Guide you will find:
Overview
The overview briefly describes the OpenEx applications, how they work together, and important
OpenEx concepts.
Getting Started with OpenEx – A Tutorial
The step-by-step tutorial provides an introduction to many important OpenEx concepts and
techniques.
Reference Guides
A reference is provided for each component of OpenEx. Reference guides include step-by-step
instructions for basic tasks, and detailed references for windows, menus, dialog boxes, and
settings.
Tips, Tricks, and Technical Information
If you can't find it anywhere else, maybe you can find it here. The tips, tricks, and technical
information section provides answers to commonly asked questions and revisits important OpenEx
concepts.
1
OpenEx User's Guide
~
2
OpenEx Overview
3
OpenEx User's Guide
~
4
OpenEx Overview
About OpenEx
The OpenEx Software Suite is a powerful experimentation platform that provides researchers with
flexibility and configurability found in no other commercial system. OpenEx includes several
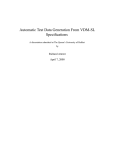
client and server applications for the System 3 hardware platform. The diagram below illustrates
the relationship between OpenEx clients and servers and further discussion of each role follows.
Local Network
System 3
USB or GBit
Local
OpenProject
OpenController
OpenWorkbench
(Server)
Open
Developer
OpenScope
User
Application
Matlab
Basic
Delphi
Labview
TTank
(Server)
Tank Monitor
Storage Files
OpenBrowser
Add
on
Clients
OpenEx Client Server Diagram
System 3 is the flexible hardware platform accessed through the OpenWorkbench application.
System 3 real-time processors are programmed via compiled circuit files designed using TDT's
RPvdsEx software and assigned, loaded, and run by the OpenWorkbench hardware server.
OpenWorkbench serves double duty as both a client application and a hardware server. All
communication with the System 3 hardware occurs through OpenWorkbench. By working directly
in OpenWorkbench the user can provide instructions about the experimental protocol to the
hardware. Client programs such as OpenController or applications developed with OpenDeveloper
may also be used to request information about the hardware or pass instructions to the hardware
through OpenWorkbench.
5
OpenEx User's Guide
TTank is the database server and can store and provide data to many applications in real-time
during an experiment or offline for post-hoc analysis of data. OpenWorkbench provides acquired
data and instructions about storage to TTank. Data is stored in files on the computer where TTank
is running. Client applications such as OpenScope and OpenBrowser request data from the tank
and present it to the user in the desired format. OpenDeveloper can also be used to create custom
client applications that may request data or provide instructions for data storage.
Storage files are created by the TTank data server according to information configured by the user
through OpenProject or the OpenWorkbench application.
Tank Monitor provides quick and easy access to the TTank data server. Users can view
information about TTank activity or perform basic maintenance such as adding or removing tanks.
OpenController is a visual interface that allows users to control experimental parameters (such as
filter settings, threshold settings for unit activity, and stimulus presentation variables) and access
acquired data and parameter variables in real-time. OpenController accesses the hardware through
the OpenWorkbench Server.
OpenScope is a user-customizable display and analysis application. The TTank data server sorts
and serves data to the OpenScope plots, which are updated as each of the selected data tank
elements becomes available. This means that stored data can be displayed dynamically during the
course of an experiment, or that the entire experiment can be re-played later as if the data were just
being acquired.
OpenDeveloper is a group of ActiveX controls that can be used with programming languages
such as MATLAB, Visual Basic, and Visual C++ to generate client applications that access the
OpenEx servers (TTank and OpenWorkbench).
OpenBrowser is a data export and viewing application that accesses data through the TTank data
server. Data from one or more data tanks can be selected, previewed, and exported to a standard
ASCII file format or formats for Plexon's Offline Sorter or NeuroExplorer.
Add on Clients TDT continues to develop client applications that can be added to the OpenEx
core suite to round out functionality, including tools for data analysis such as OpenExplorer and
OpenSorter.
6
OpenEx Overview
Real-Time Control
Real-time control and precise timing control are critical to good experimental design.
Traditionally, systems offering these important features have been built on fixed
hardware/software platforms; as a result they are inflexible and cannot easily be expanded. TDT's
System 3 real-time processors and RPvdsEx circuit design software address this traditional
shortcoming by offering an easy to program development environment that allows users to
customize the function of each processing device in their system.
TDT processors are controlled by circuits within a compiled circuit file (either .rco or .rcx format).
Circuits designed for OpenEx include parameter tags that allow users to control timing, triggering,
data storage, and modification of other parameter values. By utilizing these tags, OpenEx allows
users to control the experiment in real-time. Users can send values to the tags from within
OpenEx's user-friendly software environment.
Bridging the Gap
OpenEx represents TDT's latest advancements in software design. Traditionally there have been
two approaches to developing software for the research environment: "turn-key" systems and
custom systems. Over the years TDT has moved steadily towards bridging the gap between these
two approaches. We've overcome many of the limitations of traditional turn-key software by
developing some of the most flexible software available for many research applications. At the
same time, we've continued efforts to develop an increasingly more user-friendly development
environment for custom applications. OpenEx builds on the idea of flexible turn-key interfaces for
experimental control and analysis and accommodates customization through the use of compiled
circuit files.
What are compiled circuit files?
The foundation for each TDT system is a powerful hardware platform. System 3 hardware is built
around real-time processing modules that include onboard digital signal processors. These
processors are capable of conditioning, processing, and storing data in real-time and are controlled
using circuits designed using TDT's RP visual design studio (RPvdsEx). Compiled circuit files (in
either .rco or .rcx format) are files that contain 'control objects' that can be accessed by software
applications like the OpenEx applications. The .rcx format is the standard format for compiled
circuit files. This file type includes both the control object and the graphical circuit diagram in a
single file.
Users can generate their own compiled circuit files for use with OpenEx or select one of the
standard compiled circuit files provided by TDT. In RPvdsEx, circuits are designed in a drag-anddrop interface. After the circuit is designed, a compiled circuit file can be generated from a simple
mouse click. This means that users can customize experiments in the OpenEx environment
without any knowledge of programming. By supporting customization, all the way down to the
signal processing functions being performed at the lowest levels, OpenEx offers power and
flexibility not available in other systems.
To learn more about TDT System 3 hardware and RPvdsEx, see the System 3 Manual and
RPvdsEx Manual.
7
OpenEx User's Guide
The Client/Server Environment
OpenEx uses a client/server approach that enables the building of powerful software environments
from a number of smaller applications. Individual applications can be developed to efficiently
handle a set of tasks, such as visualizing data or exporting data, and can even run in parallel. For
example, a data visualization application can interact with the data server where data is stored,
managed, and served up to applications. One of the many benefits of this efficient approach is that
a single server application can interact with several client applications. This means, for example,
that a data server can effectively interact with both a data visualization application and a data
export application or even several instances of each. Finally, OpenEx has been developed using a
client/server protocol that allows applications to communicate effectively across networks. This
means that the OpenEx applications can be distributed efficiently across different locations.
The Clients and the Servers
The OpenEx Suite currently includes two servers (TTank and OpenWorkbench) and five client
applications (OpenWorkbench, OpenController, OpenScope, OpenBrowser, and Tank Monitor).
Data is stored in files on the computer where TTank is running and OpenWorkbench must be run
from a computer with a direct connection to the hardware. Client applications can run from any
networked computer. TDT does not limit installation of client applications. This means, for
example, that several users can visualize experimental data on separate PCs as it’s acquired.
Several add-on client applications are also available such as OpenExplorer and OpenSorter.
The Client/Server Advantage
The client/server advantage allows a number of smaller applications to come together in one
powerful OpenEx environment. With OpenProject, all OpenEx programs are brought under the
control of a single management tool and all experiment files are managed automatically under a
single directory structure.
8
OpenEx Tutorials
9
OpenEx User's Guide
~
10
OpenEx Tutorials
Tutorial 1: Getting Started with
OpenEx
Getting Started with OpenEx is a hands on tutorial, in which you'll learn to design, create, and run
an experiment in the OpenEx environment. This tutorial takes you through the process step-bystep while introducing important OpenEx concepts. The concepts and techniques introduced can
be applied to any type of experiment. This tutorial will help users become more familiar with the
OpenEx software suite.
In this tutorial you will:
1.
Plan and create an OpenEx project.
2.
Design a processing chain and generate a compiled circuit file (*.rcx format)
3.
Build the OpenWorkbench experiment.
4.
Add a real-time filter control using OpenController
5.
Visualize and store data using OpenEx.
The project in this tutorial will acquire and store two channels of filtered data and display the
acquired data streams in real-time. A filter control will allow real-time adjustment of low pass and
high pass corner frequencies in OpenController.
Keep an eye out for key OpenEx concepts. These concepts are extremely important when using
OpenEx.
Planning the Project
When you plan a project you will need to:
1.
Determine what type of data will be acquired.
2.
Determine what device(s) you will use.
3.
Determine which OpenEx applications you will need.
The Data
First, consider the type of data that will be acquired. In general, data can be categorized into three
basic data types: scalar values, discrete waveforms (often called snippets or segments), and
continuous waveforms (often called streamed data). This tutorial will acquire two channels of
streamed data and a simple timing tick.
Typical streamed events include slow wave brain recordings, decimated multi-channel
extracellular recordings, and any event that requires a chart recording of all or most of the data. In
this case you'll be acquiring continuous waveforms generated digitally within the project for
demonstration purposes.
The timing tick is a standard feature of many OpenEx Projects. A pulse will be generated and
acquired once per second and stored as a set of scalar values.
The underlying programming (or circuit construct) for storing each type of data is different, but
the RPvdsEx visual design tools you will learn about in this tutorial make it easy to choose the
11
OpenEx User's Guide
correct circuit components to ensure that all data is stored and served up for display or analysis
quickly and efficiently by OpenEx's TTank data server.
The Device
System 3 includes several real-time processor designs with a range of processing speeds, onboard
memory, and input/output configurations, each tailored to support specific target applications.
OpenEx supports all of the System 3 processor devices and this tutorial is designed to work with
any processor. For possible hardware configurations see Connecting the Hardware, page 337 or
the Installation Guide provided with your system.
The OpenEx Applications
OpenEx is a suite of applications that work in a client/server environment. That means you can
pick and choose the applications you need to build and run your experiment. In this tutorial you
will be building the project from the ground-up. To design the processing chain that controls the
processor you will use RPvdsEx, the circuit design interface. To design the experiment and to
handle communication between the OpenEx environment and the hardware you'll need
OpenWorkbench. Finally, to design the real-time filter controls you will use OpenController.
Creating the Project
To help you manage multiple applications and the files associated with them, each experiment is
created as a project. You can quickly create the project and generate all of the files associated with
it using OpenProject. You can then access all of the project files by loading a single OpenProject
(.wsp) file.
Note: Ensure that your TDT system is connected to the PC and turned on before creating the
project.
To run OpenProject:
Double-click the
OpenProject icon on your desktop.
OpenProject is launched and you are ready to open an existing project or create a new one.
12
OpenEx Tutorials
To create a new project:
1.
In the OpenProject window, click the OpenProject menu and click New Project.
2.
In the OpenProject Configuration window you can enter a project name and description. The
project name will be used to generate a folder where all the project files will be stored.
In the Project Name box type Tutorial.
3.
In the File Location box, the default location for new project directories, the My Projects
folder, is displayed. We recommend keeping all your projects under this folder, so leave the
File Location information as is.
Note: If the My Projects folder is not displayed, click the down arrow to select it from the
drop down list or the
4.
Browse button to locate it manually.
To add a description, click the View/Edit button, click the Edit check box, and type a
description.
13
OpenEx User's Guide
5.
Click OK.
To add applications:
1.
Double-click the WorkBench icon to add OpenWorkbench to the project.
The application is added to the Launch Details list.
2.
Double-click the RPvdsEx icon to add one instance of RPvdsEx to the project.
3.
Double-click the Controller icon to add one instance of OpenController to the project.
4.
Click OK to close the OpenProject Configuration window.
As the applications are launched, an icon for each application is added to the OpenProject main
window and associated application windows are stacked and attached to the OpenProject window.
You can switch between applications by clicking the application's icon in the OpenProject
window.
Designing a Processing Chain and Generating a
Compiled Circuit File
Compiled circuit files, are the key to customizing your OpenEx experiment design. Because
compiled circuit files are generated in the RPvdsEx drag-and-drop interface, you can customize
experiments at the lowest level without any knowledge of programming. This tutorial illustrates
just how simple it can be to design a project from the ground up. Follow along with these step-bystep instructions for building a simple macro-based OpenEx project to learn important circuit
design concepts.
To select the circuit design application and create a new file:
1.
14
Click the RPvdsEx_1 icon in the OpenProject window.
OpenEx Tutorials
The RPvdsEx applications window is brought to the top of the "stacked" windows that are
attached to the tall, narrow OpenProject window.
2.
In the RPvdsEx window, click the File menu and click New.
You're ready to begin circuit design.
Adding Required Timing and Synchronization
Every project requires some basic timing and control elements. In OpenEx all the timing and
control functions can be handled by the CoreSweepControl macro. Macros are a special construct
that comprises a group of circuit components and allows you to configure those components and
set their parameters through a simple, wizard like properties dialog.
The CoreSweepControl can handle a broad group of timing and control functions, but in this basic
project it is primarily responsible for starting and synchronizing timing generators on each realtime processor in the OpenEx project and automatically distributing timing signals to all other
macros that require them. Additionally, though not required, the CoreSweepControl will store the
timing tick discussed at the beginning of the tutorial.
The CoreSweepControl macro or equivalent circuitry must be included in every OpenEx project.
To add a CoreSweepControl macro:
Insert Macro icon on the RPvdsEx Components toolbar.
1.
In RPvdsEx, click the
2.
In the dialog box, select the CoreSweepControl macro from the Macros | Timing folder.
15
OpenEx User's Guide
Notice that symbols in the center of the icon indicate the class of macro
whether or not it is intended for use with OpenEx
3.
(timing) and
(used in OpenEx).
Click Insert. After the dialog box closes, click the workspace to place the component in the
workspace.
You can double-click the macro icon to view parameter menus and full documentation for the
macro. No changes to the default settings of the CoreSweepControl macro are necessary for
this tutorial.
Adding Signal Acquisition
To illustrate the components required to store and display data, we’ll acquire two channels of
analog data directly from the output of RPvdsEx waveform generator components. These could
later be replaced with A/D inputs to continuously acquire, display, and store two channels of
external analog data.
RPvdsEx provides a variety of data storage macros and selecting the appropriate storage
component for the type of data that is being acquired is extremely important. When browsing the
macro folders in RPvdsEx, you'll find that the macros are organized into logical folders by type,
such as streaming or Segment_Snip. Macro names are also designed to provide important
information such as the number of channels (or MC for multi-channel macros that support higher
channel counts). Selecting the macro in the browse window also displays a brief description you
can use to make your selection.
Since we are working primarily with streaming data, a streaming storage component such as the
Stream_Store_1-4Ch macro should be used.
1.
16
Insert Macro icon, select the Stream_Store_1-4Ch macro (from the Macros|
Click the
Data Saving | Streaming folder), click Insert then click the workspace to add the macro.
OpenEx Tutorials
Macro Name
Data Input
Setting Summary
Notice that the macro displays key settings along the bottom edge of the icon. The macro
name is displayed above and the Store or data inputs are located along the left edge of the
icon. By default, only one channel is enabled when a Sream_Store_1-4Ch macro is added.
Additional inputs will be activated based on settings within the macro.
2.
Double-click the macro to access the macro documentation and setup menus.
The Overview page of the properties dialog provides summary information and general
documentation. Subsequent tabs include both settings and documentation.
3.
Click the Setup tab or click Next.
17
OpenEx User's Guide
4.
To set the macro to acquire two channels of data, set the nChannels value to 2.
Notice the Store Name field. In OpenEx, each type of data to be stored is called a Store and is
given a unique name used to identify it in the data tank.
5.
To change the default name of the Store (Wave), click the Change button next to the Store
Name, type Demo in the pop-up dialog, and click OK.
6.
Click the Options tab or click Next to continue. On the Options tab you can select a storage
format from a drop-down list and set a scale factor. For this example, leave the format of the
stored data in the default floating-point (32 bit) format. Other options include Integer, Short,
Byte, or PDec.
7.
Finally, click Done at the bottom of the properties dialog.
The Stream_Store_1-4Ch macro should now display two active inputs on the left side of the icon.
Adding Signal Filtering
To add signal filtering:
1.
18
Insert Macro icon, select the HP-LP_Filter_4Ch macro (from the Macros|
Click the
Filtering folder), click Insert then click the workspace to add the macro.
OpenEx Tutorials
By default, many macros contain a field which allows the number of channels to be specified.
This is useful for reducing unnecessary components and disabling unneeded inputs and
outputs. The HP-LP_Filter_4Ch macro was chosen to illustrate this concept and also to keep
the circuit as simple as possible.
2.
Double-click the macro to access the macro documentation and setup menus.
3.
Click the Setup tab or click Next.
4.
To set the macro to allow for real-time control to be added later, select Access Tags from the
Control Mode drop down box. This option allows parameter tags to be assigned as targets for
real-time control in OpenController based upon the Tag Name field in the macro setup menu.
5.
Click the Filter Shape tab or click Next.
6.
To set filter shape, enter 2 in the Highpass Frequency text box.
7.
Enter 1000 in the Lowpass Frequency text box.
8.
Click Done at the bottom of the properties dialog.
19
OpenEx User's Guide
The HP-LP_Filter_4Ch macro should now display the tag access name Filt under the macro
settings summary.
Tag Names are used in OpenController when assigning targets. A target points to the location of
the data being read or the location to which a value will be written. Together with parameter tag
components found in RPvdsEx, they provide a means of interacting with specific inputs and
outputs.
In our case we have chosen to use the Tag Name Filt. This combined with the Access Tags
option defined earlier in the macro setup makes two parameters available in our compiled circuit:
FiltHP and FiltLP. These two parameter tags will be assigned later in our controller as targets of
our real-time filter controls.
Adding the Signal for Demonstration Purposes
To add the demo signal:
1.
20
Add a Tone generator component to the workspace.
a.
Click the Components menu, click Waveform_Generators, and click Tone.
b.
Click OK and click the workspace to place the component.
c.
To set the frequency of the Tone generator to 2 Hz, double-click the component,
click in the Freq box and type 2.
OpenEx Tutorials
d.
2.
Click OK.
Add a GaussNoise generator component to the workspace.
a.
Click the Components menu, click Waveform_Generators, and click GaussNoise.
b.
Click OK and click the workspace to place the component.
3.
To link components, double-click the output of the first component and click the input of the
second component.
4.
Connect the outputs of both the Tone and GaussNoise generator components to the first and
second HP-LP_Filter_4Ch component inputs.
5.
Connect the HP-LP_Filter_4Ch component outputs 1 and 2 to the respective Store-1 and
Store-2 inputs of the Stream_Store_1-4Ch component.
Your circuit should look like the one pictured below.
By default the graphical processing chain and the control circuit (control object) are combined
into a single compiled circuit file format (.rcx file) that can be both edited in the graphical
interface and loaded to hardware devices.
21
OpenEx User's Guide
6.
Click the File menu and click Save As
When the Project folder is created a subfolder named RCOCircuits is created to store
compiled circuit files for the project. This folder should open by default.
7.
Type Tutorial in the file name box and click Save.
Both the graphical processing chain and the control object are saved into one compiled circuit
file: Tutorial.rcx in the default directory.
Notice that when the file is saved, the circuit is compiled. Any errors or warnings will appear
at this time.
22
OpenEx Tutorials
Configuring OpenWorkbench
During an experiment the compiled circuit file you created will be loaded to and run on one of the
real-time processors. OpenWorkbench provides the interface used to assign the compiled circuit
file to a device, configure high level settings, and start and stop the experiment.
To configure the experiment:
1.
Select the Workbench icon in the OpenProject window.
2.
In the OpenWorkbench window, the Device Navigator sub window displays all DSP modules
connected to your PC. Since the project has not yet been configured, at this point, all devices
should appear gray.
3.
Select any one device on which to run this example and click its gray icon in the navigator.
This will display the device configuration in the main part of the window.
23
OpenEx User's Guide
4.
Click the Browse button
to the right of the File Name box to browse to and select the
Tutorial.rcx file you created earlier.
You will be prompted to rename the Device. Click OK to accept the default name. You have
now created a device configuration and assigned it to the device. The configuration is saved
automatically as part of the WorkBench file.
At this point, OpenWorkbench automatically reads the compiled circuit file (.rcx), finds any
data Stores included in the file, configures data storage parameters, and populates an editable
Storage Specification table as shown below. In this example, the default “Tick” Store is
generated by the CoreSweepControl macro and the “Demo” Store by the Stream_Store_1-4Ch
macro.
In the Storage Specification table, data storage information is organized in rows. In the table
pictured above, row 2 indicates that the compiled circuit file selected will store continuous
waveform data acquired from two channels at a 25 kHz sampling rate. The tag name, Demo,
was generated when you named the Store in the Stream_Store_1-4Ch macro. The Store ID is
automatically generated based on that tag name.
The Store ID is associated with the corresponding data in the tank and is used by other clients,
such as OpenScope or OpenController, when selecting or viewing data. You can change the
Store ID by typing a new four character code in the Store ID cell, but in this tutorial we will
use the default Store IDs.
24
OpenEx Tutorials
Note that at this point, the Workbench controls (Record, Preview, etc.) are grayed out and
inactive. The reason for this is that a DataTank has not yet been set up in which to store any
acquired data.
5.
Click the File menu and click DataTank.
NewTank icon and specify a path for data
In the Data Storage dialog box, select the
storage and name the data tank TutTank, then click OK.
25
OpenEx User's Guide
6.
Click OK.
Setup is complete and the Workbench controls are enabled.
Running the OpenEx Project
OpenWorkbench is the hardware server for the OpenEx suite. Because OpenWorkbench is the
only application that communicates directly with the processors, it controls when an experiment
begins and when data is collected and stored. These conditions are determined by
OpenWorkbench's system modes, so it is a good idea to become familiar with them before you
begin an experiment.
There are four modes:
26
Record is used when you're ready to begin storing data to the data tank.
Preview is used to test the system or when you want to modify parameters before you begin
collecting data. This mode allows you to view data but the data is not stored permanently to
the experiment's defined data tank.
Standby should be used whenever the experiment must be paused. In this mode devices are
loaded and running but signals are not being acquired and saved to disk.
Idle should only be used when the experiment is completed. In this mode devices are not
loaded and are not running. Idle mode clears all values from the hardware.
OpenEx Tutorials
To run the project:
1.
Click the Record button.
At this point, the automated plotting function in OpenWorkbench will generate a real-time
plot displaying each stored data element.
2.
Click the
Autoscale icon at the top of the plot to scale the display.
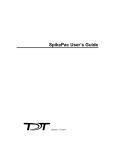
Your project should now appear similar to the illustration below, with the timing and sweep
number of Onset epoch Tick shown across the top of the plot, and the two streaming channels
Demo[channel 1] and Demo[channel 2] displaying their sine and Gaussian noise input
waveforms.
Adding the Real-Time Control
OpenController is a visual interface for designing and implementing custom control sets for
OpenWorkbench experiments. OpenWorkbench generates a map of all the data in Stores and
accessible parameters (or parameter tags, often contained in macros and transparent to the user) of
the devices in memory.
27
OpenEx User's Guide
As a client of OpenWorkbench, OpenController accesses this map to modify parameter variables
and to read data for visualization.
Since this map is updated in real-time (several times a second) the data displayed in
OpenController is also displayed in real-time. When OpenController modifies a parameter it is
modified in this map and then updated on the device. OpenController acquires data from this map
to access the variable information for data visualization. This results in real-time control for device
parameters.
In this tutorial, you will adjust filter settings in real-time.
To switch to OpenController:
Click Controller_1 in the OpenProject window.
The OpenController window is displayed in Design mode. In Design mode you can add,
configure, and modify controls.
The compiled circuit file used in this tutorial includes digital biquad filters for highpass and
lowpass filtering. You can add two slide switches to control the corner frequency of these filters.
Slide switches provide convenient real-time switching between several values.
To create the highpass filter setting slider:
28
1.
Click the Controls menu, point to Switches, and click Slide Switch.
2.
Click the grid to position the control.
3.
Double-click the control to display the properties dialog box.
4.
Click the Browse button
box.
5.
In the Target Select dialog box, click the expand icon (+) next to Devices, click the expand
icon (+) next to Tutorial, click the expand icon (+) next to Scalars, and click FiltHP.
in the Primary Target box, to display the Select Target dialog
OpenEx Tutorials
6.
7.
Click OK to return to the properties dialog and enter or select the following settings:
Caption Text:
Amp HP
Auto Caption
Clear the check box
Initialize Value
2
Initialize Mode
Init On Load
Position Labels
2, 3, 4, 5, 10, 30
Position Values
2, 3, 4, 5, 10, 30
Click OK.
The slider switch is created. The slider can now be used to change highpass filter settings in realtime during an experiment.
Next, you'll create a slide switch for the lowpass filter setting.
29
OpenEx User's Guide
To create the lowpass filter setting slider:
1.
Click the Controls menu, point to Switches, and click Slide Switch.
2.
Click the grid to position the control.
3.
Double-click the control to display the properties dialog box.
4.
Click the Browse button
box.
5.
In the Target Select dialog box, click the expand icon (+) next to Devices, click the expand
icon (+) next to Tutorial, click the expand icon (+) next to Scalars, and click FiltLP.
6.
Click OK to return to the properties dialog and enter or select the following settings:
7.
in the Primary Target box, to display the Select Target dialog
Caption Text:
Amp LP
Auto Caption
Clear the check box
Initialize Value
2
Initialize Mode
Init on Load
Position Labels
2, 5, 10, 30, 100, 1000
Position Values
2, 5, 10, 30, 100, 1000
Click OK.
The slider switch is created. The slider can now be used to change lowpass filter settings in
real-time during an experiment.
To create a scrolling plot:
30
1.
Click the Controls menu, point to Plots/Graphs, and click Scrolling Plot.
2.
Click the grid to position the control.
3.
Double-click the control to display the properties dialog box.
4.
Click the Browse button
5.
In the Target Select dialog box, click the expand icon (+) next to Stores, click Demo then
click OK.
6.
Change the Poll Period to 10 in the properties dialog box.
7.
Check the Multi View Enabled checkbox.
8.
Change the value of Num Views to 2.
9.
Click OK.
in the Data Target box, to display the Select Target dialog box.
OpenEx Tutorials
Visualize the Acquired Data
So far in this tutorial you have setup and compiled your device circuit, configured
OpenWorkbench, and added real-time control in OpenController. It is now time to run the project
and visualize the acquired data while adjusting the filter settings through OpenController.
To adjust the filter settings in real-time:
1.
Click Controller_1 in the OpenProject window while OpenWorkbench is in either Preview
or Run mode.
2.
Adjust the filter settings of each slider control to adjust the corner frequencies of the filter.
Observe how each signal changes as the individual filter corner frequencies are altered.
3.
The Scrolling Plot allows data to be viewed while in OpenController and functions similarly
to the plots in OpenWorkbench. Hold the Shift key and drag the mouse up or down to adjust
the scale of the plot.
31
OpenEx User's Guide
What's Next?
In this tutorial you created a project from the ground up using RPvdsEx macros. The next tutorial
implements a useful feature in OpenEx called store pooling.
32
Tutorial 2: Store Pooling
In the Store Pooling tutorial, you'll learn to distribute data storage across DSPs on a multiprocessor device. Splitting processing tasks across multiple DSPs lowers cycle usage for each
DSP and allows the device to run efficiently, even when processing high channel counts or
complex tasks. Filtering, signal input, and signal output can easily be distributed between DSPs
simply re-routing the signals to different DSPs. Distributing data storage, however, requires
splitting chunks of channels from a multi-channel data stream for processing on separate DSPs.
Store Pooling simplifies this process and ensures that all the channels are stored as a single Data
Store in the Data Tank.
In this tutorial you will:
1.
Create an OpenEx project.
2.
Design a processing chain to utilize store pooling and generate a compiled circuit file (*.rcx
format)
3.
Build the OpenWorkbench experiment.
4.
Visualize and store data using OpenEx.
The project in this tutorial will acquire and store 32 channels of simulated data and display the
acquired data streams in real-time. Storage will be divided across two separate DSP processors.
Keep an eye out for key OpenEx concepts. These concepts are extremely important when using
OpenEx.
The Device
This tutorial requires the use of a high performance device such as an RXn or RZn processor.
The OpenEx Applications
In this tutorial you will be building the project from the ground-up. To design the processing chain
that will implement store pooling you will use RPvdsEx. To design the experiment and to handle
communication between the OpenEx environment and the hardware you'll need OpenWorkbench.
33
OpenEx User's Guide
Creating the Project
1.
Double-click the
OpenProject icon on your desktop and create a new project.
2.
Double-click the Workbench icon to add OpenWorkbench to the project.
3.
Double-click the RPvdsEx icon to add one instance of RPvdsEx to the project.
4.
Click OK.
Designing a Processing Chain to Implement Store
Pooling
1.
Click the RPvdsEx_1 icon in the OpenProject window.
2.
In the RPvdsEx window, click the File menu and click New.
3.
Device Setup button and select your high performance processor from the
Click the
Type drop-down list.
4.
Click OK.
Adding Required Timing and Synchronization
All timing and synchronization will be handled by the CoreSweepControl macro.
To add a CoreSweepControl macro:
Insert Macro icon on the RPvdsEx Components toolbar.
1.
In RPvdsEx, click the
2.
In the dialog box, select the CoreSweepControl macro from the Macros | Timing folder.
3.
Click Insert. After the dialog box closes, click the workspace to place the component.
You can double-click the macro icon to view parameter menus and full documentation for the
macro. No changes to the default settings of the CoreSweepControl macro are necessary for
this tutorial.
34
OpenEx Tutorials
Adding Signal Acquisition
To implement store pooling in RPvdsEx, two or more data storage macro are added and assigned
to separate processors. Each macro is then “Fed” a subset of channels for processing from the
multi-channel data stream.
All macros to be pooled must be configured with the same setup properties (such as the store
name, number of channels, and window width) and one store macro must be identified as the
primary Store.
This macro determines the total number of channels and contains the construct header for the data
Store. Any subsequent macros are considered members of the pool and are ordered sequentially.
In this tutorial we will be using two storage macros to implement store pooling. Since the total
number of channels needed is 32, each member of the pool will acquire 16 channels. Since we are
working primarily with streaming data, a streaming storage component such as the
Stream_Store_MC macro should be used.
Configuring the Primary Store
To add and configure the primary store:
1.
Insert Macro icon, select the Stream_Store_MC macro (from the Macros|
Click the
Data Saving | Streaming folder), click Insert then click the workspace to add the macro.
2.
Double-click the macro to access the macro documentation and setup menus.
3.
Click the Setup tab or click Next.
4.
To set the macro to acquire 16 channels of data, set the nChannels value to 16.
35
OpenEx User's Guide
5.
Click the Store Pooling tab or click Next twice.
6.
Since this will be the primary store in the pool, select Primary from the Pooling Position
drop-down box.
We will be configuring two stores in our pool so we must designate the total number of
members.
7.
Select 2 from the Members In Pool drop-down box.
8.
Finally, click Done at the bottom of the properties dialog.
The Stream_Store_MC macro should now display the first 16 channels of the store in the macro
property summary display.
Configuring the Second Store Macro
Once the primary store has been configured, a second store macro can be added by simply copying
the primary store and adjusting the pooling position in the macro setup properties. This method
ensures that all other necessary properties (such as the store name, number of channels, and
window width) remain the same as the primary store.
To add and configure the second store macro:
36
1.
Select the Stream_Store_MC macro that you just added to the workspace.
2.
Select Copy from the Edit menu.
3.
Click the workspace and select Paste from the Edit menu.
OpenEx Tutorials
4.
Double click the newly pasted Stream_Store_MC macro to access the macro documentation
and setup menus.
5.
Click the Store Pooling tab or click Next twice.
6.
Since this will be the 2nd store in the pool, select 2nd from the Pooling Position drop-down
box.
7.
Select 2 from the Members In Pool drop-down box.
8.
Finally, click Done at the bottom of the properties dialog.
The Stream_Store_MC macro should now display the next 16 channels of the store in the
macro property summary display.
Splitting up Processing Tasks
We have now configured the pooled store containing 2 members. To take advantage of the multiprocessor architecture of the device, we must assign one of the members to another DSP
processor. This will be accomplished through the use of the DspAssign component.
Note: Splitting processing tasks across DSPs can be done in two ways; pages and the DspAssign
component. This tutorial features a small number of components and macros so the DspAssign
component is sufficient for this task. Larger circuits may benefit from using pages. See the
RPvdsEx user manual for more information on how to use pages.
To assign the second macro to another DSP:
1.
Add a DspAssign component to the workspace.
2.
Click the Components menu, click Multi_Processor, and click DspAssign.
3.
Click OK and click the workspace to place the component.
37
OpenEx User's Guide
4.
Resize the DspAssign component using standard windows drag techniques so that the
secondary Stream_Store_MC macro is inside the DspAssign window.
5.
Double-click the DspAssign component, select Aux-1 / RZ_DSP-2 from the DSP drop-down
box.
6.
Click OK.
Your circuit should look similar to the one pictured below.
Adding the Signal for Demonstration Purposes
This tutorial will utilize a test signal for demonstration purposes. Real-world circuit applications
will acquire signals from a preamplifier or other device output. The pooled stores themselves
would be configured in the same manner.
To add the demo signal:
1.
Insert Macro icon, select the Test_Spike_MC macro (from the Macros|
Click the
SignalGenerators folder), click Insert then click the workspace to add the macro.
2.
Double-click the macro to access the macro documentation and setup menus.
3.
Click the Setup tab or click Next.
4.
Enter 32 in the Number of Channels text box.
5.
Click Done at the bottom of the properties dialog.
The output of the Test_Spike_MC macro will now be a 32 channel signal. We must now connect
the necessary components in order to connect the demo signal to the storage macros.
We will use a MCzHopOut component to make the demo signal available to all DSPs. Two
MCzHopIn components will allow the demo signal to be split into 16 channel partitions and
distributed to the two pooled stores on separate DSPs.
38
OpenEx Tutorials
There is a one cycle delay when transferring signals using the MCzHopOut and MCzHopIn
components.
It is important that all stores are synchronized to these delays and so we will use a MCzHopIn for
both stores.
To connect the demo signal to the pooled store:
1.
Add a MCzHopOut component to the workspace.
2.
Click the Components menu, click Multi_Processor, and click MCzHopOut.
3.
Click OK and click the workspace to place the component.
4.
To set the name for the MCzHopOut component, double-click the component, click the Name
text box, and type Demo.
5.
Enter 32 in the nChan text box to set the number of channels to 32.
6.
Connect the output of the Test_Spike_MC macro to the MCzHopOut input.
7.
Add two MCzHopIn components to the workspace.
8.
Click the Components menu, click Multi_Processor, and click MCzHopIn.
9.
Click OK and click the workspace to place the component.
10. To set the name for the MCzHopIn components, double-click the component, click the Name
text box, and type Demo for both components.
11. Enter 16 in the nChan text box to set the number of channels to 16 for both MCzHopIn
components.
12. Enter 17 in the ChanSel text box to set the first channel to 17 on the second MCzHopIn
component.
Setting the ChanSel parameter to 17 starts the index for the MCzHopIn to 17. Since it is
configured to use 16 channels this corresponds to channels 17 – 32 or the same range of the
secondary store macro.
13. Connect both MCzHopIn components’ outputs to the Store inputs for each
Stream_Store_MC macro. The MCzHopIn with a ChanSel value of 17 should be connected
to the second store macro. You may have to resize the DspAssign window to fit the
MCzHopIn component.
14. To double check this, look at the macro parameter summary, the second store macro will have
Wave{17:32} labeled for the store information.
39
OpenEx User's Guide
Your circuit should look similar to the one pictured below.
15. Click the File menu and click Save As
When the Project folder is created a subfolder named RCOCircuits is created to store
compiled circuit files for the project. This folder should open by default.
16. Type a filename in the file name box and click Save.
Both the graphical processing chain and the control object are saved into one compiled circuit
file in the default directory.
40
OpenEx Tutorials
Configuring OpenWorkbench
In this section we will configure the experiment by loading the compiled circuit file to a device.
Since we have implemented store pooling, the storage specification table should populate only two
stores, the Tick store provided by the CoreSweepControl macro and our Wave store provided by
the pooled Stream_Store_MC macros.
To configure the experiment:
1.
Select the Workbench icon in the OpenProject window.
2.
Select any one device on which to run this example and click its gray icon in the navigator.
This will display the device configuration in the main part of the window.
3.
Click the Browse button
to the right of the File Name box to browse to and select the
RPvdsEx file you created earlier.
You will be prompted to rename the Device. Click OK to accept the default name.
The configuration is saved automatically as part of the WorkBench file.
Notice that in addition to the Tick store added by the CoreSweepControl macro, our pooled
store is listed as a single 32 channel store Wave.
4.
Click the File menu and click DataTank.
5.
Configure an existing DataTank or create a new DataTank.
41
OpenEx User's Guide
Setup is complete and the Workbench controls are enabled.
Running the OpenEx Project
OpenWorkbench displays the pooled stores as one store entity despite the fact that the data is
being processed on two separate DSPs. This keeps the plot simple and easy to visualize.
To run the project:
1.
Click the Record button.
2.
Click the
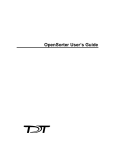
3.
Your project should now appear similar to the illustration below, with the timing and sweep
number of Onset epoch Tick shown across the top of the plot, and the streaming channels
Demo[channels 1 - 32] displaying the demo signal.
Autoscale icon at the top of the plot to scale the display.
What's Next?
In this tutorial you created a project from the ground up using RPvdsEx macros and configured
individual pooled stores across separate DSP processors. Refer to the OpenEx reference sections
for more information on each application in the OpenEx Suite.
42
OpenEx Tutorials
Additional Standard Project and
Example Files
When OpenEx Suite is installed a number of project files are installed for your use. These projects can
provide a means of getting basic experiments up and running quickly and can be modified to meet the
needs of your paradigm. The RCO Files used by each project are targeted for specific typical hardware
configurations but can often be modified for use with other hardware combinations. See the RPvdsEx
Manual for circuit design techniques.
EEG Projects
Project File: TDT\OpenEx\StdProjects\EEG\SP3001\SP3001.wsp
Standard Hardware: RA16BA Medusa Base Station and RA4PA or RA16PA Medusa PreAmp
Overview: Acquires four channels of EEG data and filters for alpha, beta, and theta waves. Stores raw data
continuously and stores RMS of the alpha, beta, and theta waves ~12 times per second.
Project File: TDT\OpenEx\StdProjects\EEG\SP3002\SP3002.wsp
Standard Hardware: RA16BA Medusa Base Station and RA4PA or RA16PA Medusa PreAmp
Overview: Acquires four channels of EEG data and filters for alpha and beta waves. Stores raw data
continuously and stores RMS of the alpha and beta waves ~12 times per second.
Project File: TDT\OpenEx\StdProjects\EEG\SP3003\SP3003.wsp
Standard Hardware: RA16BA Medusa Base Station and RA4PA or RA16PA Medusa PreAmp
Overview: Acquires one channel of EEG data and filters for alpha, beta, delta, and theta waves. Stores raw
data continuously and the levels of filtered waveforms are calculated to deliver a stimulus when the energy
factor reaches a certain value.
Project File: TDT\OpenEx\StdProjects\EEG\SPM0504\SPM0504.wsp
Standard Hardware: RX5 Pentusa Base Station and RA16PA Medusa PreAmp
Overview: Acquires 16 channels of EEG data and filters for alpha, beta, delta, and theta waves. Stores
RMS for Alpha, Beta and Theta waves.
Project File: TDT\OpenEx\StdProjects\EEG\SPM0505\SPM0505.wsp
Standard Hardware: RX5-5 5-DSP Pentusa Base Station and four RA16PA Medusa PreAmps
Overview: Acquires 64 channels of EEG data at 6103 Hz and stores the data in short (16-bit) format.
Project File: TDT\OpenEx\StdProjects\EEG\SPM0506\SPM0506.wsp
Standard Hardware: RZ5 BioAmp Processor and RA16PA Medusa PreAmp
Overview: Acquires 16 channels of EEG data and filters for alpha, beta, delta, and theta waves. Stores
RMS for Alpha, Beta and Theta waves.
43
OpenEx User's Guide
Project File: TDT\OpenEx\StdProjects\EEG\SPM0803\SPM0803.wsp
Standard Hardware: RZ2 BioAmp processor and PZ3 Amplifier
Overview: Acquires 32 channels of EEG data and filters for alpha, beta, delta, and theta waves. Stores the
RMS of the alpha, beta, and theta waves.
Extracellular Projects
Many of the extracellular projects are provided in two versions, one using macros (indicated by inclusion of
"SPM" in the file name) and one that does not. Typically the circuit files used in the macro based projects
are easier to work with and make minor modifications. The non-macro circuit projects demonstrate circuit
design techniques that may be used in those cases where macros are not available or greater flexibility is
required.
Project File: TDT\OpenEx\StdProjects\Extracellular\SP0001\SP0001.wsp or
StdProjects\Extracellular\SPM0001\SPM0001.wsp
Standard Hardware: RA16BA Medusa Base Station and RA4PA or RA16PA Medusa PreAmp
Overview: Acquires a single channel of spike data. Includes an automated window discriminator and a
spike sorting control. Also includes a fake spike generator that can be used to test of the system and
become comfortable with the thresholding and spike sorting controls for data collection.
Project File: TDT\OpenEx\StdProjects\Extracellular\SP0100\SP0100.wsp or
StdProjects\Extracellular\SPM0100\SPM0100.wsp
Standard Hardware: RA16BA Medusa Base Station and RA4PA or RA16PA Medusa PreAmp
Overview: Acquires, sorts, and stores candidate spikes across multiple recording sites (up to four
channels). Provides real-time control of spike discrimination and sorting and includes automatic threshold
detection and sorting.
Project File: TDT\OpenEx\StdProjects\Extracellular\SP0501\SP0501.wsp or
StdProjects\Extracellular\SPM0501\SPM0501.wsp
Standard Hardware: RX5-5 5-DSP Pentusa Base Station and two RA16PA Medusa PreAmp
Overview: Sorts and acquires 32 channels of neural spike data. LFPs are also stored for all channels.
Project File: TDT\OpenEx\StdProjects\Extracellular\SP0502\SP0502.wsp or
StdProjects\Extracellular\SPM0502\SPM0502.wsp
Standard Hardware: RX5-5 5-DSP Pentusa Base Station and four RA16PA Medusa PreAmp
Overview: Sorts and acquires 64 channels of neural spike data.
Project File: TDT\OpenEx\StdProjects\Extracellular\SPM0503\SPM0503.wsp
Standard Hardware: RX5 Pentusa Base Station and RA16PA Medusa PreAmp
Overview: Acquires 16 channels of data and stores the values as 32-bit floating-point numbers.
Project File: TDT\OpenEx\StdProjects\Extracellular\SPM0507\SPM0507.wsp
Standard Hardware: RZ5 BioAmp processor and two RA16PA Medusa PreAmps.
Overview: Sorts and acquires 32 channels of neural spike data. LFPs are also stored for all 32 channels.
44
OpenEx Tutorials
Project File: TDT\OpenEx\StdProjects\Extracellular\SPM0802\SPM0802.wsp
Standard Hardware: RZ2 BioAmp processor and a PZ2 preamplifier.
Overview: Sorts and acquires 64 channels of neural spike data. LFPs are also extracted and stored for all
64 channels. The active channel can be monitored via the Port E- #9 front panel BNC.
Tuning Curve Projects
Project File: TDT\OpenEx\Examples\ManualTuner\ManualTuner.wsp
Hardware: RP2.1 Real-Time Processor for stimulation and RA16BA Medusa Base Station with RA16PA
or RA4PA Medusa PreAmp for acquisition.
Overview: Generates an auditory tuning curve (or frequency threshold curve) mapping the threshold
boundary of a neuron or fiber. Allows users to approximate the neuron's center frequency (or frequency of
maximum sensitivity). It acquires sorted spike data as well as measures of level and frequency.
Project File: TDT\OpenEx\Examples\AutoTuner\AutoTuner.wsp
Hardware: RX6 MultiFunction Processor for stimulation and RX5 Pentusa Base Station with RA16PA or
RA4PA Medusa PreAmp for acquisition.
Overview: Uses the characteristic frequency (found by running the Manual Tuning Curve example) to
generate stimuli with a random sequence of frequencies and intensities. This automated stimulus
presentation is then used to determine the tuning curve of a cell. This example demonstrates how scripted
elements can be incorporated into the OpenEx environment to provide extended functionality.
Evoked Response Project
Project File: TDT\OpenEx\Examples\EvokedResponse\EvokedResponse.wsp
Hardware: RP2.1 Real-Time Processor for stimulation and RA16BA Medusa Base Station with RA16PA
or RA4PA Medusa PreAmp for acquisition.
Overview: Presents stimulus tone pips at 50 ms while running a 12 kHz sample rate. The acquisition
period is 83.9 ms (1024 point average). Data is acquired and averaged for four channels of data.
OpenDeveloper Examples
Several OpenDeveloper example files are installed with OpenEx Suite in the Examples\TDevAcc_Example
and Examples\TTankX_Example folders. See the OpenDeveloper Reference Manual for more information.
45
OpenEx User's Guide
~
46
OpenProject Reference
In the OpenProject Reference you will find:
A reference guide to the OpenProject Workspace and the basics of creating projects.
47
OpenEx User's Guide
~
48
OpenProject Reference
About OpenProject
OpenProject acts as the essential environment integration tool for OpenEx, greatly simplifying the
system's ease of use. Managing a single directory structure of experiment files for all OpenEx
programs is the main focus for OpenProject.
Why the need for OpenProject?
OpenEx software is built on a very powerful Client/Server architecture, allowing a number of
smaller applications to come together in one powerful environment, configured to suit the needs of
each project. For example, if you don't need complex real-time views of your data as its being
recorded, you probably won't use OpenScope at run time. However, if histograms and raster plots
are important in your work then you'll need to include this application in your project. The multiapplication approach also offers a more distributed system, whereby, multiple computers can be
used to process and visualize your data in real-time. This client/server advantage comes at the
expense of a higher level of system complexity. In addition to having more applications to keep
track of and navigate on screen, there are more associated support and configuration files.
OpenProject provides the solution for both of these problems.
The OpenProject Interface
The OpenProject interface allows users to open and close an entire OpenEx configuration with a
single mouse click. Window handling and desktop layout are also controlled easily through
OpenProject. A program navigation bar provides easy paging through each of the applications in
your project. This includes multiple instances of applications like OpenController with each given
a logical name like, 'Sort Control' and 'Amplifier Control'. Programs are automatically sized and
stacked together with the default 'load on top' page defined by the user. Applications can also be
'floated' so they can be positioned anywhere on the screen for simultaneous viewing.
OpenProject File Management
Each application in your OpenEx project has one or more associated files. For example,
OpenWorkbench uses a single .xpm file to store configuration information about timing, devices,
and so forth and each OpenWorkbench configuration references one or more device circuit (.rco or
.rcx) files. OpenProject organizes all project files in a single directory tree named at its root for the
project. Optionally, local copies of circuit files are kept in a special RCOCircuits directory and
applications that use and edit these files will, by default, navigate to this dedicated directory. This
makes keeping track of your associated RPvdsEx circuits a more reasonable task and allows you
to customize the circuits running in one configuration without corrupting the circuit's operation in
another configuration. When applications are run under OpenProject, their associated file
load/save functions are disabled and handled automatically by OpenProject. Entire projects can be
moved, copied, and renamed easily with the project management tools available in OpenProject.
49
OpenEx User's Guide
About the OpenProject Window
The OpenProject Window is a tall narrow window that appears to the left of OpenEx applications
when they are opened or run as part of a project. The window displays icons for each application
included in a project and allows the user to quickly navigate between applications. The window
display is divided into two areas. The upper area displays icons for applications that are docked
(attached) to the OpenProject window. The lower area displays icons for applications that are
floating (not attached).
Using the OpenProject window:
Click an icon to make the corresponding application
the active (top) window.
Docked
Applications
Area
Drag the divider to change the relative sizes of the
docked and floating areas.
To attach or float an application, drag its icon across
the divider.
To close an application without closing OpenProject,
right-click its icon and click Close on the shortcut
menu.
Floating
Applications
Area
50
To delete an application, right-click its icon and click
Remove on the shortcut menu.
OpenProject Reference
Creating a Project
Work on any OpenEx experiment begins with creating a project.
To create a project:
1.
Launch OpenProject.
2.
In the OpenProject window, click the OpenProject menu and click New Project.
3.
In the OpenProject Configuration window:
a.
In the Project Name box, type a project name.
b.
In the File box, type a complete path for, or browse to, the location where you want
the project folder to be created. All project files will be stored in the new folder.
c.
Click the View/Edit button below the Description box.
d.
In the View/Edit Description dialog box, click the Edit check box and type a
description in the text edit area then click OK to return to the OpenProject
Configuration window.
4.
Double-click an application icon to add the application to the next row in the Launch Details
list. Repeat for each application that will be associated with the project.
5.
In the Mode cell for each added row that contains an OpenController or OpenScope
application, select the launch mode. See About the OpenProject Configuration Window below
for a description of modes.
6.
To ensure that all applications reference the same data tank, click the check box in the Tank
cell for each application line where it appears.
7.
To use an existing file for a given application, click in the corresponding Import cell. Browse
to the desired file and double-click the file name.
8.
Click OK to close the OpenProject Configuration window.
When a project is created a new folder with the user specified name is created. The project file
(.wsp) and a file for each added application is created in this new folder. DataTanks, RCOCircuits,
and UserFiles folders are also created in the project folder. Tank files may also be created and
added to the DataTanks folder (depending on project preferences).
Note: If you import an OpenWorkbench file, an RPvdsEx (.rpx or .rcx) file for any compiled
circuit files specified in the OpenWorkbench application might also be added to the RCOCircuits
folder. You can change the Keep local copy of RPvds circuits setting in the OpenProject
Preference dialog box.
51
OpenEx User's Guide
About the OpenProject Configuration
Window
The OpenProject Configuration window opens whenever a new project is created. It allows the
user to enter basic project information such as the name and location of the project and to add all
of the applications, or files that will be used in the project. It can also be used to add application
files to existing projects or to change the launch modes of previously added applications. After a
project has been created the OpenProject Configuration window can be accessed through the
Configure Project command on the OpenProject menu.
Project Name
The name of the folder that will be created to store all files for the project.
File Location
The location where the project folder will be created. Type a path in the File Location, click the
browse button to browse for a path, or click the arrow to select a recent location from a drop-down
list.
Description
An optional text description associated with the project. The View/Edit button can be used to
add/edit the description or to view lengthy descriptions.
Applications
Displays an icon for each application type that can be added to a project.
52
OpenProject Reference
Double-click an icon, or drag an icon to the Launch Details area to add the application. Multiple
instances of client applications, such as OpenScope and OpenController may be added. Only one
OpenWorkbench file can be added per project. Adding an application will also add a
corresponding file for that application.
Launch Details
Each row in this table can represent an application that has been added to the project. The order in
which applications are displayed in the Launch Details list indicates the order in which the
application icons will be arranged in the OpenProject window.
Application Column
An application can be renamed by clicking in the application cell and editing the text. This name is
both the file name for the individual application file and the name displayed along with the icon in
the OpenProject window.
Mode Column
After an OpenController or OpenScope application has been added to a row in the Launch Details
list a drop-down menu is available in the Mode cell. The Mode set here determines the mode in
which the application will be launched when the project is opened.
OpenController…
Run - launches in Run mode with controls running.
Design - launches in Design mode to allow the user to add, remove, or modify controls
before running.
Stop - launches in Run mode with controls stopped.
OpenScope…
Idle - allows users to select a data block or add, remove, or modify controls before
running.
Animate - plots are animated with last selected data block settings.
Track - plots are animated with the most recent block of data from a currently recording
experiment.
Tank Column
After an OpenWorkbench or OpenScope application has been added to a row in the Launch
Details list a check box is available in the Tank cell. Clicking the check box ensures that the tank
used by that application is synchronized with the project. If the tank is changed for the project it
will be changed for all synchronized applications.
Import Column
The cells in this column allow users to import an existing file for use with an added application.
When a file is imported, the imported file overwrites the default application file but retains the
default applications file’s filename.
Lock Project
This check box locks the project to prevent editing. The project may be run but not modified.
Projects can be unlocked from the OpenProject menu.
53
OpenEx User's Guide
Adding Applications to an Existing
Project
You can add applications to an existing project by opening the OpenProject Configuration window
and adding applications to the Launch list. You can also add an application directly from the
OpenProject window using the Add Components command on the OpenProject menu.
Adding Docked Applications to a Project
The main area of the OpenProject window can be used to launch and navigate between
applications that are attached to the OpenProject window.
To add a docked application:
1.
Right-click the Docked Applications area of the OpenProject window.
2.
Point to Add Component, and click the application to add.
Launching a Floating Application
The area of the OpenProject located below the adjustable pane divider can be used to launch and
navigate between applications that are not attached to the OpenProject window.
To launch a floating application:
1.
Right-click the Floating Applications area of the OpenProject window.
2.
Point to Launch in Float Mode, and click the application to launch.
Changing Launch Settings
After a project has been created, the project description and launch settings can be modified by reopening the OpenProject Configuration window.
To open the OpenProject Configuration window:
1.
Right-click the Applications area of the OpenProject window.
2.
Click Config Project.
Or
Click Config Project on the OpenProject menu.
54
OpenProject Reference
Stop Making Local Copies of
RPvdsEx Files
By default, OpenProject stores a copy of all files associated with a project, including RPvdsEx
circuit files in the project folder.
To stop making local copies of RPvdsEx circuit files:
1.
Right-click the Applications area of the OpenProject window.
2.
Click Preferences.
3.
On the Project RCO Files tab of the OpenProject Preferences dialog box, clear the Keep
local copy of RPvds circuits check box.
To make the current setting the default for all new projects:
Select the Save As Default check box, in the OpenProject Preferences dialog box.
Working with Data Tanks in
OpenProject
When working in OpenEx, all data is stored to an OpenEx data tank. Each tank may contain
several blocks of data from different experimental protocols and different subjects. To provide
data management, users may wish to have tanks automatically generated at regular intervals or
based on events.
Managing New Tank Creation
In the OpenProject Preferences dialog box, users can choose when and how new data tanks are
generated. Users can choose to be prompted to create a new tank at regular intervals or based on
events. The prompt may also include an auto naming scheme.
To configure Data Tank Synchronization Options:
1.
Right-click the Applications area of the OpenProject window.
2.
Click Preferences.
3.
On the Data Tank Synchronization tab of the OpenProject Preferences dialog box,
select the desired configuration option from the Prompt New Data Tank area.
4.
If auto naming is necessary, click the Auto Name Tank check box.
Note: The Tank box must be checked in the OpenProject Configuration window for at least one
component for a tank to be automatically generated.
To make the current setting the default for all new projects:
Select the Save as Default check box, in the OpenProject Preferences dialog box.
55
OpenEx User's Guide
Importing Application Files
When users create a new project or add applications to an existing project the user can import an
existing file for an application. When a file is imported a copy of the file is made which replaces
the default application file in the project folder. The default application file filename does not
change. When an OpenWorkbench file is imported, by default, a copy of the RPvdsEx circuit file
is added to the project folder.
Important! Tank files are NOT copied or imported when an OpenWorkbench
file is imported. They remain in their original location and should not be moved
or deleted. Moving or deleting tank files may result in loss of data.
New Projects
If the user is creating a new project it is a good idea to import files in the OpenProject
Configuration window.
To import files in the OpenProject Configuration window:
1.
Add an application to the Launch list.
2.
Click the Import cell for the desired application row.
3.
In the Open dialog box, browse to the file to import.
4.
Select the file to import and click Open.
5.
Repeat this process for each file to import.
Existing Projects
If the user is adding an application to an existing project, a corresponding application file can be
imported directly in the OpenProject window.
To import a file in the OpenProject window:
1.
Add an instance of the desired application.
2.
Right-click the new application icon.
Caution: Importing a file to an application instance other than a newly created application
may result in lost configuration information.
3.
Click Import on the shortcut menu.
4.
Browse to the desired file and click Open.
5.
Click Yes if prompted to discard current settings.
6.
Repeat the process for each file to import.
Note: This process replaces an existing application file in a project. Keep in mind that importing a
file into an existing application instance removes the file previously assigned to that application
instance from the project.
Importing RPvdsEx Files
When an OpenWorkbench file is imported, standard RPvdsEx files used by the OpenWorkbench
file will be imported automatically. A corresponding RPvdsEx file is also imported automatically
when a compiled circuit file is assigned to the Project's OpenWorkbench file. To import an
RPvdsEx file that is not assigned to an OpenWorkbench file, users must open the desired file from
within the RPvdsEx application and save it as part of the project.
56
OpenProject Reference
Menus and Dialog Boxes
OpenProject Menu
The OpenProject menu is available from the menu bar or by right-clicking the permanent
applications area. Some menu choices are only available when a project is open.
New Project
Opens the OpenProject Configuration window.
Load Project
Opens the Open Project File dialog box so that an existing
OpenProject file can be opened.
Close Project
Closes the current project.
Save Project
Saves the current OpenProject file and all project application files.
Save As
Saves a copy of the current project with a new name in a user
selected location.
Unlock Project
Unlocks a locked project. Only available when the project is locked.
Data Tank
Opens the OpenProject DataTank Setup Dialog box. This option is
enabled only if Data Tank Synchronization is enabled from the
OpenProject Configuration window.
Configure Project
Opens the OpenProject Configuration window so that project settings
can be changed.
Add Component
Opens a Submenu that allows the user to add an instance of
OpenWorkbench, OpenController, OpenScope, OpenBrowser, or
RPvdsEx to the project.
Clean Project
Opens the Clean Project dialog box and allows users to remove
unwanted files from the project.
Preference
Opens the OpenProject Preferences dialog box and allows the user to
set whether RPvdsEx files will be saved with projects and to set tank
synchronization preferences.
Recently Used Files
This section of the File menu lists recently used project files.
Clicking a file name opens the file.
Exit
Closes OpenProject and all project applications.
57
OpenEx User's Guide
Application Icon Shortcut Menus
Right-click any application icon in the OpenProject window to display a short cut menu.
Import
Opens a dialog box that allows users to browse to an existing file for
import to the selected application.
Attach
Docks the selected application window to the OpenProject window.
Float
Floats the selected application window.
Close
Closes the selected application without closing the project.
Open
Opens a closed application.
Remove
Deletes the selected application from the project.
OpenProject DataTank Setup Dialog Box
When the data tanks for the project are synchronized (Tank check box selected for applications in
the OpenProject Configuration window), this dialog box can be used to change the tank used
throughout the project. To view available options, right-click to display the shortcut menu. This
dialog box is opened from the Data Tank command on the OpenProject menu.
OpenProject File Dialog Box
The OpenProject File dialog box is a variation of the standard Windows Open dialog box. It
includes a shortcut bar and a description area.
58
OpenProject Reference
The description area displays the project description for a selected project file. The Shortcut bar
can be used to quickly navigate to a frequently used folder or file.
To create a shortcut, drag a folder or file from the list tot he shortcut bar. You will be given an
opportunity to name the shortcut. This dialog box is opened from the Load Project command on
the OpenProject menu.
Shortcut
Bar
Project
Description
Display
Area
About the OpenProject Preferences Dialog Box
The OpenProject Preferences dialog box can be used to determine whether compiled circuit files
are retained in the project folders and to determine when the user will be prompted to begin a new
data tank. It is opened from the Preferences command on the OpenProject menu.
Project RCO Files Tab
Keep local copy of RPvds circuit - This check box determines if copies of RPvdsEx circuit files
associated with an OpenWorkbench file are saved in the project's RCOCircuits folder. When this
check box is cleared, new projects created in the current OpenProject session will not include local
copies of these files. Clearing this check box will NOT remove files from a currently open project.
This setting is not retained in future sessions of OpenProject unless Save As Default is selected.
Save As Default - When this check box is selected, the current Keep local copy of RPvds circuits
setting is saved as the default and will be retained when OpenProject is closed and reopened.
Data Tank Synchronization Tab
Prompt New Data Tank - The user can select from the available choices to determine how often
they will be prompted to begin a new data tank for the project. When the Auto Name Tank check
box is selected the prompt will include a suggested name that consists of the project name, an
incremented number code, and a date. This helps to ensure that tanks will be kept at a manageable
size and may be used to help keep experiment data organized, daily, by recording session, or by
OpenProject session.
Save as Default should also be selected to retain the setting for the next OpenProject session.
59
OpenEx User's Guide
~
60
Circuit Design Reference
In the Circuit Design reference you will find:
Information about RPvdsEx macros and basic circuit design for OpenEx.
61
OpenEx User's Guide
~
62
Circuit Design Reference
Circuit Design Overview
Circuits can be modified or designed from within OpenProject by adding an instance of the
RPvdsEx application. RPvdsEx is the latest version of TDT's RP Visual Design Studio. RPvdsEx
allows the user to modify existing RPD, RPX, or RCX files and create compiled circuit files for
use with OpenWorkbench.
Note: All files created or modified in RPvdsEx are saved in the RCX format and might not be
compatible with earlier versions of RPvdsEx.
Before modifying a circuit file, be sure to work through the Getting Started with OpenEx Tutorial
found on page 9 and review Tips for Modifying Circuits found on page 339.
OpenEx Circuit Design
TDT's System 3 hardware is user programmable through the RPvdsEx circuit design applications.
Compiled circuit files (compiled circuits, either .rco or .rcx) developed in RPvdsEx can be used in
OpenWorkbench to generate stimuli, acquire signals, and control other hardware devices.
OpenEx circuits have two to three main subcomponents defined as circuit constructs:
Control constructs that determine how a circuit behaves under OpenEx.
At a minimum a control construct contains a clock and typically includes control over
timing and triggering. More complex control constructs allow for control of stimulus
generation, and data acquisition. The most reliable way to implement the necessary
control elements is to include the CoreSweepControl macro in every circuit file designed
for OpenEx. Additional sweep based controls are provided by the StandardTimeControl
macro.
Data constructs that define the type of data and the way the data is stored in the tank.
TDT has defined five data constructs. Each construct represents one of the three data
types. The most common of these have been implemented via the Data Saving macro set.
User defined constructs.
Users can add additional circuitry to customize data acquisition and stimulus
presentation.
OpenWorkbench relies on a rigid naming structure and standard circuit constructs, or groupings of
circuit components and parameter tags within the compiled circuit file to allow users to change
parameter values from the PC and visualize data in real-time. These details are handled behind the
scenes within the RPvdsEx macros. Macros simplify circuit design, allowing the user to 'drop in'
pre-debugged circuit chunks guaranteed to provide smooth integration with OpenEx. If a macro is
not available for a given task the user must use extra caution to design the circuit with all OpenEx
conventions in mind.
More details about working directly with parameter tags and non-macro constructs are available in
the Appendix A – Non Macro Circuit Construct Reference beginning on page 299.
A Brief Review of Terminology
Compiled circuit files are RP control objects, designed by users or TDT, for use with OpenEx
and other applications. May be in .rco or .rcx format.
63
OpenEx User's Guide
RPvdsEx files contain circuit diagrams designed in a visual drag-and-drop environment. May be
in .rpd, .rpx, or .rcx format.
Circuits are made up of components. Each component does a set task, such as generate a
waveform, store in memory, or send a signal to hardware outputs.
Circuit constructs are a group of components that perform a defined task in OpenEx. A circuit
construct will have a minimum or required component structure and secondary or alternate
component structures.
Macro/Construct Mapping Table
Each of the core group of Macros listed below provides the functionality of one or more of the
“circuit constructs” typically used in OpenEx projects. Detailed information about inputs, outputs,
and properties of each macro can be found within the macro’s tabbed properties dialog box.
Macro Name
Device Types
Function
CoreSweepControl
single and multi-processor
devices
generation of the core timing &
control signals used in every
OpenEx circuit
this macro must appear once and
only once in each circuit that
uses other macros and is used in
OpenEx
64
StandardTimeControl
single and multi-processor
devices
generation and storage of the
basic timing/control signals
needed to drive various
stimulation or acquisition
structures
HP-LP_Filter (1Ch, 4Ch)
single and multi-processor
devices
HP-LP_Filter (MC)
multi-processor devices only
filtering of floating point data
streams through cascaded
highpass (HP) and lowpass (LP)
filters
Block_Store (1-8 Ch)
single and multi-processor
devices
Block_Store (MC)
multi-processor devices only
Stream_Store (1-8 Ch)
single and multi-processor
devices
Stream_Store (MC)
multi-processor devices only
continuous or decimated block
storage of floating point data
streams
Circuit Design Reference
Epoc_Store
single and multi-processor
devices
storage of scalar Epochs on
transitions of control or signal
inputs
Slow_Store (1-8 Ch)
single and multi-processor
devices
triggered storage of floating
point or integer data streams
Slow_Store (MC)
multi-processor devices only
Spike_Store (1-8 Ch)
single and multi-processor
devices
Spike_Store (MC)
multi-processor devices only
spike thresholding and sorting of
floating point data streams using
the FindSpike, SortSpike,
SortSpike2, or SortSpike3
components, and storage of the
snippets
Control Constructs
About Control Constructs
OpenEx is designed for time critical data acquisition and stimulus presentation. To ensure precise
triggering of all System 3 hardware devices, a global trigger is sent to each of the System 3
hardware device caddies (zBus). At the simplest level (continuous acquisition) this will start a
clock that generates a time stamped output. Most timing and control can be handled using one of
the following macros.
CoreSweepControl
The CoreSweepControl macro should be used in every circuit file intended for use in OpenEx.
It produces core timing and control signals required in all circuits designed for use with OpenEx.
Its functions include:
Starting and synchronizing timing generators on each real-time processor used in the
OpenEx project
Generating timing pulses for all sweep-based (e.g.) stimulation or acquisition protocols
Storing the sweep number and timestamp
Optionally creating up to four additional secondary Stores for saving epochs at the onset
of each sweep. Sweep number and timestamp are saved using a Data List (Type-2)
storage method.
The CoreSweepControl works with both single and multi-processor devices and automatically
distributes timing signals used in other macros in a way that is transparent to the user.
OpenWorkbench triggering, sweep duration and sweep count are implemented within this macro.
Double-click the macro icon in RPvdsEx to view detailed help for the macro.
65
OpenEx User's Guide
StandardTimeControl
The StandardTimeControl macro is used to time and record information for repetitive, sweepbased, (e.g.) stimulus or acquisition control periods. OpenWorkbench sweep settings used to set
the onset delay and duration of a sweep are implemented in this macro. Three timing signals are
generated relative to the onset of each sweep. These indicate the onset, offset and duration of a
control period and are available as macro outputs named ^On, ^Off and Control. These would be
used in turn to control acquisition or stimulation components in later stages of the processing
chain.
Three optional Stores are included to record Epoch events (scalar values) at the onset or offset of
the control period. These are normally used to store the stimulus or control parameters that are
active at the start or end of the control period and should be used only for signals that are
synchronous with it.
Regardless of whether the onset or onset_offset mode is assigned to the primary Store, Stores A
and B are acquired at the sweep onset and require the primary Store for their timestamp.
Double-click the macro icon in RPvdsEx to view detailed help for the macro.
Data Storage
Data in OpenEx can be categorized into three basic data types: scalar values, discrete waveforms
(often called snippets or segments), and continuous waveforms (often called streamed data). Data
storage macros have been developed to simplify the structure of circuit design and storage
configuration. Each data storage macro contains a data construct which defines what type of data
will be handled by the macro. All storage configurations take place behind the scenes.
Choosing a Data Construct
The following table provides a direct comparison of the three data types used in OpenEx, the
constructs that implement them, and the macros needed to handle the data.
66
Circuit Design Reference
Data Type
Scalar Data
Discrete Data
Continuous Data
Macro to use
Epoc_Store
Block_Store_MC
Stream_Store_MC
Slow_Store_MC
Spike_Store_MC
Data Construct
Type
Triggered Scalar
Data Buffer
Data List
Signal Snippets
Description
single values
small waveforms
Synchronous
synchronous across all synchronous across all
channels
channels (snippets)
Asynchronous
Continuous Waveform
single waveform
synchronous across all
channels
asynchronous across all
channels (spikes)
Common signals temperature, PH, spike evoked potentials
rate,
or values
snippet data
frequency, or level
spike data
spike activity (plot
decimated), decimated,
and raw waveforms
Note: the information provided here for storage macro selection is intended as a guideline;
however, the stored event rates that can be achieved with each data construct may vary depending
on the amount of data to be read back and the Master Polling Rate set in OpenWorkbench. To
ensure that all data is stored without loss the maximum data transfer rate should not be exceeded.
Calculating Data Transfer Rates
The maximum throughput of the TDT system differs depending on the interface. Refer to your
System’s User Guide for more information on the maximum throughput of your interface.
Data acquisition that is near the maximum rate may cause more data to be acquired on the
hardware device then can be transferred to disk. At that point the system will fail to store all the
data and, if it continues for an extended period of time, can cause OpenWorkbench to stop
acquiring any data.
To minimize the chance of exceeding the data rate, data should be acquired at rates that are no
more than 90% of the maximum transfer rate. There is a fair amount of overhead associated with
polling all of the hardware devices and rates that come close to the above transfer rate are likely to
overflow.
How to Calculate Your Maximum Transfer Rate
The maximum transfer rate of your protocol is fairly straight forward. Transfer rate is rarely of
concern when working with data with slow event rates, such as triggered scalars or events that are
only acquired at the end of an acquisition such as an averaged signal. Streamed or snippet data that
is acquired through out the experiment, however, may cause problems.
67
OpenEx User's Guide
The maximum transfer rate for a snippet is calculated as:
Maximum number of events per second * Block size * Number of channels * Data type (Float,
Byte, Single, I32, or I16). For example, if the maximum number events are 50 per second, the
block size is 32 points, the number of channels is 16, and the data type is float, then:
Events = 50 per second
Block Size = 32
Channel Count =16
Data Type = Float (4 bytes)
This yields the equation: 50 * 32 * 16 * 4 = 102,400 bytes per second.
The maximum for streamed data is calculated as:
Compiled circuit file sample rate / Decimation factor * Number of channels * Data type
For example, if 16 channels of data are acquired at 25 kHz with no decimation and in Single
format (16 bit), then:
SR = 24414.0625
Channel Count = 16
Decimation Factor = 1
Data Type = Single (2 bytes)
This yields the equation: 24414.0625 / 1 * 16 * 2 = 781,250 bytes per second.
What about acquiring snippets and streamed data?
When acquiring multiple data types sum the total transfer rates. For example, if the data acquired
was 16 channels of snippets and 16 channels of evoked potentials (1000 Hz sample rate) along
with decimated waveforms the calculations might look like this.
Snippets:
Events = 50 per second
Block Size = 32
Channel Count = 16
Data Type = Float (4 bytes)
50 * 32 * 16 * 4 = 102,400 bytes per second
Streamed data:
SR = 24414.0625
Channel Count = 16
Decimation factor = 24 (generates 1000 Hz SR)
Data Type = Float
24414.0625 / 24 * 16 * 4 = 65104 bytes per second
Plot Decimated waveforms:
SR = 24414.0625
Channel Count = 16
Decimation factor = 64 (generates 1000 Hz SR)
Data Type = Single (remember 16 bit for each value)
24414.0625 / 64 * 16 * 2 = 12,207 bytes per second
Total transfer rate = 12207 + 65104 + 102,400 = 179,711 bytes per second
68
Circuit Design Reference
Data Storage with Macros
The most important part of running an experiment with OpenEx is saving the experimental data.
To correctly save data, the data constructs in RPvdsEx (buffers for collecting the data, etc.) must
be carefully configured. RPvdsEx includes a number of data storage macros designed specifically
for OpenEx. Using these macros simplifies circuit design and ensures smooth integration with
Workbench.
Tip!: More information about each macro is available in its onboard help. To access that
information, add the macro to an RPvdsEx circuit and double-click the macro icon to display the
macro properties and help.
Scalar Data
Scalar data is commonly stored for stimulus variables and time references and is primarily used as
reference data for epochs. See About Epoch Events, page 82 for more information.
Epoc_Store macros
The Epoc_Store macro is useful for
experimental protocols that require several
secondary tags that reference a primary store.
The Epoc_Store_1-4Ch macro stores scalar data
according to a rising trigger edge. It is useful for
simple scalar recording.
The Epoc_Store_with_Offset offers the same
functionality of the Epoc_Store macro but also
allows buddy epochs to be set. For more
information see About Epoch Events, page 82.
Uses:
The Epoc_Store macros are typically used to store scalar values, such as
stimulus variables.
Description:
Epoc_Store macros store an Epoch value on the rising, falling or either
edge of the selected trigger.
Users can choose to use the macro Trigger input, the onset of each
system sweep, or whenever the value of the primary input changes as the
trigger. Up to four secondary Stores can also be enabled to store other
values on each trigger which reference the primary store.
Secondary Tags
Secondary tags are a way of sharing time stamps between data Stores and are defined in the Stores
section of OpenWorkbench. In some cases there are multiple pieces of data that are always stored
at the same time. For example, stimulus parameters such as amplitude and frequency might need
to be saved once per sweep. In these situations, it is convenient to use Secondary Tags.
Many data saving macros allow secondary tags to be configured easily, requiring only the primary
store to be specified. For example, the Epoc_Store macro offers up to four secondary tags to be
stored in reference to its primary store. After the primary Store is enabled, secondary tags can be
added for each of the other Stores that will share time stamps with the primary Store. The data
types of the primary Store and any associated secondary tags are the same.
69
OpenEx User's Guide
Slow_Store macros
The Slow_Store_1-4Ch and Slow_Store_1-8Ch
macros are compatible with TDT’s single
processor devices.
The Slow_Store_MC macro is supported only by
multiprocessor devices such as the RX5 and RZ2.
Uses:
Slow_Store macros are used for storing scalar data such as stimulus
parameters and digital input values. They can be used to record stimulus
parameters time stamped to a subject response or other external event.
Description:
Slow_Store macros provide triggering based on an internal sampling rate
or external trigger rather than triggering related to the system sweep or
stimulus value change. They will accept floating point or fixed point data
streams and one sample point will be stored for each channel of data at the
rising edge of the trigger input when the enable line is true.
Discrete Data
Discrete data is commonly found in the form of snippet waveforms, or block waveforms. Discrete
data is useful in spike sorting as well as averaging since it can be time stamped and referenced to
segments and events.
Block_Store macros
The Block_Store_1-4Ch and Block_Store_18Ch macros are compatible with TDT’s single
processor devices.
The Block_Store_MC macro is supported only
by multiprocessor devices such as the RX5 and
RZ2.
Uses:
Block_Store macros are used to store snippet data, but do not include
any spike detection or sorting.
Description:
Block_Store macros store snippets in relation to a trigger, giving the
user the option to shift storage in relation to the trigger.
They will accept floating or fixed point data for block storage at a
specified sample rate. The number of points saved (block width) can also
be set by the user.
70
Circuit Design Reference
Spike_Store macros
The Spike_Store_1-4Ch macro is compatible
with TDT’s single processor devices.
The Spike_Store_MC macro is supported only
by multiprocessor devices such as the RX5 and
RZ2.
Uses:
Spike_Store macros are used to store data snippets, such as spike
waveforms, and incorporate several methods of threshold detection and
spike sorting.
Description:
Spike snippet width and spike detection and sorting method (Processor
Type) are defined in the setup properties. Thresholding and sorting are
controlled by the user through OpenController, using the Scrolling
Threshold and Snippet Sort controls. The macro provides the necessary
controller targets (parameter tags) depending on the Processor Type
chosen.
Choosing a Spike Component
OpenEx supports four spike acquisition components, typically implemented through a Spike_Store
data saving macro. Users can select which component (or processor type) is used in the macros
set-up properties.
The SortSpike2 component should be appropriate for most spike discrimination and spike sorting
applications. However, there may be rare instances where choosing one of the other available
spike components could provide better performance.
TDT strongly recommends using the SortSpike2 whenever possible. All four components can be
used with the Scrolling Threshold control for spike discrimination. However, FindSpike cannot be
used with the Signal Snippet Control for online spike sorting. This section provides a table for
comparison of the four spike detection components followed by discussion of how they differ and
when to use them.
71
OpenEx User's Guide
The following table compares the different processor types, their uses, and specifications.
Issue
FindSpike
SortSpike
SortSpike2
SortSpike3
Threshold
value between two
RMS windows
value between two
voltage windows
value above a set
voltage threshold
(threshold can be
bimodal)
value above a set
voltage threshold
(threshold can be
bimodal)
Windowing
peak of spike
centered in buffer
peak of spike
centered in buffer
threshold crossing
placed at 1/4 point
of the buffer
threshold crossing
placed at 1/4 point of
the buffer
Biphasic Spikes
yes
no
yes
yes
Spike Sorting
none
time-voltage spike
sorting
time-voltage spike
sorting
time-voltage spike
sorting
Time Stamp
yes
yes
yes
yes
Time Stamp
Position
center of buffer
center of buffer
1/4 mark of the
buffer
1/4 mark of the buffer
Buffer Description
buffer size is
determined by
defining a value
that equals the total
size of buffer
including a time
stamp
buffer size is
determined by
defining a value that
equals half the size of
the buffer including
time stamp and sort
spike code
buffer size is
determined by
defining a value
that equals 1/4 of
the size of the
buffer including the
time stamp and sort
spike code
buffer size is
determined by defining
a value that equals 1/4
of the size of the buffer
including the time
stamp and sort code
When To Use
when there is no
need for spike
sorting and the
noise floor of the
signal might vary
greatly (users can
set up a second
threshold to reject
artifacts)
when spike sorting is
required or if the
spike rate might
affect the RMS of the
signal
same as for
SortSpike except
there is no artifact
rejection
when the sort code
needs to be based on all
of the time-voltage
windows that the
waveform passes
through
when spike sorting
is required or if
spike trains
increase the RMS
when circuits that can
easily be used with
BrainWare or custom
ActiveX applications
are desired
When Not To Use
72
when windowing
must be used to
minimize stimulus
artifacts
when spikes that
exceed above an
absolute threshold
value must be
detected
when more than four
time-voltage windows
are used (four windows
will generate 24 or 16
distinct sort codes)
Circuit Design Reference
FindSpike
The FindSpike component differs from the SortSpike components in two significant
characteristics: FindSpike does not allow online spike sorting and it does not use a fixed voltage
threshold for spike discrimination. Users who require online spike sorting should use one of the
SortSpike components. If online spike sorting is not required, FindSpike can be used and has some
advantages for acquiring candidate spikes. FindSpike detects spikes based on their deviation from
the noise of the system. The noise floor of the signal is determined by calculating the RMS of the
last x number of milliseconds (tau). If the noise floor of the signal changes over the acquisition
period FindSpike will track the changes and compensate for variations in the noise floor. As long
as the signal to noise ratio between the noise floor and the spikes remains constant, or relatively
so, the candidate spikes should be easily acquired. In contrast, the SortSpike components use a
fixed voltage threshold. If the noise floor changes (even if the signal to noise ratio of the spike
does not change) there is a potential to loose candidate units or to acquire signal artifacts. One
problem with using the RMS of the noise floor is that it is affected by changes in unit activity. A
spike train may change the calculated RMS value and thereby decrease the chance of acquiring all
the spikes in a train using this method. If the firing units cause a significant change in the RMS a
SortSpike2 (or similar) component should be used.
SortSpike and SortSpike2
SortSpike and SortSpike2 were designed primarily for use with OpenEx applications and allow
online real-time spike sorting through OpenController. Signals that cross a fixed voltage threshold
(window discriminator) are considered as candidate spikes. Units whose waveform also falls
within a voltage range during a specified time window are given a unique sort code while units
that do not pass through any of the time voltage windows are assigned an unclassified code.
Because SortSpike and SortSpike2 use a fixed voltage window discriminator, spike trains during
the onset or offset of a stimulus should not affect the systems ability to acquire unit activity.
However, if the noise floor of the signal changes, it may be necessary to change the threshold
settings on a regular basis to ensure a proper signal to noise ratio.
SortSpike and SortSpike2 differ in how the captured signal is stored in the buffer. SortSpike, like
FindSpike, centers the peak of the waveform and uses this value as the time stamp for the signal.
The position of the discriminator does not affect the position of the waveform in the buffer.
Because SortSpike and FindSpike use the peak of the signal as the center, variation in signal
amplitude do to the ambient background noise may shift the true peak of the waveform. This jitter
will cause minor variation in the time stamp of the signal and may affect the acquired signal since
the position of the waveform is dependent on the peak signal. The noisier the signal, the greater
the effect.
The time stamp and position for of the waveform for SortSpike2 is dependent on the time of the
threshold crossing for the signal. This has two effects on the positioning of the signal in the buffer.
First, signals that differ in shape may have their peaks at different positions in the buffer.
If it is important for the time stamp to be relative to the peak of a waveform then it may be
necessary to calculate a new time stamp offline. Second, changing the position of the discriminator
will affect the positioning of a signal in the buffer. For example, setting the signal to noise of the
threshold relatively low (1.2:1) shifts the time stamp to an earlier point (since the signal crosses
the threshold earlier) and shifts the peak to a later point. As the position of the threshold becomes
closer to that of the peak, the time stamp for SortSpike and SortSpike2 become more similar.
In addition, SortSpike2 allows users to set a bimodal threshold. This allows users to sort spikes
that differ in both shape and direction of the peak. However, it does not allow users to reject
stimulus artifacts (which both SortSpike and FindSpike allow). If users plan to use electrical
stimulation it may be necessary to use SortSpike or FindSpike so that signal artifacts can be
removed.
73
OpenEx User's Guide
SortSpike3
SortSpike3 is a modified version of the SortSpike2 component. The only difference between the
two components is the generation of the sort code. See Determining Sort Code, page 160 for more
information.
Each to the spike discrimination components has advantages and disadvantages. Users should
select a component based on their research needs.
Continuous Data
Continuous data found in OpenEx is typically streamed with a time reference only to the start of
the block. Continuous data can be stored in several data formats and is useful for observing plot
decimated data (spike activity), raw waveforms, and decimated waveforms.
Stream_Store macros
The Async_Stream_Store_MC and
Async_Stream_Store_1-4Ch macros are
supported only by multiprocessor devices such
as the RX5 and RZ2.
The Stream_Store_1-4Ch and 1-8Ch macros
are compatible with TDT’s single processor
devices.
The Stream_Store_MC macro is supported
only by multiprocessor devices such as the RX5
and RZ2.
The Stream_Store_MC2 macro is supported
only by multiprocessor devices such as the RX5
and RZ2 and is an extremely efficient data
storage macro. Cycle usages for saving data are
reduced by saving streamed data from all
channels as one collective stream instead of
parsing individual channels. Visualization in
OpenController is not supported since individual
channels are not separated until the data is stored
to the tank.
Uses:
Stream_Store macros are used to store streaming raw, filtered, or
decimated waveforms. Async_Stream_Store macros are used to store
streaming raw, filtered, or decimated waveforms through an
asynchronous enable at a specified sample rate.
Description:
Stream_Store macros accept floating point data streams for storage at a
specified sample rate. Depending on the Store Format parameter setting,
one of five data formats will be used for storage; 32-bit floating point,
32-bit integer, 16-bit integer (Short), 8-bit integer (Byte), or 32-bit
integer for plot decimation.
Async_Stream_Store macros are similar to the Stream_Store macros
but allow storage to be triggered asynchronously through an enable.
74
Circuit Design Reference
OpenController Constructs
Biquad Filtering
Biquad filtering can be implemented using one of the filtering macros available in RPvdsEx.
HP-LP_Filter_1Ch, HP-LP_Filter_4Ch, and HP-LP_Filter_MC macros pass floating point
data through cascaded highpass (HP) lowpass (LP) filter sections.
Butterworth filter coefficients can be updated through the macro properties dialog, through
parameter tags via software control or dynamically through direct connections to the FreqHP and
FreqLP macro parameter inputs (when enabled).
75
OpenEx User's Guide
~
76
OpenWorkbench Reference
In the OpenWorkbench Reference you will find:
A reference guide to OpenWorkbench including an introduction to important concepts, the
Workbench workspace, the basics of configuring and experiment, and running an experiment
using the system controls.
Configuring an Experiment
Step-by-step guide to configuring a project with reference details.
77
OpenEx User's Guide
~
78
OpenWorkbench Reference
About OpenWorkbench
OpenWorkbench is a flexible application for running and designing experiments. OpenWorkbench
uses compiled circuit files to control System 3 hardware and funnels acquired data to OpenEx's
TTank data server for fast indexing and storage. Configuration files (.xpm) include information
about device configuration, data storage, and the experiment timing and control. Several
OpenWorkbench configuration files are provided as part of the Examples so users can get started
with common experimental paradigms right away. As users become more familiar with
OpenWorkbench they can modify those configuration files or design their own. The
OpenWorkbench interface is streamlined so that the most frequently utilized features are in view.
A menu bar is also provided for easy access to additional commands.
The Main Window displays device configuration details and
storage specifications during set-up and toggles to plotting during
data collection or preview.
The Device Navigator
provides a drag and drop
interface for configuring
the devices in your
system.
The System Control
window provides control
over running protocols.
The Messages window displays status information
and error messages.
79
OpenEx User's Guide
Record Mode
Understanding OpenEx Data Stores
OpenEx experiments can acquire and store various types of data in a single data tank. For
example, an experiment might acquire both spike waveforms and the scalar values of a stimulus
variable. Each type of data to be acquired during an experiment is called a Store. Each Store is
defined by a data construct within the compiled circuit file. When a compiled circuit file is
assigned to a selected device, the Store information, including data type and number of channels,
is displayed in the storage specification table. Data constructs are groups of components within a
circuit that provide information to OpenWorkbench on how to store data to the tank. OpenEx
recognizes five distinct data constructs but all data can be categorized into three basic data types:
scalar values, discrete waveforms, and continuous waveforms.
Scalar Values
Scalar events are typically things such as temperature, PH, or spike rate. Scalar events that are
marked as epochs in OpenEx allow users to sort and visualize data that is associated with a
particular event. For example, if the stimulus frequencies are stored as an epoch scalar then the
user can quickly sort data and view all data acquired with frequencies above 4000 Hz. Scalar
values can be stored using either the Store inputs associated with the control macros or using the
Epoc_Store or Slow_Store macros. When macros are not used, scalar data is saved using a
Triggered Scalar or a Data List data construct.
Discrete Waveforms
Discrete waveforms, or fixed block events, are small chunks of data (<1000 samples). They are
typically things such as acquired spikes or evoked potentials. Users can store this type of data
using either a Spike_Store or Block_Store macro. When macros are not used a Data Buffer or
Signal Snippet data construct can be used.
80
OpenWorkbench Reference
The Spike_Store macro is used when spike detection and/or sorting is needed and Block_Store is
used when it is not. Each of these macros can acquire fast data, signals that occur at rates greater
than once a second and store separate time stamps for each channel (asynchronous storage).
It is important to note that block sizes must be small enough and infrequent enough so that a
maximum data throughput of 200,000 samples per second is not exceeded.
If the size of the block is large and there are multiple channels it is possible to attempt to store
more data than can be transferred. See Calculating Data Transfer Rates, page 67 for more
information.
Continuous Waveforms
Continuous waveforms are acquired without interruption from the beginning to the end of the
acquisition block. Acquired data has a fixed number of samples per second, which is based on the
sampling frequency of the device and the decimation factor of the acquired signal. The Continuous
Waveform construct has several features that differentiate it from other data types. First, the
construct does not have its own time stamp. All data types are defined relative to the start of the
block. If there is any disruption of the acquired signal, the data tank will generate errors about
storing data to a data block. For example, if a user wanted to acquire a large block of data only
when a particular event occurred they should use a Data Buffer and not a Continuous Waveform.
Second, streamed data requires only one sync for all channels. This is because the data acquisition
is synchronous across all channels.
Continuous acquired data comes in three formats:
Plot decimated data - the maximum and minimum of a block of data is determined and stored as
a single 32-bit word. Data in this format allows users to visualize the maximum noise floor and
spike activity of an incoming signal; however, it is not a true representation of the acquired signal.
Continuous undecimated data - signals that are acquired at the sampling rate of the RPvdsEx
circuit. The acquired signal in this format should be streamed at a sample rate that will be below
the maximum transfer rate of the hardware.
Continuous decimated data - signals that are acquired and filtered and then decimated. The
decimated signal is then stored to a buffer.
All three continuous waveform types can be acquired using the Stream_Store macros.
For more information about data storage see Data Storage Macros, page 66 and About Control
Constructs, page 65.
81
OpenEx User's Guide
About Epoch Events
Epochs are sections of tank blocks that are associated with the tank's timeline. They identify the
start, stop, or duration of particular event periods. For example, an epoch could be associated with
a stimulus presentation period and could identify a pre-stimulus, stimulus, or post-stimulus period.
Because epochs are automatically indexed by TTank as they are stored, other events can be
referenced against them. OpenBrowser and OpenScope use epoch values to display and edit tank
data. For example, epoch events can be used as the reference for creating histograms and rasters.
They can also be used by OpenBrowser to view and export data with reference to the epoch
events.
Epoch events can be scalar variables including triggered scalars, data lists, and their associated
secondary tags. They can be of a set or variable length depending on the triggers and sync tags
used within the data construct. An epoch can be used to identify the period of a sweep, the
duration of a stimulus, the duration of the acquisition, or be independent of the sweep and
acquisition properties of the system. For example, an epoch can be set when an event, such as a
button press or an update of a stimulus paradigm from OpenController, occurs.
Epoch events can be continuous or intermittent and are marked as sections within a block. Each
section is associated with a scalar value. Standard strobed events are continuous. That is, when one
epoch ends the next begins. The strobe type (ONset or OFFset) determines whether the time stamp
occurs at the start or the end of the epoch. Two epoch Stores, one ONSET and the other OFFSET
can be declared as buddies to create an epoch that is not continuous. This creates a single epoch
that starts at the occurrence of the ONSET epoch and ends at occurrence of the OFFSET epoch.
For example:
Store
Strobe Type
‘Pre+’
ONset Strobe
‘Pre-’
OFFset Strobe
‘SwpN’
ONset epoch
Buddy Epoch:
‘Pre+’
Timeline in OpenScope
Onset Strobe (Pre+)
Offset Strobe (Pre-)
Using buddy items will decrease the size of the tank and minimize storage of extraneous
information.
Creating Epochs
A Store that includes a sync and time stamp parameter can be set as an epoch event in
OpenWorkbench by setting the Strobe Type parameter in the Storage Specification Table (you
might have to right click and select Show All Fields to view this data column). The strobe type
determines whether the time stamp occurs at the start or the end of the epoch.
82
OpenWorkbench Reference
About Tanks
As data is acquired it is passed to a powerful data server. The data server, TTank, indexes and
stores the data then makes the data available to other client applications in the OpenEx suite. Users
can create a base name that will be assigned to each block of data acquired in the selected tank.
Data Tank Formats
DataTanks and blocks are treated as folder/file structures. Each new data tank acts as a folder that
contains multiple block folders. The four files (.tbk, .tdx, .tev, .tsq) associated with each block are
stored within each block folder. Tanks and blocks can be browsed and managed just as you would
with other Windows-based folders and files. Individual blocks can be deleted or transferred
between tanks using standard Windows Explorer methods. However, the underlying file structure
for each block should always be maintained. If a block must be moved, move the block folder.
Never move or delete an individual .tbk, .tdx, .tev, or .tsq file. Blocks and files are named with a
consistent naming structure to help keep blocks intact.
The following figure shows a Windows Explorer view of a tank folder and its corresponding
blocks. Note the identifying tank and block icons.
You can create new tanks or open existing tanks in the Data Storage dialog box, available from the
Data Tank command on the File menu in OpenWorkbench.
Legacy Tanks
OpenEx 2.0 supports the ‘legacy’ DataTank structure used in earlier versions of OpenEx, but
strongly recommends using the more manageable and portable DataTank structure that is the
default format in the current release. The 'legacy' tank structure does not provide easy access to
add, move, or delete individual blocks within the tank from Windows Explorer.
Registering Tanks
If a tank will be accessed across a network, it must be added to the windows registry. Tanks can be
registered or unregistered with a single click from the Data Storage dialog within OpenWorkbench
or from TankMon.
Note: there is a limit to the number of tanks that can be registered at one time.
83
OpenEx User's Guide
Workspace Basics
Using the Device Navigator
The Device Navigator provides a drag and drop interface for configuring the devices in your
system. On launch, OpenWorkbench automatically detects all TDT programmable hardware
modules that are powered on and connected to the PC and generates a system diagram in the
Device Navigator window. The devices are displayed in the top half of the window. Clicking a
device icon displays configuration information for that device in the Main Window. Devices are
configured (with processing chain and storage specifications) by assigning a compiled circuit file.
Device icons that are colored gray indicate that they have not yet been assigned a configuration,
those in black indicate that configuration is complete.
If you load an existing project, OpenWorkbench attempts to match device configurations saved as
part of the Workbench file with the hardware detected. Any configurations that are not matched to
a device are displayed in the bottom section of the navigator. To assign or move configurations
between devices, simply drag the configuration icon to the desired device icon.
Device detected - not configured
Device detected and configured
Configuration saved but not
assigned to a device
The Device Navigator is a sub-window that can be floated, moved, collapsed, or hidden. By
default, it is located in the upper left corner of the WorkBench window.
Using the System Controls
The OpenWorkbench system controls allow the user to start or stop the experiment from the PC
and preview data as it is being collected. The System Control window also provides status
information about the system. The control set includes a system status indicator, control buttons,
an event rate indicator, and a trigger button.
84
OpenWorkbench Reference
Protocol Control Buttons
Status
Indicator
Bar
Event
Rate
Indicator
ZBus(B) Trigger Button
Event Rate Indicator
The Event Rate indicator is a vertical scale and arrow to the right of the control buttons. The arrow
indicates the rate of events being stored to the tank. The arrow changes color from blue, to amber,
then red to alert the user when the event rate is high. If the event rate is high, the user should check
and adjust threshold settings and other event criteria to ensure that the maximum event rate is not
exceeded. Data will be lost if the maximum event rate is exceeded.
Status Indicator Bar
The Status Indicator Bar flashes green when the system is running in Record or Preview mode
without errors. The bar will flash red when errors occur.
Control Buttons
The control buttons allow the user to run or halt the experiment.
Record
devices are loaded and running and data is saved to the tank
Preview
data is saved to a temporary block in the tank
Users can examine data in both OpenScope and OpenController. This allows
users to modify parameter values before starting the experiment.
Standby
devices are loaded and running but signals are not being acquired and saved
to disk
This allows the user to modify parameter values through OpenController.
Idle
devices are not loaded and are not running
Switching to Idle mode resets Control values to their defaults.
When Record or Preview is selected, the plot window is displayed in the main window area and
status information in displayed in the message window area.
By default, the system will automatically switch to Idle mode if 100 errors are reported in a single
recording session. The error counter is reset for each new recording session. The number of errors
can be set in the OpenWorkbench Preferences dialog box.
zTrigger-B Button
This option is activated when the Use zTrgB check box is selected under Triggers and Mode
Switching on the Workbench setup menu.
85
OpenEx User's Guide
When the zTrgB button is illuminated, pressing it will start a conditional trial or trigger any event
on devices that have the zTrigB line enabled.
Using the Messages Window
When OpenWorkbench is running, the Messages window displays a scrolling list of
OpenWorkbench messages. You can double-click any message to display the full message in a
message box. Messages may contain information about OpenWorkbench activity, TTank activity,
or system errors. Error messages provide the user with details about the error.
Pause
The Pause button freezes the appearance of the Messages window to allow the user more time to
read displayed messages. Message scrolling resumes when the Pause button is clicked again.
Verbose
The Verbose check box toggles verbose messaging on and off. When the check box is cleared,
only mode change and error messages are displayed. By default, verbose messaging is not
enabled. The default can be changed in the OpenWorkbench Preferences dialog box.
Find Err
The Find Err button scrolls through error messages in the message list. Each time the button is
clicked the next error message is highlighted in the Messages window.
Clear
The Clear button, removes all messages from the Messages window.
Using the Plot Window
If the OpenWorkbench preference Enable Data Monitoring is checked, the plot window is
automatically displayed when a project is run in OpenWorkbench. Users can also toggle the
window off or on from the View menu.
In Preview and Record modes, OpenWorkbench generates a plot set for fast, easy visualization of
data. Workbench automatically chooses a plot type and configuration for each data set, but users
can adjust the configuration for each plot to refine the display.
86
OpenWorkbench Reference
A toolbar at the top of the plot window allows the user to control plot animation.
Play
Pause
Scroll back by plot window width (e.g. if span is set to 60 seconds, this button will
scroll back in 60 second chunks)
Scroll back (increments of span/10)
Scroll forward (increments of span/10)
Scroll forward by plot window width
Auto Scale
Data Monitor Setup (launched dialog)
Refresh
Additional commands for scaling, shifting, or moving plots are available from a right-click
shortcut menu.
87
OpenEx User's Guide
Auto Scale
Scale the display so that it best fits in the available subplot area.
Scale Up/Down
Incrementally scales the display up or down.
No Shift
Removes any offset that was placed on the display in the
subplot window.
Shift Up/Down
Shifts the display up or down in the subplot window.
Move Up/Down
Moves the subplot up or down in the Plot Window view.
Make
larger/smaller
Makes the available subplot area larger or smaller. The other
plots are resized accordingly.
Hide/UnHide
Makes the available subplot area larger or smaller. The other
plots are resized accordingly.
Users can change the plot type, modify the number of channels viewed, and choose to color traces
by channel or sort code in the Display Options dialog. To modify the display options, double-click
the desired sub-plot.
Users can change settings related to the time span and tracking of the plot window in the Data
Monitor Setup. To view data monitor settings for the plot, click the
the plot toolbar.
88
Data Monitor button on
OpenWorkbench Reference
Time Span Control
Span - Set the span (sec) of the plot window
History - Determine how much plot history will be stored for viewing purposes.
Note how the memory requirements change as these settings are adjusted.
Tracking Mode
Reference Epoc - If a reference epoch is used, the left side of the Plot Window will
always coincide with the start of the reference epoch.
Time Axis Overlap - Set the amount of the time axis that is repeated when the plot rolls
over. For example, if the span is 10 seconds and Time Axis Overlap is set to 50%, the
plot will show seconds 0-10, 5-15 etc.
Time Display Mode - Set the display units of the time axis
More Settings
Press Shift + Ctrl and double-click the dialog box to display additional settings for the plot
appearance, such as background color and labels.
89
OpenEx User's Guide
OpenWorkbench Preferences
This dialog box is available from the File menu.
Reset hardware on
launch
When the check box is selected, any attached System 3 hardware will be reset
whenever OpenWorkbench is launched.
Default verbose
messaging
When the check box is selected, verbose messaging is the default view for the
Messages window. When cleared, only error and mode change messages will be
displayed, by default. Verbose messaging can be turned on or off, for the current
session only, at any time from within the Messages window.
Synchronize sampling
clocks
When this preference is checked, the zBusA trigger is used to synchronize the
sampling clocks of all connected devices.
Note: Not supported by RZ Processors.
Use Legacy Tank
When this box is checked, the OpenWorkbench Data Storage Dialog will use the
Legacy tank view and right-click menu.
Enable data
monitoring
This preference enables or disables the OpenWorkbench plotting function.
Recording Options
Cache Delay (Seconds) This value relates to the size of the OpenWorkbench temporary memory buffers.
Although a higher setting requires more system RAM, it provides less susceptibility to
data storage errors.
Errors Before Idle
90
Set the number of reported errors that will cause OpenWorkbench to switch to Idle
mode. The count is restarted each time OpenWorkbench is switched to Record mode.
OpenWorkbench Reference
OpenWorkbench Menus
OpenWorkbench File Menu
Some Items on the OpenWorkbench File menu are not available when running in OpenProject.
New Configuration
Opens a new OpenWorkbench file.
Open Configuration
Opens the Open dialog box so that an existing OpenWorkbench file can
be opened.
Save Configuration
Saves the current OpenWorkbench file with the current name. If the file
has not previously been saved the Save As dialog box opens so that the
file can be named.
Save Configuration
As
Opens the Save As dialog box so that the OpenWorkbench file can be
saved with a new name.
Data Tank
Opens the Data Storage window so that a tank can be assigned for data
storage. An existing tank can be selected or a new tank can be created.
Recent File
The third section of the File menu lists recently used files. Clicking a file
name opens the file.
Preferences
Opens the Workbench Preferences dialog box.
Exit
Closes the OpenWorkbench application.
Note: To save changes to a file that is part of an OpenEx project, save the project.
OpenWorkbench Setup Menu
The Setup menu provides access to settings used to control how stimuli are presented and how
data is acquired. Default settings are suitable for the most basic experimental protocol, continuous
acquisition.
Polling and
Performance
Opens the Polling and Performance dialog, allowing users to set how
often OpenWorkbench polls devices for new data.
Triggers and Mode
Switching
Opens the Triggers and Start/Stop Timing dialog.
Sweep Loop
Opens the Sweep Loop dialog, for access to sweep loop settings.
Condition Loop
Opens the Condition Loop dialog, for access to condition loop settings.
Stimulation Timing
Opens the Stimulation Timing dialog, where users can enable
stimulation timing settings.
Acquisition Timing
Opens the Acquisition Timing dialog, where users can enable
acquisition timing settings.
91
OpenEx User's Guide
Timing and control settings are carried out through parameter tags that are included in various
circuit constructs included in the compiled circuit file (complied circuit) running on the System 3
hardware.
This approach allows the user to make adjustments to the experimental protocol without
redesigning the circuits each time a change is desired. For more information about control circuit
constructs see the Circuit Construct Reference, page 111.
Note: To save changes to a file that is part of an OpenEx project, save the project.
OpenWorkbench Device Menu
Important!: select the desired device in the Device Navigator before using the Device menu
commands.
Assign RCO
Opens a Set compiled circuit file dialog box where users can browse to a
compiled circuit file and assign the file to the selected device.
Rename
Opens the Rename Device dialog, allowing users to enter a meaningful name for
the selected device. The device name is used to identify the device in other
OpenEx clients such as OpenController.
Clear
Clears the current configuration for the selected device, effectively disabling the
device until another compiled circuit file is assigned.
Device menu settings are also available in the Device Navigator from a right-click shortcut menu.
OpenWorkbench Stores Menu
Options are available from the Stores menu to synchronize Stores, change the display of the
Storage Specification table and initialize targets. The same options are also accessed by rightclicking in the Storage Specification table.
Important!: select the desired device in the Device Navigator before using the Stores menu
commands.
Refresh Stores
Resets all Store properties for the selected device, repopulating the Storage
Specification table with information gathered from the control file. Changes made in
the Storage Specification table.
Store Synchronization Toggles Store Synchronization on or off. When Store Synchronization is off
(checked), the Stores will not be updated if changes are made to the control circuit.
Off
92
Show All Fields
Displays additional field in the Storage Specification table.
Other Options
Displays the Advance Settings dialog, allowing users to change sampling rates or
initialize parameter values.
OpenWorkbench Reference
OpenWorkbench Control Menu
The commands on the control menu allow the user to start or stop the experiment from the PC and
preview data as it is being collected.
Idle
Changes the system to Idle mode.
In Idle mode devices are not loaded and are not running.
Standby
Changes the system from Record or Preview modes to Standby mode.
In Standby mode devices are loaded and running but signals are not being
acquired and saved to disk.
Preview
Changes the system to Preview mode and displays the Plot window.
In Preview mode data is saved to a temporary block in the tank.
Run
Changes the system to Record mode and displays the Plot window.
In Run mode devices are loaded and running and data is saved to the tank.
Reset Hardware
Resets the connected System 3 hardware.
OpenWorkbench View Menu
The commands on the view menu allow the user to toggle various display options.
Device Navigator
Toggles display of Device Navigator
Control Panel
Toggles display of Control Panel
Message Window
Toggles Display of Message Window
Plot Window
Toggles Display of the Plot Window
OpenWorkbench Help Menu
The command on the help menu displays version information.
About
OpenWorkbench
Toggles display of OpenWorkbench version information
93
OpenEx User's Guide
Configuring an Experiment
Configuring a Device - Assigning a Compiled
Circuit File
The RCO circuit file area of the OpenWorkbench main window allows users to configure each
device in the system by selecting a compiled circuit file, designed for use with OpenEx or other
TDT applications. The System 3 real-time processing modules are controlled using these files,
which are compiled from circuits designed using TDT's RP visual design studio (RPvdsEx). Users
can generate their own compiled circuit files for use with OpenEx or select one of the Example
compiled circuit files provided by TDT.
RCO Circuit File Area
The RCO circuit file area is used to assign a compiled circuit file to a device.
File Name
In the RCO Circuit File area, the user can type a path and file name or browse to a compiled
circuit file. Clicking the Standard RCOs button or the Browse button opens a compiled circuit file
Select dialog box which functions much like a standard Windows Open dialog box.
Note: You can assign a compiled circuit file using a dialog box launched from the Assign RCO
command on the Device menu or by right-clicking a device and selecting Assign RCO from the
shortcut menu.
Circuit Notes
Memos that are a part of the compiled circuit file can be displayed in this area. Only memos that
begin with a greater than symbol (>) are displayed.
Important Notes about Selecting Compiled Circuit Files!
Because OpenEx relies on certain circuit constructs, or groupings of circuit components and
parameter tags, the selected compiled circuit files must have been designed for use with OpenEx.
Several Example compiled circuit files are provided so that the user can run experiments without
designing their own circuits. The user must also make sure that the compiled circuit file is
appropriate for the host device. For example, a compiled circuit file that includes a four channel
circuit design might not be appropriate for a two channel device.
94
OpenWorkbench Reference
Rename Device Dialog Box
The Rename Device Dialog Box is used to rename an existing or newly assigned device.
Device Type
WorkBench automatically detects the device type (part number) and lists it here. After you have
named the device, you can return to the Rename Device dialog to view the device type.
Device Index
Each device in your system is given an index number according to its logical position in the
system. The index number is used to differentiate between multiple devices of the same type.
Device Name
User specified text string used to identify a device in the context of an OpenEx project. This name
is used in the target selection dialog in OpenController to identify devices.
Tip
Using a standard naming scheme simplifies using OpenWorkbench and OpenController. In many
cases the same OpenController configuration file will work with several OpenWorkbench
configuration files if the user has implemented standard naming scheme.
Many of the Device Names in the OpenEx examples follow the form:
Stim: stimulus devices
Amp1, Amp2, etc.: acquisition devices
To configure a device:
1.
Select the device, by clicking its icon in the Device Navigator.
2.
Click the
3.
Browse to the desired file (either .rco or .rcx format).
4.
When you select the compiled circuit file and click Open, a Rename Device dialog box is
opened. Here you can give the device a descriptive name, such as Amp or Stim. This
dialog is also available from the Rename Device command on the Device menu.
5.
Type a device name and click OK, to complete configuration of the device.
Browse button to the right of the File Name box.
95
OpenEx User's Guide
Storage Specification
When a compiled circuit file has been assigned to a selected device, Workbench reads the
compiled circuit file and displays information about the data storage constructs in the Storage
Specification table. The user can view, disable, enable, or fetch from a list of data storage circuit
constructs found in the compiled circuit file that will run on the selected device. When the
Workbench file is saved any user defined values are saved as part of the Workbench configuration
and are used to populate the table the next time the project is loaded.
Mode
Select Store, Disable, or Fetch from a drop-down list.
By default, all Stores are set to Store and are saved to the data tank. Disable a
Store if you do not wish to view or save the corresponding data set. Fetch enables
you to view the data in OpenController but the data is not stored and will not be
available in clients, such as Scope or Explorer, that display data from the tank.
Store ID
Type a user defined four character label for the Store.
This name is associated with the corresponding data in the tank and is used by
other clients, such as Scope or Controller, when selecting data. By default, the tag
name will be used as the Store ID. The default Store ID may be adjusted to four
characters by truncation or padding with underscores (e.g. Ticker becomes Tick,
PD becomes PD__).
Tip
In many cases the same OpenScope configuration file will work with several
OpenWorkbench configuration files if the user has implemented standard naming
scheme.
The following is an example of one possible naming scheme:
96
SCAx: Scalar x(x=1,2) (Type 1, Triggered Scalar, oxScalar)
BUFF: Buffered data (Type 2, Data Buffer, oxBuffer)
SLTx: Scalar List (Type 3, Data List, oxList)
CSPK: Candidate Spike (Type 4, Signal Snippet, oxSnippet)
SSPK: Sorted Spike (Type 4, Signal Snippet, oxSnippet)
PDEC: Plot Decimated data (Type 5, Continuous Waveform, oxStream)
STRM: Streamed data (not decimated) (Type 5, Continuous Waveform,
oxStream)
OpenWorkbench Reference
In general, Store IDs should begin with alpha-characters, that is, letters a-z and AZ. Store IDs must NOT begin with any of the following characters: "-", "=", "(",
")", "<", ">", "!", a space or any number 0 to 9.
The user must ensure that Store IDs are not duplicated. If data from multiple
sources is stored using the same Store ID, data may be lost. This is also true of
stores on multiple devices.
Tag Name
Each data Store is associated with a tag name that is used in each associated
parameter tag for that data construct. This quickly identifies a group of associated
parameters that will be stored to the data tank during an experiment.
Note: a slash at the end of a tag name indicates that it has been set as either an (/)
onset or (\) offset epoch.
Store
Description
Data type and block size.
Sampling Rate
The effective sampling rate. See Setting the Sampling Rate, page 98 for more
information.
Num Channel
Number of channels of data acquired by the Store.
Additional Fields
On the Stores menu, click Show All Fields to show the following columns:
Alias
Enter the name of an existing Store followed by a channel offset value to use
that Store Name as an alias for the currently selected Store. The channel offset
value ensures data in the aliased Store(s) is not superimposed. The Store name
and offset must be separated by a comma.
For example: SNIP, 16
The designated Store will be stored in the data tank using the SNIP Store ID
beginning with channel 17.
Caution: Before assigning a Store Alias, ensure that the data type, such as
integer or float, is the same for both Stores.
See Using an Alias, page 98 for more information.
Secondary Tag
Click to enable a Secondary Tag for data storage. See Secondary Tags Dialog
Box, page 101 for more information.
Strobe Type
Select Not Strobe, ONset Strobe, or OFFset Strobe from a drop-down list.
When ONset or OFFset Strobe is selected events are automatically indexed by
TTank as they are stored creating an epoch.
ONset Strobe
Events are time stamped relative to the onset of the sweep.
OFFset Strobe Events are time stamped relative to the offset of the sweep
or condition.
See About Epoch Events, page 82 for more information.
97
OpenEx User's Guide
Buddy Epoch
Enter the name of the relevant buddy Store.
The buddy epoch only needs to be set on one of the two buddy epoch rows in
the Storage Specification table. The buddy epoch is typically created by
declaring the Offset strobe Store as the buddy epoch in the Buddy Epoch cell
in the Onset strobe Store's row.
Buddy epochs are used to create epochs that are not continuous. See About
Epoch Events, page 82 for more information.
SortCode
Displays whether or not a store is configured to assign sort codes. See Type 4:
Signal Snippets, page 323 for more information.
HandShake
Indicates whether a software trigger will be used for the handshake. See Type
1: Triggered Scalar, page 317 and Type 2: Data Buffer, page 318 for more
information.
Using an Alias
When the Store Alias name is used to call up data in client applications, such as OpenBrowser and
OpenScope, the retrieved data will include the data for the Store by that name along with the data
for any Stores for which it has been selected as the Store Alias. This allows the user to call up data
from several Stores, such as data from multiple devices used in multi-channel acquisition, and
look at it as if it were a single data Store. The Store Alias feature enables users to access multiple
Stores using a single Store name.
Caution: Before assigning a Store Alias, ensure that the data type, such as integer or float, is the
same for both Stores.
Each Store can be assigned only one Store Alias. In the Store Alias box the user can enter the
name of an existing Store followed by a channel offset number to assign the Store as an alias for
the current Store. When the Store Alias name is used to call up data in client applications, such as
OpenBrowser and OpenScope, the retrieved data will include the data for the Store by that name
along with the data for any Stores for which it has been selected as the Store Alias. This allows the
user to call up data from several Stores, such as data from multiple devices used in multi-channel
acquisition, and look at it as if it were a single data Store.
Caution: When the Store Alias option is used a channel offset must also be used. For example:
Snip, 16. If an offset is not provided, the data will be superimposed on the data in the Store Alias.
When a Store Alias has been assigned, the data for that Store will be saved in the tank as a part of
the Store Alias, and not as the original Store name. For example, if a Store named SNP1 has been
selected as the Store Alias for a Store named SNP2, the tank will only contain the SNP1 Store.
SNP2 will not appear in the tank but its data will be stored with the SNP1 Store data.
Note: Aliases are assigned when data is stored to the tank. Therefore, aliases will only appear in
applications that directly access the tank. Because OpenController accesses data from
OpenWorkbench, data from the aliased Store does not appear with the data from the Store
assigned in the Store Alias box. To view all data in OpenController use the original Store names.
Setting the Sampling Rate
The effective sample rate for each Store is displayed in the Storage Specification table when the
corresponding device is selected in the Device Navigator. Sample rates for the device may be
determined by the compiled circuit file or set by the user.
98
OpenWorkbench Reference
To display the Sampling Rate settings:
1.
Select the desired device in the Device Navigator.
2.
On the Stores menu, click Other Options.
3.
In the Advanced Setup dialog box, click the Sampling Rate Setup tab.
To use the sample rate defined in the compiled circuit file:
Ensure the Use sample rate from RCO file check box is selected. This is the default
setting.
Note: Compiled circuit files are interchangeable among devices, but not all devices will
run all sample rates. Many compiled circuit files include the sample rate in their name.
To specify a sample rate:
1.
Clear the Use sample rate from RCO file check box (not checked). A Bandwidth and
Timing area is displayed.
2.
Select a sample rate from relevant choices for the device or, if the device allows arbitrary
sample rates, enter a value in the selection box provided, then click Check Realizable.
3.
Click OK to save the new settings.
Note: The Standard Synchronization option is not implemented at this time.
99
OpenEx User's Guide
Initializing Tags - Target Initialization
In the Advance Setup dialog box the user can enter initial values for parameters controlled by
parameter tags within the circuit. This allows users to predefine parameters such as the filter
settings, frequency, or level of a stimulus. If a tag is not initialized it will take on the initial value
of the component or parameter tag.
To display the Target Initialization settings:
1.
Select the desired device in the Device Navigator.
2.
On the Stores menu, click Other Options.
3.
In the Advanced Setup dialog box, click the Target Initialization tab.
Note: Tags can also be initialized in OpenController in the Value Control Parameter Group for a
modifier control.
To add a Tag Initialization Setting:
100
1.
In the Advance Setup dialog box, click the Add button to the right of the list. The Tag
Initialization Value dialog box is displayed.
2.
Type or select a tag to initialize from the Tag Name drop down list.
OpenWorkbench Reference
Clicking the Tag Name box displays a drop down list of all the parameter tags included in
the control file assigned to the selected device.
3.
In the Value box, type an initial value for the tag.
To edit or remove an existing value, select the desired entry and click Edit or Remove.
4.
Click OK. The new setting will be added to the Target Initialization list.
Initializing a Series of Channels
A series of channels can be initialized using a single entry by using a number sign (#) in place of
the channel number. For example: to set all tags named iChan~1, iChan~2, ... to a specific value,
type iChan~# in the Tag Name box, and type the desired initial value in the value box to the right.
Incrementing Values
A plus sign (+) can be placed after the number sign (#), so that each successive assignment will
increment the assigned value by one. For example: to set tags named iChan~1, iChan~2, iChan~3,
and iChan~4 to the values 5 through 8, type iChan~#+ in the Tag Name box, and type the value 5
in the Value box to the right.
Editing or Removing a Listed Tag
After a tag has been added to the list, the user can click the tag to enable the Edit and Remove
buttons.
Edit
Opens the Tag Initialization Value dialog box.
Remove
Removes the selected tag from the list.
Secondary Tags Dialog Box
The Secondary Tags dialog box allows the user to add tags to the Store so that data from variables
that are not associated with the circuit header can be saved. These variables share the same time
stamp, are of the same data type, and have the same number of buffer points as the data identified
by the circuit header.
Secondary tags can be used with Triggered Scalar (Type 1: OxScalar), Data Buffer (Type 2:
OxBuffer), and Data List (Type 3: oxList) data constructs.
To display the Secondary Targets dialog:
1.
Select the desired device in the Device Navigator.
101
OpenEx User's Guide
2.
On the Stores menu, click Show All Fields.
3.
In the Storage Specification table, click the button in the Secondary Tag cell for a
triggered scalar, data buffer, or data list Store.
Important!: keep in mind that the secondary tag will share the same time stamp as the
selected Store and must be of the same data type.
To add a tag to the Secondary Tags list:
1.
In the Secondary Targets dialog, click the Add button to the right of the list. The
Secondary Tags dialog box is displayed.
2.
In the Tag Name box, choose, or type, a parameter tag from which secondary data is to
be acquired. Clicking the Tag Name box displays a drop down list of all the parameter
tags included in the compiled circuit file assigned to the selected device.
3.
In the Store Name box, type a four character code for the specified tag. This name will
be used to identify the data in the tank. It appears in the Events list of OpenScope and the
Stores list of the OpenController Target Select dialog box.
4.
Click OK to add the new tag name to the secondary targets list.
Editing or Removing a Listed Tag
After a tag has been added to the list, the user can click the tag to enable the Edit and Remove
buttons.
102
OpenWorkbench Reference
Edit
Opens the Secondary Data Tag dialog box
Remove
Removes the selected tag from the list
Secondary Tags decrease the circuit complexity by minimizing the number of circuit
constructs and components required. Secondary tags are updated at the same time as the primary
tags. Updating is controlled via a Latch, MultiLatch, or SerStore component.
Assigning a Data Tank
Users must choose a data tank for data storage. If a tank has not been selected, system controls are
disabled and a red colored Data Storage: Not Specified warning is displayed in the status bar,
located at the bottom of the OpenWorkbench window.
To create a new tank or assign an existing tank:
1.
Click the Data Tank command on the File menu in OpenWorkbench. The Data Storage
dialog box is displayed and any tanks that are registered on the selected server will
appear in the list.
2.
Click a tank in the list to select it, click the
new tank, or click the
3.
Create New Tank button to create a
Browse for Tank button to select an unregistered tank.
When a tank is selected, click OK to close the dialog box and assign the tank to the
current configuration. A green arrow appears to the left of the tank name when it has
been selected.
Registered Tank
Unregistered Tank
Registered Legacy Tank
Unregistered Legacy Tank
Right-clicking in the TANK box displays a shortcut menu with
commands for creating, testing, or resetting tanks.
Browse for Tank
Browse for folder
Create New Tank
Opens the Select Tank file dialog box so that a tank can be added.
103
OpenEx User's Guide
Register Tank
Adds the selected tank to the Windows Registry.
UnRegister tank
Removes the selected tank from the Windows Registry. The tank can
still be used on the local machine.
Test Tank
Tests the connection to the server and opens and closes the tank file.
Reset Tank
Resets the selected tank file. This option returns the tank file to a state in
which data can be read from or written to the tank.
Show Full Path
Toggles detail view on and off. In details view the path to the tank is
displayed.
Refresh Tank List
Refreshes the Tank box display.
Show Legacy Tanks
Displays registered legacy format tanks in the tank list.
Find Legacy Tanks
Opens the Select Tank File dialog box and allows users to browse for
tanks stored in the legacy format by showing files with a .tbk file
extension.
Block Naming
Name Prefix
The user can enter a prefix name that will be used for each block of data stored to the selected
tank. Block names consists of the prefix and a block number. For example, Block-1, Block-2...
Prompt for block name
If the user prefers to name the block when the protocol is run the Prompt for block name check
box can be selected.
Server
In the SERVER box users can select the server where data tanks can be found or created. In many
cases the server will be on the same PC that controls the hardware devices (Local).
A green arrow will
appear to the left of
the server name to
indicate that it is
selected.
Commands for
common tasks such
as adding, editing,
and removing a
server are available
from a shortcut
menu by rightclicking in the
Server box.
104
OpenWorkbench Reference
Setting Up Timing and Control Protocols
Polling Rate
These settings are available from the OpenWorkbench Setup menu.
TDT recommends using
OpenEx software with the
Gigabit interface and setting the
polling rate between 3 to 10 Hz.
When using the USB interface
the polling rate should be set to
a low value.
The Master polling rate sets how often OpenWorkbench polls devices for new data. A high polling
rate means that data is read more rapidly. However, a high polling rate decreases system
efficiency.
System 3 devices circumvent one of the main problems with Windows based control of hardware.
Windows does not give users precise control over when an event occurs. The System 3 devices
run in real-time and circuits running on each device allow users to precisely control acquisition
and presentation parameters.
To change the master polling rate: click the indicator (red dot) and drag around the arc to the
desired position. The position value is displayed in the center of the knob.
Target bus loading: Specify the percentage zBus capacity to be used for transferring data from
the zBus to the PC for data storage. The remaining capacity is reserved for other tasks, including
serving data to OpenController. The default setting is 50% and is recommended for projects that
use OpenController. If insufficient resources are available, OpenController may respond slowly or
lock up.
For projects that do not use OpenController, such as streaming data to disk, this value can be
increased to provide more resources for data storage.
Action on data overload: Specify the action taken whenever OpenWorkbench determines that the
current data saving rate is overloading the system. The default setting is None.
Suspend Plotting: All storage plots in OpenWorkbench will be suspended for the
duration of the overload.
Suspend Saving: suspends data storage to the tank for the duration of the overload.
Flush: flushes the current read and ensures that any data before the overflow is saved
correctly to the tank.
105
OpenEx User's Guide
Triggers and Mode Switching
These settings are available from the OpenWorkbench Setup menu.
Triggering and timing
circuit constructs must
be included in the
compiled circuit file that
will be used for each
device that will be
enabled in the
OpenWorkbench file.
Trigger Options
zBus triggers provide a trigger to racks that contain devices used and enabled in the
OpenWorkbench file. There are two possible triggers and users can use one or both for triggering
components. At least one trigger is required to start the experiment.
Use zTrgA
Selecting the Use zTrgA check box enables the zBusA trigger. The zBusA trigger must be present
in the compiled circuit file.
Use zTrgB
Selecting the Use zTrgB check box enables the zBusB trigger. The Use zTrgB check box must be
selected if the zTrgB Action on Done settings Under Sweep Loop will be used. The zBusB trigger
must be present in the compiled circuit file.
Standby on Stop
The Standby on Stop check box is used in conjunction with either of the Stop when Done check
boxes under Condition Loop and Sweep Loop. When the Standby on Stop check box is selected
the protocol will automatically switch to Standby mode when the last condition and/or sweep loop
is completed.
The use of the Standby on Stop check box requires that the corresponding sweep, condition, or
nested loop control construct includes end checking. The Stop when Done check boxes under
Condition Loop and Sweep Loop should never be used together.
106
OpenWorkbench Reference
Start/Stop Timing
The start/stop timing settings allow users to specify a time delay for starting the circuit, turning on
the zBusA trigger, turning off the zBusA trigger, and halting the circuit.
Delay on Start (ms)
These settings control the time delay for starting the circuit and turning on the zBusA trigger.
Circuit Run
Specifies a time (in milliseconds) to delay before running the circuit. For example, if
Circuit Run is set to 300 then, after clicking Preview or Record, OpenEx will wait 300 ms
before running the circuit.
zTrgA On
Specifies a time (in milliseconds) to delay between starting the circuit and turning on the
zBusA trigger. For example, if the Circuit Run delay is 300 ms and the zTrgA On delay
is 500 ms, then after clicking Preview or Record, OpenEx will wait 300 ms before
running the circuit, and after that another 500 ms will pass before the zBusA trigger is
turned on.
Delay on Stop (ms)
These settings control the time delay for turning off the zBusA trigger and halting the circuit.
zTrgA Off
Specifies a time (in milliseconds) to delay, after OpenEx is put into Idle or Standby
mode, before the zBusA trigger is turned off. For example, if zTrgA Off is set to 200
then, after clicking Idle or Standby, OpenEx will wait 200 ms before turning off the
zBusA trigger.
Circuit Halt
Specifies a time (in milliseconds) to delay between turning off the zBusA trigger and
halting the circuit. For example, if the zTrgA Off delay is 200 ms and the Circuit Halt
delay is 600 ms, then after clicking Idle or Standby, OpenEx will wait 200 ms before
turning off the zBusA trigger, and after that another 600 ms will pass before the circuit is
halted.
107
OpenEx User's Guide
Sweep Loop
These settings are available from the OpenWorkbench Setup menu.
The settings under Sweep Loop
can only be used if sweep control
circuit constructs are included in
the compiled circuit file specified
for each device that will use the
sweep loop.
A sweep loop controls stimulus presentation and/or acquisition. The Sweep Loop settings allow
the user to control aspects of the sweep as part of a protocol. The setting under Sweep Loop can
only be used if sweep control circuit constructs are included in the compiled circuit file specified
for each device that will use the sweep loop.
An OpenWorkbench file may have several devices and each device might be assigned a different
compiled circuit file. For example, an experiment might require stimuli to be presented at regular
intervals but acquisition to be continuous. In this case, a Protocol can be set up to generate several
sweeps for the stimulus presentation. The stimulus device would contain a stimulus timing
protocol.
The following settings are enabled when the Sweep Loop check box is selected.
Count
Defines the number of sweeps via the zSwCount parameter tag within the
compiled circuit file
Period
Defines the period of the sweep via the zSwPeriod parameter tag within the
compiled circuit file
Stop When Done
Halts the experiment when all sweeps are completed (requires end checking
construct)
If stop when done is not checked TTank will store data after the count has ended.
This box should only be disabled if the condition is nested within a sweep.
External Control of the Next Sweep
If an asynchronous next sweep control construct is included in the compiled circuit file, the period
and count can be controlled using OpenController, an external trigger, or through a custom circuit
design. Setting the Period to 0 will allow flexible control of the period. Setting the Count to -1 will
allow flexible control of the count.
Control of Sweeps Nested in Conditions
Condition loops and sweep loops can be nested to generate more complex stimulus and acquisition
control. When a sweep and a condition are used in the same protocol the condition triggers the
sweep. How triggering occurs depends on the sweep nested in condition control construct used.
108
OpenWorkbench Reference
zTrgB Action on Done
If the nested sweep with end tracking construct is used, the option selected under zTrgB Action on
Done will be applied at the end of the sweep cycle (indicated by the zSwDone parameter tag
within the compiled circuit file).
None
OpenWorkbench will not issue a zBusB trigger at the end of the sweep
cycle
Issue Trigger
OpenWorkbench will issue a zBusB trigger at the end of the sweep cycle.
Enable Button
The zTrgB button in the System Control window will be available so that
the user can control triggering of the next condition manually from the PC
If timing is critical the Enable Button option should not be used. Triggering
with an internal trigger line or a digital trigger will yield more precise
timing.
Condition Loop
These settings are available from the OpenWorkbench Setup menu.
The settings under Condition
Loop can be used only if
condition control circuit
constructs are included in the
compiled circuit file to be used
for each device that will use
the condition loop.
A condition loop controls stimulus presentation and/or acquisition. The Condition Loop settings
allow the user to control aspects of the condition as part of a protocol. The settings are enabled
when the Condition Loop check box is selected.
Count
Defines the number of sweeps via the zCdCount parameter tag within the
compiled circuit file
Period
Defines the period of the sweep via the zCdPeriod parameter tag within the
compiled circuit file
Stop When Done
Halts the experiment when all sweeps are completed (requires end checking
construct)
This box should be checked if the count is not set to -1. Otherwise data will still be
stored to the tank after the Count is stopped at zero.
External Control of the Next Condition
If an asynchronous next condition control construct is included in the compiled circuit file, the
period and count can be controlled using OpenController, an external trigger, or through a custom
circuit design. Setting the Period to 0 will allow flexible control of the period. Setting the Count to
-1 will allow flexible control of the count.
109
OpenEx User's Guide
Stimulation Timing
These settings are available from the OpenWorkbench Setup menu.
Timing controls are used to control the start and duration of acquisition, stimulus presentation, and
other actions. Different stimulus and acquisition timing controls provide independent control over
the experimental paradigm. Before setting timing controls the sweep and/or condition controls
must be enabled.
Stimulation
The settings under
Stimulation can only be
used if stimulus control
circuit constructs are
included in the compiled
circuit file to be used for
each device that will be
used to present the
stimulus.
The settings are enabled when the Stimulation check box is selected. When the settings are
disabled the stimulus will start when the sweep fire line (SwFire within the compiled circuit file)
is triggered.
Delay
Defines the length of the delay for the start of the stimulus relative to the
beginning of a condition or sweep via the zStimDelay parameter tag within the
compiled circuit File
Duration
Defines the duration of the stimulus via the zStimDur parameter tag within the
compiled circuit file
Acquisition Timing
These settings are available from the OpenWorkbench Setup menu.
Timing controls are used to control the start and duration of acquisition, stimulus presentation, and
other actions. Different stimulus and acquisition timing controls provide independent control over
the experimental paradigm. Before setting timing controls the sweep and/or condition controls
must be enabled.
Acquisition
The settings under
Acquisition can only be
used if acquisition control
circuit constructs are
included in the compiled
circuit file to be used for
each device that will be
used for acquisition.
110
OpenWorkbench Reference
The settings are enabled when the Acquisition check box is selected. When the settings are
disabled the acquisition will start when the sweep fire line (SwFire within the compiled circuit
file) is triggered.
Delay
Defines the length of the delay for the start of the acquisition relative to the
beginning of a condition or sweep via the zAqDelay parameter tag within
the compiled circuit File
Duration
Defines the duration of the acquisition via the zAqDur parameter tag
within the compiled circuit file
111
OpenEx User's Guide
~
112
OpenController Reference
In the OpenController Reference you will find:
A reference guide to the OpenController Workspace and the basics of adding and modifying
controls.
Control Types
Step-by-step guides to creating the most common control types.
Control Settings Reference
An in-depth reference covering many of the control settings available from the Property Dialog
box.
113
OpenEx User's Guide
~
114
OpenController Reference
About OpenController
OpenController is a visual interface for designing and implementing custom control sets for
OpenWorkbench experiments. During an experiment, these control sets allows users to control the
status of the OpenWorkbench protocol and access acquired data and parameter variables in realtime. The OpenEx client/server architecture makes it possible for users to develop a series of
control sets, each designed to modify or visualize a particular aspect of an experiment. For
example, users might develop one control set to be used in an exploratory fashion (to understand
the general properties of the experimental system) and a second control set to run tests that are
saved for later analysis.
OpenController includes a variety of built-in controls such as gauges, switches, and plots. These
controls can be added to a control set and customized by the user. The controls can be roughly
grouped according to OpenController's two principal tasks.
OpenController - Two Tasks
OpenController's primary task is to allow users to control experimental parameters in real-time.
Parameters, such as filter settings, threshold settings for unit activity, and stimulus presentation
variables, can be modified from customizable controls within a control set. These controls, or
modifiers, can send values to the system via OpenWorkbench and parameter tags within a
compiled circuit file running on a Device.
OpenController's secondary task is to monitor the acquired data and parameters associated with it.
Some controls read and display precise parameter values while others read and display data from
OpenWorkbench Stores. These controls, or visualization tools, acquire information through
OpenWorkbench and display it in OpenController according to the user's design.
How OpenController Works
OpenWorkbench generates a map of all the data in Stores and parameter tags of the devices in
memory. As a client of OpenWorkbench, OpenController accesses this map to modify parameter
variables and to read data for visualization. Since this map is updated in real-time (several times a
second) the data displayed in OpenController is also displayed in real-time.
When OpenController modifies a parameter tag the tag is modified in this map and then updated
on the device. OpenController acquires data from this map to access the variable information for
data visualization.
Because OpenController is not accessing the Data Tank the 2-3 second delay associated with
storing data does not occur. However, OpenController is forever in the "present" and data stored in
the "past" cannot be reviewed as it can in OpenScope.
About Visualization Tools
Visualization tools are controls that allow users to visualize information that is available within
the circuit running on a hardware device but is not necessarily stored in the data tank. For
example, filter settings, RMS level of the signal, and the processing ability of the system can be
visualized without being stored. The information from these tools can then be used to modify
stimulus parameters, filter settings, and other properties of a hardware device(s).
115
OpenEx User's Guide
Visualization controls also allow users to quickly see when other controls have been changed.
Visualization controls can receive variable values from other controls such as sliders, switch
buttons, and data tables. This allows users to quickly view the parameter changes.
OpenController includes several plots, similar to those available in Open Scope. For example, the
scope/pile plot can be used to visualize data such as spike activity and streamed or decimated data.
While OpenController plots are limited in functionality and can only be used to visualize the data
as it is acquired, the real-time nature of these plots is a distinct advantage for real-time
experimental control. OpenScope acquires data from the tank and may have a delay of up to 3
seconds between acquisition and display. In OpenController the Store information is acquired
directly from OpenWorkbench so that changes in a modifier can be viewed immediately. This
allows a better match between stimulus presentation and data acquisition.
About Modifiers
Modifiers are controls that can be used to control the properties of a circuit or other controls. Most
often modifiers are used along with visualization controls and modifications are made in response
to data visualized from one of the available plots. Modifiers can change circuit parameters that are
not part of an OpenWorkbench Store, such as filter settings, thresholds for spike detection, and
stimulus parameters. Modifiers can also change properties of other controls. For example, a
modifier can change what data channel is displayed by a visualization control.
Parameters that may be modified using controls might or might not be saved to the tank.
Parameters that are not stored in the tank, such as a threshold settings for spike detection, can be
modified in real-time. Parameter variables that are stored in the tank, such as stimulus parameters,
can be accessed through associated parameter tags. If the tags are also associated with an
OpenWorkbench Store, the stimulus parameters are modified through the control and saved
through the Store automatically.
Modifiers can also send values to other controls. For example, changing the value of a filter with a
modifier such as a slider can also pass the new value to a visualization control such as a numeric
display. This allows a user to monitor and modify the display properties of several controls and
parameters through a single control.
Understanding Targets
A target points to the location of the data being read or the location to which a value will be
written. This location might be an OpenWorkbench Store, a parameter tag within a compiled
circuit file running on a device, or another control setting. Targets are defined in the properties
dialog box for each control.
116
OpenController Reference
Types of Targets
Common Uses
Parameter Setting
Store or data buffer
Visualizing data in a plot
Data Target
Parameter tag
Visualizing data in a visualization
control
Source Target
Writing value from a modifier control
Primary Target
Reading a value from another control
Source Target
Writing a value to another control
Primary Target
Control settings
In some controls the Alternate Target parameter can be used to write a value to multiple targets
(such as parameter tags and visualization controls).
Selecting Targets
The target can be selected using the Select Target dialog box. The properties dialog box can be
displayed by double-clicking the control.
The Select Target dialog box can be opened by clicking the
button in the Source Target,
Primary Target, or Alternate Target boxes in the property settings. In the Select Target dialog box,
the user can browse through the hierarchy to find the target then click to select it. Finally, the
selected target can be entered in the property settings by clicking OK.
Using the Master Channel Parameter
The Primary Target or Alternate Target can also be the Master Channel parameter. This special
type of parameter is used to modify the Target channel parameter for a group of controls.
When used this parameter updates all controls in the same OpenController instance where the
Target Channel = -1.
117
OpenEx User's Guide
Controlling the Experimental
Protocol
OpenController allows user to directly access the protocol modes (Record, Preview, Standby and
ldle) in the OpenWorkbench System Controls. A special control called the Master Mode control
can be configured to change the protocol mode when the control set is run or stopped in
OpenController Run! mode.
The Master Mode control allows the user to tie OpenController's run and
stop states to protocol mode settings. The run state can be configured to automatically change the
protocol mode to Record, Preview, or Standby. The stop state can be configured to automatically
change the protocol mode to Standby or Idle.
Using the Master Mode control to control the experimental protocol from an OpenController
control set allows the user greater flexibility during an experiment. For example, the Stop state
could be linked to Standby mode. In Standby mode the protocol continues to run but no data is
stored to the tank. The Run state could be linked to Record mode so that when adjustments to the
control settings are complete and the control is run, recording will resume.
If multiple OpenController clients are open the OpenWorkbench protocol status can be updated
from any client or OpenWorkbench. This ensures that the most recently applied settings are
always in effect.
Master Mode Control Settings
In the Common parameters group there are drop-down menus for Mode on Run and Mode on
Stop. These settings allow the user to choose which protocol mode will be selected when the
control set is run or stopped.
Mode on Run
None: The Master Mode control does not change the status of the OpenWorkbench protocol on
run. Use this if you want another control or OpenWorkbench to determine when to record data.
Standby: The status of the OpenWorkbench protocol is set to Standby on run. In standby mode
the circuit will load and run and controls can modify and read data from parameter tags but not
from the OpenWorkbench Stores.
Preview: The status of the OpenWorkbench protocol is set to Preview on run. In Preview mode
users can visualize data from Stores; however, the Store data is not saved to the tank. Use this
mode to look at the data before running through an experimental protocol.
Record: The status of the OpenWorkbench protocol is set to Record on run. In Record mode data
is saved to the tank.
118
OpenController Reference
Mode on Stop
None: The Master Mode control does not change the status of the OpenWorkbench protocol on
stop. Use this if you want another control or OpenWorkbench to control the protocol.
Standby: The status of the OpenWorkbench protocol is set to Standby on stop. This allows the
circuit to continue running without storing data. This is useful to make sure that the proper settings
are defined before stimulus presentation or data acquisition occurs.
Idle: The status of the OpenWorkbench protocol is set to Idle on stop. This halts the processing
chain on the devices.
Note: Use caution when setting Mode on Stop to Idle. In Idle mode many values set from
OpenController are cleared from the hardware. Use Standby mode, rather than Idle, to use Stop to
pause an experiment.
Using Multiple Control Sets
Because multiple control clients can access and modify the OpenWorkbench map of the hardware
devices it is possible that two clients might attempt to access the same device parameter. This can
lead to corruption of the memory map or unreliable data. The user must make sure that only one
OpenController client at a time accesses each parameter variable. For example, two clients which
include a control with the potential to modify the same parameter might be open, but only one
would be active. Using the Master Mode Control in conjunction with window property settings for
the Run and Stop buttons give the user the ability to accomplish this.
Workspace Basics
About the OpenController Workspace
The OpenController workspace includes a main grid or display area where multiple controls can
be added and arranged into a customized control set. The OpenController workspace includes two
modes: Design mode and Run! mode. Users can toggle between modes using a Toggle Mode
button on the toolbar.
119
OpenEx User's Guide
In Design mode users can add, configure, and modify controls.
In Run! mode users can use controls for real-time monitoring and control of an ongoing
experiment.
A menu bar is available in Design mode and toolbars are also provided in both modes for easy
access to commands.
Using Design Mode
Design mode allows users to add and customize groups of controls that will function together in a
single OpenController configuration file. A menu bar, toolbar, and shortcut menus are available
for easy access to commands.
120
OpenController Reference
In Design mode the main window is a grid area where controls can be added, sized, and organized
to create a control set. Controls can be added from the Control menu.
Once added, controls can be manipulated similarly to many Windows objects. Users can drag a
control to move it or drag a control's border to resize it.
Using Properties Dialog Boxes
The appearance and behavior of each control can be modified using the properties dialog box. The
properties dialog box contains all of the customizable settings for a selected control.
To open the properties dialog box for a control, double-click the control in the grid area of
OpenController's Design mode.
121
OpenEx User's Guide
While all properties dialog boxes look and behave in a similar fashion, the settings available
depend upon the control being modified.
Control settings are grouped into parameter groups. The properties dialog box opens with the most
commonly used settings for the selected control displayed. To display the settings available in
another group, click the Parameter Group value box at the top of the dialog box and select the
group from the list.
Target Settings
When settings, such as Source Target, must be set using the name of a target a Lookup button
is located to the right of the value box. Clicking the Lookup button opens the Select Target dialog
box.
122
OpenController Reference
In the Select Target dialog box, a list of available targets in the current OpenWorkbench
experiment is displayed.
Using the Select Target Dialog Box
Possible targets are displayed in an expandable hierarchy. Potential targets are grouped into the
four types: devices, stores, controls and master parameters. Each level of the hierarchy can be
collapsed or expanded by clicking the expand (+) or collapse (-) symbol to the left of the level.
Devices
Under devices, possible targets are grouped by device and are further divided into scalars or
buffers. The data type of a target is indicated by the color of the target's icon. The user must
select a target of an appropriate type for the data that will be read. Target names for targets
found under a Device in the hierarchy include the device name (much like a path to the target). If
devices are named sequentially (such as: Amp1, Amp2, Amp3) users can select the same target
across multiple devices by modifying the target name to replace the number found in the last
position of a device name with an asterisk (*) (such as: Amp*.HPfreq).
Scalars
float
Blue
integer
Teal
logic (i.e. 0,1)
Green
123
OpenEx User's Guide
Buffers
data
pink
coefficients
purple
Channel Number
Scalars and buffers that are followed by a tilde (~) include multiple channels. The user can expand
them to show and select the channels. Users can select the multi-channel target (such as sEA~)
rather than a single channel in some cases (such as using multi-view plots).
Note: coefficients are typically used in spike sorting and filter coefficients.
Stores
The Store type corresponds to the data construct type and is indicated by it's icon.
Scalar
Type 1: Triggered Scalar
Buffer
Type 2: Data Buffer
List
Type 3: Data List
Snippet
Type 4: Signal Snippets
Stream
Type 5: Continuous Waveform
Controls
Under controls the possible targets are grouped first by control name , then by the setting group
. Control names correspond to the value in the My Name setting and the groups correspond to
the parameter groups in the property setting dialog box for that control. The value type for a
setting is indicated by its icon. The user must select a target of an appropriate type for the
data that will be read.
whole number
integer number
check box
Color
drop down list
124
OpenController Reference
Master Parameters
Under Master Parameters there are three standard targets: master channel, master sort code, and
master device. These targets allow the user to update key groups of parameter tags with a single
control.
master channel
Note: updates all controls in the same OpenController
instance where the Target Channel = -1. Appears as
@Channel in the target parameter in the parameters
dialog box.
master sort code
Not Implemented
master device
Not Implemented
Using Run! Mode
Run! mode initializes the control client application (OpenController) and allows it to access the
memory map of the hardware generated in OpenWorkbench. Because several control sets can be
open at a time, it is important to ensure that only one or two are accessing the OpenWorkbench
memory map. When multiple OpenController windows modify the same parameters, such as
stimulus frequencies, the OpenWorkbench memory map can become corrupted. For each
parameter tag only one modifier control should be active and running.
Note: this does not apply to visualization controls.
In Run! mode the control set can have several states. Understanding and using these states
correctly can help the user avoid memory map corruption.
Running and active:
By default, controls are loaded and active when the user places OpenController in Run! mode. The
state of the OpenController configuration can then be controlled using the Run and Stop buttons
on the toolbar. When the controls are running and active the frames around each control's borders
are gray.
Control set is running and
OpenWorkbench protocol is running.
When the OpenWorkbench protocol is in Standby mode, the controls will appear to be running
and active (gray borders) but data is not read and updated. This may result in blank plot screens in
the running and active state.
125
OpenEx User's Guide
Running with one or more controls inactive:
When the corresponding OpenWorkbench file is not open or its status is idle, the targets will not
be found and a yellow border appears around the control. In the following example, the target for
the SSPK plot can not be found because the OpenWorkbench protocol is set to Idle.
Control set is running and
OpenWorkbench protocol is at Idle.
The yellow border might also indicate that the wrong OpenWorkbench file is opened or that a
target was identified incorrectly in the control's property settings.
Stopped but active:
An active device can modify the OpenWorkbench memory map but does not acquire data from the
memory map. If the controls are modified this will modify whatever parameter tag or control
property they are linked to. However, the visualization tools are halted. The example below shows
this state.
Control set is stopped but active and
OpenWorkbench protocol is at Idle.
Stopped and locked:
In the stopped and locked state the controls are inactive. A hatched line is placed through the
controls. In this case the controls can not modify any other devices. To set up a control so that it
locks when stopped go double-click on the grid and select the Behavior parameter group in the
properties dialog box, then select Lock on Stop.
126
OpenController Reference
Control set is stopped and locked,
OpenWorkbench protocol is at Record.
Run! Mode allows users to save and load control parameter settings (such as slider switch settings)
dynamically.
Saves the current control parameter settings to the control file.
Loads the last saved control parameter settings to the control file.
Control Types
Control Types and the Controls Menu
Controls can be added from the Controls menu and are logically grouped on this menu. The
controls below are organized using the Controls menu groupings.
Group
Control Type
Numeric Displays
Value Watch
7 Segment Display
Gauges
Linear Gauge
Logarithmic Gauge
Status Indicators
Led Indicator
Led Caption
Value Input
Input Box
Switches
Switch Button
Slide Switch
Sliders/Knobs
Knob
Slider
127
OpenEx User's Guide
Plots/Graphs
Scope/Pile Plot
Chart Plot
Scrolling Plot
Feature Plot
Tables/Scripting
Data Table
VBScript
Miscellaneous
Graphic Frame
Advanced Controls
Master Mode Control
SigGen Engine
Biquad Coefficient Generator
Snippet Sort Control
Scrolling Threshold Control
Visualization Tools
About Gauges
A gauge displays real-time changes to a variable. Gauges provide an excellent way to determine if
parameter properties are within the experimental bounds. For example, a gauge could show spike
activity (spikes per second), RMS (root mean square) noise on a channel, or the calibrated
intensity of a stimulus. The advantage of using a gauge rather than a digital display is that the
gauge can be color coded to indicate when the parameter is within a reasonable zone. During an
experiment the precise value may be less important than whether it is below or above a certain
value.
In this example, the control is configured to show the RMS
(Root Mean Square) noise of the acquisition channel along with
color coding to indicate when the RMS level has become too
high. Green indicates good, yellow indicates caution or watch,
and red indicates that the noise level is too high.
Linear Gauge
Before using a gauge the user should determine what variable is to be measured. This variable
must either be a Store or have a parameter tag associated with it.
OpenController includes both linear and logarithmic gauges. The user should select the
appropriate gauge depending on the type of data to be visualized. Both types of gauges are created
in a similar way.
128
OpenController Reference
Creating a Linear Gauge
To quickly create a linear gauge:
1.
Click the Controls menu, point to Gauges, and click Linear Gauge.
The pointer changes to indicate that the control can be added.
2.
Click the grid to position the upper-left corner of the control.
The control is added to the grid area.
3.
Double-click the control to display the properties dialog box.
The dialog box opens with the most commonly changed settings displayed. Related
settings are grouped together by color. Other settings are available by clicking the
Parameter Group box and selecting a settings group.
Settings groups include:
Common - pg. 203
Target(s) - pg. 217
Caption/Border - pg. 187
Polling - pg. 213
Value Control - pg. 218
Layout - pg. 212
Scale - pg. 214
Pointer - pg. 190
Sections - pg. 191
4.
If needed, type the server name and path in the Server Name box.
If the data is being stored on the same computer where OpenController in running, the
default setting is fine. The server name can be found in the Data Tank/Data Storage
dialog box in OpenWorkbench.
button in the Source Target box, to display the Select Target dialog box.
5.
Click the
6.
Using the Select Target dialog browse for and select a target.
7.
If the source target is a Store with multiple channels, enter the channel number in the
Target Channel box.
8.
In the Scale Minimum box, enter the minimum value for gauge values that will be
displayed.
9.
In the Scale Maximum box, enter the maximum value for gauge values that will be
displayed.
10. Click OK.
A basic linear gauge is created. Before running the control the corresponding OpenWorkbench file
must be open and a protocol should be running. To run the control, click Run! on the menu bar.
129
OpenEx User's Guide
Creating a Logarithmic Gauge
To quickly create a logarithmic gauge:
1.
Click the Controls menu, point to Gauges, and click Logarithmic Gauge.
The pointer changes to indicate that the control can be added.
2.
Click the grid to position the upper-left corner of the control.
The control is added to the grid area.
3.
Double-click the control to display the properties dialog box.
The dialog box opens with the most commonly changed settings displayed. Related
settings are grouped together by color. Other settings are available by clicking the
Parameter Group box and selecting a settings group.
Settings groups include:
Common - pg. 204
Target(s) - pg. 217
Caption/Border - pg. 187
Polling - pg. 213
Value Control - pg. 218
Layout - pg. 212
Scale - pg. 214
Pointer - pg. 190
Sections - pg. 191
4.
If needed, type the server name and path in the Server Name box.
If the data is being stored on the same computer where OpenController in running, the
default setting is fine. The server name can be found in the Data Tank/Data Storage
dialog box in OpenWorkbench.
button in the Source Target box, to display the Select Target dialog box.
5.
Click the
6.
Using the Select Target dialog browse for and select a target.
7.
If the source target is a Store with multiple channels, enter the channel number in the
Target Channel box.
8.
In the Scale Minimum box, enter the minimum value for gauge values that will be
displayed.
9.
In the Scale Maximum box, enter the maximum value for gauge values that will be
displayed.
10. Click OK.
A basic logarithmic gauge is created. Before running the control the corresponding
OpenWorkbench file must be open and a protocol should be running. To run the control, click
Run! on the menu bar.
130
OpenController Reference
About Numeric Displays
Numeric displays show a precise variable value. A common use of a display would be to show the
filter settings of the signal input, the exact threshold setting for a discriminator, or the sweep
number of the stimulus.
Before using a numeric display the user should determine what variable is to be measured. This
variable must either be an OpenWorkbench Store or have a parameter tag associated with it.
There are two types of numeric displays, the Value Watch and the 7 Segment Display.
7 Segment Display
Value Watch
Both displays work similarly and vary mostly in appearance. The 7 Segment Display is styled to
appear similar to a typical LCD numeric display. There are also two small but perhaps more
significant differences. The Value Watch allows unit text to be added to the display by the user.
The 7 segment display allows the display of a positive or negative sign.
Creating a 7 Segment Display
To quickly create a 7 segment display:
1.
Click the Controls menu, point to Numeric Displays, and click 7 Segment Display.
The pointer changes to indicate that the control can be added.
2.
Click the grid to position the upper-left corner of the control.
The control is added to the grid area.
3.
Double-click the control to display the properties dialog box.
The dialog box opens with the most commonly changed settings displayed. Related
settings are grouped together by color. Other settings are available by clicking the
Parameter Group box and selecting a settings group.
Settings groups include:
Common - pg. 197
Target(s) - pg. 217
Caption/Border - pg. 187
Polling - pg. 213
Value Control - pg. 218
Appearance - pg. 192
Layout - pg. 211
4.
If needed, type the server name and path in the Server Name box.
131
OpenEx User's Guide
If the data is being stored on the same computer where OpenController in running, the
default setting is fine. The server name can be found in the Data Tank/Data Storage
dialog box in OpenWorkbench.
button in the Source Target box, to display the Select Target dialog box.
5.
Click the
6.
Using the Select Target dialog browse for and select a target.
7.
If the source target is a Store with multiple channels, enter the channel number in the
Target Channel box.
8.
Enter the number of digits to be displayed in the Number Digits box.
By default, the leading unused digits will be displayed as spaces. The total number of
digits should be sufficient to display the desired precision.
9.
Enter the number of digits to be displayed after the decimal point in the Precision box.
10. Click OK.
A basic 7 segment display is created. Before running the control the corresponding
OpenWorkbench file must be open and a protocol should be running. To run the control, click
Run! on the menu bar.
Creating a Value Watch
To quickly create a value watch:
1.
Click the Controls menu, point to Numeric Displays, and click Value Watch.
The pointer changes to indicate that the control can be added.
2.
Click the grid to position the upper-left corner of the control.
The control is added to the grid area.
3.
Double-click the control to display the properties dialog box.
The dialog box opens with the most commonly changed settings displayed. Related
settings are grouped together by color. Other settings are available by clicking the
Parameter Group box and selecting a settings group.
Settings groups include:
Common - pg. 210
Target(s) - pg. 217
Caption/Border - pg. 187
Polling - pg. 213
Value Control - pg. 218
Appearance - pg. 194
4.
If needed, type the server name and path in the Server Name box.
If the data is being stored on the same computer where OpenController in running, the
default setting is fine. The server name can be found in the Data Tank/Data Storage
dialog box in OpenWorkbench.
132
OpenController Reference
5.
Click the
6.
Using the Select Target dialog browse for and select a target.
7.
If the source target is a Store with multiple channels, enter the channel number in the
Target Channel box.
8.
Enter the number of digits to be displayed after the decimal point in the Precision box.
9.
Click OK.
button in the Source Target box, to display the Select Target dialog box.
A basic value watch is created. Before running the control the corresponding OpenWorkbench file
must be open and a protocol should be running. To run the control, click Run! on the menu bar.
About Status Indicators
Status indicators can be used to indicate when the level of a signal is greater than a certain value.
These indicators flash when the value change exceeds an On/Off threshold set by the user. Similar
to a gauge, the status indicator allows users to identify a potentially important issue. For example,
the indicator can be set to flash if the processing power of the system exceeds a certain level.
There are two types of indicators, the Led Indicator and the Led Caption.
Led Indicator
Led Caption
The led indicator resembles a typical round LED light with a text caption to the side. With a led
caption, the caption text is part of the flashing display.
Creating a Led Indicator
To quickly create a led indicator:
1.
Click the Controls menu, point to Status Indicators, and click Led Indicator.
The pointer changes to indicate that the control can be added.
2.
Click the grid to position the upper-left corner of the control.
The control is added to the grid area.
3.
Double-click the control to display the properties dialog box.
The dialog box opens with the most commonly changed settings displayed. Related
settings are grouped together by color. Other settings are available by clicking the
Parameter Group box and selecting a settings group.
133
OpenEx User's Guide
Settings groups include:
Common - pg. 202
Target(s) - pg. 217
Caption/Border - pg. 187
Polling - pg. 213
Value Control - pg. 218
Appearance - pg. 193
4.
If needed, type the server name and path in the Server Name box.
If the data is being stored on the same computer where OpenController in running, the
default setting is fine. The server name can be found in the Data Tank/Data Storage
dialog box in OpenWorkbench.
button in the Source Target box, to display the Select Target dialog box.
5.
Click the
6.
Using the Select Target dialog browse for and select a target.
7.
In the On/Off Threshold box, type the threshold. If the value change is greater than the
threshold, the indicator will be toggled off or on.
8.
Click OK.
A basic led indicator is created. Before running the control the corresponding OpenWorkbench file
must be open and a protocol should be running. To run the control, click Run! on the menu bar.
Creating a Led Caption
To quickly create a led caption:
1.
Click the Controls menu, point to Status Indicators, and click Led Caption.
The pointer changes to indicate that the control can be added.
2.
Click the grid to position the upper-left corner of the control.
The control is added to the grid area.
3.
Double-click the control to display the properties dialog box.
The dialog box opens with the most commonly changed settings displayed. Related
settings are grouped together by color. Other settings are available by clicking the
Parameter Group box and selecting a settings group.
134
OpenController Reference
Settings groups include:
Common - pg. 202
Target(s) - pg. 217
Caption/Border - pg. 187
Polling - pg. 213
Value Control - pg. 218
Appearance - pg. 193
4.
If needed, type the server name and path in the Server Name box.
If the data is being stored on the same computer where OpenController in running, the
default setting is fine. The server name can be found in the Data Tank/Data Storage
dialog box in OpenWorkbench.
button in the Source Target box, to display the Select Target dialog box.
5.
Click the
6.
Using the Select Target dialog browse for and select a target.
7.
In the Threshold box, type the threshold. If the value change is greater than the
threshold, the indicator will be toggled off or on.
8.
Click OK.
A basic led caption control is created. Before running the control the corresponding
OpenWorkbench file must be open and a protocol should be running. To run the control, click
Run! on the menu bar.
Plots and Graphs
About Plots and Graphs
OpenController plots and graphs are used to visualize data in real-time. Plots and graphs differ
from other controls in that the Source Target must be an OpenWorkbench Store. Plots and graphs
can be used in conjunction with controls that modify parameters so that changes in the data that
might result from modifying a parameter, such as a filter or threshold settings, can be viewed with
out delays. There are four standard types of plots and graphs available in OpenController:
Scope/Pile, Chart, Scrolling, and Feature.
Scope and Pile Plots
The Scope/Pile plot acts like a triggered oscilloscope. When an event such as a set time trigger or
epoch event occurs the waveform data is displayed in the graph. If the waveform is small (<100
points) the values can be plotted on top of each other (pile) so that a quick comparison can be
done. The user can set the depth of the pile. For very large waveforms (>100 points) setting the
pile depth to one displays a single continuous waveform.
Chart Plot
The Chart plot displays time stamped values. The data streams across the graph either
continuously or synced to an external event. The chart plot is excellent for viewing the distribution
135
OpenEx User's Guide
of time stamped events such as wave snippets, epoch events (Data Lists), or buffered signals. It
can be expanded and contracted to show a larger or smaller times.
Scrolling Plot
The Scrolling Plot is similar to a chart recorder. The waveform streams across the plot window
from left to right. This is an excellent tool for visualizing continuous signals such as EEG
waveforms or the plot decimated signals of an extracellular recording.
Feature Plot
The Feature Plot measures two signal properties of a snippet waveform and displays them as a
scatter plot. This tool is excellent for data mining of multiple unit activity. The feature plot can
display comparisons of waveform features such as total amplitude, peak amplitudes, the area
under the curve, and peak-to-peak time differences.
Creating a Pile Plot
To quickly create a single channel pile plot:
1.
Click the Controls menu, point to Plots/Graphs, and click Scope/Pile Plot.
The pointer changes to indicate that the control can be added.
2.
Click the grid to position the upper-left corner of the control.
The control is added to the grid area.
3.
Double-click the control to display the properties dialog box.
The dialog box opens with the most commonly changed settings displayed. Related
settings are grouped together by color. Other settings are available by clicking the
Parameter Group box and selecting a settings group.
Settings groups include:
Common - pg. 205
Target(s) - pg. 216
Caption/Border - pg. 187
Polling - pg. 213
Value Control - pg. 218
Data/Source Set - pg. 188
Behavior - pg. 196
Channel Selector - pg. 188
Multi View - pg. 189
Colors - pg. 188
Refresh Control - pg. 190
Scaling - pg. 190
X-Axis Setup - pg. 191
Y-Axis Setup - pg. 192
Appearance - pg. 193
Margins - pg. 189
Filtering - pg. 189
4.
If needed, type the server name and path in the Server Name box.
If the data is being stored on the same computer where OpenController is running, the
default setting is fine. The server name can be found in the Data Tank/Data Storage
dialog box in OpenWorkbench.
136
OpenController Reference
5.
Click the
6.
Using the Select Target dialog browse for and select a target.
button in the Data Target box, to display the Select Target dialog box.
The source target should be an OpenWorkbench Store. To create a pile plot the source
target should be a signal snippet.
Tip: look for this icon to identify snippets in the Select Target dialog box.
7.
Enter the desired channel in the Target Channel box.
8.
If the data includes a sort code (uses the Sort Spike component) select the By SortCode
color-coding method in the Category Coloring box.
9.
Click OK.
A basic pile plot is created. Before running the control the corresponding OpenWorkbench file
must be open and a protocol should be running. To run the control, click Run! on the menu bar.
At this point a plot of the spikes will appear and the pile plot will look something like this:
Common Modifications
Multi View
If the Store has multiple channels, select the Multi View Enabled check box then enter the number
of channels in the Num Views box. The example below enables the Multi View and selects the
number of channels (3) for visualization.
Scope Plot
The Scope/Pile Plot control can also be configured to behave as a Scope plot.
137
OpenEx User's Guide
Creating a Scope Plot
To quickly create a single channel scope plot:
1.
Click the Controls menu, point to Plots/Graphs, and click Scope/Pile Plot.
The pointer changes to indicate that the control can be added.
2.
Click the grid to position the upper-left corner of the control.
The control is added to the grid area.
3.
Double-click the control to display the properties dialog box.
The dialog box opens with the most commonly changed settings displayed. Related
settings are grouped together by color. Other settings are available by clicking the
Parameter Group box and selecting a settings group.
Settings groups include:
Common - pg. 205
Target(s) - pg. 216
Caption/Border - pg. 187
Polling - pg. 213
Value Control - pg. 218
Data/Source Set - pg. 188
Behavior - pg. 196
Channel Selector - pg. 188
Multi View - pg. 189
Colors - pg. 188
Refresh Control - pg. 190
Scaling - pg. 190
X-Axis Setup - pg. 191
Y-Axis Setup - pg. 192
Appearance - pg. 193
Margins - pg. 189
Filtering - pg. 189
4.
If needed, type the server name and path in the Server Name box.
If the data is being stored on the same computer where OpenController is running, the
default setting is fine. The server name can be found in the Data Tank/Data Storage
dialog box in OpenWorkbench.
button in the Data Target box, to display the Select Target dialog box.
5.
Click the
6.
Using the Select Target dialog browse for and select a target.
The source target should be an OpenWorkbench Store. To create a scope plot a
continuous data type should be selected.
Tip: look for this icon to identify continuous waveform in the Select Target
dialog box.
7.
Enter the desired channel in the Target Channel box.
8.
Set the Pile Depth to 1. This will cause the screen to update on each block.
9.
Click OK.
A basic scope plot is created. Before running the control the corresponding OpenWorkbench file
must be open and a protocol should be running. To run the control, click Run! on the menu bar.
138
OpenController Reference
At this point the plot will look something like this:
The plot length or number of points is set in the compiled circuit file by the data construct.
Changing the amount of data viewed requires changing the block size in the oxStream component.
Creating a Chart Plot
To quickly create a single chart plot:
1.
Click the Controls menu, point to Plots/Graphs, and click Chart Plot.
The pointer changes to indicate that the control can be added.
2.
Click the grid to position the upper-left corner of the control.
The control is added to the grid area.
3.
Double-click the control to display the properties dialog box.
The dialog box opens with the most commonly changed settings displayed. Related
settings are grouped together by color. Other settings are available by clicking the
Parameter Group box and selecting a settings group.
Settings groups include:
Common - pg. 198
Target(s) - pg. 216
Caption/Border - pg. 187
Polling - pg. 213
Value Control - pg. 218
Data/Source Set - pg. 188
Behavior - pg. 194
Channel Selector - pg. 188
Multi View - pg. 189
Colors - pg. 188
Refresh Control - pg. 190
Scaling - pg. 190
X-Axis Setup - pg. 191
Y-Axis Setup - pg. 192
Appearance - pg. 193
Margins - pg. 189
4.
If needed, type the server name and path in the Server Name box.
If the data is being stored on the same computer where OpenController is running, the
default setting is fine. The server name can be found in the Data Tank/Data Storage
dialog box in OpenWorkbench.
139
OpenEx User's Guide
5.
Click the
6.
Using the Select Target dialog browse for and select a target.
button in the Source Target box, to display the Select Target dialog box.
The source target should be an OpenWorkbench Store. Chart plots are often used to view
snippets.
Tip: look for this icon to identify snippets in the Select Target dialog box.
7.
If the source target is a Store with multiple channels, enter the channel number in the
Target Channel box.
8.
Click OK.
A basic chart plot is created. Before running the control, the corresponding OpenWorkbench file
must be open and a protocol should be running. To run the control, click Run! on the menu bar.
Creating a Scrolling Plot
To quickly create a scrolling channel plot:
1.
Click the Controls menu, point to Plots/Graphs, and click Scrolling Plot.
The pointer changes to indicate that the control can be added.
2.
Click the grid to position the upper-left corner of the control.
The control is added to the grid area.
3.
Double-click the control to display the properties dialog box.
The dialog box opens with the most commonly changed settings displayed. Related
settings are grouped together by color. Other settings are available by clicking the
Parameter Group box and selecting a settings group.
Settings groups include:
Common - pg. 206
Target(s) - pg. 216
Caption/Border - pg. 187
Polling - pg. 213
Value Control - pg. 218
Data/Source Set - pg. 188
Behavior - pg. 196
Channel Selector - pg. 188
Multi View - pg. 189
Refresh Control - pg. 190
Scaling - pg. 190
X-Axis Setup - pg. 191
Y-Axis Setup - pg. 192
Appearance - pg. 193
Margins - pg. 189
4.
If needed, type the server name and path in the Server Name box.
If the data is being stored on the same computer where OpenController is running, the
default setting is fine. The server name can be found in the Data Tank/Data Storage
dialog box in OpenWorkbench.
140
OpenController Reference
5.
Click the
6.
Using the Select Target dialog browse for and select a target.
button in the Data Target box, to display the Select Target dialog box.
The source target should be an OpenWorkbench Store. Scrolling plots are most
commonly used with continuous waveforms.
Tip: look for this icon to identify continuous waveform in the Select Target
dialog box.
7.
Enter the desired channel in the Target Channel box.
8.
Click OK.
A scrolling plot is created. Before running the control, the corresponding OpenWorkbench file
must be open and a protocol should be running. To run the control, click Run! on the menu bar.
Creating a Feature Plot
A feature plot is used to display two waveform properties and is an excellent tool for separating
waveforms. Waveforms that are different will be in separate parts of the feature space. Feature
space plots use snippet Stores (Type 4, Signal Snippet) or possibly buffer Stores (Type 2, Data
Buffer) to display differences.
The data Store should contain less than 100 samples per waveform. Waveforms that are too large
will increase the processing time and slow down the system.
1.
Click the Controls menu, point to Plots/Graphs, and click Feature Plot.
The pointer changes to indicate that the control can be added.
2.
Click the grid to position the upper-left corner of the control.
The control is added to the grid area.
3.
Double-click the control to display the properties dialog box.
The dialog box opens with the most commonly changed settings displayed. Related
settings are grouped together by color. Other settings are available by clicking the
Parameter Group box and selecting a settings group.
141
OpenEx User's Guide
Settings groups include:
Common - pg. 200
Target(s) - pg. 216
Caption/Border - pg. 187
Polling - pg. 213
Value Control - pg. 218
Data/Source Set - pg. 188
Behavior - pg. 195
Channel Selector - pg. 188
Multi View - pg. 189
Colors - pg. 188
Refresh Control - pg. 190
Scaling - pg. 190
X-Axis Setup - pg. 191
Y-Axis Setup - pg. 192
Appearance - pg. 193
Margins - pg. 189
Filtering - pg. 189
4.
If needed, type the server name and path in the Server Name box.
If the data is being stored on the same computer where OpenController is running, the
default setting is fine. The server name can be found in the Data Tank/Data Storage
dialog box in OpenWorkbench.
button in the Source Target box, to display the Select Target dialog box.
5.
Click the
6.
Using the Select Target dialog browse for and select a target.
The source target should be an OpenWorkbench Store.
7.
Enter the desired channel in the Target Channel box.
8.
Set the Cloud Points to 100. This will cause the screen to display the 100 most recent
points.
9.
Set the X-axis feature (Total Amplitude, Peak 1, Peak 2, Peak to Peak Time, or Area)
10. Set the Y-axis feature (Total Amplitude, Peak 1, Peak 2, Peak to Peak Time, or Area)
11. Select the Category Coloring, either by SortCode or by Channel.
12. Click OK.
A feature plot is created. Before running the control, the corresponding OpenWorkbench file must
be open and a protocol should be running. To run the control, click Run! on the menu bar.
In the example below a sort spike plot generates sort codes based on a time-amplitude windows.
The feature space of the two plots based on peak 1 and peak 2 is displayed on the feature plot on
the right.
142
OpenController Reference
Modifiers
About Value Inputs
Value inputs are used to modify a variable. In the input box, users input the variable and press the
send arrow to change the value of a parameter tag. Value inputs can be used to set filter values, a
single frequency or intensity value that will change, or a number such as the number of sweeps
between stimuli.
Input Box
Creating an Input Box
To quickly create an input box:
1.
Click the Controls menu, point to Value Input, and click Input Box.
The pointer changes to indicate that the control can be added.
2.
Click the grid to position the upper-left corner of the control.
The control is added to the grid area.
3.
Double-click the control to display the properties dialog box.
The dialog box opens with the most commonly changed settings displayed. Related
settings are grouped together by color. Other settings are available by clicking the
Parameter Group box and selecting a settings group.
143
OpenEx User's Guide
Settings groups include:
Common - pg. 200
Target(s) - pg. 216
Caption/Border - pg. 187
Polling - pg. 213
Value Control - pg. 218
Appearance - pg. 192
Behavior - pg. 195
4.
If needed, type the server name and path in the Server Name box.
If the data is being stored on the same computer where OpenController in running, the
default setting is fine. The server name can be found in the Data Tank/Data Storage
dialog box in OpenWorkbench.
button in the Primary Target box, to display the Select Target dialog box.
5.
Click the
6.
Using the Select Target dialog browse for and select a target.
7.
Click OK.
A basic value input is created. Before running the control the corresponding OpenWorkbench file
must be open and a protocol should be running. To run the control, click Run! on the menu bar.
About Switches
Switches are used to toggle a variable between user specified values. There are three types of
switches, the Switch Slider, the Switch Button and the Momentary Button. Users click a button or
drag a slider to toggle the value sent to a parameter tag.
The Switch button and Momentary button have two values while the slider button can have
multiple values. Clicking a Switch button toggles between the two values. Clicking a Momentary
button turns the control on for a user specified length of time.
Slide Switch
144
Switch/Momentary Button
OpenController Reference
Creating a Switch Button
To quickly create a switch button:
1.
Click the Controls menu, point to Switches, and click Switch Button.
The pointer changes to indicate that the control can be added.
2.
Click the grid to position the upper-left corner of the control.
The control is added to the grid area.
3.
Double-click the control to display the properties dialog box.
The dialog box opens with the most commonly changed settings displayed. Related
settings are grouped together by color. Other settings are available by clicking the
Parameter Group box and selecting a settings group.
Settings groups include:
Common - pg. 210
Target(s) - pg. 216
Caption/Border - pg. 187
Polling - pg. 213
Value Control - pg. 218
Appearance - pg. 194
Behavior - pg. 197
4.
If needed, type the server name and path in the Server Name box.
If the data is being stored on the same computer where OpenController in running, the
default setting is fine. The server name can be found in the Data Tank/Data Storage
dialog box in OpenWorkbench.
button in the Primary Target box, to display the Select Target dialog box.
5.
Click the
6.
Using the Select Target dialog browse for and select a target.
7.
In the Button Text box, type text to be displayed on the button.
8.
In the Value when On box, specify a value for when the switch is on.
9.
In the Value when Off box, specify a value for when the switch is off.
10. Click OK.
A basic switch button is created. Before running the control the corresponding OpenWorkbench
file must be open and a protocol should be running. To run the control, click Run! on the menu
bar.
145
OpenEx User's Guide
Creating a Momentary Button
To quickly create a momentary button:
1.
Click the Controls menu, point to Switches, and click Momentary Button.
The pointer changes to indicate that the control can be added.
2.
Click the grid to position the upper-left corner of the control.
The control is added to the grid area.
3.
Double-click the control to display the properties dialog box.
The dialog box opens with the most commonly changed settings displayed. Related
settings are grouped together by color. Other settings are available by clicking the
Parameter Group box and selecting a settings group.
Settings groups include:
Common - pg. 205
Target(s) - pg. 216
Caption/Border - pg. 187
Polling - pg. 213
Value Control - pg. 218
Appearance - pg. 194
Behavior - pg. 196
4.
If needed, type the server name and path in the Server Name box.
If the data is being stored on the same computer where OpenController in running, the
default setting is fine. The server name can be found in the Data Tank/Data Storage
dialog box in OpenWorkbench.
button in the Primary Target box, to display the Select Target dialog box.
5.
Click the
6.
Using the Select Target dialog browse for and select a target.
7.
In the Button Text box, type text to be displayed on the button.
8.
In the Value when On box, specify a value for when the button is on.
9.
In the Value when Off box, specify a value for when the button is off.
10. Click OK.
A momentary switch button is created. Before running the control the corresponding
OpenWorkbench file must be open and a protocol should be running. To run the control, click
Run! on the menu bar.
146
OpenController Reference
Creating a Slide Switch
To quickly create a Slide Switch:
1.
Click the Controls menu, point to Switches, and click Slide Switch.
The pointer changes to indicate that the control can be added.
2.
Click the grid to position the upper-left corner of the control.
The control is added to the grid area.
3.
Double-click the control to display the properties dialog box.
The dialog box opens with the most commonly changed settings displayed. Related
settings are grouped together by color. Other settings are available by clicking the
Parameter Group box and selecting a settings group.
Settings groups include:
Common - pg. 208
Target(s) - pg. 216
Caption/Border - pg. 187
Polling - pg. 213
Value Control - pg. 218
Appearance - pg. 193
Layout - pg. 212
Switch Position - pg. 191
4.
If needed, type the server name and path in the Server Name box.
If the data is being stored on the same computer where OpenController in running, the
default setting is fine. The server name can be found in the Data Tank/Data Storage
dialog box in OpenWorkbench.
5.
Click the Primary Target box, to display the Select Target dialog box.
6.
Using the Select Target dialog browse for and select a target.
7.
Enter the desired values in the Position Labels box.
Labels are separated by a comma and are used as points for selecting labels.
8.
Enter the desired values in the Position Values box.
Values are separated by a comma and are used as points for selecting values.
9.
Click OK.
A basic slide switch is created. Before running the control the corresponding OpenWorkbench file
must be open and a protocol should be running. To run the control, click Run! on the menu bar.
147
OpenEx User's Guide
About Sliders and Knobs
Sliders and knobs are used to modify a variable. Users input the variable valuable by dragging a
slider or turning a knob. This allows the user to select a value from a range of values and to
determine the desired value by making small adjustments. Sliders and knobs can be used to set
values such as frequencies or intensities. Sliders and knobs vary primarily in appearance.
Slider
Knob
Creating a Slider
To quickly create a slider:
1.
Click the Controls menu, point to Sliders/Knobs, and click Slider.
The pointer changes to indicate that the control can be added.
2.
Click the grid to position the upper-left corner of the control.
The control is added to the grid area.
3.
Double-click the control to display the properties dialog box.
The dialog box opens with the most commonly changed settings displayed. Related
settings are grouped together by color. Other settings are available by clicking the
Parameter Group box and selecting a settings group.
148
OpenController Reference
Settings groups include:
Common - pg. 207
Target(s) - pg. 216
Caption/Border - pg. 187
Polling - pg. 213
Value Control - pg. 218
Appearance - pg. 193
Scale - pg. 215
Behavior - pg. 197
4.
If needed, type the server name and path in the Server Name box.
If the data is being stored on the same computer where OpenController in running, the
default setting is fine. The server name can be found in the Data Tank/Data Storage
dialog box in OpenWorkbench.
button in the Primary Target box, to display the Select Target dialog box.
5.
Click the
6.
Using the Select Target dialog browse for and select a target.
7.
In the Position Max box, enter the maximum value to be displayed for the slider.
8.
In the Position Min box, enter the minimum value to be displayed for the slider.
9.
Specify the desired step in the Tick Precision box
10. Click OK.
A basic slider is created. Before running the control the corresponding OpenWorkbench file must
be open and a protocol should be running. To run the control, click Run! on the menu bar.
Creating a Knob
To quickly create a knob:
1.
Click the Controls menu, point to Sliders/Knobs, and click Knob.
The pointer changes to indicate that the control can be added.
2.
Click the grid to position the upper-left corner of the control.
The control is added to the grid area.
3.
Double-click the control to display the properties dialog box.
The dialog box opens with the most commonly changed settings displayed. Related
settings are grouped together by color. Other settings are available by clicking the
Parameter Group box and selecting a settings group.
149
OpenEx User's Guide
Settings groups include:
Common - pg. 201
Target(s) - pg. 216
Caption/Border - pg. 187
Polling - pg. 213
Value Control - pg. 218
Appearance - pg. 192
Layout - pg. 212
Scale - pg. 190
4.
If needed, type the server name and path in the Server Name box.
If the data is being stored on the same computer where OpenController in running, the
default setting is fine. The server name can be found in the Data Tank/Data Storage
dialog box in OpenWorkbench.
button in the Primary Target box, to display the Select Target dialog box.
5.
Click the
6.
Using the Select Target dialog browse for and select a target.
7.
In the Scale Minimum box, enter the minimum value for the knob.
8.
In the Scale Maximum box, enter the maximum value for the knob.
9.
Specify the desired precision in the Label Precision box.
10. Click OK.
A basic knob is created. Before running the control the corresponding OpenWorkbench file must
be open and a protocol should be running. To run the control, click Run! on the menu bar.
Spike Discrimination and Sorting
About Spike Discrimination and Sorting
With OpenController, users can automatically set spike discrimination thresholds and sort spikes
in real-time. The automated features of the Snippet Sort controls allow users to quickly assess unit
activity across multiple channels without resorting to a tedious process of manually setting the
threshold and then sorting spikes for each channel on a high channel count system. Once the
system has set the threshold and done spike sorting, users can assess the quality of the process and
manually modify the threshold and sort windows.
The Scrolling Threshold control implements control of the threshold level for discriminations and
Snippet Sort implements time-voltage window sorting.
150
OpenController Reference
Creating a Scrolling Threshold Control
To quickly create a scrolling threshold control:
Note: Before creating the control, start OpenWorkbench and open a configuration file
which includes a Store for spike sorting. The Scrolling Threshold control can only be
used if a component such as SortSpike2 is included in the data generating construct. (See
Type4: Signal Snippets, page 323 or Signal Snippets with Spike Sorting, page 325 for
more information.) If SortSpike or FindSpike are used, only the low threshold is
controlled using the Scrolling Threshold Control. The high threshold for SortSpike can be
controlled in the Snippet Sort Control. For more information see Implementing Artifact
Rejection through OpenController, page 161.
1.
Click the Controls menu, point to Advance Controls, and click Scrolling Threshold
Counter.
The pointer changes to indicate that the control can be added.
2.
Click the grid to position the upper-left corner of the control.
The control is added to the grid area.
3.
Double-click the control to display the properties dialog box.
The dialog box opens with the most commonly changed settings displayed. Related
settings are grouped together by color. Other settings are available by clicking the
Parameter Group box and selecting a settings group.
Settings groups include:
Common - pg. 206
Target(s) - pg. 216
Caption/Border - pg. 187
Polling - pg. 213
Value Control - pg. 218
Data/Source Select - pg. 188
Behavior - pg. 196
Channel Selector - pg. 188
Refresh Control - pg. 190
Scaling - pg. 190
X-Axis Setup - pg. 191
Y-Axis Setup - pg. 192
Appearance - pg. 193
Margins - pg. 189
Colors - pg. 188
4.
Select a valid target for the control and make any other property setting changes as
needed.
To select the target:
in the Data Target box. The Select Target dialog box
1.
Click the look-up button
opens.
2.
In the target hierarchy, expand the Stores tree and select the correct Store name
(such as a snippet Store or a plot decimated Store).
151
OpenEx User's Guide
To select the Threshold Target:
in the Threshold Target box. The Select Target
1.
Click the look-up button
dialog box opens.
2.
In the target hierarchy, expand the Devices tree and select the correct Device name
(that is, the Device running a circuit which includes the signal snippet with spike
sorting data construct).
3.
Expand the Scalars tree and select the parameter tag that will serve as the target for
the threshold. To set the target for all channels select the tag without the channel
number (for example: aEa~). To set the tag for only one channel, expand the
hierarchy to display the available channels and select the tag for the desired channel
(for example: aEA~1).
Note: To set the parameter for multiple devices running the same circuit, modify the
target name by removing the device component (for example: aEa~ NOT
Amp1.aEa~)
5.
Click OK.
Note: If the stream is stored with a different resolution than 32-bit, it will usually be scaled. Be
sure to set the Threshold Scaling Factor (located in Setup Properties, Parameter Group Behavior)
to the inverse of the scale factor used by the component performing the data compression.
For example, if the scale factor (SF) of a PlotDec16 component is set to 1e+006, be sure to set the
Threshold Scaling Factor to 1e-006.
A scrolling threshold control is created. Before running the control the corresponding
OpenWorkbench file must be open and a protocol should be running. To run the control, click
Run! on the menu bar.
152
OpenController Reference
Creating a Snippet Sort Control
To quickly create a snippet sort control:
Note: Before creating the control, start OpenWorkbench and open a configuration file
which includes a Store for spike sorting.
The Snippet Sort control can only be used if a SortSpike, SortSpike2, or SortSpike3
component is included in the data generating construct. (See Signal Snippets with Spike
Sorting, page 325 for more information.) In the signal snippet construct the Sort_Code
flag must be set to YES.
1.
Click the Controls menu, point to Advance Controls, and click Snippet Sort Control.
The pointer changes to indicate that the control can be added.
2.
Click the grid to position the upper-left corner of the control.
The control is added to the grid area.
3.
Double-click the control to display the properties dialog box.
The dialog box opens with the most commonly changed settings displayed. Related
settings are grouped together by color. Other settings are available by clicking the
Parameter Group box and selecting a settings group.
Settings groups include:
Common - pg. 209
Target(s) - pg. 216
Caption/Border - pg. 187
Polling - pg. 213
Value Control - pg. 218
Data/Source Select - pg. 188
Behavior - pg. 197
Channel Selector - pg. 188
Refresh Control - pg. 190
Scaling - pg. 190
X-Axis Setup - pg. 191
Y-Axis Setup - pg. 192
Appearance - pg. 193
Margins - pg. 189
Colors - pg. 188
Filtering - pg. 189
4.
Select a valid target for the control and make any other property setting changes as
needed.
To select the target:
in the Data Target box. The Select Target dialog box
1.
Click the look-up button
opens.
2.
In the target hierarchy, expand the Stores tree and select the correct Store name (that
is, the Store which includes the signal snippet with spike sorting data construct).
153
OpenEx User's Guide
5.
Click OK.
A snippet sort control is created. Before running the control the corresponding OpenWorkbench
file must be open and a protocol should be running. To run the control, click Run! on the menu
bar.
Using the Scrolling Threshold and Snippet Sort Controls
When a protocol is running, spike discrimination and sorting can be accomplished from
OpenController using the Scrolling Threshold control and the Snippet Sort control. Typically,
these controls are used together allowing the user to set the spike threshold while viewing a
pattern of spike activity in one plot and sort spikes while viewing candidate waveforms in another.
Note: These controls rely on standard OpenEx data constructs. Typically a SortSpike2 component
should be included in the data generating construct (See Signal Snippets with Spike Sorting, page
325 for more information). In the signal snippet construct the Sort_Code flag must be set to YES.
To use the scrolling threshold and snippet sort control:
1.
Start the OpenWorkbench protocol and Run the Controller.
2.
Click the
control
Toggle Mode button or the
Run button on the toolbar to run the
The Scrolling Threshold control is animated with scrolling waveform data and a threshold
marker (green line) is displayed for spike discrimination.
To set the threshold automatically:
154
Right-click the plot and click Auto Threshold or Auto Threshold All on the shortcut
menu.
OpenController Reference
Auto Threshold - sets a threshold for the current channel.
Auto Threshold All - sets a threshold for all channels with the target defined in the control's
properties.
The auto-thresholding feature acquires information about the signal to noise ratio of the signal
and, based on the size of the signal, determines an optimal threshold that will detects any signal
activity above the noise floor. If the spike size is large then the threshold will be set higher than if
the spike size is small. A fixed signal to noise level can be set by modifying the control's Behavior
parameters.
The direction of the threshold discriminator depends on the specified Threshold Target. Typically
the target is the Threshold parameter of a SortSpike2 component and, by default, the threshold is
unidirectional and will be adjusted based on +/- values. A bidirectional threshold can be specified
by modifying the Use Sign parameter of the SortSpike2 component.
When needed, the threshold can also be set or adjusted manually. See Using the Scrolling
Threshold and Snippet Sort Controls Manually, page 156 for more information.
The Snippet Sort control is animated with snippet waveforms and a threshold marker (green line)
is displayed for the window discriminator. Because threshold is controlled from the Scrolling
Threshold control, the user need not adjust this marker. If SortSpike is used, an upper threshold
(pink line) might appear. This marker is controlled manually.
To sort spikes automatically:
Right-click the plot and click Auto Sort or Auto Sort All on the shortcut menu.
155
OpenEx User's Guide
Auto Sort - sorts spikes for the current channel.
Auto Threshold All - sorts spikes for all
channels in the data target (Store) defined in the
control's properties.
The auto-sort feature uses a basic system for determining the number of potential units acquired
on a channel. A simple algorithm is used to separate out candidate spikes. A series of cumulative
frequency plots of the voltage distribution at each time interval is generated. Distributions that
have inflection points (i.e. that are bimodal or multimodal) will be used to determine the time
voltage window.
While sorting is ongoing a progress bar is displayed. When sorting is complete, time-voltage bars
are added and positioned automatically.
Note: Gray traces are snippets that will be recorded as unassigned. The sort code value for these
snippets is set to 0.
When needed, the spikes can also be sorted manually.
Using the Scrolling Threshold and Snippet Sort Controls Manually
When a protocol is running, manual spike discrimination and sorting can be accomplished from
OpenController using the Scrolling Threshold control and Snippet Sort control. While these two
controls are designed to be used together they can also be used independently. This section
provides information about using these controls for manual discrimination and spike sorting.
Manual operation is most often used to make adjustments to the automated threshold and sorting
results.
156
OpenController Reference
Scrolling Threshold Control
When this control is run a threshold marker is displayed. If the threshold marker is not shown, it
can be displayed using auto threshold or by pressing and holding down the Shift key and dragging
the mouse up or down to adjust the plot scale. Ctrl + double-click can sometimes be used to
display the threshold marker. Dragging a marker across the edge of the plot will remove the
marker. A confirmation message will be displayed before the marker is removed.
To set the threshold manually:
Drag the threshold marker into position. This defines the desired magnitude range of the
waveforms. The direction of the threshold marker (green bar) depends on the specified
Threshold Target. Typically the target is the Threshold parameter of a SortSpike2
component and, by default, the marker is unidirectional and will be adjusted based on +/values. A bidirectional marker can be specified by modifying the Use Sign parameter of
the SortSpike2 component. If a SortSpike component is used the threshold bar typically
implements the low threshold.
Note: A pink threshold marker might sometimes be seen. This marker should not be used.
Snippet Sort Control
When this control is run one or more threshold markers are displayed for the window
discriminator. As in the Scrolling Threshold control, the direction of the primary threshold marker
(bar slightly above the signal waveform in the previous diagram) depends on the specified
Threshold Target (see Using the Scrolling Threshold and Snippet Sort Controls, page 154 for
more information).
Note: the primary threshold marker in the Snippet Sort and scrolling threshold controls should be
used to control the same target. Moving the marker in one control should move the marker in the
other control.
When a SortSpike2 or SortSpike3 component is used only one threshold maker is needed. If a
SortSpike component is used both low (green bar) and high (pink bar) thresholds can be
implemented. If two threshold markers are needed and only one marker is displayed, press and
hold down the Shift key and drag the mouse up or down to adjust the plot scale until the second
marker is in view. If no threshold markers appear, Ctrl + double-click can be used to add the
markers. For an alternate method of displaying the upper threshold marker, see Implementing
Artifact Rejection, page 160.
To set the window discriminator:
Drag the threshold markers into position to define the desired magnitude range of the
waveforms. In the following example, the green marker (lower bar) is the lower threshold
and the pink marker (topmost bar) is the upper threshold. To acquire only events within a
range, the pink and green markers are positioned so that a voltage window is created.
157
OpenEx User's Guide
To add a time-voltage window:
Hold down the control key and double-click in the center of the sort spike control.
Note: Grey traces are snippets that will be recorded as unassigned. The sort code value for these
snippets is set to 0.
To assign sort codes to visually identified spikes:
Drag the time-voltage window sorter into position and resize the length of the bar as
needed.
When the sorter is positioned the color of the snippets that pass through the sorter changes to
match the color of the bar. Additional time-voltage windows can be added in the same way.
158
OpenController Reference
To remove a time-voltage window:
Drag it off the edge of the control until the pointer changes to a small trash can. A
message will be displayed to request confirmation of the deletion.
Note: The Snippet Sort control can only be used if a SortSpike, SortSpike2, or SortSpike3
component is included in the data generating construct. In the signal snippet construct the
Sort_Code flag must be set to YES. The Scrolling Threshold control can be used with all spike
components.
(See Type4: Signal Snippets, page 323 or Signal Snippets with Spike Sorting, page 325 for more
information.) If SortSpike or FindSpike are used, only the low threshold is controlled using the
Scrolling Threshold Control. The high threshold for SortSpike can be controlled in the Snippet
Sort Control.
159
OpenEx User's Guide
Determining Sort Codes
The spike sorting components sort spikes using time/voltage window discriminators.
SortSpike and SortSpike2
For the SortSpike and SortSpike2 components, a distance algorithm (distance from the center of
the window) is calculated for waveforms that pass through two or more windows to determine
which sort code value should be assigned.
For example, in the OpenEx Snippet Sort Control figure below, there are two time/voltage
window discriminators. All but one spike passes through both of the windows. Since these spikes
pass closer to the center of window 2, they are all given sort code 2 (coded in red). If any of these
spikes had passed closer to the center of the yellow window, they would have been given sort code
1 (yellow). The spike that did not pass through either of the windows is given sort code 0 (white).
Spikes passing through only Window 1 would be given sort code 1 and spikes passing through
only window 2 would be given sort code 2.
SortSpike3
SortSpike3 uses a different method to determine the sort code value. This component generates a
sort code from ORing together a series of bits based on all of the windows the waveform passes
through. The bit set for a particular window is determined by the following relationship:
2( WindowNum – 1 )
where WindowNum is determined by the order in which the windows are added in OpenEx. The
distance measure discussed earlier is not used in this scheme.
For example, again in the following figure we have two time/voltage window discriminators.
Spikes that only pass through Window 1 are given sort code 1 (yellow). Spikes that only pass
through Window 2 are given sort code 2 (red). Spikes that pass through both Window 1 and
Window 2 are given sort code 3 (light blue).
160
OpenController Reference
Since OpenEx will display 16 unique colors for the sort code values, no more than four
time/voltage window discriminators should be used when using this component with OpenEx.
Implementing Artifact Rejection through OpenController
When OpenController's spike detection feature is implemented using the SortSpike component
(see Signal Snippets with Spike Sorting, page 325), auto thresholding can be used to set the
minimum threshold for spike detection (green threshold bar). Artifact rejection, however, is
implemented by setting a maximum threshold value. The auto threshold feature does not set this
value and does not display the maximum threshold or artifact rejection marker (pink threshold
bar). To control the artifact rejection threshold and display the marker in the plot, you can set the
value of the tag going into the second threshold line of the SortSpike component. One way to do
this is to control the value using a slider.
Use the following steps to set the high threshold and display the threshold marker:
1.
In Controller, click the Controls menu, click sliders/knobs, and click slider.
2.
Click the workspace to add a slider, then double-click the new control to open the
properties dialog box.
3.
Click the browse (...) button next to Primary Target.
4.
Select Devices>Amp1>Scalars>bEA~ and click OK.
5.
Enter a Position Max of 0.005 and a Position Min of 0.
6.
Enter a Tick Precision of 4.
7.
Save the changes and run the project.
8.
Right-click the Scrolling Threshold plot (not the Snippet Sort Plot) and select Auto
Threshold.
9.
The green threshold marker will appear in both the scrolling threshold and snippet sort
plots
10. Use the slider to set an upper threshold. This also brings the second threshold (pink)
marker into view in the Snippet Sort plot. Note that you cannot set the artifact rejection in
the Scrolling Threshold plot. A pink marker might be seen but is not implemented.
11. After the threshold marker is in view you can continue to set the value using the slider or
adjust the value in the Snippet Sort control.
161
OpenEx User's Guide
Master Mode
About the Master Mode Control
The master mode control can be used to access the OpenWorkbench protocol controls from
OpenController. The Run! mode toolbar in OpenController includes Run and Stop buttons. Each
of these buttons can be linked to OpenWorkbench protocol control modes. The Run button can be
linked to the Record, Preview, or Standby protocol mode. The Stop button can be linked to the
Standby or Idle protocol mode.
For example, the Stop button could be linked to the Standby mode. In Standby mode the protocol
continues to run but no data is stored to the tank. The Run button could be linked to the Record
mode so that when adjustments to the control settings are complete and the control is run,
recording will resume.
Master Mode Control
Creating a Master Mode Control
To quickly create a Master Mode control:
1.
Click the Controls menu, point to Advanced Controls, and click Master Mode
Control.
The pointer changes to indicate that the control can be added.
2.
Click the grid to position the upper-left corner of the control.
The control is added to the grid area.
3.
Double-click the control to display the properties dialog box.
The dialog box opens with the most commonly changed settings displayed. Related
settings are grouped together by color. Other settings are available by clicking the
Parameter Group box and selecting a settings group.
Settings groups include:
Common - pg. 204
Target(s) - pg. 216
Caption/Border - pg. 187
Behavior - pg. 195
4.
If needed, type the server name and path in the Server Name box.
If the data is being stored on the same computer where OpenController in running, the
default setting is fine. The server name can be found in the Data Tank/Data Storage
dialog box in OpenWorkbench.
162
OpenController Reference
5.
Click the Mode on Run box and select the protocol mode to be used when the
OpenController Run button is clicked.
6.
Click the Mode on Stop box and select the protocol mode to be used when the
OpenController Stop button is clicked.
7.
Click OK.
The Master Mode Control is created. Before the control can be used an OpenWorkbench file must
be open and a protocol should be selected.
Data Tables
Creating a Data Table
To quickly create a data table control:
1.
Click the Controls menu, point to Tables/Scripting, and click Data Table.
The pointer changes to indicate that the control can be added.
2.
Click the grid to position the upper-left corner of the control.
The control is added to the grid area.
3.
Right-click cell C5 to open the Select Target dialog box.
4.
Using the Select Target dialog, browse for and select a target for the data values that will
be entered in column C.
163
OpenEx User's Guide
5.
Click OK.
6.
Click cell C6 and enter the desired data value for the target selected in cell C5.
Note: values in the Data Table are displayed with a precision of 1. However, the actual
value is retained. For example: a value of 0.0001 is displayed as 0.0, but 1.0001 will be
passed to the target.
7.
To move to cell C7 press the DOWN ARROW key.
8.
Enter the remaining data values in the subsequent cells in column C.
9.
Enter the desired number of repetitions for each value in the corresponding cell in
column A.
A basic data table control is created. The user can add additional targets in subsequent columns.
By default, the Ordering Scheme is manual, and the user controls the order in which table entries
are utilized by clicking a row header while the control is running.
164
OpenController Reference
Synchronizing the Data Table
The data table may be used to send any type of data to parameter tags within the compiled circuit
file. Typically, the data table will be used to control some aspect of a stimulus presentation. To
ensure that the data values are sent at an appropriate time the data table should be synchronized
with some target, such as the sweep number. The table can be synchronized by modifying the
control property settings.
1.
To display the properties dialog box, double-click the control.
The dialog box opens with the most commonly changed settings displayed. Related settings are
grouped together by color. Other settings are available by clicking the Parameter Group box and
selecting a settings group.
Settings groups include:
Common - pg. 199
Target(s) - pg. 216
Caption/Border - pg. 187
Polling - pg. 213
Behavior - pg. 195
2.
Click the Ordering Scheme arrow and choose a scheme from the list.
3.
Select Sequential to send row values sequentially, Random to send row values
randomly, Manual to select rows manually, or Sync Tag to use a tag to select the row.
4.
Click the Synchronization Type arrow and choose a type from the list.
5.
Select On Tag Change to send data values when ever the synchronization target changes
or On Tag True to send data when ever the synchronization target value equals true.
6.
in the Synchronization Target box and browse for a
Click the lookup button
synchronization target in the Select Target dialog box.
7.
Click OK to return to the properties dialog box.
8.
Click OK to update the control with the modified settings.
The data table is now synchronized with a target and all rows will be used according to the
selected ordering scheme. To use only selected rows click the row headers (use SHIFT + click to
select adjacent rows or CTRL + click to select non adjacent rows) before running the control.
Using Formulas
The data table control supports the use of formulas and functions similarly to a Microsoft Excel
spreadsheet. Formulas can be entered in any cell and may include cell references, such as =B2.
Each formula must start with an equals sign and may include standard math operators such as *
(multiply) and / (divide) or functions such as SUM and AVG (average).
The first four rows of the table are reserved for comments or reference values. The user can use a
formula and cell references to multiply table values by some constant.
165
OpenEx User's Guide
For example, a value in cell B1 could be referenced in a formula for the repetition values in
column A as in the table below. All repetition values can then be changed by changing the
constant in cell B1.
Note: the table displays formula results not formulas as in the example below.
A
B
Repeat Constant
20
5
Repeats
Rem
6
=B1
500
7
=2*B1
900
8
=B1
1500
9
=2*B1
1800
1
C
D
RP2(1).Freq
...
2
3
4
166
OpenController Reference
VBScriptEx
About VBScriptEx
The VBScriptEx control provides a powerful way to add real-time logic to control stimulus
parameters based on input from multi-channel digital inputs. It comes with a light IDE (Integrated
Development Environment) for source code editing and debugging. It supports the standard
VBScript language as well as extended functions providing screen output, flow control and access
to OpenEx data target or other controls. Only one script control can be added to a single
OpenController file.
The script control provides an editor for source code editing, line numbering, and syntax
highlighting. The tool buttons on top of the editor provide two groups of functions: standard file
operations and debugging operations. Standard file operations include creating new scripts,
opening and saving a script files. Debugging operations include running, stopping, debugging and
stepping through a script, adding and removing breakpoints, and opening the variable watch
dialog.
Using the legacy VBScript control
The legacy VBScript control requires the VB script dll's and the VB script debugger. Microsoft
does not allow TDT to distribute the Microsoft Script Debugger (VB script debugger). It is
currently available for download from the Microsoft Website at:
http://microsoft.com/downloads/details.aspx?FamilyId=2F465BE0-94FD-4569-B3C4DFFDF19CCD99&displaylang=en
Note: The Legacy VBScript control is still supported by TDT. The VBScriptEx control functions
may not be supported by the Legacy VBScript control.
Creating a VBScriptEx Control
To quickly create a VBScriptEx control:
1.
Click the Controls menu, point to Tables/Scripting, and click VBScriptEx.
The pointer changes to indicate that the control can be added.
2.
Click the grid to position the upper-left corner of the control.
The control is added to the grid area.
167
OpenEx User's Guide
3.
Double-click the grey area at the top of the control to display the properties dialog box.
The dialog box opens with the most commonly changed settings displayed. Related
settings are grouped together by color. Other settings are available by clicking the
Parameter Group box and selecting a settings group.
Settings groups include:
Common - pg. 211
Target(s) - pg. 217
Caption/Border - pg. 187
Behavior - pg. 197
168
4.
If needed, type the server name and path in the Server Name box.
5.
If needed, type the desired Caption Text. This will appear in the upper left corner of the
control component.
6.
If needed, select from these checkbox options for additional setting configurations.
OpenController Reference
Auto Caption: when the Auto Caption check box is selected, a caption will be
automatically generated and applied to the control. The auto caption is based on the target
value. Clear the Auto Caption check box to use a caption defined in the Caption Text
box.
Hidden when running: when the controls are run the editor will be hidden from view.
7.
Click OK.
8.
Click in the editing area of the control and begin typing to write the script.
Writing VBScriptEx control scripts
The script control supports the standard VB Script language and TDTs extended functions.
Extended functions add screen output and system flow controls to the VB Script language, and
provide access to data targets by the simple read and write commands.
There are three types of data targets:
Device Targets
The script control can communicate with devices running on the OpenWorkbench server. The
OpenWorkbench server loads multiple devices (RPco circuits saved in compiled circuit files)
generated by RPvdsEx. Each RPco device contains tags for data input and output. The script
performs stimulus control by communicating with these tags. To specify a device target, use the
format DeviceName.TagName. For example, to access the "Frequency" tag in the device RP(2),
use RP(2).Frequency.
Control Targets
The script control can also communicate with other controls within the same OpenController file.
A script can write a value to other controls, such as a value watch control to display it, or change
the caption text of the control. To specify a control target, use the control name and the property
name in the format >ControlName.PropertyName.
For example, to write to the Value property of a value watch named Watch, use:
>Watch.Value
Default Control Target
When the script control is used to communicate with other controls within the same
OpenController file it can also use the default control target. This is a subset of the control target
using the default target value. Some controls have default target values such as the value watch's
Value property. The default value comes into play if no value is specified.
For example,
>Watch
is equivalent to:
>Watch.Value
The following table lists a description of extended functions:
169
OpenEx User's Guide
Prototype (case insensitive) Returns
Description
Clear()
Void
Clears the text from the Immediate tab.
Print_(String text)
Void
Outputs the value of an expression to the
Immediate tab.
Example:
Note: If using the Legacy
version of VBScript this
method is:
Dim nVal, sValn
nVal = 1
sVal = "Hello "
Print(String text)
Print_(nVal+1)
Print_(sVal & "World")
Output:
2Hello World
Println(String text)
Void
Outputs the value of an expression followed by
a new line to the Immediate tab.
Example:
Dim nVal, sValn
nVal = 1
sVal = "Hello "
Println(nVal+1)
Println(sVal & "World")
Output:
2
Hello World
Quit()
Void
Halts execution of the VB Script.
Sleep(int msec)
Void
Suspends the execution for a specified amount
of time in milliseconds.
Example:
Sleep(1000) 'sleep for 1 second
Read(String target)
Variant: value
Read a value from a target.
Example:
Dim target_dev, target_ctrl, val
target_dev = "MyDevice.frequency"
val = Read(target_dev)
Print_(val)
target_ctrl = ">knob.Value"
Print_(Read(target_ctrl))
170
OpenController Reference
Write_(String target, variant
or constant)
True: successful
Write a value to a target.
False: failed
Example:
Dim target_dev, target_ctrl, val
Note: If using the Legacy
version of VBScript this
method is:
target_dev = "MyDevice.frequency"
Write_(target_dev, val)
target_ctrl = ">knob.Value"
Write_(target_ctrl, val)
Write(String target, variant
or constant)
GetSystemMode()
Long
Returns a long that specifies the devices current
mode:
0 = Idle
1 = Standby
2 = Preview
3 = Run
SetSystemMode(int
newMode)
True: successful
False: failed
Sets the devices current mode where newMode
is:
0 = Idle
1 = Standby
2 = Preview
3 = Run
IssueTrg(long TrgID, long
TrgMode)
Long
Note: TrgID corresponds to
Software trigger 1 – 10.
At this time, IssueTrg
always returns a -1
Issues Software trigger 1 –10 on all active
devices connected to the zBUS. The parameter
TrgMode is reserved at this time and should be
set to 0.
Example:
IssueTrg(1,0)
Using the CRS VSG2/5 system with OpenEx
With the latest release of the OpenEx Interface TDT provides the ability to write VB Script that
can control the CRS VSG2/5 stimulator using the underlying Stimulus Description Language
(SDL). The CRS system gives experimenters the ability to precisely match stimulus presentation
with acquired signals from evoked potentials or single unit neurophysiology.
The ability of one application to control both stimulus and acquisition simplifies the integration
process.
171
OpenEx User's Guide
How It Works
TDT’s OpenController runs a modified version of Visual Basic Script. Method calls to the System
Description Language have been incorporated into the VB Scripting procedure.
All methods that run under the SDL also run under VB Script. Since the method calls are all done
in VB script, all values are sent as variants and are returned as variants. There are two sets of
methods.
System Status Calls
Most of these System Status Calls are not required for communication with the VSG2/5. They are
included to insure compatibility with the CRS VSG2/5 hardware and software.
The following table lists a description of the VSG System Status functions:
Prototype (case insensitive)
Returns
Description
VSG_GetDeviceCommsType(long
nDev, String PortID)
Long
Returns the Communication type (Single
Computer, Dual Computer).
nDev is the device handle for the VSG2/5.
VSG_GetDeviceIDstring(long
nDev)
String
Returns the ID value associated with the
handle.
nDev is the device handle for the VSG2/5.
VSG_ErrorMessage(long errorCode) String
Returns the string error message associated
with the error code.
errorCode is the device handle for the
VSG2/5.
VSG_GetLogonState(long nDev)
Long
Returns the status of the communication
between the computer and the VSG2/5 card
(Returns TCP address and communication
status or error).
nDev is the device handle for the VSG2/5.
VSG_GetString(long nDev)
String
Returns the last String value associated with
a function call.
nDev is the device handle of the VSG2/5.
VSG_GetDeviceType(long nDev)
Long
Returns the device type (this will almost
always be a VSG2/5).
nDev is the device handle for the VSG2/5.
172
OpenController Reference
System Communication Calls
System Communication methods are used to control the VSG2/5 hardware and to start and stop
the VB Scripts communication with the hardware.
The following is the description of the VSG System Communication functions:
Prototype (case
insensitive)
VSG_Init(String devName,
Boolean forcelogon)
Returns
Long
Description
Required to initialize communication between
the OpenEx application and the VSG2/5
hardware.
Example: Returns the handle for the VSG2/5
hardware. This identifies the hardware device
and is used by all other function calls to the
hardware.
Form nDev=VSG_Init(“”,false)
VSG_Close(long nDev)
Long
Required to Close the communication link
between the software and the VSG hardware.
Example: nDev is the device handle for the
VSG2/5. Closes communication with the VSG
device.
Form VSG_Close(nDev)
VSG_SetMode(long nDev,
long mode, long value)
Long
Sets the Stimulus Parameters for accessing the
image. Use SetMode at the start of the VB
script.
Example: nDev is the device handle for the
VSG2/5. Var1 is the Stimulus number, which is
used for all other connections. Var2 indicates
the sync signal out parameters used.
Form VSG_SetMode(nDev,Var1, Var2)
VSG_WriteDirect(long
devHandle, String
command)
Long
Sends SDL commands to the VSG2/5 hardware.
Write direct is used to send all SDL commands
to the hardware system.
Example: nDev is the device handle for the
VSG2/5. “command();” is any SDL command.
All commands must start with a quote and end
with a semicolon and end quotes. To include
variable names ampersands should be used
VSG_WriteDirect(nDev,”size(1,”& width
&”,8);”)
This will change the size of target 1 to the set
width. Note the need for the quotes and the
ampersands.
173
OpenEx User's Guide
Running VBScriptEx control scripts
The VBScriptEx control can run only one script at a time. However, multiple OpenController
applications can be running at the same time with each containing a script control. The script
control can be run in either hidden or non-hidden mode.
Hidden when running: the editor will be hidden from view. This mode is normally used when
the script directs the output to other controls. To run a script, click the Run button on the title tool
bar. To stop, click the Stop button on the title tool bar.
Both the compilation and runtime errors are reported. The location of the error is highlighted
during runtime. Error free VBScript will run automatically whenever the OpenController file is set
to run.
Debugging VBScriptEx control scripts
The Interactive mode triggers the script debugger and provides some useful debugging tools.
Debugging can be performed using the debugging tool buttons, the associated accelerate keys, or
by right-clicking anywhere on the IDE and selecting the corresponding command from the dialog
pop-up menu:
Browse Object: Allows you to browse the library’s object list including methods,
and their parameters/return types.
Start/Resume (F5): runs the script to completion or resumes a paused script.
Pause (Esc): pauses the execution of the script.
End: stops the execution of the script.
Toggle Break (F9): inserts or removes a breakpoint on the line where the cursor is
positioned. If a breakpoint is inserted on a non-executable statement, the debugger
will step to the first available executable statement after the breakpoint.
Evaluate Expression (Shift + F9): Shows the value of the cursors currently
selected expression in the Immediate messages dialog window.
Show Current Statement: Returns the cursor to the currently highlighted line
while the execution is paused.
Step Into (F8): Execute the current line. If the current line is a subroutine or
function call, stop on the first line of that subroutine or function. (If the script is
not active, start it)
Step Over (Shift + F8): Execute to the next line. If the current line is a subroutine
or function call, execute that subroutine or function completely.
Step Out (Ctrl + F8): steps out of the current subroutine or function.
The focus must be on the script control to make the accelerate keys (F5, F8, and F9) function. The
focus will be lost from the script control when the window area outside the script control is
clicked. Click the control to set focus on the script control.
174
OpenController Reference
Biquad Coefficient Generators
About Biquad Coefficient Generators
The System 3 platform relies primarily on digital filtering, with filters implemented through
RPvdsEx components within the compiled circuit file. Biquad filters, inherently more stable than
other IIR filters, are the filter of choice for many OpenEx applications. Their superior stability
allows users to change filter coefficients on the fly, making them ideal for the OpenEx
environment. The Biquad Coefficient Generator control is one of two ways OpenEx users can
modify the coefficients of the Biquad filter.
Note: Filtering macros are available and offer cascaded highpass and lowpass filter sections with
selectable order and dynamic filter coefficient updating for single and multichannel signals. TDT
recommends using macros whenever possible. See Tutorial 1: Getting Started with OpenEx, page
11 for more information on how to add a real-time filter control using filtering macros.
Within RPvdsEx there are several components that can be used to generate filter
coefficients: ButCoef1 (generates Butterworth coefficients for a first order Biquad),
ButCoef (generates Butterworth coefficients for an nth-order Biquad), and ParCoef
(generates a parametric coefficient (equalizer filter) for a first order Biquad). The
parameters of these components may be controlled from within the circuit or from an
OpenEx control.
Within OpenController, Biquad Coefficient Generators generate nth order Biquad
coefficients and allow users to set the filter properties of the Biquad (Lowpass, Highpass,
Bandpass, or Notch). The order of the Biquad filter, or number of Biquads, is
automatically detected and the correct number of coefficients is generated.
There are advantages and disadvantages to both methods. Using RPvdsEx components to generate
the coefficients allows users to control the filtering properties independent of the Microsoft
Windows operating environment. If precise timing of the filter changes is required then this would
be the best choice.
The advantage of generating them through OpenController is two fold. First, you decrease the
number of components used in the circuit. If the number of components is a limiting factor, this
can generate a substantial savings in components. Second, removing the coefficient generators
decreases the cycle usage of the system. In general, TDT recommends using OpenController's
Biquad Coefficient Generators to change filter settings. However, if you require precise timing for
these filter changes we recommend using the ButCoef, ButCoef1, or ParCoef RPvdsEx
components.
The examples below show the circuit constructs required to implement Biquad filtering either
through OpenController or directly in the compiled circuit file. A Biquad filtering circuit construct
is required for each biquad filter that will be implemented through OpenController.
FilterCoef
[1:2,0]
[1:2,0]
Biquad
Biquad
[4:231,0]
nBIQ=1
{>Coef}
{>Delay}
FilterDelay
Biquad Filtering Using OpenController
Filter Settings Changed from
OpenController
ButCoef1
FilterSetting
Gain=1
Fc=1000
BW=100
Type=LP
Enab=Yes
nBIQ=1
{>Coef}
{>Delay}
Biquad Filtering Using ButCoef1 In RPvdsEx
Filter Settings Changed with RPvdsEx Coefficient Generator
175
OpenEx User's Guide
In this example:
The FilterCoef parameter tag is used by OpenController to load the coefficient values for that
filter setting to the Biquad. The FilterDelay parameter tag is used to reset the Biquad delay lines.
If the delay lines are not zeroed it is possible for the filters to crash.
These parameter tag names are suggested names. The parameter tags must be defined as the Coef
Target and Delay Line Target in the control's property settings.
Using the Biquad Coefficient Generator Control
The control set below includes a filter coefficient generator (on the right) and a slider (on the left)
to provide dynamic control of filter settings during the experiment. The filter type, Lowpass,
Highpass, or Bandbass is set along with the default filter settings when the controls are created in
OpenController. During an experiment the corner frequency (Fc) or bandwidth (BW) can be
changed by typing a value in the appropriate box then pressing Enter or from a linked controller,
such as the slider pictured in the following diagram.
Control Set with a Biquad Coefficient Generator
Creating a Biquad Coefficient Generator
Two text boxes on the biquad coefficient generator control can be used to change filter settings
during an experiment. The first is used to select the center, or corner frequency, of the filter and
the second selects the bandwidth in octaves (The bandwidth setting only works with the Notch and
Bandpass filter types). The steps provided below create a biquad coefficient generator control and
a slider to control the filter settings. This is probably the most common use of the biquad
coefficient generator.
1.
Click the Controls menu, point to Advanced Controls, and click Biquad Coefficient
Generator.
The pointer changes to indicate that the control can be added.
2.
Click the grid to position the upper-left corner of the control.
The control is added to the grid area.
3.
176
Double-click the control to display the properties dialog box.
OpenController Reference
The dialog box opens with the most commonly changed settings displayed. Related
settings are grouped together by color. Other settings are available by clicking the
Parameter Group box and selecting a settings group.
Settings groups include:
Common - pg. 198
Target(s) - pg. 215
Caption/Border - pg. 187
Polling - pg. 213
Filter Specification - pg. 189
4.
If needed, type the server name and path in the Server Name box.
If the data is being stored on the same computer where OpenController in running, the
default setting is fine. The server name can be found in the Data Tank/Data Storage
dialog box in OpenWorkbench.
5.
In the Coef Target box select the parameter tag associated with the >Coef line in the
Biquad component. The parameter tag will be in the following location in the Select
Target Tree: Devices|Name|Buffers|.
6.
In the Delay Line Target box select the parameter tag associated with the >Delay line.
The parameter tag will be in the following location in the Select Target Tree:
Devices|Name|Buffers|.
7.
In the Filter Type box, select Highpass, Lowpass, Bandpass, or Notch.
8.
If Bandpass is selected, specify the bandwidth of the filter in octaves in the BW box.
9.
Click OK.
10. Add a slider to the control workspace.
11. In the slider property settings dialog box, select the proper position parameters and
primary target. The target is located in the following location in the Select Target Tree:
Control|cFilterGen-x|Filter Specification|Filter Frequency.
12. Click OK.
177
OpenEx User's Guide
At this point you should be able to control the filter settings of the Biquad from the slider. To test
the control set, toggle to run! mode and move the slider. The filter settings should change in the Fc
= box.
Other Control Types
About Graphic Frames
A frame can be used to create a caption and border for a group of controls. After the frame has
been added, other controls can be dragged to it.
Frame Grouped with Controls
In this example a frame has been used to group a pile plot with a slider controlling the spike
threshold and a value watch displaying the current threshold value.
178
OpenController Reference
Creating a Frame
To quickly create a frame:
Click the Controls menu, point to Misc., and click Graphic Frame.
The pointer changes to indicate that the frame can be added.
1.
Click the grid to position the upper-left corner of the frame.
The frame is added to the grid area.
2.
Double-click the frame to display the properties dialog box.
3.
Type the desired caption in the Caption Text box.
4.
Resize the frame and drag controls to be added to the frame.
5.
Select the frame and related controls.
6.
Click the Edit menu, and click Group.
A basic frame is created. Before running controls the corresponding OpenWorkbench file must be
open and a protocol should be running. To run the controls, click Run! on the menu bar.
About SigGen Control
The SigGen control gives users access to TDT's SigGenRP signal generation application.
SigGenRP is a program for generating simple and complex waveforms. The SigGenRP application
allows users to control all properties of the signal. Users familiar with SigGenRP can use their
existing SigGenRP files with little modification or change. This control provides users with the
ability to use and control a stimulus file designed with SigGenRP as part of an OpenEx
experiment.
SigGen Control
The SigGen control is a partial implementation of the SigGen stimulus system. It allows users to
move about the SGI (SigGen Index) to determine the signal properties. The toggle switch to the
right allows the user to select the next or previous SGI.
If users want to save information about the SigGen parameter controls, the best way would be to
generate a spreadsheet with the SigGen variables and SGI index and save that so that it can be read
by the DataTable format (see Data Tables in the OpenController Reference, page 163).
The outputs from the data table can be set up to store the parameter variables in an asynchronous
scalar format and used as epoch events.
Only one SigGen Engine control can be added to a single OpenController file. If multiple SigGen
Engine controls are requires the user must create individuals OpenController files for each control.
For a detailed description of how to use SigGenRP please refer to the SigGenRP manual. To learn
more about SigGenRP call TDT at 386-462-9622.
179
OpenEx User's Guide
SigGen Signals are generated on the PC and then loaded to and played from the SerSource
component (see the RPvdsEx Help). The following circuit construct must be added to the
RPvdsEx circuit. In most cases the SigGen file will be used with a sweep based stimulus protocol.
The information below assumes that the circuit construct is part of a circuit that includes a sweep
or condition construct and that the construct is controlled by an OpenWorkbench protocol that
uses sweep settings. It is possible to use SigGen circuits in other circuits and OpenWorkbench
protocols, however, the circuit control must be designed by the end user.
sgRamNpts1
[1:1,0]
SerSource
Sw eep
Sw Enable
Size=1e+006
Rst=0
IdxEnab=1
Index=0
{>Data}
sgWave1
cO
Ch=1
[1:2,0]
sgPlayIndex1
sgRamNpts1 parameter tag determines the size of the buffer.
sgWave1 parameter tag loads the SigGen file to the SerSource component.
Sweep resets the buffer before the start of the next stimulus. (This should be changed to condition
if condition control settings are used rather than sweep control settings in the OpenWorkbench
protocol.)
SwEnable plays out the signal from a sweep based protocol. (This should be changed to CoEnable
if condition control settings are used rather than sweep control settings in the OpenWorkbench
protocol.)
Creating a SigGen Engine Control
The description below creates a SigGen control and a Slider Switch that selects the proper SGI
index.
1.
Click the Controls menu, point to Advanced Controls, and click SigGen Control.
The pointer changes to indicate that the control can be added.
2.
Click the grid to position the upper-left corner of the control.
The control is added to the grid area.
3.
Double-click the control to display the properties dialog box.
The dialog box opens with the most commonly changed settings displayed. Related
settings are grouped together by color. Other settings are available by clicking the
Parameter Group box and selecting a settings group.
180
OpenController Reference
Settings groups include:
Common - pg. 208
Target(s) - pg. 217
Caption/Border - pg. 187
Polling - pg. 213
Value Control - pg. 218
SigGen Specs - pg. 190
4.
If needed, type the server name and path in the Server Name box.
If the data is being stored on the same computer where OpenController in running, the
default setting is fine. The server name can be found in the Data Tank/Data Storage
dialog box in OpenWorkbench.
5.
In the SigGen Waveform Target box select the parameter tag associated with the
SigGen waveform buffer. The parameter tag will be in the following location in the
Select Target tree: Devices|Name|Buffers|. (The color of buffer icon will be pink to
indicate a memory buffer as opposed to a coefficient or delay line.)
6.
In the Buffer Length Target box select the parameter tag associated with the length of
the buffer. The parameter tag will be in the following location in the Select Target tree:
Devices|Name|Scalars|. (The color of the scalar will be light blue to indicate an integer
value.)
7.
Select the starting SGI in the Initial SGI box.
8.
Click the Parameter Group box, and click SigGen Specs in the drop down list.
9.
In the SigGen File box, select the SigGen file to use with the SigGen control.
10. If necessary, select the maximum and minimum SGI index.
11. Click OK.
12. Add a slide switch to the control workspace and select the proper position and target
parameters. The Primary Target is located in the following location in the Select Target
tree: Control|cSigGen-x|Value Control|SGI.
13. Click OK.
At this point you should be able to control the SigGen index control from the slider switch. To test
this run the controller and move the slider. The SGI value box should change.
181
OpenEx User's Guide
Linking Controls
About Linking Controls
Linking Controls allows controls to send data to and receive data from other controls. Data from
modifier controls can be sent to visualization tool controls, such as status indicators or gauges. For
example, the value sent from a Slider could be sent both to a parameter tag running on a Device
and to a setting for a visualization tool, such as an Led Indicator.
The Advantages of Linking
Links provide a logical structure to groups of controls and allows users to modify the parameter
settings of one control based on the source information of another control. For example, a user
may want to monitor the signal output from a data channel. A modifier control such as a slider
determines the monitor channel. This output can be sent to a Visualization control so that the
graph shows the correct monitor channel.
How It Works
Controls communicate to each other through Targets. Targets are defined as primary, secondary
(alternate), source, or data targets.
Primary Targets: change a parameter tag on the circuit or a parameter of another control
and occur in modifier controls. A primary target sends a new value each time the system
is polled.
Alternate Targets: are similar to primary targets. They allow users to modify multiple
parameter tags or control parameter settings with a single control. Alternate targets are
associated with modifier controls. An alternate target may be a parameter tag on a
different device or a visualization control parameter setting.
Source Targets: acquire values from parameter tags, and other controls. When a value is
acquired from a control the Value setting in the Value Control parameter group settings is
the source. Source targets are associated with visualization controls.
Data Targets: acquire values from parameter tags and other controllers. Data targets are
associated with visualization controls.
Each control has a unique name. When linking controls the control name is used as a part of the
target path for another control. The control name can be found in the control's property setting
dialog box, in the My Name box of the Target(s) parameter group. A name will be generated
automatically or the user can enter a name of their choice.
182
OpenController Reference
Nomenclature for Controls
>
The greater than sign is used with primary or alternate targets and
sends a value to another control parameter setting.
<
The less than sign is used with source targets or control parameter
settings and acquires a value from another controller parameter.
device.Target
A period separates the device or control from the variable it modifies.
For example deviceX.Filter would modify the Filter parameter tag on
deviceX. controlX.Target Channel would modify the Target Channel
parameter setting in the Target parameter group for controlX.
control.Target
The asterisk is a wild card designator that can be added to device
names or parameters. For example, if a compiled circuit file is
mirrored (that is, the same compiled circuit file is loaded onto multiple
devices and the devices are named in standard form such as acq1, acq2,
...) then the designation acq*.Filter would modify the Filter parameter
tag on all Devices whose names begin with acq.
*
Linking Controls
To link controls simply open the OpenWorkbench configuration file, then Open OpenController
and create each control in the control set as needed. In the target box for the linked control, enter a
path or use the Select Target Dialog to browse to the desired setting for another control in the
same control set.
Example: Linking a Slider and a 7 Segment Display
Typically a modifier and a visualization control are linked. In this example, a 7 segment display
will be linked to a slider.
1.
Open the OpenWorkbench configuration file.
Note: the devices should already be established and compiled circuit files should be
assigned.
2.
Open OpenController. A blank new OpenController file is created and displayed in
Design mode.
3.
To create the slider, click the Control menu, point to Sliders/Knobs, and click Slider.
183
OpenEx User's Guide
184
4.
Click the grid to position the control.
5.
Double click the Slider Control to display the properties dialog box.
6.
In the Primary Target box select the parameter tag to which the slider value will be sent.
In the example below a parameter tag associated with a filter setting on the acq device
was selected. The target can be typed or selected using the Select Target dialog box.
OpenController Reference
7.
Modify any other settings an needed. In this example a caption HP Filter has also been
added and the Auto Caption check box has been cleared so that the used defined caption
will be used. The Position Max and Min were modified to match the correct range for the
high pass filter.
8.
Click OK.
9.
To add a 7 segment display, click the Controls menu, point to Numeric Displays, and
click 7 Segment Display.
10. Click the grid to position the control.
185
OpenEx User's Guide
11. Double-click the control to display the properties dialog box.
12. In the Source Target box enter the source path. In this case the Source Target is the
Value setting found in the Value Control parameter group settings for the control named
cSlider-3. The source target can be entered using the Select Target dialog box or by
typing a greater than sign (>) followed by the source path. If the Select Target dialog box
is used the greater than sign is added automatically.
13. Modify any other settings an needed. In this example, the Caption Text setting has been
changed to HP Filter Setting and the Auto Caption check box has been cleared.
14. Click OK.
15. Click Record or Preview in the OpenWorkbench System Controls.
Toggle Mode button on the OpenController toolbar. The control set is run
16. Click the
and active. Moving the slider will now change both the filter setting on the Device and
the value in the 7 segment display.
186
OpenController Reference
Control Settings Reference
About the Control Settings Reference
In the Control Settings Reference, each topic corresponds to a parameter group in the properties
dialog box.
How Topics Are Arranged
Some settings, such as the settings in the Captions/Borders parameter group, are the same for each
control that includes these settings. Other settings vary by control. When settings in a parameter
group vary by control, the topics for each control type have been arranged in a folder for that
parameter group. Within each folder topics are arranged alphabetically.
How To Find These Settings
Settings in this reference are available in the properties dialog boxes.
To open the properties dialog box for a control, double-click the control in the grid area of
OpenController's Design mode.
Caption/Border Parameter Group
Caption Text: Type text for a caption if desired. The Auto Caption check box must be cleared for
the caption text to be used. The Caption Visible check box must also be selected.
Caption Align: Select an alignment for the control title.
Caption Color: Select a color for the caption from a color palette.
Caption Visible: Select the check box to set the control title area to be visible. Clear the check
box to hide the control title area.
Caption Bevel Visible: Select the check box to give the control title area a beveled appearance.
Auto Caption: When the Auto Caption check box is selected, a caption will be automatically
generated and applied to the control. The auto caption is based on the target value. Clear the Auto
Caption check box to use a caption defined in the Caption Text box.
187
OpenEx User's Guide
Border Style: Select an appearance style for the border.
Border Color: Select a color for the border from a color palette.
Channel Selector Parameter Group
Channel Selector Visible: Select the check box to display a channel selector as part of the
control. The channel selector is a slider that can be used to control which channel of data is used to
animate a single view plot.
Channel Selector Positions: Enter the number of positions to appear on the channel selector.
Channel Selector Offset: Enter the number to offset the position values. For example, enter 2 to
begin position values with channel 3.
Colors Parameter Group
Category Coloring: Set how the trace colors will be applied.
None: The color set in the Trace Color value box will be applied to all traces.
By Channel: The color of traces will be automatically assigned by channel.
By Sortcode: The color of traces will be automatically assigned by sortcode.
Trace (or Dot) Color: Select the trace (or dot) color from a color palette. This selected color is
only used if Category Coloring is set to None.
Plot Border Color: Select the plot border color from a color palette.
Foreground Color: Select the foreground color from a color palette.
Background Color: Select the trace color from a color palette.
Font Color: Select the font color from a color palette.
MultiChannel Grid Color: Select the multi-channel grid color from a color palette.
Data/Source Setup Parameter Group
The settings in this parameter group are automatically set when the Data target is a Store. The
settings should only be modified when the Data Target is a buffer read directly from a hardware
device (not a Store).
Shared Sync: Enabled when a Store acquires data from multiple channels/sources. A sync
indicates the position of data in a buffer or when a change in data has occurred (these usually
generate a logical high).
Plotting Mode: Choices include Tracked and Static. The Plotting Mode affects how plot data is
updated. When Tracked is selected new data is displayed only when changes occur in
OpenWorkbench. Static displays data based on the polling rate of the control without regard to
whether new data has been acquired.
188
OpenController Reference
Filter Specification Parameter Group
Filter Frequency: This setting always reflects the current filter value and can be used as the target
of another control, allowing the filter frequency to be modified by another control, such as a slider.
Default Filter Frequency: Enter the default filter frequency to be used if the initialize mode is
Init On Run or Init On Load.
Initialize Mode: Select a mode from the drop down list. The available choices are: None, Init On
Run or Init On Load.
Filter Type: Select the filter type from a drop down list. Choices are: Lowpass, Highpass,
Bandpass, and Notch.
Bandwidth: Select the bandwidth of the filter in octaves. This setting is used only if the Filter
Type is set to Bandpass.
Filtering Parameter Group
Filter On: Select the check box to enable a filter algorithm using FIR parameters provided in
CoefB0-B4. Clear the check box to disable the filter.
CoefB0: Type a coefficient.
CoefB1: Type a coefficient.
CoefB2: Type a coefficient.
CoefB3: Type a coefficient.
CoefB4: Type a coefficient.
Margins Parameter Group
Left Margin: Type a value for the left margin of the plot.
Right Margin: Type a value for the right margin of the plot.
Top Margin: Type a value for the top margin of the plot.
Bottom Margin: Type a value for the bottom margin of the plot.
Multi View Parameter Group
Multi View Enabled: Select the check box to view each channel, or sort code, of data in an
individual plot.
Num Views: Set the number of channels or sorts to view in a multi-view plot. If data contains
more than 16 channels or sorts the value must be increased to show all data.
Num Columns: Set the number of columns in which multi-view plots are arranged.
View By: Channel or Sort Code. Sort Codes are generated in the RPvdsEx circuit.
View Index Offset: Starting channel or sort is the View Index Offset value +1.
For example: To begin viewing data with channel 3, set the View Index Offset value at 2.
Show View Index: Index is Channel or Sort Code and is determined by the View By value.
189
OpenEx User's Guide
Pointer Parameter Group
Pointer Style: Select the pointer style from a drop down list. Choices are: Arrow-Line, Arrow,
Line, and Triangle.
Pointer Color: Select the pointer color from a color palette.
Pointer Size: Enter the desired size of the pointer in pixels.
Pointer Margin: Enter the desired size of the margin between the tip of the pointer and the arc
(that is, the tick marks along the arc).
Hub Visible: Select the check box to display a hub, or pinion point marker, at the base of the
pointer. If the Hub Visible check box is be selected, the hub Size can be specified.
Hub Size: Enter the desired size of the hub in pixels.
Hub Color: Select the desired color for the hub from a color palette.
Refresh Control Parameter Group
Refresh Period: Set a time value for the refresh period in seconds.
Scaling Parameter Group
X-Axis Range: The range of the x-axis.
Y-Axis Symmetry: Select the check box to ensure that a symmetrical Y-axis range will be
displayed. This is ideal for signals that are expected to be symmetrical.
Auto Scale: The plot can be set to automatically scale during animation to ensure that the data can
always be viewed in a convenient scale.
None: Auto Scale is turned off.
Active: The scale of the plot is automatically adjusted to ensure all values can be shown
on the plot.
Smart: The scale of the plot is automatically adjusted to ensure values can be shown on
the plot only during the first 3 seconds.
Up-Scale Hist.: When Auto Scale is used, this value sets the number of points above the Y-axis
range that the signal must reach before scaling will occur.
Down-Scale Hist.: When Auto Scale is used, this value sets the number of points below half of
the Y-axis range a signal must fall before scaling will occur.
SigGen Specs Parameter Group
SigGen File: Select the SigGen file to use with the SigGen control.
Maximum SGI: Enter the desired maximum SGI.
Minimum SGI: Enter the desired minimum SGI.
190
OpenController Reference
Switch Positions Parameter Group
Position Labels: Enter the labels to appear for each switch position, separated by a comma.
Position Values: Enter the value for each switch position, separated by a comma.
Key Arrow Step Size: Enter the number of positions to move when pressing the UP ARROW or
DOWN ARROW keys on the keyboard.
Key Page Step Size: Enter the number of positions to move when pressing the PAGE UP or
PAGE DOWN keys on the keyboard.
Sections Parameter Group
Section Count: Enter the desired number of section for the arc. Up to five sections can be defined
and distinguished by color.
Section Color 1: Select a color for the first section. If the Section Count equals 1, then the Section
Color 1 will be applied to the entire arc. If the Section Count is greater than 1 then Section End 1
must be defined before the color can be applied.
Section Color 2: Select a color for the second section. The Section Count must be greater than or
equal to 2 and the section ends should be defined.
Section Color 3: Select a color for the third section. The Section Count must be greater than or
equal to 3 and the section ends should be defined.
Section Color 4: Select a color for the fourth section. The Section Count must be greater than or
equal to 2 and the section ends should be defined.
Section Color 5: Select a color for the fifth section. The Section Count must be greater than or
equal to 2 and the section ends should be defined.
Section End 1: Enter the value in degrees for the first section's end point along the arc. The
Section Count must be greater than or equal to 1.
Section End 2: Enter the value in degrees for the second section's end point along the arc. The
Section Count must be greater than or equal to 2.
Section End 3: Enter the value in degrees for the third section's end point along the arc. The
Section Count must be greater than or equal to 3.
Section End 4: Enter the value in degrees for the fourth section's end point along the arc. The
Section Count must be greater than or equal to 4.
X-Axis Setup Parameter Group
Show X Labels: Select the check box to display a unit label for the x-axis. Clear the check box to
hide the x-axis label.
X-Axis Unit: Set name for units that will appear as part of the plot label.
X-Axis Units Factor: Define a multiplication factor to convert x-axis units to valid value for units
label.
X-Axis Offset: Define the starting value for the x-axis.
191
OpenEx User's Guide
Y-Axis Setup Parameter Group
Show Y Labels: Select the check box to display a unit label for the y-axis. Clear the check box to
hide the y-axis label.
Y-Axis Units: Set name for units that will appear as part of the plot label.
Y-Axis Units Factor: Define a multiplication factor to convert y-axis units to valid value for units
label.
Appearance Parameter Group
7 Segment Display Appearance Parameters
LED Color: Select a color for the segments of the numeric display from a color palette.
Background Color: Select a color for the background of the numeric display from a color palette.
Show Off Segments: Select the check box to display shadow images of segments that are not in
use.
Show Off Segments check box selected.
Show Off Segments check box
cleared.
Input Box Appearance Parameters
Alignment: Select an alignment type for value and units text to determine the position of text
within the control's display window. Choices are Center, Left, and Right.
Font Color: Select a color value and units text from a color palette.
Background Color: Select a background color from a color palette.
Max Length: Type a value to set the maximum number of characters that can be input.
Units Text: Enter the unit’s text to be added to the display.
Undo On Error: When the check box is selected the control will automatically clear input errors.
Knob Appearance Parameters
Knob Style: Select a knob style. Choices are Raised Edge, Raised, Sunken, and Sunken Edge.
Edge Width: Select a value to adjust the edge width.
Indicator Style: Select an indicator style. Choices are Dot Lowered, Dot Raised, Dot, Line
Center, Line Custom, and Triangle.
Indicator Size: Select a value to adjust the Indicator size.
Indicator Margin: Select a value to adjust the Indicator margin.
192
OpenController Reference
Led Caption/Indicator Appearance Parameters
Led Color: Select a color for the led from a color palette.
Led Bevel Style: Select a bevel style to control the three dimensional appearance of the control.
Choices are None, Raised, and Lowered.
Threshold: Type the threshold. If the value change is greater than the threshold, the indicator will
be toggled off or on.
Plots/Graphs Appearance Parameters
Plot Title: Type a title for the plot.
Plot Auto Title: When the check box is selected the plot will have an auto generated plot title.
Plot Title Position: Select a position for the plot title.
Plot Line Width: Select a numerical value for the plot line width.
Plot Font Size: Select a numerical value for the plot font size.
Show MultiChannel Grid: When the check box is selected the plot will display lines separating
channels when the multi channel view option is enabled.
Highlight Top Trace: When the check box is selected the plot will highlight the most recent
event displayed.
Plot Type: Select between line and dotted plot types.
Slider Appearance Parameters
Orientation: Select the orientation off the slider movement. Choices are Vertical and Horizontal.
Ends Margin: Select a value to adjust the margins from the top and bottom ends of the control.
Pointer Style: Select the display style of the slider pointer. Choices are Led, Pointer, Bar, and
Light Bar.
Pointer Height: Select a value to adjust the pointer height.
Pointer Width: Select a value to adjust the pointer width.
Pointer Color: Select a color value from a color palette for the pointer.
Track Style: Select display styles for the slide switch track. Choices are Box, Line, Bevel Raised,
and Bevel Lowered.
Major Tick Style: Select a style for the major tick. Choices are None, Raised, and Lowered.
Minor Tick Style: Select a style for the minor tick. Choices are None, Raised, and Lowered.
Major Tick Length: Select a value for the major tick length.
Minor Tick Length: Select a value for the minor tick length.
Tick Margin: Type a value to adjust the tick margin left or right.
Slide Switch Appearance Parameters
Pointer Style: Select display types for the slide switch pointer. Choices are Led, Pointer, Bar,
Light Bar.
Pointer Led Color: Select a color value from a color palette for the pointer led.
Pointer Height: Select a value to adjust the pointer height.
193
OpenEx User's Guide
Pointer Width: Select a value to adjust the pointer width.
Track Style: Select display styles for the slide switch track. Choices are Box, Line, Bevel Raised,
Bevel Lowered.
Indicators Visible: When the check box is selected indicators on the slide switch are visible.
Indicator Size: Select a value to adjust the Indicator size.
Indicator Color: Select a color value from a color palette for the Indicator color.
Switch/Momentary Button Appearance Parameters
Button Text Font Color: Select a color value for the button text from a color palette.
Auto Led Size: When the check box is selected the button’s LED graphic will adjust to the size of
the button.
Button Text: Type text for the button display name.
Button Text Alignment: Select an alignment type for text to determine the position of the button
text. Choices are Top and Bottom.
Button Text Margin: Select a value to adjust the button text margin.
Indicator Alignment: Select an alignment type for the LED indicator to determine its position.
Choices are Top and Bottom, Left, Top, and Right
Indicator Height: Select a value to adjust the LED indicator height.
Indicator Margin: Select a value to adjust the LED indicator margin.
Indicator Width: Select a value to adjust the LED indicator width.
Value Watch Appearance Parameters
Font Color: Select a color value for the font from a color palette.
Background Color: Select a background color from a color palette.
Units Text: Enter the unit’s text to be added to the display.
Text Alignment: Select an alignment type for value and units text to determine the position of
text within the control's display window. Choices are Center, Left, and Right.
Inner Border Style: Select a bevel style to control the three dimensional appearance of interior
borders of the control. Choices are None, Raised, and Lowered.
Precision: Enter the number of digits to be displayed after the decimal point. The precision value
should be less than the Number Digits value to display the desired precision.
Behavior Parameter Group
Chart Plot Behavior Parameters
Time Span: Set the time range, in seconds and according to the time stamp, to be displayed on the
X-axis.
194
OpenController Reference
Data Table Behavior Parameters
Ordering Scheme: Select an ordering scheme. Choices are Manual, Sequential, Random, and
Sync Tag.
Manual: ordering controlled by clicking row numbers.
Sequential: if no rows are selected then all rows will be sent sequentially. If rows are
selected then, selected rows will be sent sequentially.
Random: if no rows are selected then all rows will be sent randomly. If rows are selected
then, selected rows will be sent randomly until all selected rows and repeats are done.
Sync Tag: the value of the synchronization target controls which row is sent. For
example, if the sync tag equals one then the first data row (row six) will be sent.
Synchronization Type: Select a synchronization type. Choices are None, On Tag Change, and
On Tag True.
None: no synchronization, rows are sent one after another till done
On Tag Change: the table will be synchronized with the synchronization target and
values are sent whenever the synchronization target changes.
On Tag True: the table will be synchronized with the synchronization target and values
will be sent whenever the synchronization target value equals true.
Synchronization Target: Select a target to which the data table will be synchronized. Click the
lookup button
to open the Select Target dialog box.
Stop Controller: When the check box is selected the control set will be stopped when all table
entries have been sent.
Feature Plot Behavior Parameters
Cloud Points: Set the minimum number of points to display. The maximum number of cloud
points will be twice the value set. The plot will refresh when the maximum number is reached.
X-Axis Feature: Select from a drop down list. Choices are Total Amplitude, Peak 1, Peak 2, Peak
to Peak Time, and Area.
Y-Axis Feature: Select from a drop down list. Choices are Total Amplitude, Peak 1, Peak 2, Peak
to Peak Time, and Area.
Input Box Behavior Parameters
Precision: Enter the number of digits displayed after the decimal point in the numeric display.
Value Max: Enter the desired maximum value. If the actual input value is greater than the defined
maximum, the maximum value will be used.
Value Min: Enter the desired minimum value. If the actual input value is less than the defined
minimum, the minimum value will be used.
Master Mode Behavior Parameters
Mode on Run: Select the OpenWorkbench System Control Mode to enable when the
OpenController settings in window containing this control are Run. Choices are None, Standby,
Preview, and Run.
Mode on Stop: Select the OpenWorkbench System Control Mode to enable when the
OpenController settings in window containing this control are set to Stop. Choices are None, Idle,
and Standby.
195
OpenEx User's Guide
Delay to run (secs): Enter a value in seconds to delay implementation of Mode on Run setting.
Delay to stop (secs): Enter a value in seconds to delay implementation of Mode on Stop setting.
Momentary Button Behavior Parameters
Value when On: Type value when on.
Value when Off: Type value when off.
Value in milliseconds for On time: Type the length of time for the control to stay on when
clicked.
Scope/Pile Plot Behavior Parameters
Pile Depth: Set the number of traces that will be displayed. Set the Pile Depth to 1 to create a
scope plot.
Scrolling Plot Behavior Parameters
Scroll Sections: Set the number of sections to display before scrolling.
Scrolling Threshold Behavior Parameters
Threshold Target: The threshold target is used to set the lower threshold for the ae~1parameter
tag attached to a spike sorting component.
Threshold Scaling Factor: Enter a voltage value to scale the threshold target to match the voltage
range of the signal being sent to the spike sorting component. This is usually the inverse of the
"scale factor" parameter in a PlotDec16, CompTo16, or CompTo8 RPvdsEx component that was
used to compress the data before display. For example: If the scale factor of a PlotDec16 is set to
106 to convert it to microvolts, then the Threshold Scaling Factor should be set to 10-6. If the scale
factor of a CompTo16 is set to 32767, then the Threshold Scaling Factor should be set to
3.052X10⁻⁵.
Sort/Thresh Mark Persistence: Select Dynamic or Saved to determine if the threshold is saved
when the control is stopped. Select dynamic to update the threshold each time the control is run.
Select Saved to use the fixed threshold until Auto-Threshold is run or the scaling is changed
manually.
Auto-Threshold S/N Factor: Select a choice from the drop down menu to determine the signal to
noise factor that will be used to set the threshold when the auto-threshold feature is used. Auto sets
the threshold based on any spike activity that is above the noise floor. Even if no spikes occur the
control will calculate a threshold that will acquire some signals above the threshold. 2-1 through
5-1 selects a fixed ratio that generates a threshold that is x times greater then the noise floor.
Auto-Threshold Effort: Select low, medium, or high to determine how large a data block will be
acquired before the threshold is calculated. High uses the largest block (taking the longest time)
and small uses the smallest block (to calculate the threshold the quickest).
Auto-Threshold Polarity: Select Either, Positive Only, or Negative Only to determine if the
threshold will look for positive going signals, negative signals, or signals in either direction. A
fixed polarity can be use to separate different waveforms.
Scroll Sections: Selects the number of scroll sections to display.
196
OpenController Reference
Slider Behavior Parameters
Key Arrow Step Size: Enter a step size for slider movements when using the arrow keys on the
keyboard to control the slider.
Key Page Step Size: Enter a step size for slider movements when using the Page Up and Page
Down keys on the keyboard to control the slider.
Snippet Sort Behavior Parameters
Sort/Thresh Mark Persistence: Select Dynamic or Saved to determine if the threshold and sort
values are saved when the control is stopped. Select dynamic to reset the threshold and sort values
each time the control is run. Select Saved to retain the settings until the settings are changed
manually or using the auto-sort feature.
Training Sample Size: Enter a value to determine the maximum number of samples used to sort
spikes. Using more spikes (an increased sample size) allows individual units to be separated more
effectively and rare units are more likely to be detected. However, if unit activity is low using a
large sample size can take an inordinately long time.
Maximum Training Time: Enter a value in seconds to set an upper limit on the auto-sort process.
If the training sample size is not reached in the maximum training time, the sort is based on the
existing sample size.
Allow Unsorted Group: Select the check box to allow unsorted spikes.
Pile Depth: Set the number of traces that will be displayed.
Switch Button Behavior Parameters
Value when On: Type value when on.
Value when Off: Type value when off.
Shared Behavior Parameters
Hidden When Running: When the controls are run, the editor will be hidden from view.
Common Parameter Group
7 Segment Display Common Parameters
Server Name: Select the server name. The default value Local selects the local server.
Source Target: Select or type the name of the source target. When an OpenWorkbench
configuration is open, available targets can be selected using the Select Target dialog box. Click
to open the Select Target dialog box. Using the Select Target dialog boxes
the look-up button
ensures valid formatting of target name.
The source target should be either the Store name (from the OpenWorkbench file) or the device
name (from the OpenWorkbench file) followed by the parameter tag (from the RPvdsEx circuit).
This should follow the form "ssss" for Store name or "dddd.partag" for device name and parameter
tag.
197
OpenEx User's Guide
When linking controls together, the target will be a greater than symbol followed by the source
control's My Name value followed by the setting name. This should follow the form
"myname.settingname" e.g. ">FreqSlider.Value Shift"
Target Channel: Enter the channel number.
Caption Text: Type text for a caption if desired. The Auto Caption check box must be cleared for
the caption text to be used. The Caption Visible check box, in the Caption/Borders parameter
group must also be selected. The Caption Visible check box is selected by default for the 7
segment display.
Auto Caption: When the Auto Caption check box is selected, a caption will be automatically
generated and applied to the control. The auto caption is based on the source target value. Clear
the Auto Caption check box to use a caption defined in the Caption Text box.
Poll Period: Enter a value in milliseconds to set the poll period. The poll period is a defined
interval at which OpenController accesses control targets.
Led Color: Select a color for the segments of the numeric display from a color palette.
Number Digits: Enter the number of digits to be displayed. By default, the leading unused digits
will be displayed as spaces. The total number of digits should be sufficient to display the desired
precision.
Precision: Enter the number of digits to be displayed after the decimal point. The precision value
should be less than the Number Digits value to display the desired precision.
Biquad Coefficient Generator Common Parameters
Server Name: Select the server name. The default value of Local selects the local server.
Coef Target: Select the parameter tag associated with the >Coef line in the Biquad component.
Delay Line Target: Select the parameter tag associated with the >Delay line.
Target Channel: Enter the channel number.
Caption Text: Type text for a caption if desired. The Auto Caption check box must be cleared for
the caption text to be used. The Caption Visible check box, in the Caption/Borders parameter
group must also be selected.
Auto Caption: When the Auto Caption check box is selected, a caption will be automatically
generated and applied to the control. The auto caption is based on the coef target value. Clear the
Auto Caption check box to use a caption defined in the Caption Text box.
Default Filter Frequency: Enter the default filter frequency to be used if the initialize mode is
Init On Run or Init On Load.
Initialize Mode: Select a mode from the drop down list. The available choices are: None, Init On
Run or Init On Load.
Filter Type: Select the filter type from a drop down list. Choices are: Lowpass, Highpass,
Bandpass, and Notch.
Bandwidth: Select the bandwidth of the filter in octaves. This setting is used only if the Filter
Type is set to Bandpass.
Chart Plot Common Parameters
Server Name: Select the server name. The default value of Local selects the local server.
Source Target: Select the data event (Store name) to be plotted.
Target Channel: Selects the channel for viewing. To view a single channel of data enter the
desired channel number.
198
OpenController Reference
Caption Text: Type caption text to display on the plot. The Auto Caption check box must be
cleared before caption text will be used.
Auto Caption: Select the check box to display an automatically generated caption for the plot.
The auto caption is generated using the Store name. Clear the check box to hide the auto caption.
The auto caption should be hidden if no caption is desired or if a user-defined caption should be
used.
Poll Period: Enter a value in milliseconds to set the poll period. The poll period is a defined
interval at which OpenController accesses control targets.
Channel Selector Visible: Select the check box to display a channel selector as part of the
control. The channel selector is a slider that can be used to control which channel of data is used to
animate a single view plot. By default the channel selector options include channels one through
eight. The user can modify the number of channels or offset value in the Channel Selector
parameter group.
Time Span: Set the time range, in seconds and according to the time stamp, to be displayed on the
X-axis.
Multi View Enabled: Select the check box to view each channel, or sort code, of data in an
individual plot.
Num Views: Select the number of channels or sort codes to view. By default, channels will be
displayed beginning with channel 1.
Num Columns: Select the number of columns to display.
Category Coloring: Selects the trace coloring method. Traces can be seen in a single color
(None), one color per channel (By Channel), or one color per sort code (By SortCode).
Data Table Common Parameters
Server Name: Select the server name. The default value of Local selects the local server.
Caption Text: Type caption text to display on the control. The Auto Caption check box must be
cleared before caption text will be used.
Auto Caption: Clear the check box to use a user-defined caption.
Ordering Scheme: Select an ordering scheme. Choices are Manual, Sequential, Random, and
Sync Tag.
Manual: ordering controlled by clicking row numbers.
Sequential: if no rows are selected then all rows will be sent sequentially. If rows are
selected then, selected rows will be sent sequentially.
Random: if no rows are selected then all rows will be sent randomly. If rows are selected
then, selected rows will be sent randomly until all selected rows and repeats are done.
Sync Tag: the value of the synchronization target controls which row is sent. For
example, if the sync tag equals one then the first data row (row six) will be sent.
Synchronization Type: Select a synchronization type. Choices are None, On Tag Change, and
On Tag True.
None: no synchronization, rows are sent one after another till done
On Tag Change: the table will be synchronized with the synchronization target and
values are sent whenever the synchronization target changes.
On Tag True: the table will be synchronized with the synchronization target and values
will be sent whenever the synchronization target value equals true.
Synchronization Target: Select a target to which the data table will be synchronized. Click the
lookup button
to open the Select Target dialog box.
199
OpenEx User's Guide
Feature Plot Common Parameters
Server Name: Select the server name. The default value of Local selects the local server.
Source Target: Select the data event (Store name) to be plotted.
Target Channel: Selects the channel for viewing. To view a single channel of data enter the
desired channel number.
Caption Text: Type caption text to display on the plot. The Auto Caption check box must be
cleared before caption text will be used.
Auto Caption: Select the check box to display an automatically generated caption for the plot.
The auto caption is generated using the Store name. Clear the check box to hide the auto caption.
The auto caption should be hidden if no caption is desired or if a user-defined caption should be
used.
Poll Period: Enter a value in milliseconds to set the poll period. The poll period is a defined
interval at which OpenController accesses control targets.
Channel Selector Visible: Select the check box to display a channel selector as part of the
control. The channel selector is a slider that can be used to control which channel of data is used to
animate a single view plot. By default the channel selector options include channels one through
eight. The user can modify the number of channels or offset value in the Channel Selector
parameter group.
Cloud Points: Set the minimum number of points to display. The maximum number of cloud
points will be twice the value set. The plot will refresh when the maximum number is reached.
X-Axis Feature: Select from a drop down list. Choices are Total Amplitude, Peak 1, Peak 2, Peak
to Peak Time, and Area.
Y-Axis Feature: Select from a drop down list. Choices are Total Amplitude, Peak 1, Peak 2, Peak
to Peak Time, and Area.
Multi View Enabled: Select the check box to view each channel, or sort code, of data in an
individual plot.
Num Views: Select the number of channels or sort codes to view. By default, channels will be
displayed beginning with channel 1.
Num Columns: Select the number of columns to display.
Category Coloring: Selects the trace coloring method. Traces can be seen in a single color
(None), one color per channel (By Channel), or one color per sort code (By SortCode).
Input Box Common Parameters
Server Name: Select the server name. The default value of Local selects the local server.
Primary Target: Select or type the name of the primary destination target. When an
OpenWorkbench configuration is open, available targets can be selected using the Select Target
to open the Select Target dialog box. Using the Select
dialog box. Click the look-up button
Target dialog boxes ensures valid formatting of target name.
The target should generally be the device name (from the OpenWorkbench file) followed by the
parameter tag (from the RPvdsEx circuit). This should follow the form "dddd.parTag" for device
name and parameter tag.
When linking controls together, and the target is the source, the target name will be a greater than
symbol followed by the source control's My Name value followed by the setting name. This
should follow the form "myname.settingname" e.g. ">FreqSlider.Value Shift"
200
OpenController Reference
When the target is the destination, the target name will be a lesser than symbol followed by the
source control's My Name value followed by the setting name. This should follow the form
"myname.settingname" e.g. "<FreqSlider.Value Shift"
Target Channel: Enter the channel number.
Caption Text: Type text for a caption if desired. The Auto Caption check box must be cleared for
the caption text to be used. The Caption Visible check box, in the Caption/Borders parameter
group must also be selected. The Caption Visible check box is selected by default for the input
box.
Auto Caption: When the Auto Caption check box is selected, a caption will be automatically
generated and applied to the control. The auto caption is based on the target value. Clear the Auto
Caption check box to use a caption defined in the Caption Text box.
Initialize Value: Type a value to be used as an initial value if the initialize mode is set to Init On
Run or Init On Load.
Initialize Mode: Select a mode from the drop down list. The available choices are: None, Init On
Run or Init On Load.
Units Text: Type text to be added to the value as an indication of units for the value.
Knob Common Parameters
Server Name: Select the server name. The default value of Local selects the local server.
Primary Target: Select or type the name of the primary destination target. When an
OpenWorkbench configuration is open, available targets can be selected using the Select Target
to open the Select Target dialog box. Using the Select
dialog box. Click the look-up button
Target dialog boxes ensures valid formatting of target name.
The target should generally be the device name (from the OpenWorkbench file) followed by the
parameter tag (from the RPvdsEx circuit). This should follow the form "dddd.parTag" for device
name and parameter tag.
When linking controls together, and the target is the source, the target name will be a greater than
symbol followed by the source control's My Name value followed by the setting name. This
should follow the form "myname.settingname" e.g. ">FreqSlider.Value Shift".
When the target is the destination, the target name will be a lesser than symbol followed by the
source control's My Name value followed by the setting name. This should follow the form
"myname.settingname" e.g. "<FreqSlider.Value Shift".
Target Channel: Enter the channel number.
Caption Text: Type text for a caption if desired. The Auto Caption check box must be cleared for
the caption text to be used. The Caption Visible check box, in the Caption/Borders parameter
group must also be selected. The Caption Visible check box is selected by default for the knob.
Auto Caption: When the Auto Caption check box is selected, a caption will be automatically
generated and applied to the control. The auto caption is based on the target value. Clear the Auto
Caption check box to use a caption defined in the Caption Text box.
Initialize Value: Type a value to be used as an initial value if the initialize mode is set to Init On
Run or Init On Load.
Initialize Mode: Select a mode from the drop down list. The available choices are: None, Init On
Run or Init On Load.
Position Display Visible: When the Position Display Visible check box is selected the current
position value is displayed at the center of the knob.
Scale Max: Enter the maximum value to be displayed for the knob.
201
OpenEx User's Guide
Scale Min: Enter the minimum value to be displayed for the knob.
Label Precision: Enter the number of digits to be displayed after the decimal point for value
labels on the knob.
Led Caption Common Parameters
Server Name: Select the server name. The default value of Local selects the local server.
Source Target: Select or type the name of the source target. When an OpenWorkbench
configuration is open, available targets can be selected using the Select Target dialog box. Click
to open the Select Target dialog box. Using the Select Target dialog boxes
the look-up button
ensures valid formatting of target name.
The source target should be either the Store name (from the OpenWorkbench file) or the device
name (from the OpenWorkbench file) followed by the parameter tag (from the RPvdsEx circuit).
This should follow the form "ssss" for Store name or "dddd.partag" for device name and parameter
tag.
When linking controls together, the target will be a greater than symbol followed by the source
control's My Name value followed by the setting name. This should follow the form
"myname.settingname" e.g. ">FreqSlider.Value Shift".
Target Channel: Enter the channel number.
Caption Text: Type text for a caption if desired. The Auto Caption check box must be cleared for
the caption text to be used. The Caption Visible check box, in the Caption/Borders parameter
group must also be selected. The Caption Visible check box is selected by default for the led
caption.
Auto Caption: When the Auto Caption check box is selected, a caption will be automatically
generated and applied to the control. The auto caption is based on the source target value. Clear
the Auto Caption check box to use a caption defined in the Caption Text box. The Caption Visible
check box, in the Caption/Borders parameter group must also be selected.
Poll Period: Enter a value in milliseconds to set the poll period. The poll period is a defined
interval at which OpenController accesses control targets.
Led Color: Select a color for the led from a color palette.
On/Off Threshold: Type the threshold. If the value change is greater than the threshold, the
indicator will be toggled off or on.
Led Indicator Common Parameters
Server Name: Select the server name. The default value of Local selects the local server.
Source Target: Select or type the name of the source target. When an OpenWorkbench
configuration is open, available targets can be selected using the Select Target dialog box. Click
to open the Select Target dialog box. Using the Select Target dialog boxes
the look-up button
ensures valid formatting of target name.
The source target should be either the Store name (from the OpenWorkbench file) or the device
name (from the OpenWorkbench file) followed by the parameter tag (from the RPvdsEx circuit).
This should follow the form "ssss" for Store name or "dddd.partag" for device name and parameter
tag.
When linking controls together, the target will be a greater than symbol followed by the source
control's My Name value followed by the setting name. This should follow the form
"myname.settingname" e.g. ">FreqSlider.Value Shift".
202
OpenController Reference
Target Channel: Enter the channel number.
Caption Text: Type text for a caption if desired. The Auto Caption check box must be cleared for
the caption text to be used.
The Caption Visible check box, in the Caption/Borders parameter group must also be selected.
The Caption Visible check box is selected by default for the led indicator.
Auto Caption: When the Auto Caption check box is selected, a caption will be automatically
generated and applied to the control. The auto caption is based on the source target value. Clear
the Auto Caption check box to use a caption defined in the Caption Text box.
Poll Period: Enter a value in milliseconds to set the poll period. The poll period is a defined
interval at which OpenController accesses control targets.
Led Color: Select a color for the led from a color palette.
On/Off Threshold: Type the threshold. If the value change is greater than the threshold, the
indicator will be toggled off or on.
Linear Gauge Common Parameters
Server Name: Select the server name. The default value of Local selects the local server.
Source Target: Select or type the name of the source target. When an OpenWorkbench
configuration is open, available targets can be selected using the Select Target dialog box. Click
to open the Select Target dialog box. Using the Select Target dialog boxes
the look-up button
ensures valid formatting of target name.
The source target should be either the Store name (from the OpenWorkbench file) or the device
name (from the OpenWorkbench file) followed by the parameter tag (from the RPvdsEx circuit).
This should follow the form "ssss" for Store name or "dddd.partag" for device name and parameter
tag.
When linking controls together, the target will be a greater than symbol followed by the source
control's My Name value followed by the setting name. This should follow the form
"myname.settingname" e.g. ">FreqSlider.Value Shift".
Target Channel: Enter the channel number.
Caption Text: Type text for a caption if desired. The Auto Caption check box must be cleared for
the caption text to be used. The Caption Visible check box, in the Caption/Borders parameter
group must also be selected. The Caption Visible check box is selected by default for the linear
gauge.
Auto Caption: When the Auto Caption check box is selected, a caption will be automatically
generated and applied to the control. The auto caption is based on the source target value. Clear
the Auto Caption check box to use a caption defined in the Caption Text box.
Poll Period: Enter a value in milliseconds to set the poll period. The poll period is a defined
interval at which OpenController accesses control targets.
Arc Start: Enter the position in degrees for the starting position of the arc display.
Arc Range: Enter the range in degrees for the arc display. For example: 90 degrees for a quarter
circle arc.
Scale Minimum: Enter the minimum value for gauge values that will be displayed.
Scale Maximum: Enter the maximum value for gauge values that will be displayed.
Label Precision: Enter the number of digits to be displayed after the decimal point for value
labels found on the control.
203
OpenEx User's Guide
Logarithmic Gauge Common Parameters
Server Name: Select the server name. The default value of Local selects the local server.
Source Target: Select or type the name of the source target. When an OpenWorkbench
configuration is open, available targets can be selected using the Select Target dialog box. Click
to open the Select Target dialog box. Using the Select Target dialog boxes
the look-up button
ensures valid formatting of target name.
The source target should be either the Store name (from the OpenWorkbench file) or the device
name (from the OpenWorkbench file) followed by the parameter tag (from the RPvdsEx circuit).
This should follow the form "ssss" for Store name or "dddd.partag" for device name and parameter
tag.
When linking controls together, the target will be a greater than symbol followed by the source
control's My Name value followed by the setting name. This should follow the form
"myname.settingname" e.g. ">FreqSlider.Value Shift".
Target Channel: Enter the channel number.
Caption Text: Type text for a caption if desired. The Auto Caption check box must be cleared for
the caption text to be used. The Caption Visible check box, in the Caption/Borders parameter
group must also be selected. The Caption Visible check box is selected by default for the
logarithmic gauge.
Auto Caption: When the Auto Caption check box is selected, a caption will be automatically
generated and applied to the control. The auto caption is based on the source target value. Clear
the Auto Caption check box to use a caption defined in the Caption Text box.
Poll Period: Enter a value in milliseconds to set the poll period. The poll period is a defined
interval at which OpenController accesses control targets.
Arc Start: Enter the position in degrees for the starting position of the arc display.
Arc Range: Enter the range in degrees for the arc display. For example: 90 degrees for a quarter
circle arc.
Scale Minimum: Enter the minimum value for gauge values that will be displayed.
Scale Maximum: Enter the maximum value for gauge values that will be displayed.
Tick Label Precision: Enter the number of digits to be displayed after the decimal point for value
labels found on the control.
Master Mode Common Parameters
Server Name: Select the server name. The default value of Local selects the local server.
Caption Text: Type text for a caption if desired. The Caption Visible check box, in the
Caption/Borders parameter group must also be selected. The Caption Visible check box is selected
by default for the Master Mode Control.
Mode on Run: Select the OpenWorkbench System Control Mode to enable when the
OpenController settings in window containing this control are Run. Choices are None, Standby,
Preview, and Run.
Mode on Stop: Select the OpenWorkbench System Control Mode to enable when the
OpenController settings in window containing this control are set to Stop. Choice are None, Idle,
and Standby.
Delay to run (secs): Enter a value in seconds to delay implementation of Mode on Run setting.
Delay to stop (secs): Enter a value in seconds to delay implementation of Mode on Stop setting.
204
OpenController Reference
Momentary Button Common Parameters
Server Name: Select the server name. The default value of Local selects the local server.
Primary Target: Select or type the name of the primary destination target. When an
OpenWorkbench configuration is open, available targets can be selected using the Select Target
dialog box. Click the look-up button to open the Select Target dialog box. Using the Select Target
dialog boxes ensures valid formatting of target name.
The target should generally be the device name (from the OpenWorkbench file) followed by the
parameter tag (from the RPvdsEx circuit). This should follow the form "dddd.parTag" for device
name and parameter tag.
When linking controls together, and the target is the source, the target name will be a greater than
symbol followed by the source control's My Name value followed by the setting name. This
should follow the form "myname.settingname" e.g. ">FreqSlider.Value Shift" .
When the target is the destination, the target name will be a lesser than symbol followed by the
source control's My Name value followed by the setting name. This should follow the form
"myname.settingname" e.g. "<FreqSlider.Value Shift".
Target Channel: Enter the channel number.
Caption Text: Type text for a caption if desired. The Auto Caption check box must be cleared for
the caption text to be used. The Caption Visible check box, in the Caption/Borders parameter
group must also be selected.
Auto Caption: When the Auto Caption check box is selected, a caption will be automatically
generated and applied to the control. The auto caption is based on the target value. Clear the Auto
Caption check box to use a caption defined in the Caption Text box. The Caption Visible check
box, in the Caption/Borders parameter group must also be selected.
Initialize Value: Type a value to be used as an initial value if the initialize mode is set to Init On
Run or Init On Load.
Initialize Mode: Select a mode from the drop down list. The available choices are: None, Init On
Run or Init On Load.
Button Text: Type text to be displayed on the button.
Value when On: Type value when on.
Value when Off: Type value when off.
Value in milliseconds for On time: Type the length of time for the control to stay on when
clicked.
Scope/Pile Plot Common Parameters
Server Name: Select the server name. The default value of Local selects the local server.
Data Target: Select the data event (Store name) to be plotted.
Target Channel: Selects the channel for viewing. To view a single channel of data enter the
desired channel number.
Caption Text: Type caption text to display on the plot. The Auto Caption check box must be
cleared before caption text will be used.
Auto Caption: Select the check box to display an automatically generated caption for the plot.
The auto caption is generated using the Store name. Clear the check box to hide the auto caption.
The auto caption should be hidden if no caption is desired or if a user-defined caption should be
used.
Poll Period: Enter a value in milliseconds to set the poll period. The poll period is a defined
interval at which OpenController accesses control targets.
205
OpenEx User's Guide
Channel Selector Visible: Select the check box to display a channel selector as part of the
control. The channel selector is a slider that can be used to control which channel of data is used to
animate a single view plot. By default the channel selector options include channels one through
eight. The user can modify the number of channels or offset value in the Channel Selector
parameter group.
Pile Depth: Set the number of traces that will be displayed. Set the Pile Depth to 1 to create a
scope plot.
Multi View Enabled: Select the check box to view each channel, or sort code, of data in an
individual plot.
Num Views: Select the number of channels or sort codes to view. By default, channels will be
displayed beginning with channel 1.
Num Columns: Select the number of columns to display.
Category Coloring: Selects the trace coloring method. Traces can be seen in a single color
(None), one color per channel (By Channel), or one color per sort code (By SortCode).
Scrolling Plot Common Parameters
Server Name: Select the server name. The default value of Local selects the local server.
Data Target: Select the data event (Store name) to be plotted.
Target Channel: Selects the channel for viewing. To view a single channel of data enter the
desired channel number.
Caption Text: Type caption text to display on the plot. The Auto Caption check box must be
cleared before caption text will be used.
Auto Caption: Select the check box to display an automatically generated caption for the plot.
The auto caption is generated using the Store name. Clear the check box to hide the auto caption.
The auto caption should be hidden if no caption is desired or if a user-defined caption should be
used.
Poll Period: Enter a value in milliseconds to set the poll period. The poll period is a defined
interval at which OpenController accesses control targets.
Channel Selector Visible: Select the check box to display a channel selector as part of the
control. The channel selector is a slider that can be used to control which channel of data is used to
animate a single view plot.
By default the channel selector options include channels one through eight. The user can modify
the number of channels or offset value in the Channel Selector parameter group.
Scroll Sections: Selects the number of scroll sections to display.
Multi View Enabled: Select the check box to view each channel, or sort code, of data in an
individual plot.
Num Views: Select the number of channels or sort codes to view. By default, channels will be
displayed beginning with channel 1.
Num Columns: Select the number of columns to display. Leave this value set to 1 to see one
channel per row.
Scrolling Threshold Common Parameters
Server Name: Select the server name. The default value of Local selects the local server.
Data Target: Select the data event (Store name) to be plotted.
206
OpenController Reference
Target Channel: Selects the channel for viewing. To view a single channel of data enter the
desired channel number.
Caption Text: Type caption text to display on the plot. The Auto Caption check box must be
cleared before caption text will be used.
Auto Caption: Select the check box to display an automatically generated caption for the plot.
The auto caption is generated using the Store name. Clear the check box to hide the auto caption.
The auto caption should be hidden if no caption is desired or if a user-defined caption should be
used.
Poll Period: Enter a value in milliseconds to set the poll period. The poll period is a defined
interval at which OpenController accesses control targets.
Threshold Target: The threshold target takes the threshold based on the scroll plot (which is
usually a plot decimated signal). The output value is then sent to the threshold low parameter tag
(ae~1).
Channel Selector Visible: Select the check box to display a channel selector as part of the
control. The channel selector is a slider that can be used to control which channel of data is used to
animate a single view plot. By default the channel selector options include channels one through
eight. The user can modify the number of channels or offset value in the Channel Selector
parameter group.
Auto-Threshold S/N Factor: Select a choice from the drop down menu to determine the signal to
noise factor that will be used to set the threshold when the auto-threshold feature is used. Auto sets
the threshold based on any spike activity that is above the noise floor. Even if no spikes occur the
control will calculate a threshold that will acquire some signals above the threshold. 2-1 through
5-1 selects a fixed ratio that generates a threshold that is x times greater then the noise floor.
Auto-Threshold Effort: Select low, medium, or high to determine how large a data block will be
acquired before the threshold is calculated. High uses the largest block (taking the longest time)
and small uses the smallest block (to calculate the threshold the quickest).
Auto-Threshold Polarity: Select Either, Positive Only, or Negative Only to determine if the
threshold will look for positive going signals, negative signals, or signals in either direction. A
fixed polarity can be use to separate different waveforms.
Scroll Sections: Selects the number of scroll sections to display.
Slider Common Parameters
Server Name: Select the server name. The default value of Local selects the local server.
Primary Target: Select or type the name of the primary destination target. When an
OpenWorkbench configuration is open, available targets can be selected using the Select Target
to open the Select Target dialog box. Using the Select
dialog box. Click the look-up button
Target dialog boxes ensures valid formatting of target name.
The target should generally be the device name (from the OpenWorkbench file) followed by the
parameter tag (from the RPvdsEx circuit). This should follow the form "dddd.parTag" for device
name and parameter tag.
When linking controls together, and the target is the source, the target name will be a greater than
symbol followed by the source control's My Name value followed by the setting name. This
should follow the form "myname.settingname" e.g. ">FreqSlider.Value Shift"
When the target is the destination, the target name will be a lesser than symbol followed by the
source control's My Name value followed by the setting name. This should follow the form
"myname.settingname" e.g. "<FreqSlider.Value Shift"
Target Channel: Enter the channel number.
207
OpenEx User's Guide
Caption Text: Type text for a caption if desired. The Auto Caption check box must be cleared for
the caption text to be used. The Caption Visible check box, in the Caption/Borders parameter
group must also be selected. The Caption Visible check box is selected by default for the slider.
Auto Caption: When the Auto Caption check box is selected, a caption will be automatically
generated and applied to the control. The auto caption is based on the target value. Clear the Auto
Caption check box to use a caption defined in the Caption Text box.
Initialize Value: Type a value to be used as an initial value if the initialize mode is set to Init On
Run or Init On Load.
Initialize Mode: Select a mode from the drop down list. The available choices are: None, Init On
Run or Init On Load.
Orientation: Select an orientation from a drop down list. Choices are: Vertical or Horizontal.
Pointer Style: Select a pointer style from a drop down list. Choices are: Led, Pointer, Bar, Light
Bar.
Position Max: Enter the maximum value to be displayed for the slider.
Position Min: Enter the minimum value to be displayed for the slider.
Tick Precision: Enter the number of digits to be displayed after the decimal point for value labels
along the slider.
SigGen Engine Common Parameters
Server Name: Select the server name. The default value of Local selects the local server.
SigGen Waveform Target: Select the parameter tag associated with the SigGen waveform
buffer.
Buffer Length Target: Select the parameter tag associated with the length of the buffer.
Target Channel: Selects the channel for viewing. To view a single channel of data enter the
desired channel number.
Caption Text: Type caption text to display on the plot. The Auto Caption check box must be
cleared before caption text will be used.
Auto Caption: Select the check box to display an automatically generated caption for the plot.
The auto caption is generated using the SigGen Waveform Target name.
Clear the check box to hide the auto caption. The auto caption should be hidden if no caption is
desired or if a user-defined caption should be used.
SGI: This setting always reflects the current SGI value and can be used as the target of another
control, allowing the SGI to be modified by another control, such as a slide switch.
Initialize SGI: Type a value to be used as an initial value if the initialize mode is set to Init On
Run or Init On Load.
Initialize Mode: Select a mode from the drop down list. The available choices are: None, Init On
Run or Init On Load.
SigGen File: Select the SigGen file to use with the SigGen control.
Slide Switch Common Parameters
Server Name: Select the server name. The default value of Local selects the local server.
Primary Target: Select or type the name of the primary destination target. When an
OpenWorkbench configuration is open, available targets can be selected using the Select Target
208
OpenController Reference
dialog box. Click the look-up button
to open the Select Target dialog box. Using the Select
Target dialog boxes ensures valid formatting of target name.
The target should generally be the device name (from the OpenWorkbench file) followed by the
parameter tag (from the RPvdsEx circuit). This should follow the form "dddd.parTag" for device
name and parameter tag.
When linking controls together, and the target is the source, the target name will be a greater than
symbol followed by the source control's My Name value followed by the setting name. This
should follow the form "myname.settingname" e.g. ">FreqSlider.Value Shift"
When the target is the destination, the target name will be a lesser than symbol followed by the
source control's My Name value followed by the setting name. This should follow the form
"myname.settingname" e.g. "<FreqSlider.Value Shift"
Target Channel: Enter the channel number.
Caption Text: Type text for a caption if desired. The Auto Caption check box must be cleared for
the caption text to be used. The Caption Visible check box, in the Caption/Borders parameter
group must also be selected.
Auto Caption: When the Auto Caption check box is selected, a caption will be automatically
generated and applied to the control. The auto caption is based on the target value. Clear the Auto
Caption check box to use a caption defined in the Caption Text box. The Caption Visible check
box, in the Caption/Borders parameter group must also be selected.
Initialize Value: Type a value to be used as an initial value if the initialize mode is set to Init On
Run or Init On Load.
Initialize Mode: Select a mode from the drop down list The available choices are: None, Init On
Run or Init On Load.
Orientation: Select Vertical or Horizontal orientation.
Position Labels: Type position labels separated by a comma.
Position Values: Type values separated by a comma.
Snippet Sort Common Parameters
Server Name: Select the server name. The default value of Local selects the local server.
Data Target: Select the data event (Store name) to be plotted.
Target Channel: Select the channel for viewing. To view a single channel of data enter the
desired channel number.
Caption Text: Type caption text to display on the plot. The Auto Caption check box must be
cleared before caption text will be used.
Auto Caption: Select the check box to display an automatically generated caption for the plot.
The auto caption is generated using the Store name. Clear the check box to hide the auto caption.
The auto caption should be hidden if no caption is desired or if a user-defined caption should be
used.
Poll Period: Enter a value in milliseconds to set the poll period. The poll period is a defined
interval at which OpenController accesses control targets.
Channel Selector Visible: Select the check box to display a channel selector as part of the
control. The channel selector is a slider that can be used to control which channel of data is used to
animate a single view plot. By default the channel selector options include channels one through
eight. The user can modify the number of channels or offset value in the Channel Selector
parameter group.
209
OpenEx User's Guide
Training Sample Size: Enter a value to determine the maximum number of samples used to sort
spikes using more spikes (an increased sample size) allows individual units to be separated more
effectively and rare units are more likely to be detected. However, if unit activity is low using a
large sample size can take an inordinately long time.
Maximum Training Time: Enter a value in seconds to set an upper limit on the auto-sort process.
If the training sample size is not reached in the maximum training time, the sort is based on the
existing sample size.
Allow Unsorted Group: Select the check box to allow unsorted spikes.
Pile Depth: Set the number of traces that will be displayed.
Category Coloring: Selects the trace coloring method. Traces can be seen in a single color
(None), one color per channel (By Channel), or one color per sort code (By SortCode).
Switch Button Common Parameters
Server Name: Select the server name. The default value of Local selects the local server.
Primary Target: Select or type the name of the primary destination target. When an
OpenWorkbench configuration is open, available targets can be selected using the Select Target
to open the Select Target dialog box. Using the Select
dialog box. Click the look-up button
Target dialog boxes ensures valid formatting of target name.
The target should generally be the device name (from the OpenWorkbench file) followed by the
parameter tag (from the RPvdsEx circuit). This should follow the form "dddd.parTag" for device
name and parameter tag.
When linking controls together, and the target is the source, the target name will be a greater than
symbol followed by the source control's My Name value followed by the setting name. This
should follow the form "myname.settingname" e.g. ">FreqSlider.Value Shift"
When the target is the destination, the target name will be a lesser than symbol followed by the
source control's My Name value followed by the setting name. This should follow the form
"myname.settingname" e.g. "<FreqSlider.Value Shift"
Target Channel: Enter the channel number.
Caption Text: Type text for a caption if desired. The Auto Caption check box must be cleared for
the caption text to be used. The Caption Visible check box, in the Caption/Borders parameter
group must also be selected.
Auto Caption: When the Auto Caption check box is selected, a caption will be automatically
generated and applied to the control. The auto caption is based on the target value. Clear the Auto
Caption check box to use a caption defined in the Caption Text box. The Caption Visible check
box, in the Caption/Borders parameter group must also be selected.
Initialize Value: Type a value to be used as an initial value if the initialize mode is set to Init On
Run or Init On Load.
Initialize Mode: Select a mode from the drop down list. The available choices are: None, Init On
Run or Init On Load.
Button Text: Type text to be displayed on the button.
Value when On: Type value when on.
Value when Off: Type value when off.
Value Watch Common Parameters
Server Name: Select the server name. The default value of Local selects the local server.
210
OpenController Reference
Source Target: Select or type the name of the source target. When an OpenWorkbench
configuration is open, available targets can be selected using the Select Target dialog box. Click
the look-up button
to open the Select Target dialog box. Using the Select Target dialog boxes
ensures valid formatting of target name.
The source target should be either the Store name (from the OpenWorkbench file) or the device
name (from the OpenWorkbench file) followed by the parameter tag (from the RPvdsEx circuit).
This should follow the form "ssss" for Store name or "dddd.partag" for device name and parameter
tag.
When linking controls together, the target will be a greater than symbol followed by the source
control's My Name value followed by the setting name. This should follow the form
"myname.settingname" e.g. ">FreqSlider.Value Shift"
Target Channel: Enter the channel number.
Caption Text: Type text for a caption if desired. The Auto Caption check box must be cleared for
the caption text to be used. The Caption Visible check box, in the Caption/Borders parameter
group must also be selected. The Caption Visible check box is selected by default for the value
watch.
Auto Caption: When the Auto Caption check box is selected, a caption will be automatically
generated and applied to the control. The auto caption is based on the source target value. Clear
the Auto Caption check box to use a caption defined in the Caption Text box.
Poll Period: Enter a value in milliseconds to set the poll period. The poll period is a defined
interval at which OpenController accesses control targets.
Units Text: Enter the units text to be added to the display.
Precision: Enter the number of digits that to be displayed after the decimal point. The precision
value should be less than the Number Digits value to display the desired precision.
Shared Common Parameters
Server Name: Select the server name. The default value of Local selects the local server.
Caption Text: Type caption text to display on the plot. The Auto Caption check box must be
cleared before caption text will be used.
Auto Caption: Not used.
Hidden When Running: When the controls are run, the editor will be hidden from view.
Layout Parameter Group
7 Segment Layout Parameters
Number Digits: Enter the number of digits to be displayed. By default, the leading unused digits
will be displayed as spaces. The total number of digits should be sufficient to display the desired
precision.
Leading Style: Select a style for leading digits. Choices are: None, Zeros, and Spaces.
Show Sign:
Checked - show the +/- sign.
Unchecked - hide the +/- sign.
Precision: Enter the number of digits to be displayed after the decimal point. The precision value
should be less than the Number Digits value to display the desired precision.
211
OpenEx User's Guide
Knob Layout Parameters
Offset-X: X offset of knob from the frame (top left).
Offset-Y: X offset of knob from the frame (top left).
Rotation Start: Enter a value in degrees for the starting point of the rotation.
Rotation Max: Enter a value in degrees for the ending point of the rotation.
Pos Display Visible:
Checked - show the current value on the knob.
Unchecked - do not show the current value on the knob.
Pos Display Unit: Type the unit of the value controlled by the knob. Units are displayed with the
current value. The Pos Display Visible check box must be selected.
Pos Display Precision: Enter the number of digits to be displayed after the decimal point for the
current value.
Linear Gauge Layout Parameters
Gauge Size: Enter a value for the gauge size. Auto Size must be cleared for the gauge size to be
used.
Auto Size:
Checked - gauge size is automatically changed with the frame size.
Unchecked - gauge size is fixed even though the frame size is changed. Gauge size
should be set in the Gauge Size box.
Offset-X: Enter a value for the X offset of gauge from the frame (right bottom).
Offset-Y: Enter a value for the Y offset of gauge from the frame (right bottom).
Inner Border Style: Select a style for the inner border. Choice include: None, Raised, and
Lowered.
Background Color: Select a color for the gauge background from a color palette.
Arc Start: Enter the position in degrees for the starting position of the arc display.
Arc Range: Enter the range in degrees for the arc display. For example: 90 degrees for a quarter
circle arc.
Logarithmic Gauge Layout Parameters
Offset-X: Enter a value for the X offset of gauge from the frame (right bottom).
Offset-Y: Enter a value for the Y offset of gauge from the frame (right bottom).
Inner Border Style: Select a style for the inner border. Choice include: None, Raised, and
Lowered.
Background Color: Select a color for the gauge background from a color palette.
Arc Start: Enter the position in degrees for the starting position of the arc display.
Arc Range: Enter the range in degrees for the arc display. For example: 90 degrees for a quarter
circle arc.
Slide Switch Layout Parameters
Orientation: Select Vertical or Horizontal orientation.
212
OpenController Reference
Label Position: Select Right/Bottom or Left/Top label position. If the slide switch orientation is
vertical, Right/Bottom places the value labels at the below the slide track and Left/Top places the
value labels below the slide track. If the orientation is horizontal, Right/Bottom places the value
labels at the right of the slide track and Left/Top places the labels at the left of the slide track.
Orientation = Vertical
Label Position = Right/Bottom
Orientation = Horizontal
Label Position = Left/Top
Polling Parameter Group
Modifier Control Polling Parameters
Poll Period: Enter a value in milliseconds to set the poll period. The poll period is a defined
interval at which OpenController accesses control targets.
Read Back Active: Select the check box to set the control to read back the current value. If the
control access a value that might be changed (such as another control), selecting this check boxes
ensures that the appearance of the control reflects the current value.
Visualization Control Polling Parameters
Poll Period: Enter a value in milliseconds to set the poll period. The poll period is a defined
interval at which OpenController accesses control targets. OpenController does not directly access
parameter tags or data Stores. Instead OpenController polls the Workbench for all parameter tags
and Stores. The more it polls the Workbench the greater the load it places on both applications,
Workbench to serve up the data and Controller to take the data and display it.
Plot Updating: Select an updating method from a drop down list. Choices include high load,
medium load, and low load. This setting determines how plots are updated as it relates to the
demand on the system.
High load places the greatest demand on the system. All data acquired since the last
update is used to update the plot allowing you the best possible visualization but limiting
the processing power available to the system for other tasks.
Low load places the least demand on the system by grabbing only a subset of the data
(for example, 3 of 10 acquired snippets) to update the plot. This leaves more processing
power for other tasks.
213
OpenEx User's Guide
Regardless of the setting selected here, all data is retained in the tank and can be used for later
analysis. Typically, users should select the lowest load setting that provides an adequate
representation of the data for the user’s purposes, such as making real-time decisions and
modifications or monitoring the experiment.
Scale Parameter Group
Knob Scale Parameters
Scale Minimum: Enter the minimum value for the control.
Scale Maximum: Enter the maximum value for the control.
Show Labels: Show value labels for major tick mark positions. Labels can be shown even if tick
marks are not shown. The number of labels shown is determined by the Major Ticks Count
setting.
Label Precision: Enter the number of digits to be displayed after the decimal point for value
labels found on the control.
Label Margin: Enter the number of pixels of space desired between labels and the tick arc.
Show Major Ticks: Select the check box to show major ticks.
Major Ticks Count: Enter the number of major tick marks to display on the control. The Show
Major Ticks check box must be selected before major tick marks become visible.
Show Minor Ticks: Select the check box to show minor ticks.
Minor Ticks Count: Enter the number of minor tick marks to display between two major tick
marks on the control. The Show Minor Ticks check box must be selected before minor tick marks
become visible. Minor tick marks can be used even if the major tick marks are not shown.
Key Arrow Step Size: Enter a step size for knob movements when using the arrow keys on the
keyboard to control the knob. The step size number corresponds to control values according to the
minimum and maximum scale settings.
Tip: If the arrow keys do not change the knob position, try moving the knob with the
mouse once. After the knob position has been changed once the key arrows can be used
for subsequent movements.
Key Page Step Size: Enter a step size for knob movements when using the Page Up and Page
Down keys on the keyboard to control the knob. The step size number corresponds to control
values according to the minimum and maximum scale settings.
Tip: If the Page Up and Page Down keys do not change the knob position, try moving the
knob with the mouse once. After the knob position has been changed once the Page Up
and Page Down keys can be used for subsequent movements.
Gauge Scale Parameters
Scale Minimum: Enter the minimum value for the control.
Scale Maximum: Enter the maximum value for the control.
Show Labels: Show value labels for major tick mark positions. Labels can be shown even if tick
marks are not shown. The number of labels shown is determined by the Major Ticks Count
setting.
Label Precision: Enter the number of digits to be displayed after the decimal point for value
labels found on the control.
Label Margin: Enter the number of pixels of space desired between labels and the tick arc.
214
OpenController Reference
Show Major Ticks: Select the check box to show major ticks.
Major Ticks Count: Enter the number of major tick marks to display on the control. The Show
Major Ticks check box must be selected before major tick marks become visible.
Show Minor Ticks: Select the check box to show minor ticks.
Minor Ticks Count: Enter the number of minor tick marks to display between two major tick
marks on the control. The Show Minor Ticks check box must be selected before minor tick marks
become visible. Minor tick marks can be used even if the major tick marks are not shown.
Slider Scale Parameters
Position Max: Enter the maximum value for the control.
Position Min: Enter the minimum value for the control.
Show Major Ticks: Select the check box to show major ticks.
Show Minor Ticks: Select the check box to show minor ticks. Minor ticks can only be shown
when the major ticks are also shown.
Show Tick Labels: Show value labels for major tick mark positions. Labels can be shown even if
tick marks are not shown. The number of labels shown is determined by the Major Ticks Count
setting.
Tick Precision: Enter the number of digits to be displayed after the decimal point for value labels
found on the control.
Major Tick Count: Enter the number of major tick marks to display on the control. The Show
Major Ticks check box must be selected before major tick marks become visible.
Minor Tick Count: Enter the number of minor tick marks to display between two major tick
marks on the control. The Show Major Ticks and Show Minor Ticks check boxes must be selected
before minor tick marks become visible.
Tick Label Margin: Enter the number of pixels of space desired between labels and the tick arc.
Minor Tick Alignment: Select an alignment style for minor tick marks. Choices are: Inside,
Center, and Outside. Inside positions tick marks closer to the slider bar and Outside positions tick
marks closer the labels.
Target Parameter Group
Biquad Coefficient Generator Control Target Parameters
My Name: A unique name for the control. A name will be automatically generated or the user can
enter a name of their choice. When controls are linked, this value can be used as a part of the
target path.
Repaint Target on Update: Not used.
Server Name: Select the server name. The default value of Local selects the local server.
Coef Target: Select the parameter tag associated with the >Coef line in the Biquad component.
Delay Line Target: Select the parameter tag associated with the >Delay line.
Target Channel: Enter the channel number.
215
OpenEx User's Guide
Data Table Control Target Parameters
My Name: A unique name for the control. A name will be automatically generated or the user can
enter a name of their choice. When controls are linked, this value can be used as a part of the
target path.
Repaint Target on Update: When the primary or alternate target is a control setting, the target
control will be repainted (refreshed) when the value is changed.
Server Name: Select the server name. The default value of Local selects the local server.
Master Mode Control Target Parameters
My Name: A unique name for the control. A name will be automatically generated or the user can
enter a name of their choice. When controls are linked, this value can be used as a part of the
target path.
Server Name: Select the server name. The default value of Local selects the local server.
Modifier Control Target Parameters
My Name: A unique name for the control. A name will be automatically generated or the user can
enter a name of their choice. When controls are linked, this value can be used as a part of the
target path.
Repaint Target on Update: When the primary or alternate target is a control setting, the target
control will be repainted (refreshed) when the value is changed.
Server Name: Select the server name. The default value of Local selects the local server.
Primary Target: Select or type the name of the primary destination target. When an
OpenWorkbench configuration is open, available targets can be selected using the Select Target
to open the Select Target dialog box. Using the Select
dialog box. Click the look-up button
Target dialog boxes ensures valid formatting of target name.
The target should generally be the device name (from the OpenWorkbench file) followed by the
parameter tag (from the RPvdsEx circuit). This should follow the form "dddd.parTag" for device
name and parameter tag.
When linking controls together, and the target is the source, the target name will be a greater than
symbol followed by the source control's My Name value followed by the setting name. This
should follow the form "myname.settingname" e.g. ">FreqSlider.Value Shift"
When the target is the destination, the target name will be a lesser than symbol followed by the
source control's My Name value followed by the setting name. This should follow the form
"myname.settingname" e.g. "<FreqSlider.Value Shift"
Alt. Target-1: Select an alternate destination target. See Primary Target above.
Alt. Target-2: Enter an alternate destination target. See Primary Target above.
Alt. Target-3: Enter an alternate destination target. See Primary Target above.
Target Channel: Enter the channel number.
Plots and Graphs Target Parameters
My Name: A unique name for the control. A name will be automatically generated or the user can
enter a name of their choice. When controls are linked, this value can be used as a part of the
target path.
216
OpenController Reference
Server Name: Select the server name. The default value of Local selects the local server.
Data Target: Enter the Store name.
Target Channel: Enter the channel number.
SigGen Engine Control Target Parameters
My Name: A unique name for the control. A name will be automatically generated or the user can
enter a name of their choice. When controls are linked, this value can be used as a part of the
target path.
Repaint Target on Update: Not used.
Server Name: Select the server name. The default value of Local selects the local server.
SigGen Waveform Target: Select the parameter tag associated with the SigGen waveform
buffer.
Buffer Length Target: Select the parameter tag associated with the length of the buffer.
Target Channel: Enter the channel number.
Shared Target Parameters
My Name: A unique name for the control. A name will be automatically generated or the user can
enter a name of their choice. When controls are linked, this value can be used as a part of the
target path.
Server Name: Select the server name. The default value of Local selects the local server.
Visualization Control Target Parameters
My Name: A unique name for the control. A name will be automatically generated or the user can
enter a name of their choice. When controls are linked, this value can be used as a part of the
target path.
Server Name: Select the server name. The default value of Local selects the local server.
Source Target: Select or type the name of the source target. When an OpenWorkbench
configuration is open, available targets can be selected using the Select Target dialog box. Click
to open the Select Target dialog box. Using the Select Target dialog boxes
the look-up button
ensures valid formatting of target name.
The source target should be either the Store name (from the OpenWorkbench file) or the device
name (from the OpenWorkbench file) followed by the parameter tag (from the RPvdsEx circuit).
This should follow the form "ssss" for Store name or "dddd.partag" for device name and parameter
tag.
When linking controls together, the target will be a greater than symbol followed by the source
control's My Name value followed by the setting name. This should follow the form
"myname.settingname" e.g. ">FreqSlider.Value Shift"
Target Channel: Enter the channel number.
217
OpenEx User's Guide
Value Control Parameter Group
Visualization/Modifier Control Value Control Parameters
Value: Type the target(s) value if the initialize mode is None.
Initialize Value: Type the value to be used for initializing when the initialize mode is Init On Run
or Init On Load.
Initialize Mode: Select an initialize mode to determine how the value will be initialized.
None - sets input value to the Value.
Init On Run - sets the input value to the Initialize Value when running.
Init On Load - sets the input value to the Initialize Value when loading.
Value Scale: Enter a value such that the input value = value * value scale + value shift.
Value Shift: Enter a value such that the input value = value * value scale + value shift.
SigGen Engine Control Value Control Parameters
SGI: This setting always reflects the current SGI value and can be used as the target of another
control, allowing the SGI to be modified by another control, such as a slide switch.
Initialize SGI: Type a value to be used as an initial value if the initialize mode is set to Init On
Run or Init On Load.
Initialize Mode: Select a mode from the drop down list. The available choices are: None, Init On
Run or Init On Load.
218
OpenScope Reference
In the OpenScope Reference you will find:
A reference guide to the OpenScope Workspace and the basics of adding and modifying plots.
Plot Types
Step-by-step guides to creating each of the seven available plot types.
Plot Settings Reference
An in-depth reference covering many of the plot settings available from the Property Settings
dialog box.
219
OpenEx User's Guide
~
220
OpenScope Reference
About OpenScope
OpenScope is a user-customizable display and analysis application. It is designed for visualization
of data stored in the OpenEx data tank format. A wide variety of plot types and flexible settings
provide the user with the ability to view the desired data in the most useful way.
The source of this flexibility is the data tank format, which allows for the rapid sorting of many
megabytes of stored data. Powerful tank sorting algorithms sort and serve data to the OpenScope
plots, which are updated as each of the selected data tank elements become available. This means
that stored data can be displayed dynamically during the course of an experiment, or that the entire
experiment can be re-played later as if the data were just being acquired.
Unlike traditional, turn-key applications, OpenScope and the data tank sorting algorithms allow
for the relationships between selected data elements to be calculated and displayed dynamically.
For example, data corresponding to user specifications, such as a subset of stimulus parameters,
can be sorted into individual plots as they are stored to the tank. Moreover, a single data set can be
simultaneously displayed in a number of perievent histograms, each synchronized to different,
user-selected, events.
OpenScope provides eight customizable plot types including: pile, scroll, raster, XY, feature,
chart, histogram, and activity. A single OpenScope file can include a variety of multi-view and
single channel plot types to display different types of data. For even greater flexibility, several
OpenScope windows, each viewing data from a different data tank, can be opened simultaneously.
As part of the OpenEx suite, OpenScope can be used on any computer with local or network
access to the data tank. This provides users the ability to share information across a network.
Getting started with OpenScope begins with selecting data. Once the data tank has been
identified plots can quickly be added and customized to meet a variety of research needs. Plot
configurations can be saved in a file that includes information about the tank and block where the
data is stored. A file can also be used to view other similar data sets. Simply open the file and
select a new tank and block containing the same data events. TDT provides several example files
that can be used for common data types or modified for use with similar data.
About Adding Plots
An auto-generated multi-plot similar to the one found in OpenWorkbench can be added by
dragging a Block from the Block list to the grid. The multi-plot will contain a plot for each data
event (or Store) found in the block. Users can make limited modifications to suit their needs.
Individual plots can be added to the grid area by dragging a data event to the grid or by using the
Add Plot command on the Edit menu. Either option provides several plot types to choose from.
When a plot is added using the Add Plot command the data source must be defined. Other settings,
such as Source Channel, Scaling, and Appearance use default values until the settings are
modified. See the Plot Types section, page 235 for step-by-step instructions for adding
specific plot types.
After one or more plots have been created they can be copied and pasted or pasted as a new type.
This method works well when several similar plots are needed. Copied plots can be modified
quickly to produce a complete set of plots. Multiple plots can also be copied and pasted from other
existing files.
221
OpenEx User's Guide
Before plots can be added a tank must be available and selected in the Tank Select window. If no
tanks are available in the tank select window, a tank must be added to the OpenEx registry.
About Plot Settings
Plots can be modified using the Setup Properties dialog box. When plots are grouped, setting
changes can be made to all plots in the group.
Plot settings are grouped into parameter groups. The available settings are similar for each plot
type. Settings unique to a plot type can generally be found under the Common and Behavior
parameter groups.
Plot Setting Parameter Groups:
222
Common
The most commonly changed settings for the selected plot type
are displayed in the Common parameter group. Related settings
are also grouped by color within the common parameter group.
The settings found in this group can also be found in the other
parameter groups. There is a Common parameter group for each
plot type: pile, scroll, histogram, raster, XY, feature, chart, and
activity.
Data Source
The Data Source group includes settings to identify the data
source as well as settings to control source channel, sorting code,
and the data source definition. Additional settings to identify a
second data source are available in the XY Plot Data Source
group.
Multi View
The Multi View group includes settings to enable and control
display of multi-channel viewing. When multi view is not enabled
plots show results from a single channel, or sort, or all channels,
or sorts, displayed together.
Behavior
The Behavior group contains settings unique to the plot type.
Pile
The Behavior group for the pile plot includes a setting for the pile
depth.
Scroll
The Behavior group for the scroll plot includes a setting to
determine how many sections will be displayed before scrolling.
Histogram
The Behavior group for histograms includes settings to control the
event used for time, time values for refreshing, time span, and bin
width.
Raster
The Behavior group for raster plots includes settings to control the
event used for time, time values for refreshing, and time span.
XY Plot
The Behavior group for XY plots includes a setting for time span
to be displayed on the x-axis.
OpenScope Reference
Feature
The Behavior group for the feature plot includes a setting for the
minimum number of cloud points to be displayed.
Chart
The Behavior group for chart plots includes a setting for time span
to be displayed on the x-axis.
Activity
The Behavior Group for activity plots includes settings for
minimum and maximum values and corresponding color
selections.
Refresh Control
The Refresh Control group includes settings to control how and
when the plot is refreshed.
Scaling
The Scaling group includes settings to control plot scaling
including the Auto Scale feature. Auto Scale can be disabled
(None), set to scale at all times to ensure all values can be shown
on the plot (Active), or set to scale only during the first 3 seconds
(Smart).
X-Axis Setup
The X-Axis Setup group includes settings to control labels, unit
name, unit factor, and offset for the x-axis. The X-Axis Units
Factor defines the scalar of the default number of points.
Y-Axis Setup
The Y-Axis Setup group includes settings to control labels, unit
name, unit factor, and offset for the y-axis. The Y-Axis Units
Factor defines the scalar of the default number of points.
Appearance
The Appearance group includes settings to control the plot
appearance, such as title, title position, font size, and multichannel grid.
When you title a plot, the Plot Auto Title check box must be
cleared before the change can be applied.
Margins
The Margins group includes settings to control the plot margins.
Colors
The Colors group includes settings to control the color of chart
elements. Category Coloring can be set to use the trace color to
draw the plot (None), to automatically select the color for each
channel (By Channel), or to automatically select the color for each
sort code (By SortCode).
Filtering
The Filtering group includes settings to enable or disable an FIR
filter algorithm and to set parameters for the filter.
For more information about plot settings, see the plot settings reference, page 256.
223
OpenEx User's Guide
Using Epochs with OpenScope
OpenScope uses epochs to organize and display data. Epochs are stored events that are associated
with a block's timeline.
Epochs serve two main functions:
To display data in groups so that each group is associated with a particular event.
To change or refresh the plot in response to changes in an event.
Plot settings related to epoch events can be found in the Refresh Control and Behavior parameter
groups in a plot's property settings dialog box.
Refresh Control: All plots have refresh control settings that allow the user to define a refresh
epoch. When a refresh epoch event is defined the plot will be refreshed based on the epoch value
according to the settings in the Refresh Control parameter group. To learn more about the settings
see Refresh Control parameter group settings, page 257.
Behavior: Histogram and raster plots use a time reference epoch event to sort and display data and
to determine what data is plotted according to settings in the Behavior parameter group. To learn
more about the settings see Histogram Behavior parameter group settings or Raster Behavior
parameter group settings, page 259.
The Refresh Control and Behavior settings can be used independently or in combination. Because
different epoch events can be selected for the Refresh Control and Behavior, the data can be
refreshed by a value that is independent of the time reference epoch. This behavior allows users to
develop several graphs each associated with a unique event. Data can then be compared across
event parameters.
224
OpenScope Reference
Raster Plots with different Behavior settings
The OpenScope plots show two raster plots that differ in their behavior. The top plot displays all
the data and the bottom plot displays only data in events that have the value 2000. The difference
between the two plots is how the behavior settings use epoch events. In the bottom plot the
behavior of the plot is controlled by setting limits on the range of epoch events that are displayed.
Using Refresh Control Settings
Refresh Control settings determine when displayed data is removed from the display. Epoch
events can be used to control what set of data is shown on screen. For example, a pile plot can be
set to remove old data and show only new data each time the epoch event changes. This would
allow users to examine spike patterns that are associated with an event, such as a single stimulus
event.
To view data for a single event value at a time:
1.
Select the desired epoch event in the Refresh Epoch Name box in the plot's refresh
Control parameter group settings.
2.
Enter the high and low epoch values for the range over which the plot should refresh in
the Strobe Epoch Low Range and Strobe Epoch High Range boxes.
225
OpenEx User's Guide
3.
Select the Refresh on Change check box. If Refresh on Change is not selected old data
is removed and new data is displayed on each epoch within the boundary conditions set
by Strobe Epoch Low Range and Strobe Epoch High Range.
In many cases the user might want to refresh on a particular event. For example, if an experiment
calls for ten presentations of the same stimulus; after the last stimulus, the stimulus can be
updated. If the stimulus number is included as an epoch then the plot can be refreshed when the
stimulus number reaches a certain value.
Using Behavior Settings in Raster and Histogram Plots
Behavior settings determine how data is displayed, and what data is displayed, in a plot. When an
epoch event is defined for a Raster or Histogram plot only the data associated with the epoch's
scalar values will be displayed. For example, if a user wants to display only signal responses that
occur when a particular stimulus is presented, such as a 9 kHz tone, the plot behavior can be set so
that a new raster pattern is displayed only when this event occurs.
Workspace Basics
About the OpenScope Workspace
The OpenScope workspace includes four collapsible sub-windows and a main grid area where
plots can be displayed. A menu bar and a toolbar are provided for easy access to commands.
Grid Area
Tank Select Window
Control Window
Time Control Window
226
Messages Window
OpenScope Reference
Using the Tank Select Window
The Tank Select window allows you to identify the data to be plotted. Before you can plot data the
tank containing the data must be selected. Users can create plots by dragging a data event to the
grid area.
The window is divided into three areas: TANK, BLOCK, and EVENT. Clicking an object in any
area selects the object. Right-clicking an area displays a shortcut menu that includes common
commands.
The TANK area lists tanks that have been added to the OpenEx
registry. The Details view displays the name and path for each tank.
Click a tank to select it.
The BLOCK area displays the blocks available in the tank selected in
the Tank area. The Details view displays a name, date, and starting
time, duration, stop time, owner, and memo area for each block of
data in the selected tank. Click a block to select it.
The EVENT area displays information about events (OpenWorkbench
Stores) for the block selected in the BLOCK area. Click an event to
select it. Drag an event to the grid to create a plot using that data.
The Select Tank window is accessed from the Data Source command on the File menu and can be
used as an alternative means of selecting data for animation when the Tank Select window (Tank
Navigator) is not displayed.
Controlling Data Visualization
The Control Window provides controls for animating stored data or tracking data as it is acquired.
Both methods utilize data stored in the tank; however, tracking ensures that the most recently
stored data is being viewed.
A control is also provided for selecting the speed at which tank data is displayed during animation.
Animation of the block of data selected in the Tank Select window begins at the time stamp
indicated in the Time Control window. The animation then returns to the beginning of the block
and plays in a loop until a new block is selected. When tracking data animation speed settings and
block selection are not needed and are unavailable.
The Animate button toggles plot animation on and off.
The Track button toggles tracking on and off.
The Animation Speed control scrolls right or left through a list of
animation speed choices.
227
OpenEx User's Guide
Animation Speed choices include:
8th
Half
Double
Quarter
Normal
Quad
Octal
Using Setup Properties Dialog Boxes
The appearance and behavior of each plot can be modified using the Setup Properties dialog box.
The Setup Properties dialog box contains all of the customizable settings for a selected plot.
To open the Setup Properties dialog box for a plot, double-click the plot in the grid area of
OpenScope.
While all Setup Properties dialog boxes look and behave in a similar fashion, the settings available
depend upon the plot being modified.
Plot settings are grouped into parameter groups. The Setup Properties dialog box opens with the
most commonly used settings for the selected plot displayed.
To display the settings available in another group, click the Parameter Group value box and select
the group from the list.
Source Settings
When settings, such as Source Name, must be set using the name of an event a Lookup button
is located to the right of the value box. Clicking the Lookup button opens an Event Selection
window.
228
OpenScope Reference
In the Event Selection window, a list of available events in the current block is displayed. Events
are organized in rows. The EvID (event ID) corresponds to the OpenWorkbench Store name or
Tank Code (for secondary tags). The event ID is preceded by an icon to indicate the type of event,
such as snippet, continuous waveform. Epoch events are marked with the Epoch icon .
Using the Time Control Window
The Time Control window provides a timeline and vertical line indicator that moves as data is
animated. The Time Control Window can also be used to move to a particular time or event.
Epochs, or indexed events, are also added to the window. The Time Control window gives a
precise description of when data was collected.
Timeline by Time Stamps
The current time stamp.
Moves the indicator back by time stamps.
Moves the indicator forward by time stamps.
229
OpenEx User's Guide
Scale Controls
Expands scale in small steps.
Shrinks scale in small steps.
Expands scale in large steps.
Shrinks scale in large steps.
Timeline by Events
The name of event displayed on corresponding line.
Moves the indicator back by events.
Moves the indicator forward by events.
The current event value.
Using the Select Tank Window
The Select Tank window is accessed from the Data Source command on the File menu and can be
used as an alternative means of selecting data for animation when the Tank Select window (Tank
Navigator) is not displayed.
Detailed information about the data is displayed in the three interdependent areas of the window
and commands for each area are available from a shortcut menu (right-click). The TANK area lists
tanks that have been added to the OpenEx registry. Selecting a Tank displays its blocks and events
(OpenWorkbench Stores) in the corresponding areas. The BLOCK area also provides access to the
block information entered at the time the block was acquired. Block notes for a selected block can
be accessed using the Information command on the BLOCK area shortcut menu.
230
OpenScope Reference
OK Button
The OK button updates OpenScope to use the selected Tank and Block for data animation.
Cancel Button
The Cancel button closes the Select Tank window without updating the selected Tank and Block
in OpenScope.
Note: Changes such as erasing tank data or erasing blocks are NOT canceled.
Server Button
The Server button displays the Select Server window allowing users to view, add, remove, or test
servers. The shortcut menu is displayed by right-clicking the SERVER area.
231
OpenEx User's Guide
Shortcut Menus
The following context sensitive menus are available by right-clicking the corresponding area of
the Select Tank window.
TANK Shortcut Menu
Browse for Tank
Browse for folder
Create New Tank
Opens the Select Tank file dialog box so that a tank can be added.
Register Tank
Adds the selected tank to the Windows Registry.
UnRegister tank
Removes the selected tank from the Windows Registry. The tank can
still be used on the local machine.
Test Tank
Tests the connection to the server and opens and closes the tank file.
Reset Tank
Resets the selected tank file. This option returns the tank file to a state
in which data can be read from or written to the tank.
Show Full Path
Toggles detail view on and off. In details view the path to the tank is
displayed.
Refresh Tank List
Refreshes the Tank box display.
Show Legacy Tanks
Displays registered legacy format tanks in the tank list.
Find Legacy Tanks
Opens the Select Tank File dialog box and allows users to browse for
tanks stored in the legacy format by showing files with a .tbk file
extension.
BLOCK Shortcut Menu
There is no shortcut menu for the BLOCK area.
EVENT Shortcut Menu
232
Refresh
Updates the EVENT area to reflect recent changes to Tank, block, or
event information.
Details
Toggles Details view on or off. Details view includes: event ID (Store
name), event type (such as stream, snip, or strobe), data format (such
as float, integer, or double), nSize (number of samples per acquired
event), Fs (sampling frequency), and the time stamp value of the first
event.
OpenScope Reference
The Toolbar and Menus
The OpenScope Toolbar
The toolbar provides buttons for the most common commands.
New
Opens a new OpenScope file.
Open
Opens an existing OpenScope file.
Save
Saves the current OpenScope file.
Cut
Cuts the selected plot or plots.
Copy
Copies the selected plot or plots.
Paste
Pastes the most recently cut or copied plot or plots.
Paste New Type
Pastes a new plot type from the most recently cut or copied plot.
About
Displays version and copyright information for OpenScope.
OpenScope File Menu
Some Items on the OpenScope File menu are not available when running in OpenProject.
Note: To save changes to a file that is part of an OpenEx project, save the project.
New
Opens a new OpenScope file.
Open
Opens the Open dialog box so that an existing OpenScope file can be
opened.
Save
Saves the current OpenScope file with the current name. If the file has not
previously been saved the Save As dialog box opens.
Save As
Opens the Save As dialog box so that the OpenScope file can be saved with
a new name.
Data
Source
Opens the Tank Select dialog box. This Tank Select dialog box is similar to
the Tank Select window and allows the user to select data, add or remove
tanks, view block information, and erase blocks.
Recently
Used Files
The third section of the File menu lists recently used files. Clicking a file
name opens the file.
Exit
Closes the OpenScope application.
233
OpenEx User's Guide
OpenScope Edit Menu
Cut
Cuts the selected plot or plots.
Copy
Copies the selected plot or plots.
Paste
Pastes the most recently cut or copied plot or plots.
Paste
Special
Pastes a new plot type using the data source from the most recently cut or
copied plot.
Add Plot
Opens a sub menu of plot types. Clicking a plot type adds a blank plot of
that type to the grid area.
Remove
Selected
Plot
Removes the selected plot.
Modify
Plot(s)
Opens the Plot Setup dialog box for the selected plot.
Group
Groups selected plots so that they can be labeled and moved together.
Ungroup
Ungroups plots in a selected group.
Preferences
Opens the Setup Preferences dialog box. This dialog box can be used to
customize the appearance of the grid area.
OpenScope Control Menu
Animate
Animates plots with data in the block selected in the Tank Select window.
Track
Active
Animates plots with tracked data.
Halt
Stops animation or tracking.
OpenScope View Menu
234
Toolbar
Toggles the toolbar between displayed and hidden.
Status Bar
Toggles the status bar between displayed and hidden.
Tank Navigator
Toggles the Tank Select window between displayed and hidden.
Time Navigator
Toggles the Time Control window between displayed and hidden.
Control Window
Toggles the Control window between displayed and hidden.
OpenScope Reference
Message Window
Toggles the Message Window between displayed and hidden.
Verbose
Messaging
Toggles verbose messaging on and off.
Customize
Toolbars
Opens the Customize dialog box. The Customize dialog box
allows you to customize the appearance of the menu bar and
toolbar.
OpenScope Help Menu
About OpenScope
Displays version and copyright information for OpenScope.
Plot Types
Selecting Data
Before you can plot data, the tank and block within the tank must be selected in the Tank Select
window of OpenScope.
To select data from a tank:
1.
Click the tank name in the TANK area of the Tank Select window.
2.
Click the block name in the BLOCK area of the Tank Select window. The events
contained in the selected block will be displayed in the EVENT area. Each event
corresponds to an OpenWorkbench Store.
Note: If a tank does not appear in the Tank Select window it must first be added to the OpenEx
registry.
After data is selected, plots can be created using the selected data.
Creating Pile Plots
Pile plots are designed to visualize small data buffers (<500) for quick recognition of differences
in waveform properties. Pile plots are commonly used when extracellular recordings from neurons
are examined to separate out single-unit activity. Users can use pile plots to view time stamped
buffers, called snippets, or synchronized buffers. In a pile plot, the Y-axis is signal intensity such
as voltage or dB and the X-axis is the record size in samples. Waveforms are layered over one
another and centered along the X-axis. As the buffers pile up differences in the shape of the
waveforms can easily be distinguished.
To quickly create a pile plot for a single channel of the selected data:
1.
Drag a data event from the Tank select window to the grid area.
The Select Plot Type box opens.
235
OpenEx User's Guide
2.
Click Pile.
The pile plot is added to the grid area and the Setup Properties dialog box opens with the
most commonly used settings for the pile plot displayed.
Settings groups include:
Common - pg. 261
Data Source - pg. 263
Behavior - pg. 259
Multi View - pg. 256
Refresh Control - pg. 257
Scaling - pg. 257
X-Axis Setup - pg. 258
Y-Axis Setup - pg. 258
Appearance - pg. 193
Margins - pg. 189
Colors - pg. 256
Filtering - pg. 256
Related settings are grouped together by color. Other settings are available by clicking
the Parameter Group box and selecting a settings group.
236
3.
Enter the desired channel number in the Source Channel box.
4.
Channel information is available in the corresponding OpenWorkbench file.
5.
In the Pile Depth box, enter the minimum number of wave forms to be displayed. The
plot will be refreshed when the number of traces reaches twice the minimum.
6.
Click OK.
OpenScope Reference
The pile plot is configured for viewing a single channel of data. The plot can be
positioned and resized using the mouse. When you animate or track data the plot will
look similar to this:
After a single channel pile plot has been created, the settings can be quickly modified for multichannel viewing.
To modify a pile plot to view multiple channels of data:
1.
Double-click the plot to display the Setup Properties dialog box.
2.
Enter 0 in the Source Channel box to ensure that all channels are available for viewing.
3.
Select the Multi View Enabled check box.
4.
In the Num Views box, enter the total number of views required to see all available
channels of data in the multi view. This number will typically be the number of channels
of data acquired. By default channels will be displayed beginning with channel 1.
5.
Enter the number of columns to display in the Num Columns box.
6.
Click OK.
When you animate or track data the plot will look similar to this:
After a multi-channel pile plot has been created, the settings can be quickly modified for viewing a
range of channels.
To modify a pile plot to view a range of channels:
1.
Double-click the plot to display the Setup Properties dialog box.
2.
Enter the total number of channels of data to be viewed in the Num Views box.
By default channels will be displayed beginning with channel 1. To display multiple
channels beginning with another channel, modify the index offset.
3.
To modify the index offset value, click the Parameter Group box, and click Multi
View.
4.
In the View Index Offset box, enter the number of channels to offset.
237
OpenEx User's Guide
For example, to begin viewing from channel 6, enter an Index Offset value of 5. The plot
will begin with channel 6 and display the next sequential channels to equal the number
entered in the Num Views box.
5.
Click OK.
When you animate or track data the plot will look similar to this:
Creating Scroll Plots
Scroll plots provide a useful means of looking at continuous data. Data is presented in segments
called scrolls. Looking at one scroll after another gives an effect similar to an oscilloscope or
EKG. In a scroll plot the Y-axis is voltage and the X-axis is the record size.
To quickly create a scroll plot for single channel of the selected data:
1.
Drag a data event from the Tank Select window to the grid area.
The Select Plot Type box opens.
238
OpenScope Reference
2.
Click Scroll.
The scroll plot is added to the grid area and the Setup Properties dialog box opens with
the most commonly used settings for the scroll plot displayed.
Settings groups include:
Common - pg. 262
Data Source - pg. 263
Behavior - pg. 260
Multi View - pg. 256
Refresh Control - pg. 257
Scaling - pg. 257
X-Axis Setup - pg. 258
Y-Axis Setup - pg. 258
Appearance - pg. 193
Margins - pg. 189
Colors - pg. 256
Related settings are grouped together by color. Other settings are available by clicking
the Parameter Group box and selecting a settings group.
3.
Enter the desired channel number in the Source Channel box. Channel information is
available in the corresponding OpenWorkbench file.
4.
Enter the desired number of scrolls, or data segments, to be displayed.
5.
Click OK.
239
OpenEx User's Guide
The scroll plot is configured for viewing a single channel. The plot can be positioned and
resized using the mouse. When you animate or track data the plot will look something
like this:
After a single channel scroll plot has been created, the settings can be quickly modified for multichannel viewing.
To modify a scroll plot to view multiple channels of data:
1.
Double-click the plot to display the Setup Properties dialog box.
2.
Enter 0 in the Source Channel box to ensure that all channels are available for viewing.
3.
Enter the desired number of scrolls, or data segments, to be displayed.
4.
Select the Multi View Enabled check box.
5.
In the Num Views box, enter the total number of views required to see all available
channels of data in the multi view. This number will typically be the number of channels
of data acquired. By default channels will be displayed beginning with channel 1.
6.
Enter the number of columns to display in the Num Columns box. Leave this value set to
1 to see one channel per row.
7.
Click OK.
After a multi-channel scroll plot has been created, the settings can be quickly modified for viewing
a range of channels.
To modify a scroll plot to view a range of channels:
1.
Double-click the plot to display the Setup Properties dialog box.
2.
Enter the total number of channels of data to be viewed in the Num Views box.
By default channels will be displayed beginning with channel 1. To display multiple
channels beginning with another channel, modify the index offset.
3.
To modify the index offset value, click the Parameter Group box, and click Multi
View.
4.
In the View Index Offset box, enter the number of channels to offset.
For example, to begin viewing from channel 5, enter an Index Offset value of 4. The plot
will begin with channel 5 and display the next sequential channels to equal the number
entered in the Num Views box.
5.
240
Click OK.
OpenScope Reference
When you animate or track data the plot will look like similar to this:
Creating Histograms
Histograms use time stamped values from a variety of data Stores for graphic presentation. The
most common of these are snippets, but lists and even scalars can be included as long as a time
stamp is part of the acquired value. Users set up the bin size (size of time divisions for sorting the
time stamps) and the parameters for refreshing the plot.
A common plot in neurophysiology is the peristimulus histogram, or PSTH. This plot shows the
distribution of spike times after a stimulus has been presented. Another plot might show spike
times for a particular epoch event such as a signal of particular intensity and a final plot might
compare spike patterns across channels over the entire experiment.
Histogram plots in OpenScope show the distribution of waveform time stamps over a set time
span. Histogram plots can show additive changes over a set time scale or they can be refreshed
over a set range. In addition, the plots can refresh (start from zero) at each epoch or on changes in
an epoch (such as a change in the intensity of a stimulus).
This view provides a good visual representation of how waveform time stamps are distributed
from the start of a stimulus.
To quickly create a histogram plot of for a single channel of the selected data:
1.
Drag a data event from the Tank Select window to the grid area.
The Select Plot Type box opens.
241
OpenEx User's Guide
2.
Click Histogram.
The histogram plot is added to the grid area and the Setup Properties dialog box opens
with the most commonly used settings for the histogram plot displayed.
Settings groups include:
Common - pg. 261
Data Source - pg. 263
Behavior - pg. 259
Multi View - pg. 256
Refresh Control - pg. 257
Scaling - pg. 257
X-Axis Setup - pg. 258
Y-Axis Setup - pg. 258
Appearance - pg. 193
Margins - pg. 189
Colors - pg. 256
elated settings are grouped together by color. Other settings are available by clicking the
Parameter Group box and selecting a settings group.
242
3.
Enter the desired channel number in the Source Channel box. Channel information is
available in the corresponding OpenWorkbench file. Channel selection is affected by the
Index value on the Devices page and by the Store Chan Offset value on the Stores page.
4.
In the TimeRef Epoc Name box, select an epoch, or indexed, event. This must be
selected to update the histogram.
5.
In the Time Span box enter the desired time span. This might be set to the length of a
stimulus, for example. In the Time Span box the time span can be fixed by the user or left
OpenScope Reference
set to 0 to respect the TRef duration. If the epoch is a stimulus this will allow you to see
how waveform times are distributed from the start of the stimulus.
6.
In the Bin Width box, enter the bin width. The bin width should relate to the distribution
pattern of the time stamped signals. For a PSTH this might mean that the bin width
should be a couple of milliseconds, for patterns of evoked potentials it could be much
larger.
7.
Click OK.
The histogram plot is configured for viewing a single channel. The plot can be positioned
and resized using the mouse. When you animate or track data the plot will look similar to
this:
After a single channel histogram plot has been created, the settings can be quickly modified for
multi-channel viewing.
To modify a histogram plot to view multiple channels of data:
1.
Double-click the plot to display the Setup Properties dialog box.
2.
Enter 0 in the Source Channel box to ensure that all channels are available for viewing.
3.
Select the Multi View Enabled check box.
4.
In the Num Views box, enter the total number of views required to see all available
channels of data in the multi view. This number will typically be the number of channels
of data acquired. By default channels will be displayed beginning with channel 1.
5.
Enter the number of columns to display in the Num Columns box. Depending on the
design of your experiment you might want to view a pattern that is representative of the
physical or logical distribution of the channels. For example, if you had electrodes placed
in a 4 x 4 grid around the head then it would be useful to see that pattern in OpenScope.
Similarly, if you had electrodes in a linear pattern you might want to have either 1
column or 16 columns.
6.
Click OK.
When you animate or track data the plot will look similar to this:
After a multi-channel histogram plot has been created, the settings can be quickly modified for
viewing a range of channels.
To modify a histogram plot to view a range of channels:
1.
Double-click the plot to display the Setup Properties dialog box.
2.
Enter the total number of channels of data to be viewed in the Num Views box.
By default channels will be displayed beginning with channel 1. To display multiple
channels beginning with another channel, modify the index offset.
243
OpenEx User's Guide
3.
To modify the index offset value, click the Parameter Group box, and click Multi
View.
4.
In the View Index Offset box, enter the number of channels to offset.
For example, to begin viewing from channel 5, enter an Index Offset value of 4. The plot
will begin with channel 5 and display the next sequential channels to equal the number
entered in the Num Views box.
5.
Click OK.
After a multi channel histogram plot has been created, the settings can be quickly modified to
view by sort code.
To modify a multi-channel histogram plot to view by sort code:
1.
Double-click the plot to display the Setup Properties dialog box.
2.
Click the Parameter Group box, and click Multi View.
3.
In the View By box, select Sort Code from the drop down list.
4.
Update the Num Views and View Index Offset values as needed.
5.
Click OK.
Creating Raster Plots
Raster plots provide a useful means of looking at time stamped values or waveforms that are not
continuous, such as snippets. The time stamps of the snippets are represented by dots plotted in
rows. Each row represents an epoch, or indexed, event. In a raster plot the Y-axis is indexed event
values and the X-axis is time stamp values.
This view provides a good visual representation of when snippets occurred for an indexed event.
Raster plots are an excellent way of detecting subtle changes in the timing of waveforms across
channels.
To quickly create a raster plot for a single channel of the selected data:
1.
Drag a data event from the Tank Select window to the grid area.
The Select Plot Type box opens.
244
OpenScope Reference
2.
Click Raster.
The raster plot is added to the grid area and the Setup Properties dialog box opens with
the most commonly used settings for the raster plot displayed.
Settings groups include:
Common - pg. 262
Data Source - pg. 263
Behavior - pg. 259
Multi View - pg. 256
Refresh Control - pg. 257
X-Axis Setup - pg. 258
Y-Axis Setup - pg. 258
Appearance - pg. 193
Margins - pg. 189
Colors - pg. 256
Related settings are grouped together by color. Other settings are available by clicking
the Parameter Group box and selecting a settings group.
3.
Enter the desired channel number in the Source Channel box. Channel information is
available in the corresponding OpenWorkbench file.
4.
Enter the desired number of rows to be displayed in the Raster Rows box.
5.
In the TimeRef Epoc Name box, select an epoch, or indexed, event. This will define the
Y-Axis.
245
OpenEx User's Guide
6.
In the Time Span box, enter a time stamp value for the maximum value of the X-axis.
This value should usually be the time span of the indexed event, according to the time
stamp.
7.
Click OK.
The raster plot is configured for viewing a single channel. The plot can be positioned and
resized using the mouse. When you animate or track data the plot will look like this:
To modify a raster plot to view multiple channels of data:
1.
Double-click the plot to display the Setup Properties dialog box.
2.
Enter 0 in the Source Channel box to ensure that all channels are available for viewing.
3.
In the Raster Rows box, enter the desired number of rows to be displayed. Enter 1 to
view one row per channel for a clear comparison across channels for a single event value.
4.
Select the Multi View Enabled check box.
5.
In the Num Views box, enter the total number of views required to see all available
channels of data in the multi view. This number will typically be the number of channels
of data acquired. By default channels will be displayed beginning with channel 1.
6.
Enter the number of columns to display in the Num Columns box.
7.
Click OK.
To modify a raster plot to view a range of channels:
1.
Double-click the plot to display the Setup Plot dialog box.
2.
Enter the total number of channels of data to be viewed in the Num Views box.
3.
By default channels will be displayed beginning with channel 1. To display multiple
channels beginning with another channel, modify the index offset.
4.
To modify the index offset value, click the Parameter Group box, and click Multi
View.
5.
In the View Index Offset box, enter the number of channels to offset.
6.
For example, to begin viewing from channel 5, enter an Index Offset value of 4. The plot
will begin with channel 5 and display the next sequential channels to equal the number
entered in the Num Views box.
7.
Click OK.
To modify a multi-channel raster plot to view by sort code:
246
1.
Double-click the plot to display the Setup Properties dialog box.
2.
Click the Parameter Group box, and click Multi View.
3.
In the View By box, select Sort Code from the drop down list.
4.
Update the Num Views and View Index Offset values as needed.
5.
Click OK.
OpenScope Reference
Creating XY Plots
XY plots provide a useful means of looking changes in two continuously varying values. In
OpenScope, the Y-axis and the X-axis are selected from available data events. The XY plot can be
used to plot positional information such as XY coordinates for an animal moving in a tank or it
can be used to plot data from an eye or head tracker.
This type of plot can also be used when the study subject needs to be in a specific position for
accurate data acquisition. The XY plot can help the user to quickly determine if there were any
significant changes in the subject’s position such as the head position relative to the position of a
sound or visual stimulus.
To quickly create an XY plot for a single channel of the selected data:
1.
Drag a data event from the Tank Select window to the grid area.
The Select Plot Type box opens.
2.
Click XY.
The XY plot is added to the grid area and the Setup Properties dialog box opens with the
most commonly used settings for the feature plot displayed.
Settings groups include:
Common - pg. 263
Data Source - pg. 263
Behavior - pg. 260
Multi View - pg. 256
Scaling - pg. 257
Refresh Control - pg. 257
X-Axis Setup - pg. 258
Y-Axis Setup - pg. 258
Appearance - pg. 193
Margins - pg. 189
Colors - pg. 256
247
OpenEx User's Guide
Related settings are grouped together by color. Other settings are available by clicking
the Parameter Group box and selecting a settings group.
3.
Enter the desired channel number in the Source Channel box. Channel information is
available in the corresponding OpenWorkbench file.
4.
Click the Source Name X-Axis box to select the desired data event for the X-axis. An
event selection box opens.
5.
Click the desired data event to select it, and click OK.
6.
In the Cloud Points box, enter the minimum number of points to be displayed. The plot
will refresh when the plot reaches twice the value set.
7.
Click OK.
The XY plot is configured for viewing a single channel of data. The plot can be
positioned and resized using the mouse.
After a single channel XY plot has been created, the settings can be quickly modified for multichannel viewing.
To modify a XY plot to view multiple channels of data:
1.
Double-click the plot to display the Setup Properties dialog box.
2.
Enter 0 in the Source Channel box to ensure that all channels are available for viewing.
3.
Select the Multi View Enabled check box.
4.
In the Num Views box, enter the total number of channels of data to be viewed.
By default channels will be displayed beginning with channel 1.To display multiple
channels beginning with another channel, modify the index offset.
5.
To modify the index offset value, click the Parameter Group value box, and click Multi
View.
6.
In the View Index Offset box, enter the number of channels to offset.
7.
For example, to begin viewing from channel 5, enter an Index Offset value of 4. The plot
will begin with channel 5 and display the next sequential channels to equal the number
entered in the Num Views box.
8.
Click OK.
Creating Feature Plots
Feature plots compare two waveform properties, such as the first and second peak voltages of two
candidate spikes. They are ideal for determining how many unique waveforms are present in a
signal.
In OpenScope the feature plot has been designed for examining patterns of spike waveforms. The
plot works best when viewing time stamped waveforms that are not continuous. In OpenEx this
type of data is also called snippet data. Although other waveforms can be viewed, plotting
complex waveforms with many points will require intensive amounts of computer time.
While the default feature of the Y-axis is the voltage of the second peak and the X-axis is the
voltage of the first peak, the X-axis and Y-axis features can be selected from a drop down list in
the Setup Properties dialog box. By generating multiple feature plots, each with different XY
characteristics, it is possible to differentiate several spike types. This information can then be used
to do offline or online spike sorting.
To quickly create a feature plot for a single channel of the selected data:
1.
Drag a data event from the Tank Select window to the grid area.
The Select Plot Type box opens.
248
OpenScope Reference
2.
Click Feature.
The feature plot is added to the grid area and the Setup Properties dialog box opens with
the most commonly used settings for the feature plot displayed.
Settings groups include:
Common - pg. 261
Data Source - pg. 263
Behavior - pg. 258
Multi View - pg. 256
Refresh Control - pg. 257
Scaling - pg. 257
X-Axis Setup - pg. 258
Y-Axis Setup - pg. 258
Appearance - pg. 193
Margins - pg. 189
Colors - pg. 256
Filtering - pg. 256
Related settings are grouped together by color. Other settings are available by clicking
the Parameter Group box and selecting a settings group.
3.
Enter the desired channel number in the Source Channel box. Channel information is
available in the corresponding OpenWorkbench file.
4.
In the Cloud Points box, enter the minimum number of points to be displayed. The plot
will refresh when the plot reaches twice the value set.
5.
If desired, select an X-axis and/or Y-axis feature from the drop down menus in the
corresponding value box. Select from Total Amplitude, Peak 1, Peak 2, Peak to Peak
Time, or Area.
6.
By default, Category Coloring is set to By SortCode and a different color will
automatically be assigned to each sort code. When data is not associated with a sort code
it will be assigned a gray color. If sort codes are not present in the data, change this
setting to None to display data points in a brighter color for easier viewing.
249
OpenEx User's Guide
7.
Click OK.
The feature plot is configured for viewing a single channel of data. The plot can be
positioned and resized using the mouse.
After a single channel feature plot has been created, the settings can be quickly modified for multichannel viewing.
To modify a feature plot to view multiple channels of data:
1.
Double-click the plot to display the Setup Properties dialog box.
2.
Enter 0 in the Source Channel box to ensure that all channels are available for viewing.
3.
Select the Multi View Enabled check box.
4.
In the Num Views box, enter the total number of views required to see all available
channels of data in the multi view. This number will typically be the number of channels
of data acquired. By default channels will be displayed beginning with channel 1.
5.
Enter the number of columns to display in the Num Columns box.
6.
By default, Category Coloring is set to By SortCode and a different color will
automatically be assigned to each sort code. When data is not associated with a sort code
it will be assigned a gray color. If sort codes are not present in the data, change this
setting to By Channel to display data points in brighter colors for easier viewing.
7.
Click OK.
After a multi channel feature plot has been created, the settings can be quickly modified for
viewing a range of channels.
To modify a scroll plot to view a range of channels:
1.
Double-click the plot to display the Setup Properties dialog box.
2.
Enter the total number of channels of data to be viewed in the Num Views box.
3.
By default channels will be displayed beginning with channel 1.To display multiple
channels beginning with another channel, modify the index offset.
4.
To modify the index offset value, click the Parameter Group value box, and click Multi
View.
5.
In the View Index Offset box, enter the number of channels to offset.
For example, to begin viewing from channel 5, enter an Index Offset value of 4. The plot
will begin with channel 5 and display the next sequential channels to equal the number
entered in the Num Views box.
6.
250
Click OK.
OpenScope Reference
Creating Chart Plots
Chart plots are an excellent way of graphing time stamped waveform data such as spike snippets.
Unlike raster plots that only show the position of the time stamp over a narrow range in the block,
the chart plot shows the snippet waveform and its exact position in the block of data.
In a chart plot the Y-axis is voltage and the X-axis is time in seconds. When the scale of the Xaxis is contracted the position of a snippet along the X-axis clearly identifies when in time the
snippets occurred and patterns of occurrence over time are emphasized. As the scale of the X-axis
is expanded the shape of the waveform becomes more visible.
To quickly create a chart plot for single channel of the selected data:
1.
Drag a data event from the Tank Select window to the grid area.
The Select Plot Type box opens.
2.
Click Chart.
The chart plot is added to the grid area and the Setup Properties dialog box opens with
the most commonly used settings for the chart plot displayed.
Settings groups include:
Common - pg. 260
Data Source - pg. 263
Behavior - pg. 258
Multi View - pg. 256
Refresh Control - pg. 257
Scaling - pg. 257
X-Axis Setup - pg. 258
Y-Axis Setup - pg. 258
Appearance - pg. 193
Margins - pg. 189
Colors - pg. 256
251
OpenEx User's Guide
Related settings are grouped together by color. Other settings are available by clicking
the Parameter Group box and selecting a settings group.
3.
Enter the desired channel number in the Source Channel box. Channel information is
available in the corresponding OpenWorkbench file.
4.
Enter the desired Time Span in seconds, to be displayed on the X-axis.
5.
Click OK.
The chart plot is configured for viewing a single channel. The plot can be positioned and
resized using the mouse. When you animate or track data the plot will look like this:
To quickly expand the X-axis scale and view a snippet waveform, hold down the SHIFT
key, point to the snippet, and drag to the right.
After a single channel chart plot has been created, the settings can be quickly modified for multichannel viewing.
To modify a chart plot to view multiple channels of data:
252
1.
Double-click the plot to display the Setup Properties dialog box.
2.
Enter 0 in the Source Channel box to ensure that all channels are available for viewing.
3.
Enter the desired Time Span in second, to be displayed on the X-axis.
4.
Selecting a shorter time span will improve animation performance for multiple channels.
When viewing the chart, the time span can be shortened or expanded by pressing and
holding the SHIFT key, and dragging right or left with the mouse.
5.
Select the Multi View Enabled check box.
6.
In the Num Views box, enter the total number of views required to see all available
channels of data in the multi view. This number will typically be the number of channels
of data acquired. By default channels will be displayed beginning with channel 1.
7.
Enter the number of columns to display in the Num Columns box. Leave this value set to
1 to see one channel per row.
8.
Click OK.
OpenScope Reference
When you animate or track data the plot will look like similar to this:
After a multi-channel chart plot has been created, the settings can be quickly modified for viewing
a range of channels.
To modify a chart plot to view a range of channels:
1.
Double-click the plot to display the Setup Properties dialog box.
2.
Enter the total number of channels of data to be viewed in the Num Views box.
3.
By default channels will be displayed beginning with channel 1. To display multiple
channels beginning with another channel, modify the index offset.
4.
To modify the index offset value, click the Parameter Group box, and click Multi
View.
5.
In the View Index Offset box, enter the number of channels to offset.
For example, to begin viewing from channel 5, enter an Index Offset value of 4. The plot
will begin with channel 5 and display the next sequential channels to equal the number
entered in the Num Views box.
6.
Click OK.
Creating Activity Plots
Activity plots are used to view the amount of spike (or other) activity occurring on a given channel
or group of channels. Activity plots make it easy to view spike counts or to compare spike rates
between acquisition channels. Activity plots use time stamped values from a variety of data Stores
for graphic presentation. The most common of these are snippets, but lists and even buffers can be
included as long as a time stamp is part of the acquired value. Users define the minimum and
maximum value to be displayed, assign a color to minimum and maximum, and choose a
parameter for refreshing the plot. As the plot is animated the color of an activity cell varies in
intensity across a range corresponding to the minimum and maximum defined values.
To quickly create an activity plot for combined data for all channels of the selected data:
1.
Drag a data event from the Tank Select window to the grid area.
The Select Plot Type box opens.
253
OpenEx User's Guide
2.
Click Activity.
The activity plot is added to the grid area and the Setup Properties dialog box opens with
the most commonly used settings for the activity plot displayed.
Settings groups include:
Common - pg. 260
Data Source - pg. 263
Behavior - pg. 258
Multi View - pg. 256
Refresh Control - pg. 257
Appearance - pg. 193
Margins - pg. 189
Colors - pg. 256
Related settings are grouped together by color. Other settings are available by clicking
the Parameter Group box and selecting a settings group.
254
3.
In the Refresh Epoch Name box, select an epoch, or indexed, event. This must be
selected to update the plot.
4.
In the Max Value box enter a number at least as large as the maximum activity (number
of spikes) anticipated.
5.
Click OK.
OpenScope Reference
The Activity plot is configured for viewing combined data for all channels. The plot can
be positioned and resized using the mouse. When you animate or track data the plot will
look similar to this:
Combined Data Activity Plot
with Activity Near Minimum Value
Combined Data Activity Plot
with Activity Near Maximum Value
After a combined data activity plot has been created, the settings can be quickly modified for
multi-channel viewing.
To modify an activity plot to view multiple channels of data:
1.
Double-click the plot to display the Setup Properties dialog box.
2.
Select the Multi View Enabled check box.
3.
In the Num Views box, enter the total number of views required to see all available
channels of data in the multi view. This number will typically be the number of channels
of data acquired. By default channels will be displayed beginning with channel 1.
4.
Enter the number of columns to display in the Num Columns box. Depending on the
design of your experiment you might want to view a pattern that is representative of the
physical or logical distribution of the channels. For example, if you had electrodes placed
in a 4 x 4 grid around the head then it would be useful to see that pattern in OpenScope.
Similarly, if you had electrodes in a linear pattern you might want to have either 1
column or 16 columns.
5.
Click OK.
When you animate or track data the plot will look similar to this:
After a multi channel activity plot has been created, settings can be modified to view by sort code.
To modify a multi-channel activity plot to view by sort code:
1.
Double-click the plot to display the Setup Properties dialog box.
2.
Click the Parameter Group box, and click Multi View.
3.
In the View By box, select Sort Code from the drop down list.
4.
Update the Num Views and View Index Offset values as needed.
5.
Click OK.
255
OpenEx User's Guide
Plot Settings Reference
About the Plot Settings Reference
The Plot Settings Reference corresponds to a parameter group in the properties dialog box.
How To Find These Settings
Settings in this reference are available in the properties dialog boxes.
To open the properties dialog box for a plot, double-click the plot in the grid area of OpenScope.
Colors Parameter Group
Category Coloring: Set how the trace colors will be applied.
None: The color set in the Trace Color value box will be applied to all traces.
By Channel: The color of traces will be automatically assigned by channel.
By Sortcode: The color of traces will be automatically assigned by sortcode.
Trace (or Dot) Color: Select the trace color from a color palette. This selected color is only used
if Category Coloring is set to None.
Plot Border Color: Select the plot border color from a color palette.
Foreground Color: Select the foreground color from a color palette.
Background Color: Select the trace color from a color palette.
Font Color: Select the font color from a color palette.
MultiChannel Grid Color: Select the multi-channel grid color from a color palette.
Filtering Parameter Group
Filter On: Select the check box to enable an FIR filter algorithm using FIR parameters provided
in CoefB0-B4. Clear the check box to disable the filter.
CoefB0: Type a coefficient.
CoefB1: Type a coefficient.
CoefB2: Type a coefficient.
CoefB3: Type a coefficient.
CoefB4: Type a coefficient.
Multi View Parameter Group
Multi-View Enabled: Select the check box to view each channel, or sort code, of data in an
individual plot.
256
OpenScope Reference
Num Views: Set the number of channels or sorts to view in a multi-view plot. If data contains
more than 16 channels or sorts the value must be increased to show all data.
Num Columns: Set the number of columns in which multi-view plots are arranged.
View By: Channel or Sort. Sorts are generated in the RPvdsEx circuit.
View Index Offset: Starting channel or sort is the View Index Offset value +1.
For example: To begin viewing data with channel 3, set the View Index Offset value at 2.
Show View Index: Index is Channel or Sort Code and is determined by the View By value.
Refresh Control Parameter Group
Refresh Epoch Name: Define the refresh epoch, or indexed event. Click the value box to view a
list of events. Valid choices are preceded by an epoch event icon. When a refresh epoch event
is defined the plot will be refreshed based on the epoch value according to the settings in the
Refresh Control parameter group.
Strobe Epoch Low Range: Set the low value for a range in which the plot will be refreshed
according to the defined refresh epoch. Leave at the default value of 0 if a range will not be used.
If the scalar value read from the tank for the defined refresh epoch event is greater than the Strobe
Epoch Low Range value then the plot is refreshed. If not, new data is added along with older data.
Strobe Epoch High Range: Set the high value for a range in which the plot will be refreshed
according to the defined refresh epoch. Leave at the default value of -1 if a range will not be used.
If the scalar value read from the tank for the defined refresh epoch event is less than the Strobe
Epoch High Range value then the plot is refreshed. If not, new data is added along with older data.
Refresh on Change: Select the check box to refresh the plot when the scalar value associated with
the defined refresh epoch changes.
This setting can be used with the range settings to create a range in which the plot will be
refreshed on change.
Refresh Period: Set a time value for the refresh period in seconds.
Scaling Parameter Group
X / Y-Axis Range: Type a value to set the range for the X / Y - axis.
X / Y-Axis Symmetry: Select the check box to ensure that a symmetrical X/Y-axis range will be
displayed. This is ideal for signals that are expected to be symmetrical.
Auto Scale: The plot can be set to automatically scale during animation to ensure that the data can
always be viewed in a convenient scale.
None: Auto Scale is turned off.
Active: The scale of the plot is automatically adjusted to ensure all values can be shown
on the plot.
Smart: The scale of the plot is automatically adjusted to ensure values can be shown on
the plot only during the first 3 seconds.
Up-Scale Hist.: When Auto Scale is used, this value sets the number of points above the Y-axis
range that the signal must reach before scaling will occur.
Down-Scale Hist.: When Auto Scale is used, this value sets the number of points below half of
the Y-axis range a signal must fall before scaling will occur.
257
OpenEx User's Guide
X-Axis Setup Parameter Group
Show X Labels: Select the check box to display a unit label for the x-axis. Clear the check box to
hide the x-axis label.
X-Axis Unit: Set name for units that will appear as part of the plot label.
X-Axis Units Factor: Define a multiplication factor to convert x-axis units to valid value for the
units label.
X-Axis Offset: Define the starting value for the x-axis.
Y-Axis Setup Parameter Group
Show Y Labels: Select the check box to display a unit label for the y-axis. Clear the check box to
hide the y-axis label.
Y-Axis Units: Set name for units that will appear as part of the plot label.
Y-Axis Units Factor: Define a multiplication factor to convert y-axis units to valid value for the
units label.
Behavior Parameter Group
Activity Behavior Parameters
Color at Min: Select the color to be displayed when activity is at defined Min Value. Color for
values between Min and Max Values are generated using a proportional mix of the defined Colors
at Min and Max.
Color at Max: Select the color to be displayed when activity is at defined Min Value. Color for
values between Min and Max Values are generated using a proportional mix of the defined Colors
at Min and Max.
Min Value: Enter the number of spike to be defined as the minimum value, which is represented
by the defined Color at Min.
Max Value: Enter the number of spike to be defined as the maximum value, which is represented
by the defined Color at Max.
Show Num Trace: Select the check box to display the number of events in the activity cell. Clear
the check box to hide the number label.
Chart Behavior Parameters
Time Span: Set the time range, in seconds and according to the time stamp, to be displayed on the
X-axis.
Feature Behavior Parameters
Cloud Points: Set the minimum number of points to display. The maximum number of cloud
points will be twice the value set. The plot will refresh when the maximum number is reached.
258
OpenScope Reference
X-Axis Feature: Select from a drop down list. Choices are Peak 1, Peak 2, Peak to Peak Time,
and Area.
Y-Axis Feature: Select from a drop down list. Choices are Peak 1, Peak 2, Peak to Peak Time,
and Area.
Histogram Behavior Parameters
TimeRef Epoch Name: Defines the epoch, or indexed event, that will be used for the raster rows.
Click the value box to view a list of events. Valid choices are preceded by an epoch event icon.
Respect TRef Duration: When checked the plot's X-axis scale is equal to the duration of the
epoch event selected in the TimeRef Epoch Name setting.
TRef Epoch Low Range: Use to set the low value for the X-axis range according to the defined
TimeRef epoch event. As data is animated, the next data will only be displayed if the associated
epoch event value is greater than or equal to the low range value. Leave at default value of 0 if a
range will not be used.
TRef Epoch High Range: Use to set the high value for the X-axis range according to the defined
TimeRef epoch event. As data is animated, the next data will only be displayed if the associated
epoch event value is less than or equal to the high range value. Leave at default value of -1 if a
range will not be used.
Time Span: Define the time span if the Respect TRef Duration check box is cleared. The X-axis
will be equal to the value set for Time Span divided by the value set for Bin Width.
Bin Width: Define the Bin Width. The X-axis will be equal to the value set for Time Span
divided by the value set for Bin Width.
Pile Behavior Parameters
Pile Depth: Set the minimum number of traces that will be displayed. The maximum number of
traces will be twice the value set. The plot will refresh when the maximum number is reached.
Raster Behavior Parameters
Raster Rows: Select the number of rows to display.
TimeRef Epoch Name: Defines the epoch, or indexed event, that will be used for the raster rows.
Click the value box to view a list of events. Valid choices are preceded by an epoch event icon.
Respect TRef Duration: When checked the plot's X-axis scale is equal to the duration of the
epoch event selected in the TimeRef Epoch Name setting.
TRef Epoch Low Range: Use to set the low value for the X-axis range according to the defined
TimeRef epoch event. As data is animated, the next data will only be displayed if the associated
epoch event value is greater than the low range value. Leave at default value of 0 if a range will
not be used.
TRef Epoch High Range: Use to set the high value for the X-axis range according to the defined
TimeRef epoch event. As data is animated, the next data will only be displayed if the associated
epoch event value is less than the high range value. Leave at default value of -1 if a range will not
be used.
Time Span: Define the maximum value of the X-axis using a time stamp value if the Respect
TRef Duration check box is cleared.
259
OpenEx User's Guide
Scroll Behavior Parameters
Scroll Sections: Set the number of sections to display before scrolling.
XY Behavior Parameters
Cloud Points: Set the minimum number of points to display. The maximum number of cloud
points will be twice the value set. The plot will refresh when the maximum number is reached.
Common Parameter Group
Activity Common Parameters
Source Name: Select the data event (Store name) from the currently selected tank.
Color at Min: Select the color to be displayed when activity is at defined Min Value. Color for
values between Min and Max Values are generated using a proportional mix of the defined Colors
at Min and Max.
Color at Max: Select the color to be displayed when activity is at defined Min Value. Color for
values between Min and Max Values are generated using a proportional mix of the defined Colors
at Min and Max.
Min Value: Enter the number of spike to be defined as the minimum value, which is represented
by the defined Color at Min.
Max Value: Enter the number of spike to be defined as the maximum value, which is represented
by the defined Color at Max.
Multi View Enabled: Enables multi view for viewing multiple channels. When multi view is
enabled, Source Channel should be set to 0.
Num Views: Select the number of channels or sort codes to view. By default, channels will be
displayed beginning with channel 1.
Num Columns: Select the number of columns to display.
Refresh Epoch Name: Define the refresh epoch, or indexed event. Click the value box to view a
list of events. Valid choices are preceded by an epoch event icon. When a refresh epoch event
is defined the plot will be refreshed based on the epoch value according to the settings in the
Refresh Control parameter group.
Chart Common Parameters
Source Name: Select the data event (Store name) from the currently selected tank.
Source Channel: Selects the channel for viewing. To view a single channel of data enter the
desired channel number. To view multiple channels set to 0 and enable multi view.
Time Span: Set the time range, in seconds and according to the time stamp, to be displayed on the
X-axis.
Multi View Enabled: Enables multi view for viewing multiple channels. When multi view is
enabled, Source Channel should be set to 0.
Num Views: Select the number of channels or sort codes to view. By default, channels will be
displayed beginning with channel 1.
Num Columns: Select the number of columns to display.
Category Coloring: Selects the trace coloring method. Traces can be seen in a single color
(None), one color per channel (By Channel), or one color per sort code (By SortCode).
260
OpenScope Reference
Feature Common Parameters
Source Name: Select the data event (Store name) from the currently selected tank.
Source Channel: Selects the channel for viewing. To view a single channel of data enter the
desired channel number. To view multiple channels set to 0 and enable multi view.
Cloud Points: Set the minimum number of points to display. The maximum number of cloud
points will be twice the value set. The plot will refresh when the maximum number is reached.
X-Axis Feature: Select from a drop down list. Choices are Peak 1, Peak 2, Peak to Peak Time,
and Area.
Y-Axis Feature: Select from a drop down list. Choices are Peak 1, Peak 2, Peak to Peak Time,
and Area.
Multi View Enabled: Enables multi view for viewing multiple channels. When multi view is
enabled, Source Channel should be set to 0.
Num Views: Select the number of channels or sort codes to view. By default, channels will be
displayed beginning with channel 1.
Num Columns: Select the number of columns to display.
Category Coloring: Selects the trace coloring method. Traces can be seen in a single color
(None), one color per channel (By Channel), or one color per sort code (By SortCode).
Histogram Common Parameters
Source Name: Select the data event (Store name) from the currently selected tank.
Source Channel: Selects the channel for viewing. To view a single channel of data enter the
desired channel number. To view multiple channels set to 0 and enable multi view.
TimeRef Epoc Name: Define the epoch, or indexed event, that will be used for the vertical bars.
Click the value box to view a list of events. Valid choices are preceded by an strobe/indexed
event icon.
Time Span: Define the time span. The X-axis will be equal to the value set for Time Span divided
by the value set for Bin Width.
Bin Width: Define the Bin Width. The X-axis will be equal to the value set for Time Span
divided by the value set for Bin Width.
Multi View Enabled: Enables multi view for viewing multiple channels. When multi view is
enabled, Source Channel should be set to 0.
Num Views: Select the number of channels or sort codes to view. By default, channels will be
displayed beginning with channel 1.
Num Columns: Select the number of columns to display.
Category Coloring: Selects the trace coloring method. Traces can be seen in a single color
(None), one color per channel (By Channel), or one color per sort code (By SortCode).
Pile Common Parameters
Source Name: Select the data event (Store name) from the currently selected tank.
Source Channel: Selects the channel for viewing. To view a single channel of data enter the
desired channel number. To view multiple channels set to 0 and enable multi view.
Pile Depth: Set the minimum number of traces that will be displayed. The maximum number of
traces will be twice the value set. The plot will refresh when the maximum number is reached.
261
OpenEx User's Guide
Multi View Enabled: Enables multi view for viewing multiple channels. When multi view is
enabled, Source Channel should be set to 0.
Num Views: Select the number of channels or sort codes to view. By default, channels will be
displayed beginning with channel 1.
Num Columns: Select the number of columns to display.
Category Coloring: Selects the trace coloring method. Traces can be seen in a single color
(None), one color per channel (By Channel), or one color per sort code (By SortCode).
Raster Common Parameters
Source Name: Select the data event (Store name) from the currently selected tank.
Source Channel: Selects the channel for viewing. To view a single channel of data enter the
desired channel number. To view multiple channels set to 0 and enable multi view.
Raster Rows: Select the number of rows to display.
TimeRef Epoc Name: Defines the epoch, or indexed event, that will be used for the raster rows.
Click the value box to view a list of events. Valid choices are preceded by an strobe/indexed
event icon.
Time Span: Define the maximum value of the X-axis using a time stamp value.
Multi View Enabled: Enables multi view for viewing multiple channels. When multi view is
enabled, Source Channel should be set to 0.
Num Views: Select the number of channels or sort codes to view. By default, channels will be
displayed beginning with channel 1.
Num Columns: Select the number of columns to display.
Category Coloring: Selects the trace coloring method. Traces can be seen in a single color
(None), one color per channel (By Channel), or one color per sort code (By SortCode).
Scroll Common Parameters
Source Name: Select the data event (Store name) from the currently selected tank.
Source Channel: Selects the channel for viewing. To view a single channel of data enter the
desired channel number. To view multiple channels set to 0 and enable multi view.
Scroll Sections: Selects the number of scroll sections to display.
Multi View Enabled: Enables multi-view for viewing multiple channels. When Multi View is
enabled, Source Channel should be set to 0.
Num Views: Select the number of channels or sort codes to view. By default channels will be
displayed beginning with channel 1.
Num Columns: Select the number of columns to display. Leave this value set to 1 to see one
channel per row.
Confine Plotting Data In Cell Boundary: When the checkbox is selected, plot data will not cross
its cell boundaries. When disabled, plot data can exceed the boundary.
Plotting Margin Percentage: Select a value to increase or decrease the margin percentage for
displaying data while multi view is enabled.
262
OpenScope Reference
XY Common Parameters
Source Name Y-Axis: Define the Event ID (Store name) for the Y-Axis of the plot. Click
display a list of available event IDs.
to
Source Channel: Set to 0 to display all channels. Set to a valid channel number to display a single
channel of data.
Source Name X-Axis: Define the Event ID for the X-Axis of the plot. Click
of available event IDs.
to display a list
Cloud Points: Set the minimum number of cloud points to display. The maximum number of
cloud points will be twice the value set. The plot will refresh when the maximum number is
reached.
Multi View Enabled: Enables multi view for viewing multiple channels. When multi view is
enabled, Source Channel should be set to 0.
Num Views: Select the number of channels or sort codes to view. By default, channels will be
displayed beginning with channel 1.
Num Columns: Select the number of columns to display.
Category Coloring: Selects the trace coloring method. Traces can be seen in a single color
(None), one color per channel (By Channel), or one color per sort code (By SortCode).
Data Source Parameter Group
Shared Data Source Parameters
Source Name: Define the Event ID (Store Name) for the plot. Click
available event IDs.
to display a list of
Source Channel: Set to 0 to display all channels. Set to a valid channel number to display a single
channel of data.
Sorting Code: Set to 0 if a sort parameter has not been defined or will not be used. Set to a valid
sort number to display a single sort.
Enabled: Clear the check box to disable the data definition for the plot.
XY Plot Data Source Parameters
Source Name Y-Axis: Define the Event ID (Store name) for the Y-Axis of the plot. Click
display a list of available event IDs.
to
Source Channel: Set to 0 to display all channels. Set to a valid channel number to display a single
channel of data.
Sorting Code: Set to 0 if a sort parameter has not been defined or will not be used. Set to a valid
sort number to display a single sort.
Source Name X-Axis: Define the Event ID (Store name) for the X-Axis of the plot. Click
display a list of available event IDs.
to
Enabled: Clear the check box to disable the data definition for the plot.
263
OpenEx User's Guide
~
264
OpenBrowser Reference
In the OpenBrowser Reference you will find:
A reference guide to the OpenBrowser Workspace and the basics of viewing and exporting data.
265
OpenEx User's Guide
~
266
OpenBrowser Reference
About OpenBrowser
OpenBrowser is a data export application for data stored in the OpenEx data tank format. This
flexible application is a client of the TTank server. When using OpenBrowser, data from one or
more data tanks can be selected, previewed, and exported to a standard ASCII file format or
formats compatible with NeuroExplorer™ or Plexon's Offline Sorter. When working in
OpenBrowser there are three steps in the data export process: data selection, data browsing, and
finally, data export.
Data Selection
Before data can be exported or viewed it must be selected. The desired tank, block, event, and
associated values are selected using a spreadsheet like interface and pop-up lists.
Data Browsing
Data can be previewed in a table or as a scroll plot. A time control window allows users to quickly
navigate data in the scroll plot view. Data can be viewed along with epoch data allowing the
researcher to modify data selections and create subsets of data on the fly.
Data Export
OpenBrowser provides for flexible data export. Several file formats are supported and users can
choose to export all data to a single file or to export subsets of data to separate files.
Workspace Basics
About the Open Browser Workspace
OpenBrowser includes a data viewing area and two collapsible sub-windows. A menu bar and
toolbar are provided for easy access to commands.
Data Selection Table
Window
Data View Area
Time Line Window
267
OpenEx User's Guide
Data Selection Table Window
The Data Selection Table window allows users to select events from a data tank. Data is selected
and arranged in rows based on the tank, block, event, and other associated variables. The Data
Selection Table window also allows users to design a custom configuration file that contains all
the export variables and information for a data row.
Data View Area
The data view area displays data selected in the Data Selection Table window. Data can be
displayed in either a scroll plot or table view. The scroll plot view displays the waveform data and
event times for time reference epochs and can be expanded and contracted using the Time Line
window. The table view displays data in a row and column format. In this view, data and time
stamp information can be copied and pasted into other applications such as Microsoft Excel. A
shortcut menu with Cut, Copy, and Paste commands is also available in this view.
Time Line Window
The Time Line window displays the block's timeline and allows users to move through the
selected data using the timeline.
Menus
OpenBrowser File Menu
Some Items on the OpenBrowser File menu are not available when running in OpenProject.
Note: To save changes to a file that is part of an OpenEx project, save the project.
268
Tank
Server
Opens the Select Server window.
New
Opens a new OpenBrowser file.
Open
Opens the Open dialog box so that an existing OpenBrowser file can be
opened.
Save
Saves the current OpenBrowser file with the current name. If the file has
not previously been saved, the Save As dialog box opens so that the file can
be named.
Save As
Opens the Save As dialog box so that the OpenBrowser file can be saved
with a new name.
Export
Current
Row
Exports the currently selected row.
Export
Selected
Rows
Exports multiple selected rows. Several adjacent rows can be selected by
holding down the SHIFT key and clicking the row numbers. Non-adjacent
rows can be selected by holding down the CTRL key and clicking the row
numbers.
OpenBrowser Reference
Export
All Rows
Exports all rows containing data.
Recently
Used Files
The fourth section of the File menu lists recently used files. Clicking a file
name opens the file.
Exit
Closes the OpenBrowser application.
OpenBrowser Edit Menu
Undo
Reverses the last action taken in the Data Selection Table window.
Cut
Cuts the selected row(s) in the Data Selection Table or cuts selected data
from the Data Table view.
Copy
Copies the selected row(s) in the Data Selection Table or copies selected
data in the Data Table view.
Paste
Pastes the most recently cut or copied row(s) in the Data Selection Table or
pastes data in the Data Table view.
Delete
Rows
Deletes the selected row(s) in the Data Selection Table. If no row is
selected the last row is deleted.
Insert
Rows
Inserts a row above the currently selected row in the Data Selection Table.
If no row is selected the row is added to the bottom of the table.
OpenBrowser View Menu
Toolbar
Toggles the toolbar between displayed and hidden.
Status Bar
Toggles the status bar between displayed and hidden.
Data View Table
Toggles the Data View window between Table view and Scroll Plot view.
Data Selection
Table
Toggles the Data Selection Table window between displayed and hidden.
Time Line
Toggles the Time Line window between displayed and hidden.
OpenBrowser Help Menu
About
OpenBrowser
Displays version and copyright information for OpenBrowser.
269
OpenEx User's Guide
Data Selection
About the Data Selection Table Window
The Data Selection Table arranges information in rows and columns. The first three rows define
the configuration properties for exporting the data and are separated from the data selection rows
by a header row. The data selection rows determine what data is available for export and display.
Each row can export data from a single tank, block, and event. To export data from multiple tanks,
blocks, or events; a new row of data must be added.
Tref: Check Boxes (Row 1)
This row allows users to select an epoch to be used as a time reference. When the check box in
this row is selected for an epoch, the time stamp of the event is based on its position relative to the
last epoch as opposed to the start of the block. This is particularly useful if the data is to be
exported to NeuroExplorer™ or Plexon's Offline Sorter.
Show: Check Boxes (Row 3)
Selecting the a check box in this row includes the associated column information, such as the
TANK, BLOCK, CHAN, SORT name and the associated TIME (time stamp), when the data is
exported or viewed in the Table view.
Multi-File: Check Box (Cell A3)
If the Multi-File check box is selected when data is exported then the data in each row will be
saved to a separate file.
Header Cells (Row 4)
This row displays the header names associated with a data tank. The first seven header names
(columns C - I) are standard for all tanks and cannot be changed. The cells under each column
header are used to access the associated variable type. Cells in columns J and greater can be used
to select epoch header names.
270
Column Header
Function
TANK
Select the tank for data access.
BLOCK
Select the block number.
OpenBrowser Reference
EVENT
Select the associated Store.
TIME
Select time stamp values.
CHAN
Enter a channel number or range of channels. Leaving this column blank
includes all channels.
SORT
Enter a sort code, or range of sort codes, associated with a snippet event.
DATA
Not implemented at this time.
...
Allows the user to select epoch variables to use as time stamp reference markers.
A row must be selected before an epoch can be selected. Right-click an empty
header cell to add an epoch.
Data Selection Cells (Rows 5 and Greater)
Users can fill multiple rows with data export information. For example, an experiment might
consist of a single block of data with multiple events. An OpenBrowser export file would consist
of a series of export rows each with different events and possible channels within an event. This
allows a user to configure an OpenBrowser file to organize how the data is exported.
Exp. Config Buttons (Column A)
Clicking the Exp. Config button for a row displays a dialog box that allows users to select how the
data in that row is exported.
Refresh! Buttons (Column B)
Clicking the Refresh! button for a row refreshes the View area with data for the selected row.
Using the Data Selection Table Window
The Data Selection Table can be used to select data and to prepare data for export.
Selecting Data
To use the Data Selection Table window; select the tank, block number, then event information for
the data to be viewed or exported. These three pieces of information must be selected in order, that
is, the tank must be selected before the block can be selected and the block must be selected before
the event can be selected. Each piece of information can be added by right-clicking the cell under
the appropriate column heading and then double-clicking the desired tank, block, or event from the
list in the selection window.
When selecting a tank, right-click in the cell under the Tank heading to bring up the Select Tank
dialog. By default, only registered tanks created with OpenEx 2.0 or greater will be shown in the
list. To select a tank in the list, single-click the tank name. To select an unregistered new format
tank, click the Open Existing Tank icon to open the Browse for Folder dialog and navigate to the
desired tank folder.
Note: Clicking OK out of this dialog selects the tank and also closes the Select Tank dialog.
271
OpenEx User's Guide
To display registered Legacy tanks, right-click in the Select Tank dialog window and select Show
Legacy Tanks. To select a tank in the list, single-click the tank name. To select an unregistered
Legacy tank, right-click in the Select Tank dialog window and click Find Legacy Tank to navigate
to the desired tank.
Epochs can be added to the table in the empty header cells (indicated by ellipses) and a single
epoch can be used as a time reference by selecting the Tref check box for the epoch column. See
Using Epochs as a Time Reference.
Once the first data selection row has been configured in the Data Selection Table, additional rows
with the same configuration can be added by copying and pasting the row to a blank row.
After the row has been copied, change the block or event name as needed. To change a cell value,
first delete the cell's current value, then right-click the cell to open a list of possible blocks or
events. Shorthand characters can also be used to simplify setting up multiple rows. See Using
Shorthand Characters for Data Selection, page 272 for more information.
Tip
When using copy and paste to add multiple rows of data, configure the first row for export first.
When it is copied and pasted the export configuration will also be included. Be sure to check one
or more of the Append File Name By check boxes to ensure that multiple rows saved to multiple
files will have unique names. See the Data Export book for more information on configuring data
for export.
Adding Rows
To add a row click the Edit menu, and click Insert Rows.
Deleting Rows
To delete selected rows, click the Edit menu and click Delete Rows. To select a row click the row
number. Use the SHIFT or CTRL keys to select multiple rows.
Controlling the Data View Area
After a tank, block number, and event have been associated with the row the user can click on
Refresh! to view the data in the View area.
Configuring Data for Export
The Exp. Config buttons for each row provide easy access to the Data Format Export
Configuration dialog box. After a row has been configured for export, the text on the Exp.Config
button changes from gray to blue. When exporting more than one row, use the Multi-File check
box to determine if each row of data will be exported to a separate file or if all data will be
exported to one single file.
Using Shorthand Characters for Data Selection
A series of shorthand characters can be used to speed up data selection in the Data Selection
Table.
^
272
Indicates that the value in the cell above will be used for this cell. For
example, placing a caret in a cell in the TANK column will cause the row to
acquire data from the tank named in the row above.
OpenBrowser Reference
^+
Used with BLOCK, CHAN, and SORT cells. It will increment the BLOCK,
CHAN, or SORT number by one, relative to the cell above it.
>
Used with TIME CHAN, SORT, and epoch cells. Channels that are greater
than the cell value are viewed and exported. For example, >3 selects channel
or sort values greater than 3.
<
Used with TIME, CHAN, SORT, and epoch cells. Values that are less than
the cell value are viewed and exported.
:
Used with TIME, CHAN, SORT, and epoch cells. Values in the named
range are viewed and exported. For example, if a cell in the CHAN column
contained the statement 3:10 then channels 3 through 10 would be viewed
and exported.
In the example below, data would be exported from tank nefw, blocks 45 and 46, and all SPKE
and SSPK events (including all channels). Note how that ^+ is only used once for the BLOCK
cell for SPKE in row 7. If the BLOCK cell for the SSPK event in row 8 used a ^+, the data would
have come from block 47.
Using Epochs as a Time Reference
The Data Selection Table allows users to select an epoch to be used as a time reference. Using a
time reference epoch starts the time value at zero for each epoch and allows the time code
information to be used to generate PSTH and other graphs in NeuroExplorer and other analysis
applications.
273
OpenEx User's Guide
To add a time reference:
1.
Select the Tref check box (in Row 1) for an empty epoch column. The header for an
empty epoch column contains an ellipse.
2.
Select a row containing data selection information for the tank, block, and event. To
select a row click the row number.
3.
In the Header row, right-click the cell (containing an ellipse "...") for that column. This
will open an event selection dialog box. The available epoch events are listed (that is,
available in the tank named in the TANK column for the currently selected row).
4.
To select the epoch to be used as a time reference, double-click the epoch in the list.
Additional epochs can be added to subsequent columns; however, only one time
reference epoch can be active at a time.
Note: A specific value or range of values can be selected using the epoch cell for a row. For
example, entering ">1000" in an epoch cell will limit the epoch values used to those greater than
1000. A single value may be selected by entering a number without a modifier, such as "1000".
See the Using Shorthand Characters, page 272 for more information.
The active time reference determines the zero time for the time stamps. When the Show check box
is selected for an epoch column the epoch will be included in the view area for any row that is
refreshed. It will be displayed above the data in the scope plot view or show as a separate column
in the data table view.
274
OpenBrowser Reference
Data Browsing
About the Data View Area
The Data View area allows table or graphic visualization of tank data from a selected row. To
switch between table and scroll plot views, select or clear the Data View Table option on the View
menu.
Scroll Plot View
The scroll plot displays waveform or scalar data from an event as well as the associated scalar
information from epochs. Epochs are displayed above the event data. In the scroll plot below, an
epoch (Freq) associated with the time line is shown above the event (Snip) line.
To modify which epochs are displayed, choose the Show check box for the event column in the
Data Selection Table window.
To move about the Scroll plot, select the marker in the Time Line window and move it to the time
stamp or event of interest. The time range can be expanded or contracted to give additional detail
about the waveforms using the Time Line window.
Table View
In table view the variables selected in the Show row of the Data Selection Table window are
displayed. The time stamp associated with the event and any associated epochs are displayed. If
Tref is selected in the Data Selection Table window the time stamps displayed will be relative to
the start of the epoch.
275
OpenEx User's Guide
To determine which variables such as block number, tank name, time stamp, and epochs are
displayed, choose the corresponding Show check boxes in the Data Selection Table window.
All data can be copied and pasted from the table to a Microsoft Word document or Excel
spreadsheet. To copy the data, select the range of cells, right-click the selected cells, and click the
Copy command on the shortcut menu. To paste the data into another application, go to that
application and press CTRL+V.
In the example below the event, time stamp (in this case the spike times), channel number, and
epochs are displayed.
Using the Time Line Window
The Time Line window provides a timeline and vertical line indicator that moves as data is
animated in the Scroll Plot view of the Data View area. The Time Line window can also be used
to move to a particular time or event in the Data View area. Epoch events that are included in the
selected data area are also added to the window. The Time Line window gives a precise
description of when data was collected.
276
OpenBrowser Reference
Timeline by Time Stamps
The current time stamp.
Moves the indicator back by time stamps.
Moves the indicator forward by time stamps.
Scale Controls
Expands scale in small steps.
Shrinks scale in small steps.
Expands scale in large steps.
Shrinks scale in large steps.
Timeline by Events
The name of the event displayed on the corresponding line.
Moves the indicator back by events.
Moves the indicator forward by events.
The current event value.
277
OpenEx User's Guide
Data Export
Exporting Tank Data
The primary function of OpenBrowser is to export data from the tank to other data formats.
OpenBrowser can export to several common file formats: ASCII, NEX, and PLX. The standard
ASCII format allows users to export data in a format readable by most statistical and graphic
packages as well as Microsoft Excel spreadsheets. OpenBrowser can also export directly to the
NEX format for import to NeuroExplorer™ or the PLX format for use with Plexon's Offline
Sorter.
Note: The NEV export function is no longer supported.
Export From the File Menu
The File menu provides the following three choices for exporting data:
Export Current Row: Exports the currently selected row.
Export Selected Rows: Exports multiple selected rows.
Export All Rows: Exports all rows containing data.
Before data can be exported using these commands it must be selected and configured for export.
Data is selected using the Data Selection Table window. When multiple rows of data have been
selected the user can choose to export multiple rows to a single file or to export each row to a
separate file. Single or Multi-File export is determined using the Multi-File check box in the Data
Selection Table window. If exporting to multiple files, each row must be configured before the
export process begins. Individual rows of data can be configured for export at any time using the
Exp. Config buttons. If exporting to a single file, the export configuration can be defined during
the export process. If the export configuration has not been completed prior to export, the Data
Export Format Configuration dialog box will be displayed during the export process.
Exporting From the Data Table View
The data in the data table can be copied and pasted directly to a Microsoft Excel spreadsheet. This
will save all the information about blocks, events, time stamps, channel, sort, and Epoch
information displayed in the table view. It does not export the waveform data.
Using The Data Export Format Configuration
Dialog Box
The Data Export Format Configuration dialog box is used to configure data for export before or
during the export process.
To open the Data Export Format Configuration dialog box, click the Exp. Config button for a row.
The settings available depend on the export format selected in the File Type box in the upper left
corner of the dialog box.
After the export settings are configured, clicking the Save button stores the export information for
future use and the color of the Exp. Config button text changes to blue.
278
OpenBrowser Reference
File Type Drop Down Menu
ASCII Export Settings
Column Delimiter: data is exported with the specified separators between columns.
COMMA: each value is separated by a comma. This is the default Excel importing
format.
TAB: each value is separated by a tab.
RETURN: each value is separated by a return character.
Row Delimiter: data is exported with the specified separators between rows.
RETURN: each row is separated by a return character (most common).
TAB: each row is separated by a tab.
COMMA: each row is separated by a comma.
Max Col Width: maximum number of columns in a row. When the maximum number is reached,
a row delimiter is generated. To ensure the integrity of exported data when viewed in the target
application, set the Max Col Width for that application before export.
In applications, like Excel, that have a maximum number of columns, exceeding the application's
maximum number of columns might cause problems when the exported data is opened in the
target application. Problems might include truncated data display, automatically generated and
undesirable row decimeters, and so forth. For example, if the user attempts to open an export file
with more than 248 data samples in Microsoft Excel (which is limited to 256 cells in a row), the
excess samples will be discarded and Excel will generate a "File not loaded completely" message.
Note that the reason the maximum number is 248 is that at least six columns out of the 256 are
used for other information such as block, event, time stamps, and so forth. If more than six
columns are used before the data columns, then there will be fewer columns available for data. See
also Number of data subsections, page 280 for more information.
Significant Digits: number of digits saved for each value starting with the first non-zero digit.
This parameter is applied to time stamps as well as data.
Hide Title: hides the first row with the column descriptions.
Raw Data Only: saves only the signal data and discards all of the other details like tank name,
block name, event, time, sampling frequency, and number of points.
Output File Name: allows the user to browse to and set the location and name for the output
file(s).
279
OpenEx User's Guide
Append File Name By ...: appends the block, event, channel number, and/or row number of the
exported data to the output file name. This is very useful when the Multi-File option is selected.
Number of data subsections: used to divide the data samples into subsections. By default, each
data set is stored in a single row with the tank name, block name, and so forth at the beginning of
the row. Specifying subsections allows the data to be stored using several rows. Each row (or
subsection) includes the header information such as tank name, block name, followed by a subset
of data samples.
This option is useful when loading a data file with a large number of samples. For example, if the
user intends to work with exported data in Excel then each row must be limited to no more than
256 cells. A file with 300 points in each record can be exported specifying 2 subsections to create
two rows dedicated to each record, each with 150 sample points. This would ensure that the
maximum number of cells per row is not exceeded and creates a file with a consistent set of row
headers at the beginning of each row. See also Max Col Width, page 279 for more information.
Transpose output (data in columns): transposes columns to rows so that each column is a data
set (by default, OpenEx data is saved in rows). This option can be used when exporting a data file
containing a large number of samples for use with Microsoft Excel. By saving data in columns the
user avoids limitations in the maximum number of cells possible in a row.
PLX Export Specific Settings
Export epoch events as plx strobe events: used to display epoch events as strobe events in
NeuroExplorer™. Not used when exporting for use with Plexon's Offline Sorter.
Gain (for spike waveform, in K): used with Scaling Factor to scale spike data for viewing in
Offline Sorter. Recommended value is 1. Values can be from 1 to 32.
Spike Scaling Factor (Floating Point to µV): used with Gain to scale spike data for viewing in
Offline Sorter.
Gain (for continuous waveform): used with Scaling Factor to scale continuous data for viewing
in Offline Sorter. Recommended value is 1. Values can be from 1 to 32.
Stream Scaling Factor (Floating Point to µV): used with Gain to scale continuous data for
viewing in Offline Sorter.
Comment: 256 character comment line.
Output File Name: allows the user to browse to a network or local folder and saves the file with a
set name.
Note: See Exporting to PLX, page 284 for detailed information on using PLX Export Specific
Settings.
280
OpenBrowser Reference
Append File Name By ...: allows the user to select to automatically add the block, event, channel
number, and/or row number of the exported data to the saved file name. This is very useful when
the Multi-File option is selected.
NEX Export Specific Settings
Quant Factor (mV per LSB): Sets the millivolt range for the Least Significant Bit of the NEX
format. The default value has been set to insure that the data is exported correctly. Changing the
default settings can cause data to be read incorrectly by NeuroExplorer™.
Scaling Factor (to convert Tank Data to µV): Not used.
Comment: 256 character comment line.
Append Event Name by Channel #: allows the user to select to automatically add the channel
number to the event name.
Output File Name: allows the user to browse to a network or local folder and saves the file with a
set name.
Append File Name By ...: allows the user to select to automatically add the block, event, channel
number, and/or row number of the exported data to the saved file name. This is very useful when
the Multi-File option is selected.
Note: The NEV export function is no longer supported.
NsN Export Specific Settings
For more information regarding the NeuroShare Native (NsN) file format, refer to the NeuroShare
website at: http://neuroshare.sourceforge.net/index.shtml
Output File Name: specifies the path and filename for the exported *.nsn file.
File Type Descriptor: specifies the file extension for the exported data file. This should be set to
.nsn.
Time Stamp Resolution: minimum timestamp resolution in seconds.
Digitization Scaling Factor (in nV): not used
Scaling Factor (to Convert Tank Data to µV): scale factor used for buffer (type 2), snippet (type
4), or continuous (type 5) data. Recommended value is 1.
Scaling Factor (to Convert Event Tank Data): scale factor used for scalar (type 1) or list (type
3) data. Recommended value is 1.
File Comment: 256 character comment line.
281
OpenEx User's Guide
Min Input Signal: minimum possible value of the input signal in Volts.
Max Input Signal: maximum possible value of the input signal in Volts.
Units: Enter a text value to specify the recording units of measurement.
Input Signal Resolution: minimum input step size that can be resolved. To obtain the signal
resolution divide the voltage range by the number of bit values. E.g. for a +/- 1 Volt 16-bit ADC
this value is 2 / 216 or 0.0000305.
X Location: optional text information about the X coordinate of source in meters.
Y Location: optional text information about the Y coordinate of source in meters.
Z Location: optional text information about the Z coordinate of source in meters.
High Freq Cutoff: high frequency cutoff in Hz of the source signal filtering.
High Freq Order: order of the filter used for high frequency cutoff.
High Freq Filter Type: optional text information to describe the type of filter used for high
frequency cutoff.
Low Freq Cutoff: low frequency cutoff in Hz of the source signal filtering.
Low Freq Order: order of the filter used for low frequency cutoff.
Low Freq Filter Type: optional text information that describes the type of filter used for low
frequency cutoff.
Probe Info: optional text information about the signal source.
Exporting to ASCII
Exporting to the standard ASCII format allows users to access data in a format readable by most
statistical and graphic packages as well as Microsoft Excel spreadsheets. When data is exported in
the ASCII format, the first six columns always denote the block name, event, time stamp, channel,
sampling frequency, and number of points in each record. Subsequent columns contain actual data.
Additional columns may be added before data columns to store information such as subsections,
epoch events. The first row contains header information (describing the data stored in each
column, such as BLOCK, EVENT, TIME, and so forth) for each column.
282
OpenBrowser Reference
Export to Multiple Files
1.
When exporting to multiple files, ensure that the Multi-File check box in cell A3 of the
Data Selection Table window is checked.
2.
Configure each row for export. To configure a row for export:
a.
Click the Exp. Config button for the desired row.
b.
In the Data Export Format Configuration dialog box, ensure that ASCII is
selected in the File Type box.
c.
Browse button to the right of the Output
Name the export file. Click the
File Name box. The Open dialog box is displayed.
d.
Browse to the desired file location. When using OpenBrowser within
OpenProject the default location will be the UserFiles folder for the current
project.
e.
Type a file name in the File Name box and click Open. You can type individual
names for each row/file or use the same base file name for all rows/files. If you
use a base name be sure to use the Append File Name by check boxes. If two or
more rows attempt to write to exactly the same file, data will be overwritten.
f.
If desired, select one or more of the Append File Name By check boxes to
include block, channel, event, or row information in the file name.
g.
Modify any other settings as desired.
h.
Click Save.
3.
Repeat for each row to be exported. To save time, complete the export configuration
during the data selection process. That way if you use copy and paste to add rows the
export configuration will also be copied. Be sure to use one or more of the Append File
Name By check boxes to ensure that each row ill have a unique file name.
4.
If exporting only selected rows, select the rows to export and click Export Selected
Rows on the File menu.
5.
If exporting all rows, click Export All Rows on the File menu.
6.
Review the messages in the Export Status dialog box and click OK.
Export to a Single File.
1.
When exporting to a single file, ensure that the Multi-File check box in cell A3 of the
Data Selection Table window is not checked.
2.
If exporting a single row, select the row and click Export Current Row on the File
menu.
3.
If exporting only selected rows, select the rows to export and click Export Selected
Rows on the File menu.
4.
If exporting all rows, click Export All Rows on the File menu.
5.
In the Data Export Format Configuration dialog box, ensure that ASCII is selected in the
File Type box.
6.
Browse button to the right of the Output File Name box. The Open dialog
Click the
box is displayed.
7.
Browse to the desired location for the data file. When using OpenBrowser within
OpenProject the default location will be the UserFiles folder for the current project.
8.
Type a file name in the File Name box and click Open.
9.
Modify any other settings as desired.
283
OpenEx User's Guide
10. Click Export.
11. Review the messages in the Export Status dialog box and click OK.
Exported Data Viewed in Microsoft Excel
Exporting to PLX
OpenBrowser can export directly to the PLX format for use with Plexon's Offline Sorter and Wave
Tracker. Data exported in PLX format can also be viewed with NeuroExplorer™. For researchers
who use several different analysis packages, exporting to the PLX format eliminates the need to
export data in several different formats. The PLX export has been streamlined to provide the user
with both flexibility and ease of use.
Note: Use Offline Sorter version 2.5 or greater, if possible. Earlier versions of Offline Sorter
might be unable to import OpenEx Stream data. The latest version of Offline Sorter is available at
http://www.plexoninc.com/Software_downloads.htm.
When tank data is exported to PLX format it must be scaled to match the requirements of the new
format. This is done using two parameters; a scaling factor that scales the signal to the correct
range and a gain factor that sets the units (mV, µV). Because Offline Sorter and Wave Tracker
handle streamed data and spike data differently, users must set separate scaling factors and gain
settings for each type of data. Once these values have been set, OpenBrowser automatically
ensures that streamed data and spike data are exported correctly.
Before beginning the export process users should:
1.
Ensure that block size for each waveform is less than 256.
Data that will be exported for use with Offline Sorter or Wave Tracker should have a
block size (in the OpenEx Header) of less than 256 samples.
2.
Determine if the PLX data will be used in NeuroExplorer™.
The PLX export configuration settings include an Export epoch events as plx strobe
events check box. If the data will be viewed in NeuroExplorer™, this check box must be
selected. If NeuroExplorer™ will not be used, the check box may be left cleared.
3.
Determine the highest absolute value in the data set.
The highest value is used to calculate the scaling factor for export. It is an absolute
number and can be approximated. An approximate value for the highest number can be
determined at a glance when viewing the data set in the OpenBrowser preview plot.
284
OpenBrowser Reference
Simply refresh the data then view the scale values. Because the plot scales automatically,
the maximum scale value is a good approximation of the maximum value in the data set.
4.
Select a Gain setting.
Gain is expressed as an integer from 1 to 32. The gain is used to display data in Offline
Sorter or Wave Tracker using the correct units, such as µVs. When unit information is
not important, the gain can be safely set to 1 to simplify the formula for determining the
scaling factor.
5.
Calculate Scale Factor for Stream and/or Snippet data.
The scaling factor can be determined using the following formula, where G = gain, SF =
scaling factor, and H# = the highest absolute value in the data set. Note that when
processing spike data, setting the gain to 1, and the scale factor to 1 x 10⁶ is usually
acceptable.
For streamed data: SF x G = 5 x 10⁶ / H#
For spike data: SF x G = 3 x 10³ / H#
To better understand how the SF * G formulas are derived, begin by considering these facts:
Data collected in OpenEx are stored as floating point values while Offline Sorter expects
data stored as 12-bit signed integers. A 12-bit signed integer yields a maximum value of
2047.
In Offline Sorter, the maximum voltage for streamed data is 5 Volts and the maximum
voltage for spike data is 3 Volts.
OpenEx data is typically viewed in the microvolt range (1e-6).
OpenBrower uses a user-specified scaling factor (SF) and gain (G) when exporting tank
data to a PLX format.
For the highest value (H#) in the tank data, the specified SF and G must yield a value that can be
expressed within Offline Sorters dynamic range. This can be expressed as:
H# * SF * 1e-6 * 2048 * G / 5 < 2048
Export to Multiple Files
1.
When exporting to multiple files, ensure that the Multi-File check box in cell A3 of the
Data Selection Table window is checked.
2.
Configure each row for export. To configure a row for export:
a.
Click the Exp. Config button for the desired row.
b.
In the Data Export Format Configuration dialog box, ensure that PLX is
selected in the File Type box.
c.
Enter the appropriate gain and scaling factor for the data type being exported in
the current row.
d.
Browse button to the right of the Output
Name the export file. Click the
File Name box. The Open dialog box is displayed.
e.
Browse to the desired file location. When using OpenBrowser within
OpenProject the default location will be the UserFiles folder for the current
project.
285
OpenEx User's Guide
f.
Type a file name in the File Name box and click Open. You can type individual
names for each row/file or use the same base file name for all rows/files. If you
use a base name be sure to use the Append File Name by check boxes. If two or
more rows attempt to write to exactly the same file, data will be overwritten.
g.
If desired, select one or more of the Append File Name by check boxes to
include block, channel, event, or row information in the file name.
h.
Modify any other settings as desired.
i.
Click Save.
3.
Repeat for each row to be exported. To save time, complete the export configuration
during the data selection process. That way if you use copy and paste to add rows the
export configuration will also be copied. Be sure to use one or more of the Append File
Name by check boxes to ensure that each row ill have a unique file name.
4.
If exporting only selected rows, select the rows to export and click Export Selected
Rows on the File menu.
5.
If exporting all rows, click Export All Rows on the File menu.
6.
Review the messages in the Export Status dialog box and click OK.
Export to a Single File
Note: if exporting multiple channels to a single PLX file for use in Offline Sorter's Tetrode Mode,
use a single row, not different rows for each channel.
1.
When exporting to a single file, ensure that the Multi-File check box in cell A3 of the
Data Selection Table window is not checked.
2.
If exporting a single row, select the row and click Export Current Row on the File
menu.
3.
If exporting only selected rows, select the rows to export and click Export Selected
Rows on the File menu.
4.
If exporting all rows, click Export All Rows on the File menu.
5.
In the Data Export Format Configuration dialog box, ensure that PLX is selected in the
File Type box.
6.
Enter the gain and scaling factor for each type of data to be exported.
If both streamed and snippet data are being exported to the same file, values can be
specified for each type of data in a single export configuration dialog box. If only one
type of data is being exported, only the gain and scaling factor for that data type will be
used and the others will be ignored.
However, keep in mind that all rows of a particular data type will be exported using the
same gain and scaling factor. If two rows of the same data type are dissimilar they might
need to be exported separately.
7.
Browse button to the right of the Output File Name box. The Open dialog
Click the
box is displayed.
8.
Browse to the desired location for the data file. When using OpenBrowser within
OpenProject the default location will be the UserFiles folder for the current project.
9.
Type a file name in the File Name box and click Open.
10. Modify any other settings as desired.
11. Click Export.
12. Review the messages in the Export Status dialog box and click OK.
286
OpenBrowser Reference
Troubleshooting the Export Process
The following table will help users identify common errors that might occur during the export
process.
Symptom
Problem
OpenBrowser crashes during export
This usually indicates that an error was
made in calculating the scaling factor
Data seems to small or too large in Offline
Sorter/Wave Tracker
An error was made in calculating the
scaling factor
Data is displayed with the wrong units in
Offline Sorter/Wave Tracker
An error was made in selecting a Gain
setting
Offline Sorter/Wave Tracker displays a
message that states that the user needs
OfflineSorterLong.exe.
This usually indicates that the block
size for exported data was greater than
256 samples.
Epoch events are not recognized as strobe
events in NeuroExplorer™.
The Export epoch events as plx strobe
events check box was not selected
during export.
Events are named incorrectly in
NeuroExplorer™.
The Export epoch events as plx strobe
events check box was not selected
during export.
Exporting to NEX
OpenBrowser can export directly to the NeuroExplorer™ NEX format.
Export to Multiple Files
1.
When exporting to multiple files, ensure that the Multi-File check box in cell A3 of the
Data Selection Table window is checked.
2.
Configure each row for export. To configure a row for export:
a.
Click the Exp. Config button for the desired row.
b.
In the Data Export Format Configuration dialog box, ensure that NEX is
selected in the File Type box.
c.
Browse button to the right of the Output
Name the export file. Click the
File Name box. The Open dialog box is displayed.
d.
Browse to the desired file location. When using OpenBrowser within
OpenProject the default location will be the UserFiles folder for the current
project.
e.
Type a file name in the File Name box and click Open. You can type individual
names for each row/file or use the same base file name for all rows/files. If you
use a base name be sure to use the Append File Name by check boxes. If two or
more rows attempt to write to exactly the same file, data will be overwritten.
f.
If desired, select one or more of the Append File Name by check boxes to
include block, channel, event, or row information in the file name.
287
OpenEx User's Guide
g.
Modify any other settings as desired.
h.
Click Save.
3.
Repeat for each row to be exported. To save time, complete the export configuration
during the data selection process. That way if you use copy and paste to add rows the
export configuration will also be copied. Be sure to use one or more of the Append File
Name by check boxes to ensure that each row ill have a unique file name.
4.
If exporting only selected rows, select the rows to export and click Export Selected
Rows on the File menu.
5.
If exporting all rows, click Export All Rows on the File menu.
6.
Review the messages in the Export Status dialog box and click OK.
Export to a Single File
1.
When exporting to a single file, ensure that the Multi-File check box in cell A3 of the
Data Selection Table window is not checked.
2.
If exporting a single row, select the row and click Export Current Row on the File
menu.
3.
If exporting only selected rows, select the rows to export and click Export Selected
Rows on the File menu.
4.
If exporting all rows, click Export All Rows on the File menu.
5.
In the Data Export Format Configuration dialog box, ensure that NEX is selected in the
File Type box.
6.
Browse button to the right of the Output File Name box. The Open dialog
Click the
box is displayed.
7.
Browse to the desired location for the data file. When using OpenBrowser within
OpenProject the default location will be the UserFiles folder for the current project.
8.
Type a file name in the File Name box and click Open.
9.
Modify any other settings as desired.
10. Click Export.
11. Review the messages in the Export Status dialog box and click OK.
Single Vs. Multi-File Export
The user can determine if data will be exported to multiple files or a single file using the MultiFile check box in the Data Selection Table window.
Single File Export
If the Multi-File check box is not checked (cell A3) all data is exported to a single file. To use this
export function the rows do not have to have been configured before the export process begins.
The Data Export Format Configuration dialog box will be displayed during export, giving the user
an opportunity to complete configuration. If a single row is selected and has been configured, the
dialog box will show the output format for that row. If multiple (or all) rows have been selected
the dialog box will display the output format for the first row.
Note: error messages will occur if a row has no data in it.
288
OpenBrowser Reference
Multi-File Export
If the Multi-File check box has been selected each row of data will be saved to a separate file.
Each row can have a unique file format. Rows must be configured for export using the Data
Export Format Configuration dialog box prior to the export process.
When the export process begins the selected rows are immediately stored to files based on the
export configuration format specified. If rows are not configured for export a warning message is
displayed in the Export Status dialog, starting with the first row that could not be exported.
289
OpenEx User's Guide
~
290
TTank Reference
In the TTank Reference you will find:
An overview of the Tank Monitor workspace.
291
OpenEx User's Guide
~
292
TTank Reference
The Tank Monitor Workspace
The Tank Monitor workspace provides quick and easy access to TTank. Users can view
information about TTank activity or perform basic maintenance such as creating new tanks and
registering or unregistering existing tanks. The upper right corner of the workspace displays basic
information about the tank selected in the Tank box.
Server Box
In the Server box users can select the server where data tanks can be found or created. In many
cases the server will be on the same PC that controls the hardware devices (Local). A green arrow
will appear to the left of the server name to indicate that it is selected.
Commands for common tasks such as adding, testing, and removing a server are available from a
shortcut menu by right-clicking in the Server box.
Tank Box
In the Tank box users can select or a tank, create a new tank and register or unregister existing
tanks. By default, the Tank window list only contains registered tanks that were created with
OpenEx 2.0. Right-click in the tank window to bring up a shortcut menu.
293
OpenEx User's Guide
Registered Tank
Unregistered Tank
Registered Legacy Tank
Unregistered Legacy Tank
Browse for Tank
Browse for folder.
Create New Tank
Opens the Select Tank file dialog box so that a tank can be
added. Add Data Tank.
Register Tank
Adds the selected tank tot he Windows Registry.
UnRegister tank
Removes the selected tank from the Windows Registry. The tank
can still be used on the local machine.
Test Tank
Tests the connection to the server and opens and closes the tank
file.
Reset Tank
Resets the selected tank file.
Show Full Path
Toggles detail view on and off. In details view the path to the
tank is displayed.
Refresh Tank List
Refreshes the Tank box display.
Show Legacy Tanks
Displays registered legacy format tanks in the tank list.
Find Legacy Tanks
Opens the Select Tank File dialog box and allows users to browse
for tanks stored in the legacy format by showing files with a .tbk
file extension.
Opening an Existing Tank - To open an existing new format tank that is not listed in the tank
window, click the Open Existing Tank icon
to open the Browse for Folder dialog and
navigate to the desired tank folder. Note: Clicking OK out of this dialog selects the tank and also
closes the Select Tank dialog. To open an existing legacy tank, right-click and select Find Legacy
Tank.
294
TTank Reference
Creating a New Tank - To create a new format data tank, click the Create New Tank icon
.
This opens the Add Data Tank dialog. Select a path for the data tank folder and provide a unique
name for the tank.
Registering/Unregistering a Tank - Users can register or unregister a tank by right-clicking in
the Tank box and selecting the appropriate option from the shortcut menu. These actions can be
performed on new format and legacy format tanks. Unregistering a tank does not delete the tank
files however, only registered tanks will be listed in the Tank window.
Debug Box
Select the Debug Active check box to see detailed information about tank activity.
Accessing a Tank on Another PC
The TTank server stores and access data in the DataTank. The tank can be accessed across a
network, providing the flexibility to accommodate a variety of lab set-ups and work styles. If the
user simply wants to store tank data on a networked computer, mapping the network drive on the
local computer provides a simple solution. If the user requires simultaneous access to a data tank
from more than one computer, issues with each computers security settings must be addressed.
Store tank data across a network...
To use a network resource to store tank data, map the network drive where the tank is to be stored.
After creating the tank on the networked computer and registering the tank on the local PC, the
user will be able to access the data as if it were stored on the local PC.
To map network drives on your computer, go to My Computer and select Tools > Map Network
Drive. A dialog will help you connect to a shared network folder and assign a drive letter to the
connection.
Allow simultaneous access to a data tank from more than one computer...
Security settings need to be modified on both the server and client computers if the user desires
simultaneous access to a data tank from more than one computer. One example may be a server
computer running an OpenEx project (saving data locally to a tank named DataTank1) and client
computers using OpenScope to access the current active block of DataTank1 on the server.
In order for software components distributed across networked computers to communicate with
each other, several DCOM security settings need to be modified on the server computer. Perform
the following steps to access tank data on a network computer.
295
OpenEx User's Guide
After these steps are completed, a client computer can access data from a registered new format
tank or legacy format tank located on a server computer.
Server computer:
1.
If the computer belongs to a workgroup instead of a domain, make sure that simple file
sharing is disabled. Open Windows Explorer or double click My Computer, click Tools,
then go to Folder Options, click View and uncheck “Use simple file sharing
(Recommended)” in the Advanced settings.
2.
Generate a user account on the server computer. For illustrative purposes, we will use
username: "tankuser", password: "tttuser". This account can be a limited user account.
Remain logged on to an administrator user account for the remainder of the steps.
3.
From the Control panel click Administrative Tools then Component Services. Expand
Component Services, expand Computers, right click My Computer, select Properties
and click on the COM Security tab.
4.
Under “Access Permissions” click Edit Defaults, click Add and then enter “tankuser” in
the "Enter the object names to select" field. Click Check Names, verify spelling then
click OK. Make sure the group names "SYSTEM", "INTERACTIVE", "NETWORK"
and "tankuser" are all present and all have "Local and remote access" permission. If any
group names are missing, click Add to enter the group name as before.
5.
Under “Access Permissions” click Edit Limits, click Add and then enter “tankuser” in
the "Enter the object names to select" field. Click Check Names, verify spelling then
click OK. Make sure the group names "ANONYMOUS", "Everyone", and "tankuser" are
all present and all have "Local and remote access" permission. If any group names are
missing, click Add to enter the group name as before.
6.
Under “Launch and Activation Permissions” click Edit Defaults, click Add and then
enter “tankuser” in the "Enter the object names to select" field. Click Check Names,
verify spelling then click OK. Make sure the group names "SYSTEM",
"INTERACTIVE", "NETWORK" and "tankuser" are all present and all have "Local and
remote access" permission. If any group names are missing, click Add to enter the group
name as before.
7.
Under “Launch and Activation Permissions” click Edit Limits, click Add and then enter
“tankuser” in the "Enter the object names to select" field. Click Check Names, verify
spelling then click OK. Make sure the group names "Administrators", "Everyone", and
"tankuser" are all present and all have "Local and remote access" permission. If any
group names are missing, click Add to enter the group name as before.
8.
Turn off the windows firewall. From the Control Panel click Windows Firewall and
select Off.
9.
From the Control panel click Administrative Tools then Component Services. Expand
Component Services, Computers, My Computer, DCOM Config (you can click No if you
are asked to record a registry value at this point). Right-click TTankEng and select
Properties. On the Identity tab, make sure that “The Interactive User” is the account
selected to run this application.
10. Reboot the server computer.
296
TTank Reference
Client computer:
1.
To test the communication link, attempt to ping the server computer from the client
computer. From a DOS command prompt on the client computer, type "ping" and then
the server computer name.
2.
Distribute the user name "tankuser" and password "tttuser" to the client computer by
adding a registry entry in the folder:
HKEY_LOCAL_MACHINE\Software\TDT\TTank\EnumSevers
3.
a.
From the Start Menu click Run, type regedit and click OK.
b.
Expand HKEY_LOCAL _MACHINE, SOFTWARE, TDT, TTank. Right-click
on the EnumServers folder and select New String Value.
c.
Enter the server name for Value Name and enter the username and password for
Value Data in the following form: * tankuser * tttuser (be sure to include the
asterisks and spaces)
Registered tanks on the server can now be accessed from the client machine.
297
OpenEx User's Guide
~
298
Appendix A – Non Macro Circuit
Construct Reference
In this appendix you will find:
OpenEx naming conventions and basic information about RPvdsEx non-macros circuit constructs.
299
OpenEx User's Guide
~
300
Non-Macro Circuit Construct Reference
Overview
In RPvdsEx macros simplify circuit design, allowing the user to 'drop in' pre-debugged circuit
chunks guaranteed to provide smooth integration with OpenEx. TDT recommends using macros
whenever possible. If a macro is not available for a given task the user must use extra caution to
design the circuit with all OpenEx conventions in mind.
OpenEx Naming Conventions
OpenEx uses parameter tags in the compiled circuit file to recognize, change, and record
parameter values. OpenEx recognizes and classifies parameter tags using the tag name. Parameter
tags fall into three categories:
1.
Parameter tags reserved by OpenEx applications for use with Triggering and Control
constructs. These cannot be changed.
2.
Parameter tags used in Data Stores (Events). These have reserved prefixes but the
suffixes are variable. TDT recommends that the suffixes be standardized for better interoperability of circuits.
3.
Parameter tags for controls. In many cases controls will be modifying the same
parameters in different circuits. For example, control of threshold levels in a spike
detection circuit or filter settings for data acquisition will be the same across multiple
circuits.
Reserved Tags and Prefixes
The OpenEx naming conventions described below must be followed
to ensure that the compiled circuit file will work correctly with
OpenEx. The first letter of each tag is a prefix used to classify the tag
as a control or data parameter. These prefixes are used in combination
with rigid tag names and flexible tag roots to simplify circuit design.
zStimDelay
Control Tags
z
Reserved
Tag names used by OpenEx controls use the z prefix. If the tag name has a valid
OpenEx suffix, OpenEx will send and receive parameter values via the tag. z tags in
example files or circuit constructs must be preserved in their entirety. The z prefix
should be reserved for OpenEx tags.
Sweep Control
To use the sweep control circuit constructs the following names are required:
zSwPeriod: The period of the sweep duration. This is set in OpenWorkbench and can not be
modified during block acquisition. If it is necessary to change this value during the experiment, an
asynchronous next sweep control circuit construct should be used. See Asynchronous Next Sweep
Control, page 308 for more information.
301
OpenEx User's Guide
zSwCount: The maximum number of sweeps before the signal is terminated. If this requires
manual or external control, the value should be set to -1 through the OpenWorkbench protocol.
Condition Control
To use the Condition constructs, the following names are required:
zCdPeriod: The period of the sweep duration. This is set in OpenWorkbench and can not be
modified during block acquisition. If it is necessary to change this value during the experiment an
asynchronous next condition control circuit construct should be used. See Asynchronous Next
Condition Control, page 311 for more information.
zCdCount: The maximum number of conditions before the signal is terminated. If this requires
manual or external control, the value should be set to -1 through the OpenWorkbench protocol.
Acquisition Control
To use the acquisition control circuit constructs the following name is required:
zAqDur: The duration of the acquisition.
To use the acquisition control circuit constructs with a delay the following name is required:
zAqDelay: The delay for the start of the acquisition.
Stimulation Control
To use the stimulation control circuit constructs, the following name is required:
zStimDur: The duration of the acquisition.
To use the stimulation control circuit constructs with a delay the following name is required:
zStimDelay: The delay for the start of the acquisition.
Data
OpenEx also uses tag roots to group related parameters. The tag root is the suffix used in the
parameter tag name. It is identified in the oxScalar, oxSnippet, oxList, oxBuffer, or oxStream
component and must be included in each related parameter tag. For example, a related group of
parameter tags might be named sFreq, tFreq, and dFreq. These tag roots are used to identify the
parameter tags that are associated so that data can be stored to the data tank.
By default, the tag root will be used as the Store ID in OpenWorkbench.
302
Non-Macro Circuit Construct Reference
In general, Store IDs should begin with alpha-characters, that is, letters a-z and A-Z. Store IDs
must NOT begin with any of the following characters: "-", "=", "(", ")", "<", ">", "!", a space or
any number 0 to 9. Keep these limitations in mind when defining the tag root.
The following tag prefixes are used for the stored data:
s
Sync
The s prefix identifies the parameter as an index value. Data that is not scalar
requires a parameter with an s prefix associated with the buffer to indicate the
position of the buffer. This tells OpenEx how many points are to be downloaded to
the tank or if any points at all require downloading.
t
Time
The t prefix identifies the parameter as a time stamp. Data that is time stamped such
as scalars, lists and buffers use a parameter with a t prefix.
d
Data
The d prefix identifies the parameter as a data value. All Data constructs require a
parameter with a d prefix.
c
Coefficient
The c prefix identifies the parameter as a coefficient value.
n
Number of Points
The n prefix identifies the parameter as a Npts value.
x
Decimation Factor
One tag suffix is used for stored data:
~#
Channel Number
The ~# suffix identifies the parameter as part of several channels of data. In the
circuit header (oxComponent) you can choose the number of channels associated
with the data construct. The number after the tilde is the channel number.
A Brief Review of Terminology
Compiled circuit files are RP control objects, designed by users or TDT, for use with OpenEx
and other applications. May be in .rco or .rcx format.
RPvdsEx files contain circuit diagrams designed in a visual drag-and-drop environment. May be
in .rpd, .rpx, or .rcx format.
Circuits are made up of components. Each component does a set task, such as generate a
waveform, store in memory, or send a signal to device outputs.
Circuit constructs are a group of components that do a defined task in OpenEx. A circuit
construct will have a minimum component structure and alternate component structures.
303
OpenEx User's Guide
Control Constructs
About Control Constructs
OpenEx is designed for time critical data acquisition and stimulus presentation. To ensure precise
triggering of all System 3 hardware devices, a global trigger is sent to each of the System 3
hardware device caddies (zBus). At the simplest level (continuous acquisition) this will start a
clock that generates a time stamped output.
All aspects of timing and triggering are controlled by the circuit, or compiled circuit file, running
on the System 3 hardware devices.
The non-macro control circuit constructs described in this section can be used in two ways. When
a straightforward stimulus and/or acquisition protocol is needed, these constructs can be added to
circuits to allow the user to control timing and triggering parameters in OpenWorkbench. When
more complex scenarios are needed these circuits offer a starting point for developing more
complex control circuits.
Most control constructs use reserved parameter tag names and prefixes to tie construct parameters
to the OpenWorkbench settings. When using constructs be sure to preserve the required tag names.
When creating new tag names avoid reserved names and prefixes such as the "z" prefix.
See Naming Conventions, page 301 to become familiar with reserved parameter tag names and
prefixes.
Basic Triggering and Timing
The main trigger and clock generator constructs provide sufficient triggering and timing control to
generate and acquire continuously, such as continuously recording spike data or other waveforms.
The minimal circuit consists of a global trigger (zBUS trigger). The trigger ensures that all devices
start at the same time. If data storage is required then a clock generator is required. The clock
generator starts with the Trigger. Clocks are used to precisely time stamp all data.
The basic triggering and timing constructs are:
Main Trigger
Clock Generator
Secondary Trigger
Cycle Usage
Main Trigger
Enable
[1:1,0]
Src=zBusA
[1:2,0]
EdgeDetect
Reset
Edge=Rising
Uses:
304
Each compiled circuit file assigned to a device that will be used by any
OpenWorkbench Store must include this construct.
Non-Macro Circuit Construct Reference
Description:
This construct provides the main circuit reset and enable for control across
all devices using the zBusA trigger. By default, OpenWorkbench will send
a zBusA trigger to all devices when it goes into Preview or Record mode.
The trigger stays high until OpenWorkbench is switched to Standby or Idle
modes.
Details:
zBusA is a feature of the TrgIn component. It generates a synchronized
trigger across multiple devices.
The Enable line (Hop) stays high until halted from OpenWorkbench. This
high line is sent to multiple components/circuit constructs to control
stimulus presentation, data acquisition, or other actions.
The Reset line (Hop) is a synchronizing pulse that is sent to multiple
components to ensure that all components/constructs are started at the same
time.
Clock Generator
zTime
[1:4,0]
SimpCount
iTime
Rst=0
Enable=1
Reset
Uses:
Each compiled circuit file assigned to a device that will be used by any
OpenWorkbench Store must include this construct. The clock generator is
used whenever the circuit must read back time to OpenWorkbench.
Description:
The clock generator is critical for time stamping data. The clock increments
on each tick of the sample clock.
Details:
The Reset line is generated by the triggering construct and starts the clock
at zero. The clock is reset to zero for each Block in the data tank.
The output of the SimpCount is used by other constructs to time stamp data
via the iTime line. The time value is measured in number of samples since
the Reset line went high and is automatically converted to seconds by
OpenWorkbench when time stamping data.
OpenWorkbench uses the zTime parameter tag to display the current time
and to make sure that the device is running correctly.
Note: The zTime parameter tag is an OpenEx reserved tag name and must
be included in this construct.
Secondary Trigger
[1:5,0]
Src=Soft1
[1:6,0]
EdgeDetect
zTrgB
Edge=Rising
Uses:
Used in circuits requiring a secondary software or external trigger. Each
compiled circuit file assigned to a device in OpenWorkbench which will
use secondary triggering must include this construct.
305
OpenEx User's Guide
Description:
This construct can facilitate secondary system wide synchronization. It can
be used to implement any secondary trigger desired by the user. It can also
be used with an asynchronous next sweep (or condition) construct to allow
triggering of a next sweep or condition from the z-Trigger-B button in
OpenWorkbench.
Details:
The zTrgB line can be used to trigger other circuit components. When used
with an asynchronous next sweep (or condition) construct an additional
output line with a NextSweep (or NextCond) hop should be added.
Cycle Usage
[1:7,0]
CycUsage
8.84835
zCycUse
Uses:
This is an optional construct that can be added to any compiled circuit file.
Description:
This construct allows OpenWorkbench to monitor and display the cycle
usage.
Details:
The zCycUse parameter tag is used to read the current cycle usage from the
CycUsage component for display in OpenWorkbench. The cycle usage is
displayed when a protocol is running.
Sweep and Condition Control Constructs
A variety of circuit constructs can be used for precise control of the count, period, and behavior of
sweep or condition loops. Sweep and condition loops are used to control the length, start, and end
of a stimulus presentation or acquisition. A circuit that does not use sweep or condition control
runs continuously. Sweep and condition circuits are triggered either by a trigger or through a user
defined paradigm (asynchronous). Sweeps or conditions are used if acquisition or presentation
requires a defined length or intervals. Sweep and condition constructs are used by the OpenEx
protocols.
The sweep and condition constructs are:
Basic Sweep Control
Sweep Control with End Checking
Asynchronous Next Sweep Control
Basic Condition Control
Condition Control with End Checking
Asynchronous Next Condition Control
Basic Nesting Control
Nesting Control with End Tracking
Basic Sweep Control
306
Non-Macro Circuit Construct Reference
zSwPeriod
[1:7,0]
PulseTrain2
zSwCount
Enable
Reset
nPer=25000
nPulse=8
Enab=Yes
Rst=Run
PLate=0
PCount=0
Sw Fire
zSwNum
Uses:
Used in circuits for basic sweep based control of stimulus or acquisition.
The sweep control defines the sweep period and number of acquisitions or
presentations. An OpenEx circuit that requires some form of sweep control
must use one of the sweep or condition constructs.
Description:
This construct allows the user to define the sweep period and the maximum
number of sweeps generated during the experimental block through
protocol settings in OpenWorkbench.
Details:
The Enable and Reset lines are generated by the triggering construct. The
SwFire line (Hop) pulses for a single sample to start each sweep and is
generally sent to a stimulus or acquisition control construct.
The zSwPeriod parameter tag defines the period of the sweep and the
zSwCount parameter tag defines the number of sweeps. The sweep count
will be infinite when the count is set to -1 in OpenWorkbench.
The zSwNum parameter tag is an optional tag that points to the current
sweep number. When zSwNum is used, OpenWorkbench will display the
value on the Block Info sheet while the experiment is running.
Because there is no end checking, the Stop When Done and Standby on
Stop protocol settings can not be used with this construct.
Note: The zSwPeriod and zSwCount parameter tags are OpenEx reserved
tag names. These tag names must be included in the construct and must not
be altered.
Sweep Control with End Checking
End checking is also provided with:
Asynchronous Next Sweep Control
Nesting Control with End Tracking
zSwPeriod
[1:7,0]
PulseTrain2
zSwCount
Enable
Reset
nPer=25000
nPulse=8
Enab=Yes
Rst=Run
PLate=0
PCount=0
CdFire
CdNum
zSwNum
[1:9,0]
iCompare
zSwCount
zSwDone
K=8
Test=GE
307
OpenEx User's Guide
Uses:
Used in circuits for basic sweep based control of stimulus or acquisition
when end checking is required. End checking can be used to initiate some
action at the end of the sweep loop. Each compiled circuit file assigned to a
device in OpenWorkbench that will use a sweep must include some form of
sweep control construct.
Description:
When this construct is used, OpenWorkbench protocol settings can be used
to initiate actions, such as stopping the protocol or generating a secondary
trigger, when the sweep loop is done.
Details:
The zSwPeriod parameter tag defines the period of the sweep and the
zSwCount parameter tag defines the number of sweeps.
The current sweep number is compared to the total number of sweeps
(zSwCount) to determine when the sweep loop is complete. When this
occurs, the output value is set high and this flags OpenWorkbench through
the zSwDone parameter tag to indicate that the last sweep has been reached.
Using the Standby on Stop check box and the Stop When Done check box
under Sweep Loop, the protocol can be set to go to Idle (check boxed
cleared) or Standby (check box selected) mode when the zSwDone
parameter tag value is set high.
A trigger (zTrgB) can also be generated and controlled by the user via the
zSwDone parameter tag. Control of the trigger is based on settings found
under zTrgB Action on Done.
The zSwNum parameter tag is an optional tag that points to the current
sweep number. When zSwNum is used OpenWorkbench will display the
value on the Block Info sheet while the experiment is running.
Note: The zSwPeriod, zSwCount, and zSwDone parameter tags are
OpenEx reserved tag names. These tag names must be included in the
construct and must not be altered.
Asynchronous Next Sweep Control
[1:11,0]
PulseTrain2
zSwCount
[1:15,0]
RSFlipFlop
NextSw eep
Sw Fire
Set=0
Rst=0
Reset
nPer=25000
nPulse=8
Enab=Yes
Rst=Run
PLate=0
PCount=0
Sw Fire
Sw Num
zSwNum
[1:14,0]
iCompare
zSwCount
308
zSwDone
K=8
Test=GE
Uses:
Used in circuits where manual or external control of the next sweep is
required. Each compiled circuit file assigned to a device in
OpenWorkbench that will use a sweep must include some form of sweep
control construct.
Description:
In this construct asynchronous next sweep control is provided by a trigger
line which sets a flag to start the next sweep. Once the flag has been
recorded the value is reset and the line is ready for the next event. This
Non-Macro Circuit Construct Reference
construct allows the user to define the maximum number of sweeps
generated during the experimental block and control protocol behavior at
the end of the sweep loop through protocol settings in OpenWorkbench.
Details:
This construct uses an RSFlipFlop component and two trigger lines. The
trigger high line (Set line) sets the output value of the RSFlipFlop high.
Once the value has been recorded or the event generated the RSFlipFlop is
reset.
Possible inputs for the NextSweep line include an external criterion, such as
an external trigger or hardware trigger not generated by OpenWorkbench,
or the ZTRGB signal in a secondary trigger construct.
Also, experiments that use changing sweep durations, interstimulus
intervals (ISI) and so forth will require timing constructs to trigger the next
sweep. The RSFlipFlop acts as a switch to start the PulseTrain2. When a
criterion is met the PulseTrain2 fires. The firing of the pulse then resets the
RSFlipFlop to zero.
The zSwCount parameter tag defines the number of sweeps. zSwPeriod is
not used in this construct because the sweep durations are not necessarily
constant throughout the experiment. Instead the asynchronous next sweep
controls the duration and timing of each sweep.
The current sweep number is compared to the total number of sweeps
(zSwCount) to determine when the sweep loop is complete. When this
occurs, the output value is set high and this flags OpenWorkbench through
the zSwDone parameter tag to indicate that the last sweep has been reached.
Using the Standby on Stop check box and the Stop When Done check box
under Sweep Loop, the protocol can be set to go to Idle (check boxed
cleared) or Standby (check box selected) mode when the zSwDone
parameter tag value is set high.
A trigger (zTrgB) can also be generated and controlled by the user via the
zSwDone parameter tag. Control of the trigger is based on settings found
under zTrgB Action on Done.
The zSwNum parameter tag is an optional tag that points to the current
sweep number. When zSwNum is used OpenWorkbench will display the
value on the Block Info sheet while the experiment is running.
Note: The zSwCount and zSwDone parameter tags are OpenEx reserved
tag names. These tag names must be included in the construct and must not
be altered.
Basic Condition Control
zCdPeriod
[1:12,0]
PulseTrain2
zCdCount
Enable
Reset
Uses:
nPer=25000
nPulse=8
Enab=Yes
Rst=Run
PLate=0
PCount=0
CdFire
zCdNum
Used in circuits for basic condition based control of stimulus or acquisition.
309
OpenEx User's Guide
An OpenEx circuit that requires condition control must use some form of
condition construct.
Description:
This construct allows the user to define the condition period and the
maximum number of conditions generated during the experimental block
through protocol settings in OpenWorkbench.
Details:
The Enable and Reset lines are generated by the triggering construct. The
CdFire line (Hop) pulses for a single sample to start each condition and is
generally sent to a stimulus or acquisition control construct.
The zCdPeriod parameter tag defines the period of the condition and the
zCdCount parameter tag defines the number of conditions. The condition
count will be infinite when the count is set to -1 in OpenWorkbench.
The zCdNum parameter tag is an optional tag that points to the current
condition number. When zCdNum is used, OpenWorkbench will display
the value on the Block Info sheet while the experiment is running.
Because there is no end checking, the Stop When Done and Standby on
Stop protocol settings can not be used with this construct.
Note: The zCdPeriod and zCdCount parameter tags are OpenEx reserved
tag names. These tag names must be included in the construct and must not
be altered.
Condition Control with End Checking
End checking is also provided with:
Asynchronous Next Condition Control
Nesting Control with End Tracking
zCdPeriod
[1:12,0]
PulseTrain2
zCdCount
Enable
Reset
nPer=25000
nPulse=8
Enab=Yes
Rst=Run
PLate=0
PCount=0
CdFire
CdNum
zCdNum
[1:14,0]
iCompare
zCdCount
310
zCdDone
K=8
Test=GE
Uses:
Used in circuits for basic condition based control of stimulus or acquisition
when end checking is required. End checking can be used to initiate some
action at the end of the condition loop. Each compiled circuit file assigned
to a device in OpenWorkbench that will use a condition must include some
form of condition control construct.
Description:
When this construct is used, OpenWorkbench protocol settings can be used
to stop the protocol when the condition loop is done.
Details:
The zCdPeriod parameter tag defines the period of the condition and the
zCdCount parameter tag defines the number of conditions.
Non-Macro Circuit Construct Reference
The current condition number is compared to the total number of conditions
(zCdCount) to determine when the condition loop is complete. When this
occurs, the output value is set high and this flags OpenWorkbench, through
the zCdDone parameter tag, to indicate that the last condition has been
reached.
Using the Standby on Stop check box and the Stop When Done check box
under Condition Loop, the protocol can be set to Idle (check boxed cleared)
or Standby (check box selected) mode when the zCdDone parameter tag
value is set high.
The zCdNum parameter tag is an optional tag that points to the current
condition number. When zCdNum is used OpenWorkbench will display the
value on the Block Info sheet while the experiment is running.
Note: The zCdPeriod, zCdCount, and zCdDone parameter tags are
OpenEx reserved tag names. These tag names must be included in the
construct and must not be altered.
Asynchronous Next Condition Control
[1:11,0]
zCdCount
[1:15,0]
RSFlipFlop
NextCond
CdFire
Set=0
Rst=0
Reset
Uses:
PulseTrain2
nPer=25000
nPulse=8
Enab=Yes
Rst=Run
PLate=0
PCount=0
zCdCount
CdFire
CdNum
[1:14,0]
iCompare
zCdDone
K=8
Test=GE
Used in circuits where manual or external control of the next condition is
required.
Each compiled circuit file assigned to a device in OpenWorkbench that will
use a condition must include some form of condition control construct.
Description:
In this construct asynchronous next condition control is provided by a
trigger line which sets a flag to start the next sweep. Once the flag has been
recorded the value is reset and the line is ready for the next event. This
construct allows the user to define the maximum number of sweeps
generated during the experimental block and control protocol behavior at
the end of the sweep loop through protocol settings in OpenWorkbench.
Details:
This construct uses an RSFlipFlop component and two trigger lines. The
trigger high line (Set line) sets the output value of the RSFlipFlop high.
Once the value has been recorded, or the event generated, the RSFlipFlop is
reset and ready to accept the next trigger pulse.
Possible inputs for the NextCond line include an external criterion, such as
an external trigger or hardware trigger not generated by OpenWorkbench,
or the ZTRGB signal in a secondary trigger construct. Also, experiments
that use changing sweep durations, interstimulus intervals (ISI) and so forth
will require timing constructs to trigger the next condition. The RSFlipFlop
acts as a switch to start the PulseTrain2. When a criteria is met the
PulseTrain2 fires. The firing of the pulse then resets the RSFlipFlop to zero.
311
OpenEx User's Guide
The zCdCount parameter tag defines the number of conditions. zCdPeriod
is not used in this construct because the sweep durations are not necessarily
constant throughout the experiment. Instead the asynchronous next sweep
controls the duration and timing of each sweep.
The current condition number is compared to the total number of conditions
(zCdCount) to determine when the condition loop is complete. When this
occurs, the output value is set high and this flags OpenWorkbench through
the zCdDone parameter tag to indicate that the last condition has been
reached.
Using the Standby on Stop check box and the Stop When Done check box
under Condition Loop, the protocol can be set to Idle (check boxed cleared)
or Standby (check box selected) mode when the zCdDone parameter tag
value is set high.
The zCdNum parameter tag is an optional tag that points to the current
condition number. When zCdNum is used OpenWorkbench will display the
value on the Block Info sheet while the experiment is running.
Note: The zCdCount and zCdDone parameter tags are OpenEx reserved
tag names. These tag names must be included in the construct and must not
be altered.
Basic Nesting Control
zSwPeriod
[1:15,0]
PulseTrain2
zSwCount
zCdPeriod
[1:13,0]
Enable
PulseTrain2
zCdCount
Enable
Reset
nPer=25000
nPulse=8
Enab=Yes
Rst=Run
PLate=0
PCount=0
nPer=25000
nPulse=8
Enab=Yes
Rst=Run
PLate=0
PCount=0
Sw Fire
zSwNum
zCdNum
Sweep Nested in Condition
Uses:
Used in circuits where both conditions and sweeps are used for either
stimulation or acquisition and the count and period for both sweeps and
conditions are known. Each compiled circuit file assigned to a device in
OpenWorkbench that will use a sweep nested in a condition must include
some form of nesting control construct.
Description:
This is the simplest form of nesting. Each condition automatically fires the
sweeps. The user must make sure the length of the sweeps does not exceed
the length of each condition period.
When this construct is used. OpenWorkbench protocol settings can be used
to define the sweep and condition period and the maximum number of
sweeps and conditions.
Details:
The zCdPeriod parameter tag defines the period of the condition and the
zCdCount parameter tag defines the number of conditions.
The zSwPeriod parameter tag defines the period of the sweep and the
zSwCount parameter tag defines the number of sweeps.
312
Non-Macro Circuit Construct Reference
The zSwNum and zCdNum parameter tags are optional tags that point to
the current sweep and condition numbers. When zSwNum and zCdNum are
used OpenWorkbench will display the values on the Block Info sheet while
the experiment is running.
Note: The zCdPeriod, zCdCount, zSwPeriod, and zSwCount parameter
tags are OpenEx reserved tag names. These tag names must be included in
the construct and must not be altered.
Nesting Control with End Tracking
[1:12,0]
zCdCount
[1:18,0]
RSFlipFlop
NextCond
CdFire
Set=0
Rst=0
Reset
zSwPeriod
PulseTrain2
nPer=25000
nPulse=8
Enab=Yes
Rst=Run
PLate=0
PCount=0
zCdCount
Enable
CdFire
zCdNum
[1:21,0]
iCompare
zCdDone
K=0
Test=GE
[1:15,0]
PulseTrain2
zSwCount
CdFire
nPer=25000
nPulse=8
Enab=Yes
Rst=Run
PLate=0
PCount=0
zSwCount
Sw Fire
zSwNum
[1:17,0]
iCompare
zSwDone
K=0
Test=GE
Uses:
Used in circuits where both conditions and sweeps are used for either
stimulation or acquisition and end checking is required. Each compiled
circuit file assigned to a device in OpenWorkbench that will use both sweeps
and conditions must include some form of nesting control construct.
Description:
When this construct is used, OpenWorkbench protocol settings can be used
to determine what action occurs when the sweep and condition loops are
done.
Using the Standby on Stop check box, and the Stop When Done check box
for the condition loop, the protocol can be set to Idle (Standby on Stop check
boxed cleared) or Standby (Standby on Stop check box selected) mode when
the zCdDone parameter tag value is set high.
Details:
The zCdPeriod parameter tag defines the period of the condition and the
zCdCount parameter tag defines the number of conditions.
The zCdCount parameter feeds into the iCompare component within the
condition loop which counts the number of pulses generated. When this
reaches the iCompare K value the output value is set high and this flags
OpenWorkbench through the zCdDone parameter tag to indicate that the last
condition has been reached.
The zSwPeriod parameter tag defines the period of the sweep and the
zSwCount parameter tag defines the number of sweeps.
313
OpenEx User's Guide
The NextCond line can be connected to the final iCompare to automatically
increment on the end of each set of sweeps. The NextCond line could also be
connected to a secondary trigger construct to allow manual or computer
control of the next condition.
A trigger (zTrgB) can also be generated and controlled by the user via the
zSwDone parameter tag. Control of the trigger is based on settings found
under zTrgB Action on Done.
The zSwNum and zCdNum parameter tags are optional tags that point to the
current sweep and condition numbers.
When zSwNum or zCdNum is used OpenWorkbench will display the value
on the Block Info sheet while the experiment is running.
Note: The zCdPeriod, zCdCount, zSwPeriod, zSwCount, zCdDone, and
zSwDone parameter tags are OpenEx reserved tag names. These tag names
must be included in the construct and must not be altered.
Acquisition and Stimulation Control Constructs
Circuit constructs are also provided for precise control of the timing (duration and delay) of
acquisition, presentation, and other events.
The constructs are:
Basic Acquisition Control
Basic Stimulation Control
Other Event Control
Basic Acquisition Control
Sw Fire
zAqDelay
[1:6,0]
[1:7,0]
TTLDelay2
Schmitt2
N1=1
N2=0
zAqDur
AqEnable
nHi=10000
nEnab=1
Uses:
Used in circuits where sweep based acquisition will occur and the user will
set the acquisition delay or duration. Each compiled circuit file assigned to
a device in OpenWorkbench that will be used for data acquisition must
include some form of acquisition control construct.
Description:
This construct allows the user to control the delay and duration of
acquisition from OpenWorkbench protocol settings.
Details:
The SwFire line is generated by the sweep control construct. The AqEnable
line (Hop) will trigger buffers for acquiring data.
The zAqDelay parameter tag defines the length of the delay for the start of
the acquisition relative to the beginning of a condition or sweep and the
zAqDur parameter tag defines the duration of the acquisition.
Note: The zAqDelay and zAqDur parameter tags are OpenEx reserved tag
names. These tag names must be included in the construct and must not be
altered.
314
Non-Macro Circuit Construct Reference
Basic Stimulation Control
StFire
[1:6,0]
Sw Fire
zStimDelay
[1:7,0]
TTLDelay2
N1=0
N2=1
Schmitt2
zStimDur
StEnable
nHi=1000
nEnab=1
Uses:
Used in circuits where stimulation will occur and the user will set the
stimulation delay or duration. Each compiled circuit file assigned to a
device in OpenWorkbench that will be used for stimulus presentation must
include some form of stimulation control construct.
Description:
This construct allows the user to control the delay and duration of stimulus
presentation from OpenWorkbench protocol settings.
Details:
The SwFire line is generated by the sweep control construct. The StEnable
line (Hop) will control gates for turning stimuli on and off.
The zStimDelay parameter tag defines the length of the delay for the start
of the stimulus relative to the beginning of a condition or sweep and the
zStimDur parameter tag defines the duration of the stimulus.
Note: The zStimDelay and zStimDur parameter tags are OpenEx reserved
tag names. These tag names must be included in the construct and must not
be altered.
Other Timing Control
OtFire
zOtDelay
[1:13,0]
[1:14,0]
TTLDelay2
Schmitt2
N1=0
N2=1
zOtDur
OtEnable
nHi=1000
nEnab=1
Uses:
Used in circuits where the user will control the timing (delay or duration) of
some other circuit or device. Each compiled circuit file assigned to a device
in OpenWorkbench that will be used for this other occurrence must include
an other timing control construct.
Description:
This construct allows the user to control delay and duration of an alternate
timing control option.
Details:
The OtFire line is generated by the sweep control construct. The OtEnable
line (Hop) will control gates for turning a timed event on and off.
The zOtDelay parameter tag defines the length of the delay for the start of
the timed event relative to the beginning of a condition or sweep and the
zOtDur parameter tag defines the duration of the event.
Note: The zOtDelay and zOtDur parameter tags are OpenEx reserved tag
names. These tag names must be included in the construct and must not be
altered.
315
OpenEx User's Guide
Data Storage
When it is necessary to use a non-macro data construct, the user must take extra care to understand
all the details of data construct design. Circuit headers within each data construct contain all the
necessary information for OpenWorkbench to be able to retrieve the data from the hardware and
store it in a data tank on the computer’s hard drive.
Headers, such as OxSnippet and OxStream, are the link between OpenWorkbench and the
waveforms or data being acquired by the device. They give Workbench and TTankEngine
information about the waveforms and what kind of data to expect, at what rate, in what form, and
so forth. If there is a mismatch between the attributes of the signal specified by the header and the
actual data being transferred to the PC, then OpenWorkbench will generate timing errors. So, it is
important to use the correct parameters in these headers.
Circuit headers are a special type of processing component. In RPvdsEx, they are grouped in the
OpenEx Headers components category. There are five data generating constructs that can be used
with OpenEx, and each one requires a different type of circuit header.
The five data constructs used in OpenEx are:
Type 1: Triggered Scalar (uses the oxScalar circuit header)
Type 2: Data Buffer (uses the oxBuffer circuit header)
Type 3: Data List (uses the oxList circuit header)
Type 4: Signal Snippet with and without spike sorting (uses the oxSnippet circuit header)
Type 5: Continuous Waveform (uses the oxStream circuit header)
The circuit headers for each data type contain different pieces of information. However, all of
them include a tag root. The tag root is a name that will be used by OpenWorkbench to access the
data, time stamps, and other information associated with the data construct. All of the data
constructs require a parameter tag to access the data. To do this, OpenWorkbench will look for a
parameter tag with the name d + (tag root). For example, if the tag root is Freq then it will look
for the tag dFreq. Depending on the type of data construct being used, other tags will be required
as well, including sync parameters (s tags) and time stamps (t tags). For the tag root Freq these
would be sFreq and tFreq. When storing multiple channels, suffixes may be used with these
parameter tags as well. More detail about each of these tags can be found in the OpenEx naming
conventions and in the documentation for each particular data construct.
When discussing data constructs it is also important to mention secondary tags. Secondary tags are
a way of sharing time stamps when storing pieces of data that are always stored at the same time.
For example, if a complete construct with circuit header is set up for saving the sweep number
parameter, other stimulus parameters can be saved at the same time (with the same time stamp) by
listing them as secondary tags. There are several methods for using secondary tags. For more
information see Secondary Tag Constructs, page 328.
316
Non-Macro Circuit Construct Reference
Data Construct Types
Type 1: Triggered Scalar
oxScalar
37.45
About the oxScalar component ...
Tag_Root identifies the base name of the construct. All
parameter tags in the circuit that use the base name will be
associated with the oxScalar component.
Tag_Root=
Handshake=Soft-1
Channels=0
HandShake indicates whether a software trigger will be
used for the handshake. The handshake is a communication
procedure between the application and the compiled circuit
file. A flag is set high to indicate the data has been acquired.
The application acquires the data and time stamp and then
resets the flag for the next stimulus. If the handshake value
is set to None, OpenWorkbench polls for changes in the
time stamp parameter tag (t prefix) and then stores the data
when the time value changes.
Channels is the number of channels associated with the
scalar. For single mode the value is set to 0.
Uses:
The triggered scalar data construct is used when storing asynchronous
scalar data that arrives at a rate no greater than once per second.
Examples of asynchronous data include sweep numbers, stimulus
parameter, and digital input values. Each compiled circuit file assigned to
a device, in OpenWorkbench, that will be used to acquire asynchronous
scalar data must include this construct.
Description:
With a triggered scalar data construct, data values are latched (using the
Latch component) each time they need to be stored. Periodic timing can
be used (For example, latch the data once every five seconds) or other
timing methods can be used (for example: latch the data when an external
trigger arrives at the device). A time stamp value must be latched at the
same time as the data is latched, so that the data and time will be
associated when stored in the tank. OpenWorkbench reads the data and
time values when polling the hardware device. After reading the values
and storing them to the tank, it will reset the latch (if using a handshake
protocol) or continuously read the values and only save them when they
change. The triggered scalar should only be used when the data arrives at
a rate less than once per second. If scalar data values must be stored more
frequently, a data list (Type 3) construct must be used instead.
Details:
Each data buffer must include parameter tags using the tag root with the
following prefixes and suffixes:
t
prefix for the time stamp parameter
s
prefix for the sync parameter
d
prefix for the data tags that are stored
Handshaking is optional. If there is no handshake, the latching of the
317
OpenEx User's Guide
time occurs through OpenWorkbench polling. OpenWorkbench polls for
changes in the time stamp parameter tag (t prefix) and then stores the
data when the time value changes.
The example below uses a triggered scalar construct with handshaking to store the sweep number.
On each sweep, the Counter is incremented, changing the value of the dSweep tag. Also the latch
is triggered, which stores the current time value via tSweep. Since handshaking is being used,
OpenWorkbench will look for the sSweep tag to be set high when new data has arrived. So, also
on each sweep, the RSFlipFlop is set, which causes sSweep to be equal to 1. After
OpenWorkbench reads the data and time values, it issues a Soft-1 trigger, which resets the
RSFlipFlop and sSweep becomes 0. Notice that Soft-1 is set as the handshake trigger in the
oxScalar component. If multiple triggered scalar constructs with handshaking were used in the
circuit, a different software trigger would be used for each of them.
Additional data values can be associated with this scalar and may also be stored to the tank. These
values are called secondary tags. See Secondary Tags, page 69 for more information.
37.45
oxScalar
Tag_Root=Sweep
Handshake=Soft-1
Channels=0
[1:6,0]
[1:16,0]
sSweep
RSFlipFlop
Set=0
Rst=0
Sw eep
[1:14,0]
Sw eep
Reset
Sw eep
Latch
tSweep
Trg=0
[1:10,0]
Counter
Src=Soft1
iTime
dSweep
Base=0
Phse=0
Step=1
Roll=1000
Rst=Run
Enab=Yes
Type 2: Data Buffer
About the oxBuffer component ...
oxBuffer
Tag_Root=
Buffer_Size=32
Data_Form=Float
Dec_Factor=1
Handshake=Soft-1
Channels=0
Tag_Root identifies the base name of the construct. All parameter tags
in the circuit that use the base name will be associated with the
oxBuffer component.
Buffer_Size indicates the number of points in the data buffer. This can
be a fixed value; however in many cases the buffer size may be
dependent on the timing construct. Then it is convenient to use a
parameter tag to specify the buffer size. This is done by setting
Buffer_Size to 0 in the oxBuffer and using a parameter tag with the
prefix ‘n’ to specify the size of the buffer.
Data_Form is the format of the data. The data type can be float (32bit), integer (32-bit), short (16-bit integer), or byte (8-bit integer).
Dec_Factor is the decimation factor. If the data is reduced either
through a Plot16dec or through changes in the time-slice then a
decimation factor other than one should be used.
HandShake indicates whether a software trigger will be used for the
handshake. The handshake is a communication procedure between the
application and the compiled circuit file. A flag is set high to indicate
the data has been acquired. The application acquires the data and time
stamp and then resets the flag for the next stimulus.
318
Non-Macro Circuit Construct Reference
If the handshake value is set to None, OpenWorkbench polls for a
change in the time stamp parameter tag and then stores the data when
the time value changes.
Channels is the number of channels associated with the buffer.
Uses:
The data buffer construct is used when storing a block of data points that are
not continuously streaming. Examples of data buffers include signal averages
for evoked potentials and fixed-duration blocks of acquired data (such as one
second worth of data after each stimulus). Each compiled circuit file assigned
to a device, in OpenWorkbench, that will be used to acquire a data buffer
must include this construct.
Description:
With a data buffer, a waveform and associated time stamp are stored to the
data tank. Each time a block of data is acquired into the buffer, the time
stamp value should be latched so that it contains the time of the first data
point in the buffer. If handshaking is used, a sync parameter tag should also
be set high after the buffer has filled up. OpenWorkbench will then read the
data and time stamp and reset the sync parameter tag.
Details:
Each data buffer must include parameter tags using the tag root with the
following prefixes and suffixes:
t
prefix for the time stamp parameter
A Latch component acquires the time stamp from the Clock
Generating construct.
s
prefix for the sync parameter
A parameter tag with the s prefix is used if handshaking is
enabled for the construct.
It will be set high when data has been acquired into the buffer
and needs to be stored to the tank.
n
prefix for the number of points
If the Buffer_Size of the oxBuffer is set to 0, then
OpenWorkbench will look for a parameter tag with the n prefix
to determine the number of points in the buffer. This tag value
should take into account any decimation factor including
Plot16Dec and time slices. If a timeslice is used, make sure that
all constructs use the same timeslices (see the RPvdsEx Help
section on timeslices).
d
prefix for the data tags that are stored
This tag may also include a suffix with a tilde and a number if
there are multiple acquisition channels.
319
OpenEx User's Guide
In this example the data is acquired and stored to the tank on each sweep.
Ch=1
dc
[1:13,0]
[1:15,0]
HPFreq
[1:16,0]
[1:17,0]
Biquad
Biquad
nBIQ=1
{>Coef}
{>Delay}
ButCoef
Gain=1
Fc=300
NBiq=1
Type=HP
Enab=Yes
LPFreq
[1:14,0]
ButCoef
Gain=1
Fc=3000
NBiq=1
Type=LP
Enab=Yes
Sig1
nBIQ=1
{>Coef}
{>Delay}
The acquired signal is filtered and a signal line is connected to the Stores input.
AqFire
[1:11,0]
[1:12,0]
Sw Fire
TTLDelay2
Schmitt2
zAqDelay
N1=1
N2=0
AqEnable
[1:13,0]
nHi=10000
nEnab=1
EdgeDetect
[1:4,0]
nWave
ConstI
zAqDur
AqDone
Edge=Rising
K=10000
Npts
A timing circuit controls the duration and calculates the number of points.
This circuit differs from the simple timing circuit. It contains an AqFire which is used by the
handshaking protocol. It also has the n prefix parameter tag and Npts for determining the number of
points in the buffer. An EdgeDetect triggers the end of the acquisition pulse.
[1:17,0]
Sig1
SerStore
Npts
Reset
AqEnable
Size=1e+006
Rst=0
WrEnab=1
Index=0
{>Data}
dWave~1
The store component is a SerStore.
Signal data is acquired when the AqEnable line from the acquisition timing circuit is set high. This is
high for the duration of the acquisition. The size of the Store is indicated by the Npts line and is
determined by the acquisition timing circuit (above). The Reset line resets the buffer at the start of a
new block of acquisition.
[1:21,0]
AqDone
[1:19,0]
Src=Soft2
RSFlipFlop
Set=0
Rst=0
SyncAct
sWave
The AqDone line sets the RSFlipFlop high when the acquisition ends. While polling, OpenWorkbench
will detect the sWave high. It will then acquire and store the buffered variable dWave and the associated
time stamp. Once the data is acquired the RSFlipFlop is reset by the handshake protocol.
320
Non-Macro Circuit Construct Reference
[1:17,0]
Latch
iTime
tWave
Trg=0
AqFire
The Latch buffer uses the Time line from the clock generating construct and the AqFire line to time
stamp the start of the acquired buffer.
Type 3: Data List
oxList
37.45
0.651
...
About the oxList component ...
Tag_Root identifies the base name of the construct. All parameter
tags in the circuit that use the base name will be associated with the
oxList component.
Tag_Root=
Data_Form=Float
Channels=0
Data_Form is the format of the data. The data type can be float or
integer (both are 32-bit).
Channels is the number of channels associated with the list.
Uses:
The data list construct is used when storing scalar data that can arrive at
rates greater than the polling rate of OpenWorkbench. Examples of data
lists include sweep numbers, stimulus parameters, and digital input
values. Each compiled circuit file assigned to a device, in
OpenWorkbench, that will be used to generate a stimulus using the list
must include this construct.
Description:
A data list involves two buffers – one for the data and one for the
associated time stamps.
A timing construct must be set up so that both of the buffers are enabled
for writing a single sample each time a data value must be saved. The
sync parameter tag should be connected to the Index of one of the
buffers. Each time OpenWorkbench polls the device, it will check to see
if the index has changed, and if so it will store the new data and time
stamp values. Data lists are not dependent on the polling rate of
OpenWorkbench for acquiring signals because they can store multiple
data points in between polls.
Details:
Each data list construct must include parameter tags using the tag root
with the following prefixes and suffixes:
t
prefix for the time stamp parameter
s
prefix for the sync parameter
d
prefix for the data tags that are stored
If several pieces of data need to be stored at the same time
(for example: saving several stimulus parameters such as
frequency, level, and duration) each one can be stored as a
different channel or they can be saved as secondary tags. A
suffix of a tilde and a number indicate multiple channels for
the data list.
321
OpenEx User's Guide
No handshaking is used with data lists because OpenWorkbench will
always need to look at the current buffer index to determine how much
data needs to be stored.
In this example the intensity and frequency of a time stimulus are changed in rapid fashion on
each stimulus sweep. The output signal is a gated tone to channel 1 of a System 3 device.
Stimulus Out Construct
[1:14,0]
[1:15,0]
Tone
ToneLev
ToneFreq
Amp=1
Shft=0
Freq=1000
Phse=0
Rst=Run
LinGate
StEnable
Trf=10
Ctrl=Closed
cO
Ch=1
[1:16,0]
The gated signal out is created using the Tone and LinGate components.
Tone frequency and level are controlled by a list of variables (see following diagram).
The gate opens when the StEnable line is set high (see the Basic Stimulation control construct).
List of Levels and Frequencies
[1:9,0]
SerSource
Reset
StimGo
LevTable
=0
StimGo
FreqTable
=0
322
The Reset line is generated from the trigger
construct and resets the list after each block is
recorded.
[1:12,0]
SerSource
Reset
ToneLev
Size=1000
Rst=0
IdxEnab=1
Index=0
{>Data}
Size=1000
Rst=0
IdxEnab=1
Index=0
{>Data}
Levels and frequencies are loaded into memory
buffers from data tables. A SourceFile component
or parameter tag would also work.
ToneFreq
The StimGo line is generated from the TTLDelay2
component of the stimulus timing construct. This
produces a single pulse to move the memory
buffer to the next list before the next tone.
The ToneFreq and ToneLev lines go to the Tone
component and the scalar list Stores.
Non-Macro Circuit Construct Reference
The oxList data construct in this example consists of a time
stamp value and sFreq list. Note that as with a continuous
waveform construct, only one s variable is required.
The time stamp and all channel values will have the same
sequence position in each of the buffers.
Tag_Root=Freq
Data_Form=Float
Channels=0
TimeStamp
Store
[1:6,0]
SerStore
iTime
Reset
StimGo
The data Store contains the variable information for the list. In
addition, secondary tags can be added that are stored with these
values (See Secondary tags, page 69).
37.45
0.651
...
oxList
tFreq
Data Store
of Freq
ToneFreq
Reset
The secondary tag has a different Tag_root from the primary
Stores.
StimGo
dFreq
Secondary Tag
For Level ToneLev
Reset
StimGo
dLev
Size=1000
Rst=0
WrEnab=1
Index=0
{>Data}
[1:11,0]
SerStore
Size=1000
Rst=0
WrEnab=1
Index=0
{>Data}
[1:13,0]
SerStore
Size=1000
Rst=0
WrEnab=1
Index=0
{>Data}
Type 4: Signal Snippets
Also see Signal Snippets with Spike Sorting, page 325.
About the oxSnippet Component…
oxSnippet
Tag_Root=
Blk_Size=32
Data_Form=Float
Sort_Code=No
Dec_Factor=1
Channels=0
Tag_Root identifies the base parameter name. Parameter tags in the
circuit that use the base parameter name will be associated with the
oxSnippet component.
Blk_Size indicates the block size of the snippet acquired. The value
set here needs to match the width of the snippet as defined by the
spike detection component (or processor type), such as SortSpike,
SortSpike2, SortSpike3, or FindSpike.
Data_Form is the format of the data. Most snippet data is in floating
point format, making use of the full resolution of the system.
However, other data types can be in integer, short, or byte. This value
must be configured correctly for the data type or tank values will be
incorrect.
Sort_Code is a flag that determines whether or not a sort code should
be stored with spike data. This parameter should be set to Yes when
using a spike acquisition component which generates a sort code for
each snippet stored, such as SortSpike, SortSpike2, and SortSpike3. It
should be set to No when using components that do not generate a
sort code, such as FindSpike and Tetrode. Specifying Yes when no
sort code is generated will result in erroneous data being stored as the
SortCode. Specifying No when a sort code is generated will result in
the sort code data not being stored. Form more information on spike
sorting see Signal Snippets with Spike Sorting, page 325.
Dec_Factor is the decimation factor when data is stored at a lower
rate than the devices sampling rate.
323
sFr
OpenEx User's Guide
In most cases snippet data will not require decimation and this will be
set to 1.
Channels is the number of channels of snippets being
stored.
Uses:
Each compiled circuit file assigned to a device, in OpenWorkbench, that
will be used to acquire snippet data must include this construct.
Description:
The signal snippet stores a waveform and its associated time stamp in to
the data tank. The value is read from a buffer that stores the waveform(s)
and the associated time stamp each time OpenWorkbench is polled.
When used with multiple channels, data acquired at different rates and
times (asynchronously) can be stored.
Details:
Each signal snippet must include parameter tags using the tag root with
the following prefixes and suffixes:
s
prefix for the sync parameter
d
prefix for the data tags that are stored
This tag may also include a suffix with a tilde and a number
if there are multiple acquisition channels.
For example, dPD~1, dPD~2, sPD~1, and sPD~2 would be
used for two channels of associated data using the tag root
PD.
Before the circuit is stored as a compiled circuit file the
number of channels is checked by comparing the tilde values
to the oxSnippet buffer value.
The example below shows two channels of snippet data from a FindSpike. FindSpike acquires
candidate spikes using a threshold level that is compared to the RMS of the background signal.
Candidate spikes are time stamped (timeline below) and stored to a buffer. Because each channel
will have different spike patterns, a separate sample position parameter with the s tag prefix is
required for each channel. Separate data parameters with the d tag prefix are also required. No
time parameter tag is needed since the data structure contains the time stamp.
324
Non-Macro Circuit Construct Reference
oxSnippet
Tag_Root=FA
Blk_Size=32
Data_Form=Float
Sort_Code=No
Dec_Factor=1
Channels=2
Chan1
Thres1
Reset
iTime
Chan2
Thres2
Reset
iTime
[1:9,0]
[1:11,0]
FindSpike
SerStore
nWidth=32
Tau=1000
ThrLo=3
ThrHi=1000
Rst=0
Tag
RMS^2=0
Strobe=0
{>Data}
Reset
dFA~1
Size=640000
Rst=0
WrEnab=1
Index=0
{>Data}
[1:13,0]
[1:15,0]
FindSpike
SerStore
nWidth=32
Tau=1000
ThrLo=3
ThrHi=1000
Rst=0
Tag
RMS^2=0
Strobe=0
{>Data}
Reset
dFA~2
Size=640000
Rst=0
WrEnab=1
Index=0
{>Data}
sFA~1
sFA~2
Type 4: Signal Snippets with Spike Sorting
See Type 4: Signal Snippets, page 323 for information about the oxSnippet component.
Spike sorting components generate a sort code for events that pass through a window
discriminator and a voltage range at a set time.
Uses:
Used with Sort Spike Control to store waveforms that differ in
shape based on the voltage of the signal at a set point in time.
Description:
Used as part of a signal snippet data construct. Stores a spike
event and sort code for each snippet. Data can then be exported
with the sort code and the time stamp.
Details:
Each spike sorting construct must include parameter tags using
the tag root with the following prefixes:
a
prefix for the lower voltage threshold
b
prefix for the upper threshold
c
prefix loads the SortSpike coefficients to the
component. The coefficients are generated in
OpenController and contain the time and voltage
range for each hoop (time-amplitude window
discriminator) added in the Snippet Sort control.
325
OpenEx User's Guide
SortSpike Variation
The SortSpike component must have the following organization:
oxSnippet
Tag_Root=EA
Blk_Size=32
Data_Form=Float
Sort_Code=Yes
Dec_Factor=1
Channels=1
Chan1
aEA~1
bEA~1
Reset
iTime
[1:8,0]
[1:10,0]
SortSpike
SerStore
nWid/2=16
ThrLo=0.0002
ThrHi=10
Enab/Rst=1
Tag
Strobe=0
SortBits=0
{>Coef}
{>Data}
Reset
dEA~1
Size=32000
Rst=0
WrEnab=1
Index=0
{>Data}
sEA~1
cEA~1
SortSpike2 Variation
This construct can also use a SortSpike2 component in place of SortSpike. SportSpike2 works
similarly but specifies only a lower voltage threshold value and allows for spike detection outside
of a range [-threshold, +threshold]. In this construct the prefix a, is used for the parameter tag that
controls the threshold. The threshold parameter is also affected by the Use Sign parameter. If Use
Sign is set to one any sign entered with the Thresh value is disregarded and the value is considered
to be a +/- number. If set to zero, Thresh value sign is considered. This construct can be further
modified for use with a SortSpike3 component. Users should be aware of the limitations of
SortSpike3 when using it within the OpenEx environment.
Note: there is no b prefix parameter tag with this construct.
oxSnippet
Tag_Root=EA
Blk_Size=32
Data_Form=Float
Sort_Code=Yes
Dec_Factor=1
Channels=1
Chan1
aEA~1
Reset
iTime
cEA~1
[1:8,0]
[1:10,0]
SortSpike2
SerStore
nWid/4=8
Thresh=1
UseSign=1
Enab/Rst=1
Tag
Strobe=0
SortBits=0
{>Coef}
{>Data}
Reset
See also Choosing a Spike Component, page 71.
326
dEA~1
Size=32000
Rst=0
WrEnab=1
Index=0
{>Data}
sEA~1
Non-Macro Circuit Construct Reference
Type 5: Continuous Waveform
oxStream
...
About the oxStream Component ...
Tag_Root identifies the base name of the construct. All parameter
tags in the circuit that use the base name will be associated with the
oxStream component.
Tag_Root=
Blk_Size=32
Data_Form=Float
Dec_Factor=1
Channels=0
Imp_MC=No
Blk_Size indicates the block size (data is acquired by the DSP in
small packets, or blocks) of the stream acquired and specifies the size
of each scroll section. Block size is arbitrary but the block should be
small enough for easy download to the tank and large enough to
minimize the cycle usage associated with continuously streaming
small chunks of data to disk. Too large a block size will also make a
scroll plot look choppy.
Important Notes:
Blk_Size cannot be more than 265 if the stream is being used in
Controller for spike thresholding. The size of the buffer storing the
signals needs to be an even multiple of Blk_Size.
Data_Form is the format of the data and depends on the resolution of
the stored data. This value must be configured correctly for the data
type or tank values will be incorrect.
If the data is being stored in 16-bit resolution (usually when passed
through the PlotDec16 or CompTo 16 components) then the data
form is short. If the data is being stored in 8-bit resolution (usually
when passed through the CompTo8 component) then the data form is
Byte. If the data is in 32-bit integer format, the data form is Integer.
Dec_Factor is the decimation factor when the streaming data is being
decimated. When decimation is not required, the value should be set
to 1.
If a PlotDec16 component is being used for decimation, then the
Dec_Factor will be half of nDec on the PlotDec16. If a CompTo16 is
being used, then the Dec_Factor should be set to 1.
Channels is the number of channels of snippets being recorded.
Uses:
Each compiled circuit file assigned to a device, in OpenWorkbench, that
will be used to acquire continuous data must include this construct.
Description:
Data streams are continuously acquired and stored waveforms that do not
require a unique time stamp. Because the event is streamed and all values
are stored, TTank can keep account of the precise time when each
streamed event was stored.
Typical streamed events include slow wave brain recordings, decimated
multi-channel extracellular recordings, and any event that requires a chart
recording of all or most of the data.
Details:
Each data buffer must include parameter tags using the tag root with the
following prefixes and suffixes:
s
prefix for the sync parameter
Only one parameter tag with the s prefix is required because
all streams are acquired at the same time and are the same
327
OpenEx User's Guide
size and position.
d
prefix for the data tags that are stored
This tag may also include a suffix with a tilde and a number
if there are multiple acquisition channels. For example,
dPD~1 and dPD~2 would be used for two channels of data
associated with the data stream using the tag root PD. Before
the circuit is stored as an compiled circuit file, the number of
channels is checked by comparing the tilde values to the
oxStream buffer value.
oxStream
...
Tag_Root=PD
Blk_Size=256
Data_Form=Short
Dec_Factor=16
Channels=2
Imp_MC=No
Chan1
Enable
[1:12,0]
[1:14,0]
PlotDec16
SerStore
nDec=32
SF=32767
Enab=1
Strobe=0
Reset
dPD~1
Chan2
Enable
Size=64000
Rst=0
WrEnab=1
Index=0
{>Data}
[1:16,0]
[1:18,0]
PlotDec16
SerStore
nDec=32
SF=32767
Enab=1
Strobe=0
Reset
dPD~2
sPD
Size=64000
Rst=0
WrEnab=1
Index=0
{>Data}
In this example, 2 channels of data stream are associated with the oxStream component through
the use of the tag root PD. The tag root is set in the oxStream component and could be changed to
any value.
The Chan1 and Chan2 lines are data from an acquired signal. The Enable line from the zTrigB
starts the plot decimation component (PlotDec16).
The PlotDec16 finds the maximum and minimum value from a set of 32 points and then stores the
data as two 16-bit integers in a 32-bit word for later decompression. Every 32 samples a strobe
signal is sent to the SerStore component to store the data. (Note that the size parameter of the
SerStore components should always be an even multiple of the block size defined in the OxStream
component.) While the protocol is running, OpenWorkbench polls the Store to see if the block size
has increased by 256 points. Once it has, the data is stored as 512 floating point values.
Note that the there is only one sPD since both Stores will download the same number of points.
Secondary Tag Constructs
Several constructs exist for implementing secondary tags in OpenEx without the aid of macros.
See Secondary Tags, page 69 for more information about secondary tags.
328
Non-Macro Circuit Construct Reference
Secondary tag constructs can be used to implement secondary tags when using non-macro data
storage.
The secondary tag construct is implemented by first selecting a data construct component for the
primary store. Additional secondary Stores can be made into secondary tags, which do not require
circuit headers and only need constructs for saving the data.
There are three common constructs used with secondary tags:
A Latch component can be used for asynchronous scalar values.
A MultiLatch component can be used for multiple asynchronous scalar values.
A SerStore component can be used for lists and data buffers.
Latch
Uses:
Each compiled circuit file that will be used to acquire asynchronous
scalar values from a single secondary tag must include a latch construct.
Description:
This construct provides a way to store one secondary tag value latched to
data tags in the primary triggered scalar construct.
Details:
The latch component stores a value when a trigger pulse is sent high then
low. Each trigger event will store a new value. The latch is not reset once
read (that is, set to zero).
Using a Latch to store a scalar value as a secondary tag:
oxScalar
37.45
Tag_Root=Tick
Handshake=None
Channels=0
[1:1,0]
PulseTrain2
nPer=24414
nPulse=-1
Enab=Yes
Rst=Run
PLate=0
PCount=0
[1:5,0]
1HzTick
iTime
1HzTick
Latch
tTick
Trg=0
dTick
[1:7,0]
Gain
1HzTick
Latch
dGain
Trg=0
In the above circuit, two scalar values are stored – Tick and Gain. Tick is the primary Store, so it
includes an oxScalar circuit header and tags for the data (dTick) and time stamp (tTick). Gain is
the secondary Store. It only requires a latched value for the data.
The data is called dGain here for consistency, but any name could be used. Notice that the data
values for both Stores are latched at the same time (by the 1HzTick pulse) – this is essential for
secondary tags to work correctly.
To store Gain, no circuit header is required and no time stamp tag is required. Simply add dGain
as a secondary tag of Tick in the OpenWorkbench Stores settings. Then the gain will be stored and
it will automatically use the time stamps of Tick.
329
OpenEx User's Guide
MultiLatch
Uses:
Each compiled circuit file that will be used to acquire asynchronous
scalar values from multiple secondary tags must include latch or
multilatch construct(s).
Description:
This construct provides a way to store secondary tag values latched to
data tags in the primary triggered scalar construct.
Details:
The MultiLatch component stores parameter values from the PC until
triggered. An input line is used to trigger the MultLatch component.
When triggered it sends the new values to output lines.
This ensures that signal parameters are updated after the stimulus has
been presented. The latch also updates the data parameter tags. When the
software polls the variables it will detect the updated values and store
them.
Using a MultiLatch to store multiple scalar values as secondary tags:
More than one secondary tag can be latched to a triggered scalar data construct by adding multiple
Latch components with tags for saving the data of the additional scalar values. The number of
components can be reduced by using a MultLatch component to latch three values at once:
[1:1,0]
oxScalar
Tag_Root=Tick
Handshake=None
Channels=0
37.45
PulseTrain2
1HzTick
nPer=24414
nPulse=-1
Enab=Yes
Rst=Run
PLate=0
PCount=0
[1:8,0]
iTime
1HzTick
Latch
tTick
Trg=0
dTick
[1:9,0]
Gain
MultLatch
dGain
Delay
In1=0
In2=0
In3=0
dDelay
Frequency
Trg=0
>
>
>
dFrequency
1HzTick
In this circuit, Tick is the primary Store and three secondary tags are stored – dGain, dDelay, and
dFrequency.
All of the values are latched at the same time as Tick, so they can all share the same time stamp
values. Each of the three must be added as secondary tags of Tick in the OpenWorkbench Stores
settings.
330
Non-Macro Circuit Construct Reference
Serial Store
Uses:
Each compiled circuit file that will be used to acquire list or buffered data
from secondary tags must include a serial store construct.
Description:
A serial store can store buffered data. When used for a secondary tag two
or more buffers can be acquired using the same time stamps.
Using a SerStore to store a data list as a secondary tag:
Storing a data list as a secondary tag involves the same basic process as storing scalar values as
secondary tags.
First, the primary Store must be created, the secondary Store is then created by making only the
data portion of the Store with no time stamps or circuit header. Finally, the secondary tag is added
to the OpenWorkbench Stores settings of the primary Store. The difference with data lists is that
the data is a memory buffer rather than a single scalar value.
[1:3,0]
SerStore
iTime
Reset
Sw Fire
oxList
Size=1000
Rst=0
WrEnab=1
Index=0
{>Data}
sSweep
37.45
0.651
...
Tag_Root=Sweep
Data_Form=Integer
Channels=0
tSweep
Reset
[1:4,0]
[1:5,0]
SimpCount
SerStore
Rst=0
Enable=1
Reset
Sw Fire
Sw Fire
Size=1000
Rst=0
WrEnab=1
Index=0
{>Data}
[1:7,0]
Frequency
Reset
Sw Fire
SerStore
dSweep
Size=1000
Rst=0
WrEnab=1
Index=0
{>Data}
dFreq
In this circuit, Sweep is the primary Store. It includes an oxList circuit header and buffers
(SerStore) for storing its data (dSweep) and time stamps (tSweep). The sync parameter (sSweep)
is also necessary for the data list. Freq is the secondary Store. It only requires a buffer for the data.
The data is called dFreq here for consistency, but any name could be used. No circuit header, time
stamps, or sync tag are required for the secondary Store.
The essential part is that the values of Freq are stored at exactly the same time as the values of
Sweep. All of the SerStores have the SwFire hop connected to their write-enable port. So every
time a sweep fires, each buffer will store a single value. Simply add dFreq as a secondary tag of
Sweep in the OpenWorkbench Stores settings.
331
OpenEx User's Guide
Instantaneous Rate Construct
About Instantaneous Spike Rates
[1:8,0]
InstRate
SortCode=0
UseFall=1
SortMatch=0
FcFact=0.2
FcMin=3
FcReturn=0
FcFeed=0
The InstRate component is particularly useful for OpenEx users acquiring
extracellular spike data.
The InstRate continuously measures the spike activity from an electrode
channel or group of sorted spikes. The spike rate is calculated by integrating the
spike activity over time. A low pass filter is used to integrate the spike rate and
also acts to interpolate the spike rate between spike events. For a more complete
description of the InstRate component see the RPvdsEx help.
When to Use the Instantaneous Rate
The InstRate allows end users to visualize changes in spike activity in response to stimuli and may
be the primary information saved to the data tank or disk. InstRate can also be used anytime a realtime measure of the spike activity is required, such as when the spike rate is used to control
external devices, gauge the quality of a signal, or examine spike activity in real-time.
How to Store/View the Data
Instantaneous rate data can be stored in one of two formats, either as a list value that occurs at
discrete epochs in the acquisition system or as a continuous decimated stream. Either data format
can be viewed in real-time through OpenController using an appropriate visualization tool.
InstRate Construct
Spk1
iRate
[1:4,0]
[1:6,0]
InstRate
Biquad
SortCode=0
UseFall=1
SortMatch=0
FcFact=0.2
FcMin=3
FcReturn=0
FcFeed=0
[1:8,0]
ButCoef
Gain=1
Fc=1000
NBiq=2
Type=LP
Enab=Yes
FireRate
nBIQ=2
{>Coef}
{>Delay}
The minimum components necessary to use the InstRate include the InstRate, the ButCoef, and
the Biquad. The ButCoef, Butterworth Coefficient generator, controls the lowpass filter frequency
while the Biquad uses the coefficients to generate the digital filter. The circuit construct below
shows a more typical construct which includes a SerStore to store the spike rate to the data tank.
332
iRate
Non-Macro Circuit Construct Reference
iRate~1
[1:7,0]
SFire~1
SCode~1
iRate~1
[1:11,0]
InstRate
SortCode=0
UseFall=1
SortMatch=0
FcFact=0.1
FcMin=3
FcReturn=0
FcFeed=0
Biquad
[1:9,0]
ButCoef
Gain=1
Fc=1000
NBiq=2
Type=LP
Enab=Yes
iRate~1
nBIQ=2
{>Coef}
{>Delay}
[1:13,0]
SerStore
Reset
DecTick256
Size=1000
Rst=0
WrEnab=1
Index=0
{>Data}
sRate
dRate~1
The primary input to the InstRate is the strobe out from the spike component (Sfire~ HopIn). This
example also includes sort code input to the SortCode parameter from the SortBits output of the
spike component (Scode~). The sort code to match can be set in the InstRate SortMatch
parameter. A parameter tag (FcFact) has been included to allow the user to set the maximum rate
of change of the filter from OpenController.
The primary output is fed through the filter that is constantly updated using a loop from the
InstRate's FcFeed to the FcReturn. The FcFeed is fed to the ButCoef corner frequency setting to
update the corner frequency of the filter. The output from the filter is saved to a Store and is also
fed back into the FcReturn. The FcReturn value us used to calculate a new value for the FcFeed.
Notice that the SerStore stores the new rate once every X number of sample ticks. In general the
InstRate will not exceed a rate of, at most, 250 events per second. This means that recording the
spike rate continuously would be inefficient. A decimation rate of between 128 and 256 is
recommended, depending on the maximum firing rate of the neurons.
333
OpenEx User's Guide
OpenController Constructs
Biquad Filtering
When necessary, filters can also be implemented without macros. A biquad filtering circuit
construct is required for each biquad filter that will be implemented through OpenController.
[1:2,0]
Biquad
FilterCoef
nBIQ=1
{>Coef}
{>Delay}
FilterDelay
In this example:
The FilterCoef parameter tag is used by OpenController to load the coefficient values for that
filter setting to the Biquad.
The FIlterDelay parameter tag is used to reset the Biquad delay lines. If the delay lines are not
zeroed it is possible for the filters to crash.
These parameter tag names are suggested names. The parameter tags must be defined as the Coef
Target and Delay Line Target in a control's property settings.
SigGen Control
The following circuit construct must be added to the RPvdsEx circuit to allow users to load and
control SigGen generated stimulus through OpenController's SigGen Engine Control.
In most cases the SigGen file will be used with a sweep based stimulus protocol. The information
below assumes that the circuit construct is part of a circuit that includes a sweep or condition
construct and that the construct is controlled by an OpenWorkbench protocol that uses sweep
settings. It is possible to use SigGen circuits in other circuits and OpenWorkbench protocols,
however, the circuit control must be designed by the end user.
SigGen Signals are generated on the PC and then loaded to and played from the SerSource
component.
[1:2,0]
sgRamNpts1
Sw ep
stEnable
sgWave1
SerSource
Size=1e+006
Rst=0
IdxEnab=1
Index=0
{>Data}
cO
Ch=1
[1:3,0]
sgPlayIndex
sgRamNpts1 parameter tag determines the size of the buffer.
sgWave1 parameter tag loads the SigGen file to the SerSource component.
Sweep resets the buffer before the start of the next stimulus. (This should be changed to condition
if condition control settings are used rather than sweep control settings in the OpenWorkbench
protocol.)
SwEnable plays out the signal from a sweep based protocol. (This should be changed to CoEnable
if condition control settings are used rather than sweep control settings in the OpenWorkbench
protocol.)
334
Appendix B – Tips, Tricks, and
Technical Information
In the Tips, Tricks, and Technical Information section you will find:
Quick access to topics of special interest to OpenEx users. If you are looking for shortcuts and tips
for working in the OpenEx environment, you'll find our Tips, Tricks, and Technical Information
area to be a useful resource.
335
OpenEx User's Guide
~
336
Tips, Tricks, and Technical Information
Connecting the Hardware
The OpenEx Software Suite may be used with any of the System 3 real-time processors. Some of
the most common hardware configurations are described below.
See the installation guide supplied with your system for more information on connecting your
hardware.
Connecting a Multi-Channel Pentusa System with Multiple Medusa Preamplifiers
The diagram below shows a typical 32 channel system with a single Pentusa base station, two
preamplifiers, and Gigabit interface.
RX5 Pentusa Base Station
Status
Amp-a
Amp-b
Amp-c
Amp-d
BITS
Mode
XLink
Mulit-DSP
Processor
Digital I/O
Multi I/O
0
4
1
5
2
6
3
7
DAC-1
MEDUSA PREAMP
Connect to Headstage
MEDUSA PREAMP
PI5
Zbus for
System 3
M1234
Idle uM u1 u2 u3 u4 All
Cyc .
0 0 0 0 0 0%
Connect to Headstage
PI5 Mounted in PC
Back of ZBUS Device Caddies
FI5 GIGABIT INTERFACE
GB-IN
PS20 POWER SUPPLY
GB-OUT
Power Cords
337
OpenEx User's Guide
Connecting a Medusa System with a Single Medusa Base Station
The diagram below shows a typical Medusa Amplifier and Gigabit interface system for less than
16 channels.
RA16 MEDUSA BASE STATION
Link
Zbus for
System 3
TRIG
Digital I/O
Amplifier
PI5
MEDUSA PREAMP
Connect to Headstage
PI5 Mounted in PC
Back of ZBUS Device Caddies
FI5 GIGABIT INTERFACE
GB-IN
PS20 POWER SUPPLY
GB-OUT
Power Cords
Notes:
PI5/FI5 Gigabit interface: provides communication between the PC and the zBUS as well as
between zBUSs.
ZB1PS zBUS: provides communication and power for modules mounted in the device caddie.
RA16 Medusa/ RX5 Pentusa Base Stations: provide onboard processing and a fiber optic link to
preamplifiers and headstages. Multiple Base Stations are linked for higher channel count
acquisition.
338
Tips, Tricks, and Technical Information
Tips for Working in OpenEx
OpenWorkbench Idle Mode
Use caution when switching to OpenWorkbench's Idle mode. In Idle mode many values set from
OpenController are cleared from the hardware. Use Standby mode, rather than Idle, to pause an
experiment.
Compiled Circuit File Sampling Rates
Compiled circuit files are interchangeable among devices, but keep in mind that not all devices
will run all sampling rates. For example, a high frequency auditory stimulus file designed for play
back on an RP2 may not be suitable for playback on an RA16BA which has a maximum D/A
sampling rate of 48 kHz.
Tips for Modifying Circuits
Because the RPvdsEx system is complex, simple acts can cause circuits to fail. Included below are
several tips to help users avoid common mistakes that might occur when modifying RPvdsEx
circuits for use with OpenEx.
One of the most common problems that users encounter is exceeding the maximum cycle
usage. The problem can easily go unnoticed because the cycle usage displayed in
RPvdsEx and OpenEx will wrap around if it exceeds 100%, for example, if a large circuit
appears to be running a only 10% cycle usage, it has probably wrapped around and is
really using 110%. See the RPvdsEx help for information on reducing cycle usage.
Always recompile the circuit after making changes. The circuit is automatically
recompiled on saving when using the .rcx format.
The common problems below can be avoided by using macros wherever possible within the
circuit. Using macros in your circuit design automatically handles required constructs, reserved
OpenEx parameter tags, parameter tag naming conventions, component parameter dependencies
and OpenEx header settings.
When deleting parts of a circuit, be careful to avoid deleting control and timing
constructs or reserved OpenEx parameter tags. Deleting these components from the
circuit will cause OpenEx to be unable to control the circuit properly.
When using OxStream to read data from the hardware the Dec_Factor must be a multiple
of the Blk_Size, otherwise you'll read a partial block back. When this happens you'll see
data coming back as if all where fine but that data will be erroneous.
Always follow the OpenEx naming conventions for parameter tags. Be aware of reserved
tags and tag prefixes, especially when adding a data construct (Store). If the correct
reserved tags and prefixes are not used, then OpenEx might not be able to control the
circuit or store data correctly.
After changing a value related to a Store in the circuit (for example, changing the block
size of an OxStream), any OpenController controls that use the corresponding Store as a
target will not work properly. Double-click on each of these controls and re-select the
Store as the Data Target, and then they will work again.
339
OpenEx User's Guide
OpenEx Cheat Sheet
The cheat sheet provides a quick reference to some of the shortcuts and non-menu driven features
of the OpenEx applications. Click an application below to see the quick list for that application.
OpenController
Press and hold down the Shift key and drag the mouse up or down (or right or left) to
adjust the scale of a plot control.
Double-click a control to display its properties dialog box.
To display the properties dialog box for the Controller window, double-click the grid area
(Design mode). The dialog includes parameters for behaviors such as Auto Run and Lock
on Stop.
Right-click the scrolling threshold or snippet sort controls to display the auto sorting and
auto thresholding commands.
Snippet Sort Control:
Adjust the scale of the Snippet Sort plot (as described above) to show threshold markers
that are not positioned in the plot's visible area.
Hold down the control key and double-click in the center of the control to add a timevoltage window bar.
Point to the center of a time-voltage window bar then drag it into position.
Point to the end of a time-voltage window bar and drag to resize the bar as needed.
You can add multiple time-voltage windows. To remove a time-voltage bar, drag it off
the edge of the plot.
OpenScope
340
Press and hold down the Shift key and drag the mouse up or down (or right and left) to
adjust the scale of a plot.
Double-click a plot to display its properties dialog box.
Click a tank, block, and event in the Tank Navigator to select data for plots. Data must be
selected in the Tank Select window before you can create or animate a plot. Because
tracking always uses the current data, you can animate the plot in track mode without first
selecting the data.
Drag an event to the grid area to create a plot.
Add an event to the timeline by dragging it from the Events list to the Time Control
window.
Look for the Epoch icon to identify epoch events. Epochs are defined in
OpenWorkbench and used in OpenScope and OpenBrowser to organize and display data.
Epochs are stored events that are associated with a block's timeline.
Tips, Tricks, and Technical Information
Open Browser
Select a row before adding an Tref epoch. To add the epoch, right-click the next available
cell in the header row (row 4) and select an event from the available epoch events.
Using these shorthand characters to configure additional rows once the first row has been
configured in Data Selection Table:
^
Indicates that the value in the cell above will be used for this cell. For example,
placing a caret in a cell in the TANK column will cause the row to acquire data
from the tank named in the row above.
^+
Used with BLOCK, CHAN, and SORT cells. It will increment the BLOCK, CHAN,
or SORT number by one, relative to the cell above it.
>
Used with TIME, CHAN, SORT, and epoch cells. Channels that are greater than the
cell value are viewed and exported. For example, >3 selects channel or sort values
greater than 3.
<
Used with TIME, CHAN, SORT, and epoch cells. Values that are less than the cell
value are viewed and exported.
:
Used with TIME, CHAN, SORT, and epoch cells. Values within the named range
are viewed and exported. For example, if a cell in the CHAN column contained the
statement 3:10 then channels 3 through 10 would be viewed and exported.
OpenWorkbench
Click a device icon in the Device Navigator to display the device configuration in the
main window.
Clean Running Applications
If a user attempts to run OpenProject when an OpenWorkbench or OpenProject application is
already running a Clean Running Applications applet will be launched. This applet lists running
project applications and allows users to choose between terminating the applications or quitting
the project start up processes. Note: Applications other than OpenWorkbench that were not loaded
with OpenProject will not appear in the list.
341
OpenEx User's Guide
Terminate Listed Applications and Continue: terminates all applications listed
Quit: halts the project creation process, closes the Clean Running Applications window, and
allows the current OpenEx applications to continue running.
The applet is launched in the following four conditions:
OpenWorkbench is running and OpenProject attempts to run. Choose either to terminate
or quit.
OpenProject is running and a new OpenProject attempts to run. Choose either to
terminate or quit.
OpenProject or OpenWorkbench fail to close properly (such as when an application quits
unexpectedly) and a new OpenProject attempts to run. Choose to terminate.
Immediately after Installation of OpenEx. This occurs because the applications are being
registered and that process has not been completed. Choose to quit so that the registration
process can continue. The applications will exit on their own.
Note: The Clean Running Applications applet does not load if users attempt to run
OpenWorkbench while OpenProject or another OpenWorkbench file is running. OpenWorkbench
will not open and a message is displayed indicating that another instance of OpenWorkbench is
running.
342
Tips, Tricks, and Technical Information
Optimizing Performance for High
Data Transfer Rate Operation
When operating OpenEx at higher data rates (generally 16 channels or more) measures should be
taken to improve overall system performance and efficiency. The system is optimized via
modifications to the OpenEx project and its Stores and by terminating unnecessary applications
running on the host PC.
The following list of guidelines can be used to optimize system performance.
OpenEx:
1.
In OpenWorkbench, set the ‘Cache Delay’ preference to 6.0 seconds and ensure the
'Flush read when overload' preference is NOT enabled. To check or modify these
values, click File | Preferences in the OpenWorkbench window.
2.
Turn off all unnecessary scrolling plots within Workbench. To turn off individual, rightclick the plot and click Hide.
3.
Run each device or compiled circuit file in your OpenEx project at the lowest acceptable
overall sample clock rate. For example, if you’re collecting EEG type signals you should
set the device sample rate to no more that 6 kHz.
4.
Ensure a reasonable sample rate is being used for each Store in your project and use 16 or
even 8 bit data for Stores whenever possible.
5.
Remove any redundant data Stores. For example, if you are storing the full 25 kHz
bandwidth signals in your single unit collection project, there is no need to also store a
band-limited LFP version of these sample signals.
Operating System:
6.
Turn off unnecessary applications including:
a.
Background applications like anti-virus, firewall and spyware detection tools
b.
Services that run in the background even if you do not have the program open.
7.
Turn off any automatic update features.
8.
Avoid launching applications once data collection has started in OpenEx.
9.
Avoid doing other tasks on the collection computer while it’s running OpenEx (like
accessing the Internet).
10. If you have USB or the Wired Gigabit interface, consider upgrading to the Optical
Gigabit Interface.
If you need assistance with any of the above design guidelines, please contact TDT technical
support.
343
OpenEx User's Guide
Working with Long Blocks
In OpenEx, the data acquired during each recording session is typically labeled and stored to the
tank as a single OpenEx Block. Theoretically, there is no limit on the size of a single block or
tank; however, we recommend that neither exceeds a size of 2GB to ensure the best performance
possible. Lengthy recording session can be divided into several smaller blocks, depending on the
amount of data being acquired. Users who frequently run lengthy recording sessions, but do not
want to divide the data into several OpenEx Blocks, can still limit the amount of data being
acquired. One way to do this, when acquiring spike data, is to “pause” active event acquisition
without actually pausing the recording session.
The technique described here might be suitable for experiments in which there is a lengthy delay
between delivering a stimulus and some response of interest. It allows the user to record selected
periods of interest in a single block. This is especially helpful when each OpenEx block will be
individually processed offline. Reducing the number of blocks reduces time spent in demanding
offline processing.
Pausing Event Acquisition Without Closing the Block
The circuit segment below shows how the user can create such a pause using the threshold
(Thresh) parameter of a SortSpike2 component. This technique will also work with the threshold
(ThLo) parameter of a SortSpike component.
oxSnippet
Tag_Root=EA
Blk_Size=32
Data_Form=Float
Sort_Code=Yes
Dec_Factor=1
Channels=4
Chan1
[4:231,0]
[4:231,0]
ConstF
aEA~1
ScaleAdd
K=0
SF=1
Shft=0
trig
Enable
iTime
[4:231,0]
[4:231,0]
SortSpike2
SerStore
nWid/4=8
Thresh=1
UseSign=1
Enab/Rst=1
Tag
Strobe=0
SortBits=0
{>Coef}
{>Data}
Reset
dEA~1
Size=1000
Rst=0
WrEnab=1
Index=0
{>Data}
sEA~1
cEA~1
Usually the aEA~1 tag is linked directly to the threshold parameter. In this case, a ConstF and
ScaleAdd have been added between the aEA~1 tag and the parameter port. The ConstF is included
to convert the parameter tag output to a signal that can be used by the ScaleAdd. The addition of
the ScaleAdd provides a simple means of altering the signal value. When the scale factor (SF) is
set to 1, via the trig parameter, the threshold value passes through without being altered. However,
if the scale factor is set to 0 the threshold value will also become 0. When the threshold value on a
SortSpike 2 (Thres) or SortSpike (ThLo) becomes 0, no spikes are acquired. This creates the
desired pause effect without stopping the recording session.
The value of this trig tag (which controls the scale factor) can be set from
OpenController using a simple switch control. The switch, with an on value of 1 and an off value
of 0, can be used to pause and resume event acquisition within a single block.
344
Tips, Tricks, and Technical Information
FAQs
In this topic you'll find page references to areas of the help that will provide answers to some of
the most frequently asked questions about OpenEx. Some of these questions refer to advanced
topics and may require a bit of background reading so be sure to view any supporting information
regarding these topics.
How do I choose a Data Construct?
Choosing a Data Construct, page 66.
How do I choose a Spike Component?
Choosing a Spike Component, page 71.
How do I calculate the data transfer rate?
Calculating Data Transfer Rates, page 67.
How can I view the firing rate on an acquisition channel?
About Instantaneous Spike Rates, page 332.
What are epochs?
About Epoch Events, page 82.
345
OpenEx User's Guide
~
346
Known Anomalies
Note: The latest anomalies and tech notes are always available on the Web at
www.tdt.com/T2Support/FlashHelp/System3TechNotes.htm.
When operating OpenEx at higher data rates (generally 16 channels or more) measures should be
taken to improve overall system performance and efficiency. The system is optimized via
modifications to the OpenEx project and its Stores and by terminating unnecessary applications
running on the host PC.
The RZ2 does not support sample clock edge synchronization. In the OpenWorkbench
Preferences dialog box, the Synchronize sampling clocks check box is not checked when using
the RZ2.
Errors may be generated when attempting to filter blocks larger than 2GB. See tech note 0222 to
resolve this problem.
A partial install or partial uninstall of OpenEx may not be able to be uninstalled automatically. In
this situation, a manual uninstall may be necessary.
When a control circuit is not located in the project’s local RCOCircuits directory and the user has
to browse outside the local directory, a local copy is created within the project’s RCOCircuits
folder (this local copy behavior is controlled by a preference within OpenProject). In version 2.0,
the control circuit file path seems correct and a local copy is generated, however, the project is still
pointing to and using the original browsed version of the circuit. Therefore, changes made to the
local copy of the circuit have no effect.
A channel of streamed data might fail to be stored when acquiring data using OpenEx. The
probability of this occurring is very low. It has been observed only for continuous data and only
when using mirror devices. However, there is no guarantee that the problem is restricted to these
conditions. We recommend avoiding putting OpenWorkbench in Idle mode until the end of the
experiment. Instead, use Standby mode when acquisition must be stopped. (First noted in 1.57)
An error message, such as "unable to connect to specified device" might be generated when
OpenWorkbench attempts to reset multiprocessor devices (RX5, RX6, RX7, RX8). To avoid this
issue, change OpenWorkbench preferences so that hardware is not automatically reset on launch.
See Tech Note 0156 for more information. (First noted in 1.57)
Values in the OpenController Data Table are displayed with a precision of 1. However, the actual
value is retained. For example: a value of 0.0001 is displayed as 0.0, but 1.0001 will be passed to
the target.
OpenController crashes and an error appears stating, “MainCtrl caused an exception and has
been closed” when a percent sign is used in a graphic frame.
If the Windows Script Debugger has not been installed, loading any OpenController files that
include VBScript components causes the OpenController to crash. Install the latest version of
Windows Script Debugger. It can be downloaded from this URL:
http://www.microsoft.com/downloads/details.aspx?FamilyID=2f465be0-94fd-4569-b3c4dffdf19ccd99&displaylang=en
347
OpenEx User's Guide
Note that Windows XP and Windows 2000 do not come with the Windows Script Debugger
installed, so this will need to be installed when using OpenEx with VBScript. (First noted in 1.0.)
After adding a new control from the OpenController Controls menu, international users are
unable to modify the Value properties for a Slider, or any control that uses the Value property
sheet. To avoid this problem, international users should open the Regional Options in the
Windows Control Panel and change the following settings on the Numbers tab. Change the
Decimal Symbol to a period. Change the Digit Grouping Symbol to a comma. (Found in all
versions.)
On some systems, the Windows Installer launches erroneously, asking the user to insert the
Microsoft Office 2000 CD-ROM. The action must be canceled several times before normal
operation can continue. This problem has been seen when starting OpenWorkbench and when
setting the Server of a control in OpenController. (First noted in 1.1.)
Chart plots in OpenController and OpenScope can only be used with scalar or snippet data.
Using stream or buffer data may cause OpenController/OpenScope to crash or display data
improperly. (First noted in 1.1.)
If epoch events occur infrequently the event might be missed by OpenEx polling and, as a result,
the Store will not appear in the OpenScope or Open Browser timelines or events list. The data is
acquired and can be accessed by manually typing in the event name in Scope or Browser. For
more information see Tech Note 0116.
Offset Strobe epochs events that exist in the tank data, do not automatically appear in the
OpenScope timeline. You can add the event to the timeline manually by dragging it from the
Event list to the timeline. (First noted in 1.1.)
When using oxBuffers or oxSnippets with large block sizes (greater than 5000), some blocks do
not appear in OpenScope and OpenBrowser. However, data is stored in the tank and can be
exported. Smaller block sizes should be used whenever possible. (First noted in 1.0.)
Error message "Trouble saving data to tank" is displayed if no data has been saved to tank for an
extended period of time (approximately ten seconds). To avoid this problem a Pulse Train can be
used to generate a pulse to be stored once per second. (First noted in 1.0.)
You can only have 100 tanks registered in TankMon at one time. Removing a tank from the
monitor does not delete it, however in version 1.57 and below, tanks cannot be used when they are
not registered.
Users can not register or unregister tanks without administrator privileges.
When deleting blocks from a tank in OpenBrowser, the deletions are not saved.
‘Unable to open tank…Tank does not exist’ error message is displayed when attempting to open a
tank with a name 32 characters long or longer or a path name 100 characters long or longer.
When trying to delete a large block in OpenScope using the Tank Select window, a server busy
error will appear.
OpenEx 2.0 uses a new data tank structure that is not supported by Windows 2000 or earlier
operating systems. The new version allows users to manage tanks and individual block using
Windows Explorer.
If OpenWorkbench detects more than one Store by the same name a duplicate store error -“multiple stores have the same name” -- is reported and OpenWorkbench will not run until the
duplicate store's name has been changed or the duplicate store has been disabled. See tech note #
0271.
348
Known Anomalies
Resolved Anomalies
Version 1.57
After WindowsXP Service Pack 2 or Windows Server 2003 Service Pack 1 is installed,
OpenContoller can no longer access OpenWorkbench. New security settings, included in these
service packs, affect the performance of client/server applications. See Tech Note 0134 (Windows
Service Pack 2) or Tech Note 0175 (Windows Server 2003 Service Pack 1) for step-by-step
instructions for using this service pack with OpenEx. Fixed in version 2.0
Error message “Cannot add tank. No error to report.” or “Cannot delete tank. No error to report.”
is displayed when attempting to add or delete tanks from OpenWorkbench if the user does not
have administrator privileges. Functionality changed in version 2.0
Version 1.5 and 1.52
The Threshold Scaling Factor in OpenController's Scrolling Threshold Control may
spontaneously reset to 0. This occurs whenever settings in the Behavior parameter group are
modified, or even viewed, in the Setup Parameters dialog box. Avoid opening the Behavior
parameter group. Most behavior parameters that users will need to modify can be modified in the
Common parameter group. Fixed in version 1.54.
The signal in OpenController's Snippet Sort Controls might disappear unexpectedly. The green
threshold marker will be set to the 0 position. Attempting to move the marker will cause it to
disappear. This occurs because the Y-Axis Units Factor has reset to 0. This can occur
spontaneously whenever the Y-Axis Setup parameter groups is modified, or even viewed, in the
Setup Parameters dialog box. Avoid opening the Y-Axis Setup parameter group in the Snippet
Sort Control. Parameters in other parameter groups can be modified without problems. Fixed in
version 1.54.
Version 1.1
Recording to multiple tanks at the same time causes Tank Server errors. The protocol appears to
run without data loss initially but Tank Server errors are generated repeatedly after the protocol is
stopped. Fixed in version 1.5.
In OpenScope, the XY plot does not display the first plotted point. Fixed in version 1.5.
OpenWorkbench will always use the sample rate defined in the compiled circuit file (.rco), even if
the "Use sample rate from RCO file." box on the Devices property sheet is cleared. Each time you
need to run a circuit at a different sample rate, change the sample rate in the circuit file (.rpd) then
recompile the RPvdsEx file (.rco). Fixed in version 1.5.
Currently only one SigGen Engine control can be used in each instance of OpenController. A
second one cannot be added even if the existing control is deleted. If a SigGen Engine control is
deleted, restart OpenController before attempting to add a new SigGen Engine control. Restarting
should allow you to add a single SigGen Engine control. The limitation of one SigGen Engine
control per Controller remains but the anomaly associated with adding and deleting the
controls has been fixed in version 1.5.
If a tank name contains spaces, or if the directory path to a tank contains spaces, then the tank may
be named improperly, appear in a different location, or fail to function correctly. Fixed in version
1.5.
349
OpenEx User's Guide
Version 1.0
Error message “Cannot Close there are active COM clients. Must close all instances of Open
Controller” is displayed when closing OpenWorkbench. In this version OpenWorkbench
launches applications correctly, but can not close all Controllers, so the user must close
Controllers manually before closing OpenWorkbench. Fixed in version 1.5.
In OpenScope, Invalid property value error 380 appears when starting OpenScope if the font size
(DPI Setting) is set too large in Windows Display properties. Setting the display font size (DPI
setting) to small fixes the problem. Fixed in version 1.1
OpenBrowser is unable to export all events if the time between two successive events is too great.
Until this issue is resolved make sure that events occur at regular intervals. Fixed in version 1.5.
350
Troubleshooting
Below is a listing of general issues you may encounter in OpenEx. If you encounter an error that is
not described below, contact tech support at [email protected] or consult the online tech notes
database at: http://www.tdt.com/support.htm.
Access to path and application was denied
Occurs when attempting to run an OpenEx project using the Windows XP or Windows 2000
operating system without administrator privileges.
OpenEx modifies the registry on your Local Machine (that is, the PC on which you run the
application). Windows requires that users have administrator level privileges to modify the Local
Machine registry.
Multiple stores have the same name
Occurs whenever OpenWorkbench detects more than one Store with the same name.
Make sure all store names are unique either by renaming the circuit components in RPvdsEx or by
disabling the duplicate store in OpenWorkbench.
Note that duplicate buddy epocs are harder to detect since the default setting in OpenWorkbench
does not show buddy Epocs. To disable a buddy Epoc Store, select Show All Fields from the
Storage Specification dialog box. This will display all stores and allow all stores to be disabled.
Set the Mode of the Store to Disable.
RZ device fails to run a circuit in OpenWorkbench
Occurs when the Synchronize sampling clocks check box is checked when using the RZ2 or RZ5.
The RZ devices do not support sample clock synchronization, a project will fail to run if this
option is selected in OpenWorkbench. Uncheck the Synchronize sampling clocks check box in
the OpenWorkbench Preferences dialog box to run the circuit.
Tank or zTime errors are generated when switching between Preview
and Record mode in OpenEx.
When OpenEx changes from Preview mode to Record mode or visa-versa the circuit is not halted.
During this switch it is possible that some components might not be reset to the proper state (i.e.
timing components or store related components such as a buffer write enable). This will cause
Tank or zTime errors.
Switch to Idle Mode before switching from Preview to Record mode.
351
OpenEx User's Guide
Memory allocation failure
Occurs when attempting to set the number of channels or buffer size of a storage component to a
value larger than the size of available memory on the DSP. Verify that your circuit operates within
the limits of your device. Devices contain different amounts of memory and processing power so
individual applications will vary. Reduce the number of channels and/or buffer size to be
processed.
Occurs when attempting to run a circuit that contains components assigned to a DSP that does not
exist (i.e. DSP 5 on a 2 DSP RX device). Verify that your RPvdsEx circuit has not assigned
components to a DSP (assigned pages or DSP assign components) that does not exist.
352
Glossary
Glossary
A
asynchronous: describes buffers or events (typically, across multiple recording channels) that are
NOT coordinated in time.
B
block: 1. In OpenEx, a group of data labeled and stored in the tank for the purpose of analysis.
Typically, a block contains one recording session and may contain many sweeps. There may be
one or more blocks in each data tank. Blocks are named (automatically or by the user) and can be
selected for display or export. 2. A specified number of data points handled as a group for
downloading from, or uploading to, a device. Breaking data into chunks for data transfer increases
the efficiency of the system. The block size is defined in OpenEx header components such as
oxSnippet and oxStream.
C
circuit: a configuration of processing components. Each component does a set task, such as
generate a waveform, store in memory, or send a signal to the DAC outs. Circuits are designed
using RPvdsEx software and are run on System 3 Real-Time Processors.
client: the requesting program or user in a client/server relationship. For Example, OpenScope is a
client application that requests data from the TTank data server in the OpenEx client application.
compiled circuit file: RP control object, or compiled circuit, designed for use with OpenEx or
other TDT applications. The System 3 real-time processing modules are controlled using these
files, which are compiled from circuits designed using TDT's RP visual design studio (RPvdsEx).
Users can generate their own compiled circuit files for use with OpenEx or select one of the
standard compiled circuit files provided by TDT.
construct: a group of components (in a circuit) that perform a defined task in OpenEx. For
example: a triggered scalar construct stores single data values for later analysis. Most circuit
constructs have a minimum or required component structure and secondary or alternate component
structures.
continuous decimated data: signals that are acquired and filtered, then decimated and stored to a
buffer.
D
353
OpenEx User's Guide
Data types: 1. In OpenEx, standardized construct formats in which data is stored, such as snippet,
buffer, list, stream, and scalar. 2. A description of data such as: float (32-bit floating-point value),
integer (32-bit integer value), short (16-bit integer value), byte(8-bit integer value).
decimated data: data that has been reduced further than the sampling rate of the device for data
storage. May refer to continuous decimated or plot decimated data. Data is decimated to reduce
the amount of data stored to disk or being transferred from the hardware to the PC and in cases
where very low sample rates are necessary.
device: a named group of OpenWorkbench settings which define which System 3 hardware (such
as RP2, RL2, RA16, RXn, RZ, or RV8) or attenuators (PA5) are controlled from OpenWorkbench
and what compiled circuit files will be used to control the specified hardware. Also: the hardware
component specified in the Device settings.
E
epoch: an event (or sections of a tank block) that are associated with the tank's timeline. Epoch
events can be scalar variables including triggered scalars, data lists, and their associated secondary
tags. Epoch events can be used by other OpenEx applications such as OpenScope and
OpenBrowser to sort and display tank data.
event: data that is stored in the data tank, such as a scalar value, snippet waveform, or continuous
waveform. Note: not all significant occurrences (e.g. spikes) are events. In OpenEx an event refers
only to stored data.
H
hand shaking: an optional protocol where a flag (sync tag) is set to signify that data is ready for
downloading and OpenWorkbench resets the flag after the data has been downloaded. Often used
with oxBuffer stores.
I
Idle: an OpenWorkbench protocol mode in which devices are not loaded and are not running. All
values are cleared from the hardware including values set in OpenController.
index: 1. The logical number of a hardware device. The zBUSmon application shows the logical
number of all programmable devices in the workstation. Multiple devices of the same type, such
as two RP2s, must have different index values. Devices of different types can have the same index
value. 2. A number assigned to an RPvdsEx component within a circuit that indicates its position
in the processing chain that is the order in which components will be executed.
M
master polling rate: the rate at which OpenWorkbench polls devices for new data. A high polling
rate means that data is read more rapidly. However, a high polling rate decreases system
efficiency.
P
parameter tag: a specialized helper component within a circuit that allows users to modify
parameter values through OpenEx or other software control. By utilizing these tags, users can
control the experiment in real-time.
plot decimated data: a form of decimation where only the maximum and minimum values are
stored for each chunk of data (e.g. 64 samples). Data in this format allows users to visualize the
maximum noise floor and spike activity of an incoming signal; however, it is nota true
354
Glossary
representation of the acquired signal. It is used to get an approximation for real-time plotting
without requiring the transfer of a large amount of data.
Preview: an OpenWorkbench protocol mode in which data is saved to a temporary block in the
tank. This mode allows the user to view data in OpenController or OpenScope without
permanently storing data.
protocol: the method used to present stimuli and/or acquire data.
R
Record: an OpenWorkbench protocol mode in which devices are loaded and running and data is
saved to the tank.
RPvdsEx file: a file that contains an uncompiled circuit, designed in a visual drag-and-drop
environment.
S
scalar: a single value, or series of values, that may be stored as data. May also be used to refer to
the Triggered Scalar (oxScalar) data construct.
secondary tag: a parameter tag that has been defined as such on an OpenWorkbench Store. By
configuring a parameter tag as a secondary tag, data read from the tag can be saved using the
construct and time stamp association with an existing Store. Using secondary tags simplifies
circuit design by eliminating some components.
server: a program that awaits and fulfills requests from client programs in the same or other
computers. An application may function as a client with requests for services from other programs
and also as a server of requests from other programs. For example: TTank is a server that responds
to requests for data storage and retrieval. May also refer to the computer where a server program is
located.
Standby: an OpenWorkbench protocol in which devices are loaded and running but signals aren’t
being acquired and saved to disk. This mode allows the user to modify parameter values through
OpenController.
Store: a named group of OpenWorkbench settings that pull together all the information needed to
store data. Each store is associated with a data construct within the compiled circuit file running
on the Store's Host Device. Also, the data construct used by the Store, or the data stored by the
Store.
Sync: a tag that tells OpenEx when data is ready to be downloaded. May be connected to a
FlipFlop for handshaking stores or an index value that indicates the position of the buffer and tells
OpenEx how many points are to be downloaded to the tank or if any points at all require
downloading. The parameter tag associated with a Sync is identified by an s prefix.
synchronous: describes buffers or events that are coordinated in time, typically across multiple
recording channels.
T
tank: a group of data stored by OpenEx's TTank data server or the files used to store the group of
data.
target: Points to the location of data being read or the location to which a value will be read. This
location might be an OpenWorkbench Store, a parameter tag within a compiled circuit file running
on a device, or another control setting.
time stamp: the precise time of an event that is recorded to the tank. The precision of the time
stamp depends upon the sample clock. Parameter tags associated with a time stamp are identified
355
OpenEx User's Guide
by a t prefix. Typically, the time values will be latched periodically when data needs to be stored.
Streaming data (continuous) does not require time stamping. Time stamps should not be confused
with the RPvdsEx component "TimeStamp" which is used by the RV8.
356
Glossary
~
357
Index
continuous waveform .......................... 327
7
control............................................ 65, 304
7 segment display....................................131
latch..................................................... 329
creating ................................................131
list ........................................................ 321
overview ...............................................131
multilatch ............................................. 330
naming conventions ............................ 301
A
nesting - basic ..................................... 312
acquisition control ....................................110
Advance Setup dialog box.................98, 100
nesting with end tracking..................... 313
other timing.......................................... 315
overview ........................................ 63, 301
Arbitrary sample rates ...............................98
serial store........................................... 331
SigGen control..................................... 334
B
signal snippets............................. 323, 325
biquad coefficient generator ....................175
stimulation ........................................... 315
sweep - basic ...................................... 306
creating ................................................176
sweep with end checking .................... 307
overview ...............................................175
trigger .................................................. 304
C
trigger- secondary ............................... 305
changing file names.............................52, 57
cleaning the project................................... 57
circuit constructs ................................63, 301
condition loop.......................................... 109
acquisition ............................................314
configuring export ................................... 278
asynchronous next condition ...............311
asynchronous next sweep ...................308
asynchronous scalar ............................317
biquad filtering................................75, 334
constructs.......................................... 63, 301
controls - OpenContorller........................ 115
buffer ....................................................318
modifiers.............................................. 116
clock generator.....................................305
visualization tools ................................ 115
condition...............................................309
condition control with end checking .....310
359
OpenEx User's Guide
using with OpenScope ........................ 224
D
data export...............................................267
errors......................................................... 86
export configuration .............................278
exporting data ......................................... 278
exporting ..............................................278
configuring........................................... 278
overview ...............................................267
exporting.............................................. 278
previewing data ....................................275
OpenBrowser overview ....................... 267
selecting data ...............................270, 271
previewing data ................................... 275
data generating constructs ........................80
selecting data .............................. 270, 271
F
choosing a data construct ......................66
overview .................................................80
file names.................................................. 52
type 1
asynchronous scalar data .....66, 67, 80,
317
frames ..................................................... 178
creating................................................ 179
type 2
data buffer ......................66, 67, 80, 318
type 3
data list ...........................66, 67, 80, 321
overview .............................................. 178
G
guages .................................................... 128
type 4
signal snippets......... 66, 67, 71, 80, 323
signal snippets with spike sorting 66, 67,
71, 80, 325
type 5
I
importing applications ............................... 56
initializing tags......................................... 100
continuous waveform .....66, 67, 80, 327
input box ................................................. 143
data tables
creating................................................ 143
creating ................................................163
formulas ...............................................165
overview .............................................. 143
K
delays ......................................................106
knobs ...................................................... 148
Device Navigator .......................................84
creating................................................ 149
Devices
configuring..................................84, 94, 98
E
epochs .......................................................82
overview .................................................82
selecting in OpenBrowser ....................271
360
overview .............................................. 148
L
launch settings .......................................... 54
led caption............................................... 133
creating................................................ 134
overview .............................................. 133
Index
modifiers.............................................. 116
led indicator .............................................133
overview .............................................. 115
creating ................................................133
Run! mode........................................... 125
overview ...............................................133
targets ................................. 116, 123, 182
visualization tools ................................ 115
linear guages ...........................................128
workspace ........................................... 119
creating ................................................129
overview ...............................................128
OpenEx - overview
linking controls .........................................182
The Client Server Environment ............... 7
example................................................183
OpenProject .............................................. 49
overview ...............................................182
creating............................................ 51, 54
importing appliactions ........................... 56
logarithmic gauge ....................................128
overview ................................................ 49
creating ................................................130
working with data tanks......................... 55
overview ...............................................128
OpenScope ............................................. 221
M
dialog boxes ........................................ 228
master mode control................................162
overview .............................................. 221
creating ................................................162
workspace ........................................... 226
overview .......................................118, 162
OpenWorkbench ....................................... 79
master parameters...........................116, 123
overview ................................................ 79
messages window .....................................86
server ...................................................... 7
workspace ............................................. 79
N
P
naming conventions - tags.......................301
period ...................................................... 108
numeric display........................................131
plots - OpenScope .................................. 221
O
activity ................................................. 253
OpenBrowser...........................................267
exporting data ......................................278
overview ...............................................267
workspace ............................................267
OpenController ........................................115
adding.................................................. 221
chart .................................................... 251
feature ................................................. 248
histograms........................................... 241
modifying ............................................. 222
pile....................................................... 235
raster ................................................... 244
Design mode ........................................120
scroll .................................................... 238
dialog boxes .........................................121
selecting data ...................................... 235
361
OpenEx User's Guide
XY ........................................................247
choosing a spike component................. 71
circuit ................................................... 325
plots and graphs - OpenController ..........135
creating snippet sort control ................ 153
using snippet sort control .................... 156
creating a feature plot ..........................141
creating a scrolling plot ........................140
status indicators ...................................... 133
creating chart plots...............................139
creating pile plots .................................136
stimulus control ....................................... 110
creating scope plots .............................138
overview ...............................................135
polling rate ...............................................105
storage specification table ................ 96, 101
Stores
configuring............................................. 96
R
RCO Files ......................................84, 94, 98
removing files.............................................59
sweep loop.............................................. 108
switch button ........................................... 144
creating................................................ 145
S
overview .............................................. 144
sampling rate .............................................98
switches .................................................. 144
scripting in OpenController
system controls - OpenWorkbench........... 84
creating a VB script control ..................167
debugging ............................................174
running .................................................174
system controls -OpenScope.................. 227
T
writing...................................................169
tag initialization ....................................... 100
secondary tags ........................................101
Tank Monitor ........................................... 293
SigGen Engine control.............................179
Tanks ........................................................ 83
creating ................................................180
overview ...............................................179
formats .................................................. 83
registering.............................................. 83
slide switch ..............................................144
creating ................................................147
selecting ........................................ 83, 103
selecting in OpenScope ...................... 227
overview ...............................................144
tanks in OpenProject ................................ 55
sliders ......................................................148
targets ..................................................... 116
creating ................................................148
initialization.......................................... 100
overview ...............................................148
linking controls............................. 182, 183
spike sorting
362
selecting .............................................. 123
Index
Time Control Window ..............................229
value watch ............................................. 131
timing ...............................................106, 110
creating................................................ 132
overview .............................................. 131
Triggered Scalar ........................................80
VBScript control
triggering..........................................106, 108
creating................................................ 167
Ttank server.................................................7
debugging scripts ................................ 174
running scripts ..................................... 174
U
writing scripts....................................... 169
under one second design ..........................66
W
V
Workbench Plotting................................... 86
value inputs..............................................143
363